BNP PARIBAS Advancing Towards 2020 Ambition - Fixed Income Presentation May 2019

Page created by Todd Wells
 
CONTINUE READING
BNP PARIBAS Advancing Towards 2020 Ambition - Fixed Income Presentation May 2019
BNP PARIBAS
Advancing Towards 2020 Ambition

  Fixed Income Presentation
  May 2019
BNP PARIBAS Advancing Towards 2020 Ambition - Fixed Income Presentation May 2019
Disclaimer
The figures included in this presentation are unaudited.
On 29 March 2019, BNP Paribas issued a restatement of its quarterly results for 2018 reflecting, in particular (i) the internal transfer in the 3rd quarter
2018 of Correspondent Banking activities within CIB from Corporate Banking business to Securities Services and (ii) the transfer, effective 1st
October 2018, of First Hawaiian Bank (FHB) from the BancWest business to the Corporate Centre following the sale of 43.6% of FHB in 2018 (the
remaining stake was sold on 25 January 2019). These changes do not affect Group results as a whole but only the analytical breakdown of IFS
(BancWest), CIB (Corporate Banking, Securities Services), and Corporate Centre. The 2018 quarterly result series have been restated reflecting
these effects as if they had occurred on 1st January 2018. This presentation is based on the restated 2018 quarterly series.
This presentation includes forward-looking statements based on current beliefs and expectations about future events. Forward-looking statements
include financial projections and estimates and their underlying assumptions, statements regarding plans, objectives and expectations with respect to
future events, operations, products and services, and statements regarding future performance and synergies. Forward-looking statements are not
guarantees of future performance and are subject to inherent risks, uncertainties and assumptions about BNP Paribas and its subsidiaries and
investments, developments of BNP Paribas and its subsidiaries, banking industry trends, future capital expenditures and acquisitions, changes in
economic conditions globally or in BNP Paribas’ principal local markets, the competitive market and regulatory factors. Those events are uncertain;
their outcome may differ from current expectations which may in turn significantly affect expected results. Actual results may differ materially from
those projected or implied in these forward looking statements. Any forward-looking statement contained in this presentation speaks as of the date of
this presentation. BNP Paribas undertakes no obligation to publicly revise or update any forward-looking statements in light of new information or
future events. It should be recalled in this regard that the Supervisory Review and Evaluation Process is carried out each year by the European
Central Bank, which can modify each year its capital adequacy ratio requirements for BNP Paribas.
The information contained in this presentation as it relates to parties other than BNP Paribas or derived from external sources has not been
independently verified and no representation or warranty expressed or implied is made as to, and no reliance should be placed on the fairness,
accuracy, completeness or correctness of, the information or opinions contained herein. None of BNP Paribas or its representatives shall have any
liability whatsoever in negligence or otherwise for any loss however arising from any use of this presentation or its contents or otherwise arising in
connection with this presentation or any other information or material discussed.
The sum of values contained in the tables and analyses may differ slightly from the total reported due to rounding.

                                                                                                              Fixed Income Presentation – May 2019            2
BNP PARIBAS Advancing Towards 2020 Ambition - Fixed Income Presentation May 2019
Advancing Towards 2020 Ambition

Strong Solvency and Funding

1Q19 Detailed Results

Appendix

                                  Fixed Income Presentation – May 2019   3
BNP PARIBAS Advancing Towards 2020 Ambition - Fixed Income Presentation May 2019
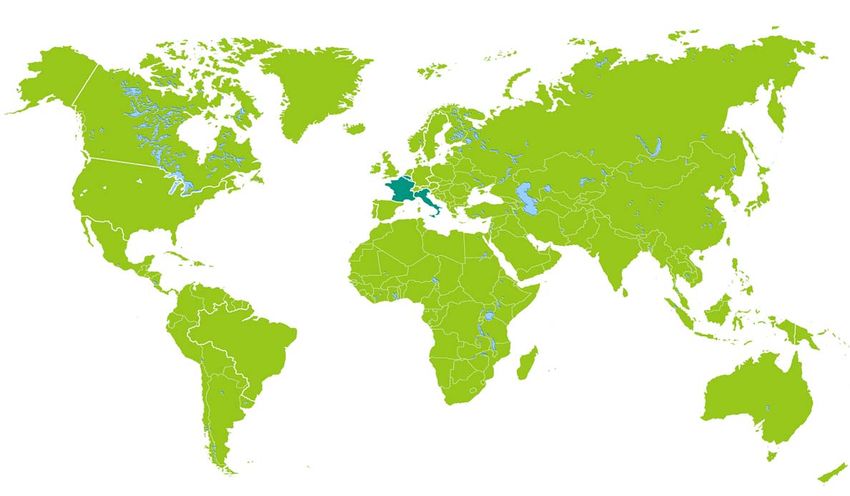
Strong European Group with International Reach
 202,000 employees in 72 countries
                                                                              BELGIUM
                                                                                      LUXEMBOURG

                                                                             FRANCE

                                                                                         ITALY

                            EUROPE

                            155,000
                                                                                        FRANCE

                                     MIDDLE EAST
                                                                                        58,300
                                                                                        ITALY
  AMERICAS
                                     500                                                19,000
  18,000                                           ASIA PACIFIC
                                                                                         LUXEMBOURG
                                                                                         3,600
                           AFRICA
                                                   18,700                               BELGIUM
                           10,000                                                       14,500

                       76% of staff in Europe
                 o/w 47% in the 4 Domestic Markets
                                                                  Fixed Income Presentation – May 2019   4
Organisation of the Operating Divisions
                    1Q19 Revenues of the Operating Divisions

       Corporate &                                          Domestic Markets
 Institutional Banking:                                    FRENCH RETAIL BANKING
                                                           BNL BANCA COMMERCIALE
           27%                                             BELGIAN RETAIL BANKING
                                               DM          LUXEMBOURG RETAIL BANKING
                                                           BNP PARIBAS PERSONAL INVESTORS
         CIB                                   35%         ARVAL
        CORPORATE BANKING                                 BNP PARIBAS LEASING SOLUTIONS
        GLOBAL MARKETS                                    NICKEL
        SECURITIES SERVICES             IFS
                                         38%
      International Financial Services                      Retail Banking
     PERSONAL FINANCE                                       & Services:
     EUROPE – MEDITERRANEAN
     BANCWEST
                                                                 73%
     BNP PARIBAS CARDIF
     WEALTH MANAGEMENT
     BNP PARIBAS ASSET MANAGEMENT
     BNP PARIBAS REAL ESTATE

                       Straightforward business structure
                      with ~3/4 of retail and service activities
                                                                  Fixed Income Presentation – May 2019   5
A Business Model Well Diversified by Country and Business
     2018 Gross Commitments* by region                                                    2018 Allocated equity by business
     >90% in wealthy markets                                                              No single business line > 16%
                                                                                                  Securities Services: 1%
       32%                                                                                                                                  FRB: 13%
                                                                          CIB: 28%       Corporate
                                                                                         Banking: 16%
                                                                                                                                                     BNL bc: 7%

               19%
                                                                                     Global Markets:                                                    BRB: 8%
                       14%                                                                      11%
                              13%
                                       10%                                                                                                            Other DM: 6%
                                                                                            WAM: 3%
                                                6%                                                                                                  Europe-Med: 6%
                                                         4%
                                                                 2%                        Insurance: 11%

                Other Belgium North
                                                                                                                                       BancWest: 8%
      France                           Italy
                                                Asia    Rest of
                                                                 Turkey                               Personal Finance: 10%
               Europe  & Lux America           Pacific the world
                                                                                                                                                        Retail Banking &
                                                                                                                                                         Services: 72%

 A balanced business model: a clear competitive advantage in terms of revenues
  and risk diversification
 An integrated business model fuelled by cooperation between Group businesses
 Strong resilience in changing environments

                     No country, business or industry concentration
                                                                                            *   Total gross commitments, on and off balance sheet, unweighted of €1,530 bn as at 31.12.18

                                                                                                                    Fixed Income Presentation – May 2019                            6
Diversification Leading to Recurrent Income Generation

  Net Income Group Share (2008-2018)                                 2018 Net income Group Share (€ mln)

                                                                     7.8 7.5                                                        12.2                              €bn
 €bn

             7.8                                   7.7   7.8   7.5
                                             6.7                                   5.3
                   6.1   6.6
       5.8                            6.1*                                                 4.7
                               5.6*                                                                4.4                                                       4.2
                                                                                                           3.9
3.0
                                                                                                                                             1.6                      1.8
                               4.8    0.2
                                                                                                                    0.3
2008 2009 2010 2011 2012 2013 2014 2015 2016 2017 2018
                                                                     SAN BNPP BBVA ING CASA SG                      DB             HSBC BARC                 UBS      CS

 Recurrent earnings generation through the cycle
            Strong proven capacity to withstand local crisis and external shocks
            Leading Eurozone bank in terms of profit generation

                                                                               *   Adjusted for costs and provisions related to the comprehensive settlement with US authorities

                                                                                                        Fixed Income Presentation – May 2019                               7
A Superior Quality Risk Profile Confirmed by Stress tests
    2018 European stress test: maximum impact                                                                                Impact of the adverse scenario on
    of the adverse scenario on the CET1 ratio*                                                                               credit risk
   bp                                                                                                                     Adverse scenario vs. base scenario as a %
                                                                                                                          (cumulated cost of risk over 3 years)

                                                                                                                                                           Europe
   -210 -228
               -288
                      -334 -363
                                  -381 -395                                                                                                x3.08
                                              -437 -445
                                                          -537 -576                                                                                                     x1.94
                                                                            -693

                                                                                                                                   Average of 48                        BNPP
                                                                                                                                      banks
 Lower impact for BNPP of the adverse scenario:  A more limited potential rise in provisions:
  -107 bp compared to the average of 48 European       Impact on the cost of risk of the adverse scenario
  banks tested                                          vs. base scenario 37% below the average in Europe
 Supervisory Review and Evaluation Process                                                                              Effect in particular of the selectivity at origination &
  (SREP): Pillar 2 requirement for 2019 unchanged                                                                         of the pro active policy to improve credit risk, e.g.:
                                                                                                                           Reduction of the exposure on SMEs in Italy
                                                                                                                             in 2013-2016
                                                                                                                           Personal Finance: increase from 20% in 2016 to
                                                                                                                             35% in 2018 of car loans in the credit mix (better
                                                                                                                             risks) & decrease of revolving credits
                                                                                                                         A cautious policy designed to favour the quality
                                                                                                                          of long-term risks vs. short-term revenues
                                                          *   Based on the fully loaded CET1 ratio as at 31.12.2017. For Santander, BBVA, HSBC and Barclays, the CET1 lowest level is not reached in year 3 (maximum impact in bps)

                                                                                                                                                     Fixed Income Presentation – May 2019                                     8
An ambitious policy of engagement in our society
    with concrete impacts

Strong decisions for a       Stop financing shale gas / oil, oil from tar sands and gas / oil in the Arctic
low carbon economy
  & against tobacco          Stop financing the tobacco sector

 A leader in projects        World’s Best Bank for sustainable finance (Euromoney Awards for Excellence)
with a positive impact       Ranked number 3 for all green bonds

  Support for social         €1.6bn in financing at the end of 2018
  entrepreneurship           Act for Impact: training relationship managers to cover social entrepreneurship in France

  2020 ambition
Be a major contributor       Contribution to the 17 Sustainable Development Goals (SDGs) defined by the United Nations
   to the UN SDGs            €185bn (vs €166bn in 2018) in financing for energy transition & sectors contributing to SDGs

  Have a major role in       Speed up the Energy Transition program to help clients implement new energy models
the transition toward a
 low carbon economy          Green company for employees (promote green means of transportation…)

 Develop a positive          Train senior bankers on operations with a positive impact
  impact culture             Develop tools to measure the positive impact of actions undertaken

                                                                                           Fixed Income Presentation – May 2019   9
Successful Digital Transformation
 New Customer Experiences
      ► Domestic Markets: > 8m digital clients (retail banking)
         More day-to-day autonomy for clients: increase in usual transactions via apps
           (e.g. > 75% of changes of card payment limits at FRB done through selfcare)
DM       Sharp rise in the number of contacts via mobile app in the networks*
           (66m visits in December 2018: +28% vs. December 2017)
      ►   France’s leading bank in terms of mobile functionalities (D-rating ranking)

      ► 0.9m customers in digital banks (BGZ Optima and Cepteteb)

      ► Quick development of digital in Personal Finance
IFS
         e-signature of 50% of new contracts, > 25 million monthly electronic
            account statements (>72% of statements)
         Fully digital application process for consumer loans already rolled out in 7 countries

       ► A digital platform for corporates deployed in 45 countries                 Centric
         providing access to 31 applications                                     Number of clients
                                                                                 (end of period)                          9,981
                                                                                                                 8,475
                                                                                                         6,250
CIB    ► > 9,900 clients as at 31.12.18
                                                                                                 4,000
                                                                                         2,250
       ► 1,500 new clients on-boarded onto Centric since end 2017                 500

                                                                                 2013 2014 2015 2016 2017 2018
                                                                                                                 * FRB,   BNL bc and BRB

                                                                       Fixed Income Presentation – May 2019                        10
Successful Digital Transformation
     Innovative Technologies & Artificial Intelligence

               ► Swift development of robotics: >500 robots already operational in the Group
                     DM: 280 robots operational at year-end 2018 (e.g. automated KYC* process
                      handling 80% of the collection of the necessary documents)
 Innovative
technologies         IFS: >130 robots already operational (controls, reporting, data processing)
                      and 17 chatbots deployed in the businesses (virtual assistants)
                     CIB: good development with notably 70 robots already operational
                      in Securities Services at year-end 2018

               ► Robo-advisory: leveraging the acquisition of Gambit in wealth management
                 and in asset management
                     Roll-out of Birdee, a digital investment advisory & management
  ArtificiaI          solution for individuals
Intelligence         New robo-advisory solutions to support retail & wealth management
                      networks’ advisors
               ► Natural Language Generation: 90 reports on funds generated every month in
                 asset management thanks to artificial intelligence

                                                                                                        *   Know Your Customer

                                                                           Fixed Income Presentation – May 2019          11
Successful Digital Transformation
New Usage Trends & Launch Innovative Products

  ► LyfPay: added-value mobile payment solution to serve
    client relationship
    Launched in May 2017, already 1.6 M downloads of the App
    Developed with Crédit Mutuel* and with leading retail groups
       such as Carrefour & Auchan                                                  App downloads
                                                                                          1.3 million
    To be launched in Belgium
    Aiming to become the European reference for added-value
       mobile payment solutions
                                                                                May ‘17    Dec ‘18

  ► Arval for me
    First online platform for individuals allowing them to service their
      cars through the auto repair garages under contract with Arval
    Operational in Italy and Spain: already 12,000 clients
    To be gradually extended to other countries

                                                                                                          * CM11-CIC

                                                                       Fixed Income Presentation – May 2019    12
Successful Digital Transformation
New Account & Payment Services - Focus on Nickel
► Nickel: strong pace of development
    > 1.2 million accounts opened in less than 5 years
     1,200,000
                                                                            Very successful development in
     1,000,000                                                               its segment in France

      800,000
                                                                            Offer tailored for clients requiring
                                                                             basic account & payment services
      600,000                                                                (€20 / year)

      400,000
                                                                            Targeting 2 million accounts
                                                                             opened in 2020
      200,000
                                                                            Towards 10,000 points of sale
            0                                                                (“Buralistes”) by 2020
                                                                             (vs. 4,300 at end 2018)

  ► Nickel Chrome : a successful start of the new premium card
          Already 60,000 cards sold in 8 months (May - December 2018)
          Very competitively priced (€30 / year)

                    Insurances & assistance comparable to a Gold card
                    No additional costs abroad
                    Personalised (wide range of colours,…)

                                                                         Fixed Income Presentation – May 2019   13
€600M Additional Recurring Cost Savings by 2020
                                                                                             2020

 €600m additional cost savings vs. the initial plan                                      IFS
        €350m in CIB                                                                     20%
                                                                                                    CIB
        €150m in DM                                                                   DM           55%
                                                                                       25%
        €120m in IFS

                        ► Strict external hiring discipline - Foster internal mobility
Human resources
                        ► Significantly reduce external assistance / contractors

                        ► Further streamlining of the IT organisation
         IT             ► Selective use of the public cloud to reduce operating costs
                                 Evolving progressively towards hybrid Cloud

                        ► Optimisation of real estate footprint
                                 Stepping-up of flex offices
   Real estate                   Near shoring initiatives
                                 Proactively manage real estate portfolio (e.g. sell Paris centre buildings; buy in periphery)

                        ► Reinforcement of the industrialisation of the functions
Control functions                Increased use of artificial intelligence (compliance, risks…)
                                 Streamlining of the set-up in connection with international mutualized competence centres

                                                                                                Fixed Income Presentation – May 2019   14
1.   Implement new customer journeys
                                                                                5 levers for a new
                                                                                                              2.   Upgrade the operational model
                                                                               customer experience
                                                                                                              3.   Adapt information systems

  2020 Transformation Plan
                                                                                & a more effective
                                                                                                              4.   Make better use of data to serve clients
                                                                                 and digital bank
                                                                                                              5.   Work differently

                                                                                               Cumulated recurring cost savings
 An ambitious programme of new customer experiences, digital
  transformation & savings                                                                  €bn                                             3.3
        Build the bank of the future by accelerating the digital transformation
                                                                                                                             1.8
                                                                                                               1.1
                                                                                                     0.5
                                                                                                                             1.3
 Cost savings: €1.3bn since the launch of the project
        Of which €169m booked in 1Q19                                                           2017         2018           2019         2020
        Breakdown of cost savings by operating division: 38% at CIB;                                       Realised          Targets
         34% at Domestic Markets; 28% at IFS
        Reminder: target of €1.8bn in savings this year
                                                                                               One-off transformation costs

                                                                                            €bn
 Transformation costs: €168m in 1Q19
        €0.7bn in transformation costs expected in 2019                                                               1.1
                                                                                                      0.9                                0.7
        Reminder: €2.7bn in transformation costs in the 2020 plan
                                                                                                                                         0.2
                                                                                                     2017            2018               2019
                                                                                                            Realised          Targets

             Implementation of the plan in line with the objectives

                                                                                               Fixed Income Presentation – May 2019                       15
Domestic Markets 2020: in Line With Objectives
 2020 Action Plan and Ambitions Confirmed
  Strengthen the sales & marketing drive and grow revenues
 Continue digital transformation to enhance customer experience,
  offer new services, acquire new customers
     A better segmented and more customised commercial approach
     Simplified and digitalised end-to-end customer journeys
 Leverage on leading positions (private banking, corporates)
 Continue to grow the specialised businesses in growing markets
  (Arval, Leasing Solutions, Personal Investors & Nickel)               2020 Trajectory

                                                                        Confirmation of the 2020 trajectory
   Improve operating efficiency
 Intensify cost reduction measures (> €0.15bn in additional savings    Revenue trend slightly above initial
                                                                         expectations
  vs. initial plan) and generate a positive jaws effect
                                                                        Significant improvement of the
 Continue adapting the branch network and support the growth of
                                                                         operating efficiency (decrease in the
  the specialised businesses                                             cost income ratio in the networks and
 Create omni-channel customer service centres and roll out              ~stability in the specialised businesses)
  end-to-end digitalised processes                                      RONE* target confirmed
 Streamline the organisation of the businesses (simplification,
  standardisation) and adapt the information systems

   Continue the rigorous risk management policy
 Continue to improve the risk profile of BNL bc: target of a cost
  of risk at 50 bp in 2020 confirmed
 Low interest rate environment still favourable for cost of risk
                                                                                                * Pre-tax return on notional equity

                                                                           Fixed Income Presentation – May 2019               16
Domestic Markets
Costs’ Reduction in the Retail Networks
                                                                     ► Continuing branch network optimisation
         Retail networks’ operating
         costs*                                                                 289 branches closed since 31.12.2016
                                                                                                         938           -118
       €m
                                                                                                                 785
                                                                                                                          667
                       -0.4%**                                                                                                          Branch network
             2,504               2,500                                                                                                     evolution
                                                                                                                                         since launch
                                                                                              -106                                       of 2020 plan
                                                                              2,200
                                                                                      1,964
                                                                                              1,858      2012     2016 31.03.19

                                                                                                                            890            -65
                                                                                                                                     787
                                                                                                                                             722
                                                                              2012    2016 31.03.19

              1Q18               1Q19                                                                                       2012     2016 31.03.19

► Actively deploying digital transformation
  and new operational models
     Further cost reduction planned in the networks
      driven by the ongoing implementation of the                    ► Simplification and adaptation of the branch
      2020 plan                                                        network management
     BNP Paribas Fortis’ announcement this quarter                             Implemented in the 3 networks
      of the closure of 267 branches by 2021

                Ongoing cost reduction in the networks
        Digital transformation & branch network optimisation
                                                   * FRB, BNL bc and BRB, including 100% of Private Banking; ** Excluding IFRIC 21 (-0.2% including the impact of IFRIC 21)

                                                                                                      Fixed Income Presentation – May 2019                           17
IFS: 2020 Trajectory in Line with the Plan despite
   an Unfavourable Foreign Exchange Effect

           Pursue the growth of the businesses
 Consolidate leading positions in the business units by
  leveraging best in class offers                                       2020 trajectory*
 Continue digital transformation: new client experiences,
  end-to-end digitalisation of processes and optimisation of data to    Revenue growth in line with the plan
  further improve the offering                                            On the back of good business drive and the
 Continue the selective development of retail banking outside             acquisitions made
  the Eurozone and strengthen intra-Group cooperations                    Despite the negative impact of the foreign
                                                                           exchange effect (USD and TRY)
 Execute the integration of acquisitions made
                                                                        Significant improvement in the cost/income
                Improve operating efficiency                             ratio but less than expected given the negative
                                                                         impact of the foreign exchange effect and of
                   (positive jaws effect)                                costs related to development initiatives
 Industrialise & pool the processes in all the businesses               (positive jaws effect expected starting in
                                                                         2019)
 Streamline the product offering (Asset Management, Insurance)
                                                                        Increase of the RONE** to a level close to the
 Implement digital initiatives specific to each of the businesses
                                                                         target
  (distribution and client acquisition, management of product life
  cycles, new full digital products, etc.)
 Intensify cost reduction measures (> €0.12bn in additional
  savings vs. initial plan)

               Continued sustained growth in revenues and income
                                                                                              * Excluding FHB; ** Pre-tax return on notional equity

                                                                                    Fixed Income Presentation – May 2019                      18
Corporate and Institutional Banking
  Active Implementation of the Plan
      Good development of targeted client bases

► Gain of over 215 new corporate group clients in Europe since 2016 (of which 90 in 2018) in particular in targeted
  countries (Germany, UK, Netherlands and Scandinavia)
► Onboarding of more than 60 new groups in the US and 50 in Asia
► #1 in Corporate Banking, Cash Management and Trade Finance for European large corporates*

      Decrease in costs
                                                                                                                                                        CIB operating expenses
► Decrease in costs for the 3rd year in a row (-3.5% vs. 2015)                                                                                                          -3.5%                in €m

     Reminder: CIB transformation plan launched in early 2016                                                                                       8,458      8,309      8,273        8,163
     €715m in savings achieved in 3 years (of which €463m since the end of 2016)
   Rise in compliance costs, in banking taxes and in the contribution to the resolution fund
► Ramping up of mutualised platforms (Portugal, Canada, India) & end-to-end processes                                                                2015        2016          2017     2018

      Containment of allocated resources
                                                                                                                                                        CIB allocated capital
► 2019 objective to reduce RWA (-€20bn) achieved one year ahead of schedule:                                                                        Average allocated amount in €bn
                                                                                                                                                         22.2           21.1
     -€20.5bn in RWA realised in 3 years, of which -€5.5bn in 2018 (sales of loans,                                                                                                  20.8
      securitisations, etc.)
     Selective reinvestment in business development plans and impact of the
      tightening of the prudential calculation rules
                                                                                                                                                         2016         2017            2018

                                      * Source: Greenwich European Large Corporate Corporate Banking and Cash management (1Q2019) and Global Large Corporate trade Finance (4Q18) in market penetration

                                                                                                                               Fixed Income Presentation – May 2019                                  19
Corporate and Institutional Banking
      A three-pronged action plan to intensify transformation

               Particularly unfavourable environment in 2018
                and decrease in profitability                                         Need to intensify transformation
                                                                                        in a less favourable context
               Decrease of the global revenue pool in the CIB industry

                                Three-pronged structural actions to improve
                             a profitability that deviated from the 2020 trajectory

1                                           2 Intensify the industrialisation          3
      Review of non-strategic and                                                            Focus on an even more
    unprofitable business segments                      to reduce costs                    selective & profitable growth

           Preliminary scope of                 €850m in recurring savings                    Continue strengthening
              potential exits                            by 2020                               positions on targeted
         Revenues: -€200 to -€300m               of which €350m in additional                   client segments
         Cost Income >100%                        savings vs. the initial plan            Reinforced cooperation between
         Risk-weighted assets: ~€5bn                                                       businesses (e.g. joint platform
                                               Electronisation of flow Global
         e.g. stopped Opera Trading                                                         Corporate Banking/Global Markets)
                                               Markets businesses
         proprietary business and                                                          Continue development in targeted
                                               Shared platforms (near-shoring)
         commodity derivatives in the US                                                    countries in Corporate Banking
                                               Industrialisation, streamlining and
                                                                                           Capitalise on acquisitions made and
                                                mutualisation of IT & back offices
                                                                                            large mandates in Securities Services

                                                                                           Fixed Income Presentation – May 2019     20
CIB 2020:
      Updated 2020 Objectives

                                                                       €1.1bn cost savings
► Focus on profitable growth
      Continue strengthening leading positions in                   in €bn                      2019-2020
       Europe and selective development in the US
       and Asia                                                                                                  0.25
      Deepen the integrated model between the                                                       0.35
                                                                                                                              €1.1bn
       businesses and the regions (“One Bank”)                                         0.5
      Develop digital initiatives in all the businesses
       (electronic platforms, partnerships, etc.)                         0.5
                                                                       Savings Initial savings    Additional   Savings related New
      Continue the development of sustainable finance                 realised   from the         savings         to exits     2020
       (green bonds, etc.)                                            2017-2018 2020 plan                                     objective

   Be the preferred European partner of our clients
                                                                2020 trajectory
► Intensify transformation efforts                                 Revise downward the 2020 revenue target,
      €1.1bn in cost savings by 2020                               recovering compared to the low 2018 base
       (of which ~€250m related to the businesses exits)           Significant improvement of operating efficiency:
      ~€12bn reduction in risk-weighted assets by                  thanks to the additional cost saving efforts
       2020 (of which €5bn related to business exits) to            (positive jaws effect)
       reinvest in business and offset regulatory constraints      Rise in the RONE* to a level very close to the initial
                                                                    target

                 A 2020 trajectory reviewed to focus on profitability
                                                                                                                           * Pre-tax return on notional equity

                                                                                             Fixed Income Presentation – May 2019                     21
Domestic Markets and IFS In Line With the Plan
   Adjustment of the CIB Trajectory

 Domestic Markets: trajectory in line with the 2020 plan                                Allocation of Notional Equity to
                                                                                             the Operating Divisions
 IFS: trajectory in line with the 2020 plan
                                                                                            2016                            2020
 CIB: amplification of the transformation
        Adjustment of the revenues trajectory and increase in savings by 2020
                                                                                                   CIB                           CIB
        Rise in the RONE to a level very close to the initial objective             IFS
                                                                                                   32%
                                                                                                                      IFS        28%
                                                                                     35%                              39%

 Growth in risk weighted assets: ~+2.5% (2018-2020 CAGR*)                                   DM                               DM
                                                                                             33%                              33%
        Stability of CIB’s risk weighted assets compared to 2016 vs 2%
         increase (2016-2020 CAGR*) in the initial plan

 Active management of the balance sheet (sales of non-core
  equity holdings or assets)                                                            Example of active management of the
                                                                                         balance sheet: sale on
        e.g. sale on 1st March 2019 of 9.23% of SBI Life                                1st March 2019 of 9.23% of SBI Life
 No new acquisitions envisaged                                                            Positive impact of close to
                                                                                            5 bps on CET 1
 Organic capital generation of at least 30 bps per year (after                            >450 M€ capital gain after tax
  dividend distribution)

                  RONE growth in each of the operating divisions
                                                                                                               *   Compound annual growth rate

                                                                                          Fixed Income Presentation – May 2019           22
Updated 2020 Plan Targets
                                                         Updated estimates                              Initial Targets

                                                                                                          2016-2020
                                                         2016-2020 CAGR(1)
                Revenue growth                                                                             CAGR(1)
                                                              ≥ +1.5%                                      ≥ +2.5%

         Recurring cost savings target
                                                               €3.3bn                                        €2.7bn
              starting from 2020

               Cost income ratio                                64.5%                                          63%

                      ROE                                        9.5%                                          10%

        Fully loaded Basel 3 CET1 ratio                         ≥ 12%                                          12%

                 Pay-out ratio                                   50%                                         50%(2)
                                                            (€3.02 in 2018)(2)

 Increase in earnings per share (2020 vs. 2016): > +20%
 Increase in dividend per share (2020 vs. 2016): +35%
 ROTE: > 10.5% in 2020

     Significant increase in earnings and dividend per share
                                                                     (1)   Compound annual growth rate; (2) Subject to shareholder approval

                                                                              Fixed Income Presentation – May 2019                    23
Advancing Towards 2020 Ambition

Strong Solvency and Funding

1Q19 Detailed Results

Appendix

                                  Fixed Income Presentation – May 2019   24
Financial Structure
 Reminder CET1 as at 31.12.18: 11.8%                                                                                                                    CET1 ratio
        Impact as at 01.01.19 of the first time application of the new accounting                                                                               11.7%                                   11.7%
         standard IFRS 16 (« Leasing »): -10 bp
      Pro forma CET1 ratio as at 01.01.19: 11.7%

 CET1 ratio: 11.7% as at 31.03.19 (stable vs. 01.01.19)
        1Q19 results excluding IFRIC 21 and exceptional non operating items,
         after taking into account a 50% dividend pay-out ratio (+20 bp)
        Net impact of the capital gain from the sale of 14.3% of SBI Life and of
         goodwill impairments (+10 bp)
                                                                                                                                                               01.01.19                                31.03.19
        Impact of taxes and contributions subject to IFRIC 21 after taking into
         account a 50% pay-out ratio (-10 bp)                                                                                                            Liquidity reserve (€bn)**
        Increase in risk-weighted assets excluding foreign exchange effect (-20 bp),                                                                                                                       335
         securitisations scheduled for this quarter having been deferred to the coming                                                                              308
         quarters
        Overall limited impact of other effects on the ratio

 Leverage ratio*: 4.2% as at 31.03.19

 Immediately available liquidity reserve: €335bn**
  (€308bn as at 31.12.18): room to manoeuvre > 1 year in terms of wholesale funding                                                                            31.12.18                                31.03.19

                                   Very solid financial structure
                                                                                                                                 * Calculated according to the delegated act of the EC dated 10.10.2014 on total Tier 1 Capital;
                                      ** Liquid market assets or eligible to central banks (counterbalancing capacity) taking into account prudential standards, notably US standards, minus intra-day payment system needs

                                                                                                                                              Fixed Income Presentation – May 2019                                        25
2018 Supervisory Review and Evaluation Process (SREP)
    CET1 Ratio
                                                                                                                                                       CET1 Ratio
                                                                                                                                                       Requirement                                            BNPP’s trajectory
                                                                                                                                                           as at
 CET1 ratio requirement unchanged following the 2018 SREP                                                                                              01.01.2019                                         Countercyclical buffer

  by the ECB: 9.83% as of 01.01.2019                                                                                                                                                                       Conservation buffer
                                                                                                                                                                                                           Pillar 1               P2R
      Of which Pillar 2 requirement (P2R) of 1.25%
                                                                                                                                                                                                           GSIB buffer            CET1 total
      Of which Conservation buffer of 2.50% and G-SIB buffer of 1.50%
      Of which Countercyclical buffer of 0.08%*                                                                                                                                                   11.7%                            ≥ 12.0%

      Excluding Pillar 2 guidance (P2G), non public                                                                                                           9.83%**
      CET1 ratio of 11.7% as at 31.03.19,
       well above the regulatory requirement                                                                                                                   1.50%

                                                                                                                                                               2.50%
                                                                                                                                                                                                   11.7%                              12.0%
 Updated estimate for CET1 ratio: ≥ 12.0% in 2020                                                                                                             1.25%

                                                                                                                                                               4.50%

                                                                                                                                                            Minimum                               BNPP                               BNPP
                                                                                                                                                          requirement                         As at 31.03.19                      (estimate in
                                                                                                                                                         of CET1 Ratio                                                               2020)

                                                   CET1 ratio well above requirement
            * Countercyclical buffer: 8bps as of 1.01.2019, estimated 17bps as of 1.01.2020. Reminder: on 29 June 2018, French authorities set a countercyclical buffer of 25bps on French credit RWA as of 1 July 2019 (7 bps impact for BNP Paribas) ;
                                                                                                                                                                                                      ** Including a countercyclical capital buffer of 8bps

                                                                                                                                                                          Fixed Income Presentation – May 2019                                      26
2018 Supervisory Review and Evaluation Process (SREP)
       Total Capital Ratio
                                                                                                                                                        Total Capital Ratio
                                                                                                                                                        Requirement                                       BNPP’s trajectory
 Total Capital ratio requirement unchanged following the 2018                                                                                              as at                                     Countercyclical buffer
  SREP by the ECB: 13.33% as of 01.01.2019                                                                                                               01.01.2019
                                                                                                                                                                                                     Conservation buffer
                                                                                                                                                                                                     Pillar 1         P2R
      Of which Pillar 2 requirement (P2R) of 1.25%
                                                                                                                                                                                                     GSIB buffer            Total Capital
      Of which Conservation buffer of 2.50% and G-SIB buffer of 1.50%                                                                                                                                                              ≥ 15.0%
                                                                                                                                                                                                    15.1%
      Of which Countercyclical buffer of 0.08%*
                                                                                                                                                               13.33%**
      Excluding Pillar 2 guidance (P2G), non public
                                                                                                                                                                1.50%
      Total Capital ratio of 15.1% as at 31.03.19,
       well above the regulatory requirement                                                                                                                    2.50%

                                                                                                                                                                1.25%
 Updated estimate for Total Capital ratio: ≥ 15% in 2020                                                                                                                                          15.1%                              ≥15.0%

      Reminder: Tier 1 and Total Capital ratios requirements are on a
       cumulative basis
                                                                                                                                                                 8.0%
      AT1 and Tier 2 could be ≥ 3% given the issuance programme for
       capital instruments

                                                                                                                                                             Minimum                              BNPP                                BNPP
                                                                                                                                                           requirement                        As at 31.03.19                        (estimate
                                                                                                                                                          of Total Capital                                                           in 2020)
                                                                                                                                                               Ratio

                                          Total Capital ratio well above requirement
                                               and already beyond 2020 target
             * Countercyclical buffer: 8bps as of 1.01.2019, estimated 17bps as of 1.01.2020. Reminder: on 29 June 2018, French authorities set a countercyclical buffer of 25bps on French credit RWA as of 1 July 2019 (7 bps impact for BNP Paribas) ;
                                                                                                                                                                                                       ** Including a countercyclical capital buffer of 8bps

                                                                                                                                                                           Fixed Income Presentation – May 2019                                      27
Prudential Total Capital

             Prudential Total Capital as at 31.03.19

                      15.1%
                       as at
                     31.03,19
                      1.9%       €12.9bn

                      1.5%       €10.0bn

                                                  €100.8bn
                                                    as at
                      11.7%      €77.9bn          31.03.19

                                                             CET1
                                                             Additional Tier 1
                                                             Tier 2

          ~€101bn of prudential Total Capital as at 31.03.19

                                                                  Fixed Income Presentation – May 2019   28
Medium/Long Term Wholesale Funding
  2019 Programme
                                                                                                                          Evolution of existing Tier 1 and Tier 2 debt
 2019 MLT funding plan*: €36bn                                                                                            as at 1.04.2019 (eligible or admitted to
                                                                                                                          grandfathering)***

 Of which capital instruments: €3bn                                                                                             €bn            01.04.2019 01.01.2020 01.01.2021
        Target of 3% of RWA
        Additional Tier 1: 1.5% and Tier 2: 1.9% as at 31.03.19                                                                 AT1                    10                       9                      8
        Additional Tier 1: $1.5bn issued on 18 March 2019,                                                                       T2                    16                     15                      14
         Perpetual Non Call 5, 6.625% coupon, over $8bn order book,
         more than 375 investors, equiv. mid-swap€ + 360bp
        Tier 2**: ~€510m equiv., issued under various formats,
         average maturity of 8.7 years, mid-swap€ + 191bp
 Senior debt: €33bn
        Of which Non Preferred Senior (NPS) debt: €14bn
 Non Preferred Senior (NPS) debt already issued**: €9.2bn
  average maturity of 6.5 years, mid-swap + 172bp
        €750m, 5.5 years Green NPS Bond issued on 21 February 2019, mid-swap +100bp

             Almost 2/3 of Non Preferred Senior debt programme
                   already completed at the end of March
                                                                   * Subject to market conditions, indicative amounts at this stage; ** As at 02.04.19; *** Maturity schedule taking into account prudential amortisation
                  of existing instruments as at 31.03.19, excluding future issuances, assuming callable institutional instruments are called at the first call date, and taking into account the grandfathering phasing out

                                                                                                                                                  Fixed Income Presentation – May 2019                               29
Medium/Long Term Funding Outstanding

  Wholesale MLT funding outstanding* (€bn)
                                                                                                                                                                                          171
                                                                                                                                   158                160              159                  10
152                                                                                           150               151
                       145            145                148                                                                          9                 9                  9                17
 15       139                                                              143                   9                 9
                        8                8                  9                                                                        15                15                 16
           11                                                                 9                                   15
                       11               13                 13                                   14
 18                                                                          15                                                                                                             33
           14                                                                                   11                                   20                23                 23
                                                                                                                  17

 70                    85
           72                           94                101                94                 86                82                 85                85                 81                82

 50        43          40
                                        31                 25                25                 30                29                 29                28                 30                29

Dec-11   Dec-12       Dec-13        Dec-14            Dec-15**          Dec-16**           Dec-17**            Mar-18            Jun-18            Sep-18             Dec-18             Mar-19

Secured Senior Debt    Senior Debt (Preferred from 2017)                          Non Preferred Senior Debt                      Subordinated Debt                   Tier One Hybrid

         Overall MLT funding essentially stable over the period
                               * Source: ALM funding; ** Figures restated according to the new broader definition of wholesale funding, covering all funds, excluding those provided by retail customers, SMEs
                                                                                           and corporates, institutional clients for their operating needs, monetary policy and funding secured by market assets

                                                                                                                                          Fixed Income Presentation – May 2019                            30
Distance to Maximum Distributable Amount Restrictions
                                                                                                        Capital requirements as at 01.01.19*
 Reminder: Pillar 2 is composed of:                                                                           P2R               G-SIB buffer
        “Pillar 2 Requirement ” (public), applicable to CET1, Tier 1 and                                      Pillar 1          Conservation buffer
         Total Capital ratios                                                                                  Countercyclical buffer
                                                                                                                                                                       13.33%
        “Pillar 2 Guidance” (not public), not applicable for distributable
         amount restrictions (MDA - Maximum Distributable Amount*)                                                                     11.33%
                                                                                                                                                                         0.08%
                                                                                                        9.83%                                                            1.50%
 Capital requirements as at 1.01.19*:                                                                                                   0.08%
                                                                                                         0.08%                           1.50%                           2.50%
        CET1: 9.83%
                                                                                                         1.50%                           2.50%                           1.25%
        Tier 1: 11.33%
        Total Capital: 13.33%                                                                           2.50%                           1.25%
                                                                                                         1.25%
 Distance as at 31.03.19 to Maximum Distributable Amount                                                                                                                 8.0%
                                                                                                                                          6.0%
  restrictions** equal to the lowest of the 3 calculated amounts:                                         4.5%
  €11.9bn
                                                                                                           CET1                           TIER 1                          TOTAL
                                                                                                                                                                         CAPITAL
                       Ratios of BNP Paribas as at 31.03.19                                               11.7%                          13.2%                           15.1%
                                Distance*** as at 31.03.19 to                                            1.9%                           1.9%                             1.8%
                          Maximum Distributable Amount** restrictions                                   €12.3bn                        €12.4bn                          €11.9bn

                                                       * Including a countercyclical capital buffer of 8bps; ** As defined by the Art. 141 of CRD4; *** Calculated on the basis of RWA (€667bn)

                                                                                                                      Fixed Income Presentation – May 2019                              31
Evolution of the Total Loss Absorbing Capacity (TLAC) Ratio
                                                                                                                                                                                    TLAC Ratio

                                                                                                                                                                                            2019 requirement
 TLAC requirement of 20% in 2019*
                                                                                                                                                                                                      TLAC
             Including Conservation buffer and G-SIB buffer                                                                                                                                          + buffers
                                                                                                                                                                                                     20.08%
 Cumulated issuance of €32.5bn of Non Preferred Senior
  debt as at 31.03.19                                                                                                                                                                                 0.08%
                                                                                                                                                                                                      1.5%
                                                                                                                                                                                                      2.5%
 TLAC ratio already 22.5%* as at 31.03.19, including:
             Total Capital level of 15.1% as at 31.03.19
             2.5% MREL allowance** fully filled with eligible vanilla
              Preferred Senior Debt                                                                                                                                                                  16.0%

             4.9% of Non Preferred Senior debt***

                                                                                                                                                                                                    TLAC
                                                                                                                                                                                                 requirement
                                                                                                                                                                                                  01.01.2019
                                                                                                                                                                                                      Countercyclical buffer
                                                                                                                                                                                                      G-SIB buffer

                                                                                                                                                                                                      Conservation buffer

                                                                                                                                                                                                      TLAC ratio excluding buffers
    * Excluding the countercyclical buffer (8bps as of 1.01.2019, estimated 17bps as of 1.01.2020), reminder: on 29 June 2018, French authorities set a countercyclical buffer of 25bps on French credit RWA as of 1 July 2019 (7 bps impact for BNP Paribas)
                                                                                                 ** See the proposal from the European Commission implementing TLAC in the European Union; *** Calculated on the basis of RWA (€667bn) as at 31.03.19

                                                                                                                                                                             Fixed Income Presentation – May 2019                                      32
Long-Term Debt Ratings
                                   As of 6 May 2019

                            Standard &                      Fitch                 DBRS
                                            Moody’s
                              Poor’s                       Ratings

Senior Preferred                 A+            Aa3               A+             AA (Low)

Senior Non Preferred             A-           Baa1               A+              A (High)

Tier 2                         BBB+           Baa2               A                    A

Additional Tier 1               BBB-           Ba1          BBB-                     NA

Outlook                        Stable         Stable        Stable                Stable

                       Any rating action may occur at any time

                                                             Fixed Income Presentation – May 2019   33
Advancing Towards 2020 Ambition

Strong Solvency and Funding

1Q19 Detailed Results

Appendix

                                  Fixed Income Presentation – May 2019   34
1Q19 Key Messages
                                                                        Outstanding loans:
Business growth in the three operating divisions
                                                                         +4.2% vs. 1Q18

Revenue growth driven by IFS and CIB                                          Revenues:
Stability at Domestic Markets due to the low rate environment               +3.2% vs. 1Q18

Positive jaws effect
                                                                      Operating expenses:
Decrease of costs in the retail networks and growth
of the specialised businesses                                           +2.3% vs. 1Q18

Low cost of risk                                                                     38 bp*

Rise in net income                                              Net Income Group share: €1,918m
                                                                           (+22.4% vs. 1Q18)

Very solid balance sheet                                                CET 1 ratio: 11.7%

                                     Business growth
                                    Positive jaws effect
                                                                        * Cost of risk/Customer loans at the beginning of the period (in bp)

                                                                     Fixed Income Presentation – May 2019                            35
Main Exceptional Items and IFRIC 21 Impacts - 1Q19

    Exceptional items                                                                                                                             1Q19                         1Q18
 Operating expenses
        Restructuring costs of acquisitions* (Corporate Centre)                                                                                       -€38m                        -€5m
        Transformation costs of Businesses (Corporate Centre)                                                                                        -€168m                      -€206m
                                                                           Total exceptional operating expenses                                       -€206m                      -€211m
 Other non operating items
        Capital gain on the sale of 14.3% of SBI Life (Corporate Centre)                                                                            +€838m
        Goodwill impairment (Corporate Centre)                                                                                                      -€318m
        Capital gain on the sale of a building (Corporate Centre)                                                                                                               +€101m
                                                           Total exceptional other non operating items                                               +€520m                      +€101m

 Total exceptional items (pre-tax)                                                                                                                +€314m                       -€110m

 Total exceptional items (after tax)**                                                                                                            +€330m                         -€56m


    Booking in the first quarter of almost the entire amount of taxes and                                                                        -€1,139m                    -€1,109m
    contributions for the year based on the application of IFRIC 21***
 Reminder: the effect of IFRIC 21 is to reduce 1Q net income and increase the 2Q, 3Q and 4Q net income

                            * Restructuring costs in particular Raiffeisen Bank Polska and Opel Bank SA; ** Group share; *** Of which the estimated 2019 contribution to the Single Resolution Fund

                                                                                                                                    Fixed Income Presentation – May 2019                      36
Consolidated Group - 1Q19
                                                                                                         %
                                               1Q19       1Q18                           At historical        At constant
                                                                                          scope &              scope &
                                                                                       exchange rates       exchange rates

Revenues                                      €11,144m    €10,798m                         +3.2%                +3.9%
Operating expenses                            -€8,449m    -€8,260m                         +2.3%                +1.4%
Operating expenses excluding IFRIC 21*                                                      +2.2%               +1.2%

Gross operating income                        €2,695m      €2,538m                        +6.2%             +12.5%
Cost of risk                                   -€769m       -€615m                        +25.0%             +25.6%
Operating income                              €1,926m      €1,923m                         +0.2%                +8.0%
Non operating items                             €757m         €333m                              n.s.                n.s.
Pre-tax income                                €2,683m      €2,256m                       +18.9%                      n.s.

Net income Group share                        €1,918m     €1,567m                      +22.4%

Net income Group share
excluding exceptional items and IFRIC 21*     €2,565m     €2,570m                          -0.2%

Return on equity (ROE)**:                       9.7%
Return on tangible equity (ROTE)**:            11.2%

                                           Rise in income
                                         Positive jaws effect
                                                           * See slide 36; ** Excluding exceptional items; taxes and contributions subject to IFRIC 21 non annualised

                                                                                   Fixed Income Presentation – May 2019                                      37
Revenues of the Operating Divisions - 1Q19
                                                                                                                                      1Q19 vs. 1Q18

           Domestic                     International                                                                                              1Q18
                                                                                          CIB
           Markets*                  Financial Services                                                                                            1Q19

              -0.2%                         +9.5%                                      +3.5%
                                                                                                                                         Operating
                                                                                                                                         divisions
                                            +7.8%

                                                                                                                                            +4.4%

                                                                                                                                   +3.6% constant scope &
                                                                                                                                          exchange rates

          3,969   3,961                  3,912   4,282
                                                                               2,906             3,008
 €m

 Domestic Markets: decrease in revenues of the networks due to low interest rates but good growth of the
  specialised businesses
 IFS: very good growth
 CIB: increase in revenues due to the upturn in the client activity during the quarter

          Good growth in the revenues of the operating divisions
        Improvement of the market context at the end of the quarter
                                                                 * Including 100% of Private Banking in France (excluding PEL/CEL effects), in Italy, Belgium and Luxembourg

                                                                                            Fixed Income Presentation – May 2019                                     38
Operating Expenses of the Operating Divisions - 1Q19
                                                                                                                                                       1Q19 vs. 1Q18

                                                                                                                                                                    1Q18
           Domestic                    International                                                                                                               1Q19
                                                                                                           CIB
           Markets*                 Financial Services
                                                                                                                                                          Operating
              +0.4%                        +6.3%                                                         +3.1%                                            divisions
                                           +2.9%
                                                                                                                                                             +3.1%

                                                                                                                                                                constant scope &
                                                                                                                                                     +1.3%       exchange rates

          2,971   2,983                 2,529   2,688                                            2,389             2,463
 €m

 Domestic Markets: increase in the specialised businesses as a result of the development of the activity
  (with a positive jaws effect) and operating expenses down in the networks (-0.4%**)
 IFS: support of the increase in business and development of new products (positive jaws effect)
 CIB: increase on the back of the development of the activity, active implementation of cost saving
  programmes (positive jaws effect)

                          Impact of the cost saving measures
                                  Positive jaws effect
                                                        * Including 100% of Private Banking in France, Italy, Belgium and Luxembourg; ** FRB, BNL bc and BRB excluding the impact of IFRIC 21

                                                                                                              Fixed Income Presentation – May 2019                                   39
Variation in the Cost of Risk by Business Unit (1/3)
               Cost of risk/Customer loans at the beginning of the period (in annualised bp)

  Group                                                                                    Cost of risk: €769m
                                                                                                         -€127m vs. 4Q18
                                                                                                         +€154m vs. 1Q18
                                                                                           Low cost of risk
  54     46                                                                                Rise non meaningful vs. 1Q18
                 39    35           32           34     42             38
                                          29
                                                                                                         Reminder: particularly low level in
                                                                                                          1Q18 due to provision write-backs
 2015   2016    2017   2018        1Q18   2Q18   3Q18 4Q18*           1Q19                                at CIB and Personal Finance

 CIB - Corporate Banking
                                                                                           Cost of risk: €35m
                                                                                                              -€57m vs. 4Q18
                                                                                                             +€36m vs. 1Q18
        25                                               27
 12              6      2            0                                   10                Low cost of risk
                                                                                           Reminder: provisions offset by write-
                                           -4    -13                                        backs in 1Q18
 2015   2016    2017   2018        1Q18   2Q18   3Q18   4Q18           1Q19

                                                                 * Excluding booking of the stage 1 provisions on the portfolio of non-doubtful loans of Raiffeisen Bank Polska

                                                                                                       Fixed Income Presentation – May 2019                              40
Variation in the Cost of Risk by Business Unit (2/3)
                Cost of risk/Customer loans at the beginning of the period (in annualised bp)

  FRB
                                                                                Cost of risk: €72m
                                                                                         -€13m vs. 4Q18
                                                                                         +€13m vs. 1Q18
  24     24       21     16           13     12     20     19         15
                                                                                Low cost of risk
  2015   2016     2017   2018        1Q18   2Q18   3Q18   4Q18       1Q19

  BNL bc                                                                        Cost of risk: €165m
                                                                                         +€1m vs. 4Q18
  161                                                                                    -€4m vs. 1Q18
         124      111    75           87                   82         85
                                             66     67                          Confirmation of the decrease in the cost
                                                                                 of risk
 2015    2016     2017   2018        1Q18   2Q18   3Q18   4Q18       1Q19       Impact of the deterioration of a specific
                                                                                 file this quarter

  BRB
                                                                                Cost of risk: €34m
                                                                                         -€9m vs. 4Q18
                                                                                         +€28m vs. 1Q18
   9     10        6      4            2                   16          12
                                                                                Very low cost of risk
                                             -1     -1
 2015    2016     2017   2018        1Q18   2Q18   3Q18   4Q18       1Q19

                                                                                       Fixed Income Presentation – May 2019   41
Variation in the Cost of Risk by Business Unit (3/3)
               Cost of risk/Customer loans at the beginning of the period (in annualised bp)

 Personal Finance                                                              Cost of risk: €329m
                                                                                        +€30m vs. 4Q18
  206                                                                                    +€54m vs. 1Q18
        159      147    141         137    128
                                                  161    136         145
                                                                                     
                                                                               Low cost of risk
                                                                               Reminder: cost of risk particularly low in
                                                                                1Q18 due to provision write-backs
 2015   2016     2017   2018        1Q18   2Q18   3Q18   4Q18       1Q19

 Europe-Mediterranean
                                                                               Cost of risk: €77m
                                                                                        -€1m vs. 4Q18
 120    112             82                        108     87
                                                                                        +€7m vs. 1Q18
                 68                  73     58                        75
                                                                               Cost of risk stable at a moderate level

 2015   2016     2017   2018        1Q18   2Q18   3Q18   4Q18       1Q19

 BancWest
                                                                               Cost of risk: €18m
                                                                                        -€4m vs. 4Q18
                                                                                        +€6m vs. 1Q18
   9    14       17     14           10     0      27     17         14
                                                                               Low cost of risk
 2015   2016     2017   2018        1Q18   2Q18   3Q18   4Q18       1Q19

                                                                                      Fixed Income Presentation – May 2019   42
Domestic Markets - 1Q19
                                                                                                                                                        Loans
 Growth in business activity
                                                                                                                                                    €bn
                                                                                                                                                                            +4.1%
        Loans: +4.1% vs. 1Q18, good loan growth in retail networks and
         in the specialised businesses (Arval, Leasing Solutions)                                                                                              390                        407
                                                                                                                                                                 46                         50       Other DM
        Deposits: +5.1% vs. 1Q18, growth in all countries
                                                                                                                                                                104                        109       BRB
 Good digital development                                                                                                                                                                  78
                                                                                                                                                                 78                                  BNL bc
        Sharp rise in the number of active mobile users in networks (+20% vs. 1Q18);
         19 connections on average per user and per month                                                                                                       162                        170       FRB

 Revenues*: €3,961m; -0.2% vs. 1Q18 (+0.6% at constant scope & exchange rates)
                                                                                                                                                               1Q18                      1Q19
        Impact of low interest rates partly offset by increased activity
        Impact at the beginning of the quarter on financial fees of the
                                                                                                                                                        Deposits
         unfavourable market environment                                                                                                             €bn
                                                                                                                                                                            +5.1%
        Continued growth of the specialised businesses                                                                                                         373                       392
                                                                                                                                                                                            44       Other DM
 Operating expenses*: €2,983m; +0.4% vs. 1Q18 (+0.4% at constant scope &                                                                                        43
   exchange rates)                                                                                                                                              122                        127       BRB
        Rise in the specialised businesses on the back of the activity growth                                                                                                              44       BNL bc
                                                                                                                                                                 44
        Decrease in the networks (-0.4%** vs. 1Q18)
                                                                                                                                                                164                        177       FRB
        Positive jaws effect at constant scope and exchange rates
 Pre-tax income***: €608m (-7.6% vs. 1Q18)                                                                                                                    1Q18                      1Q19

                        Good business drive
 Impact at the beginning of the quarter of the fall in markets in 4Q18
                                          * Including 100% of Private Banking, excluding PEL/CEL; ** FRB, BNL bc and BRB, excluding the impact of IFRIC 21; *** Including 2/3 of Private Banking, excluding PEL/CEL

                                                                                                                                     Fixed Income Presentation – May 2019                                    43
Domestic Markets
  French Retail Banking - 1Q19
 Good business drive in the context of economic growth                                                                                                                 Loans
        Loans: +4.5%, good growth; significant rise in corporate loans                                                                                             €bn
                                                                                                                                                                                           +4.5%
        Deposits: +7.6% vs. 1Q18, rise in current accounts
                                                                                                                                                                             162                          170
        Private banking: net asset inflows of €0.5bn
        Hello bank!: good growth (448,000 clients, +22.6% vs. 31 March 2018)
 Acceleration of mobile usages & development of self-care features
        Roll out conversational chatbots, Telmi (BNP Paribas) & Helloïz (Hello bank!)
 Good development of the new Cardif IARD* property & casualty insurance offering                                                                                           1Q18                         1Q19
        Almost 140,000 contracts sold since the launch in May 2018

 Revenues**: +0.1% vs. 1Q18                                                                                                                                            Deposits
        Net interest income: +2.6%, related in particular to the rise in volumes                                                                                    €bn

        Fees: -3.1%, impact on financial fees of the unfavourable market environment at the                                                                                              +7.6%
         beginning of the quarter; decrease in fees on fragile customers                                                                                                                                  177
                                                                                                                                                                              164
 Operating expenses**: -0.3% vs. 1Q18
        Impact of cost saving measures (optimisation of the network and streamlining
         of the management set-up)
        Positive jaws effect (+0.4 point)
 Pre-tax income***: €304m (-0.6% vs. 1Q18)                                                                                                                                  1Q18                         1Q19

                                               Good business drive
                                               Positive jaws effect
                                     * BNP Paribas Cardif and Matmut partnership; ** Including 100% of Private Banking excluding PEL/CEL effects; *** Including 2/3 of Private Banking in France excluding PEL/CEL effects

                                                                                                                                          Fixed Income Presentation – May 2019                                     44
Domestic Markets
   BNL banca commerciale - 1Q19
 Stability of business activity in a lacklustre economic context                                              Market share on the
                                                                                                               corporate segment (loans)
        Loans: +0.1% vs. 1Q18, regular market share gains on the corporate segment                         Source: Italian Banking
                                                                                                            Association
        Deposits: +0.2% vs. 1Q18, slight increase in current accounts
                                                                                                                                                5.4%            5.7%
        Off balance sheet savings (+4.1% vs. 31.03.18): sharp rise in life insurance                           4.9%            5.2%
         (+9.5%) but decrease in mutual fund outstandings (-2.9%)
 Development of digital and new client experiences
        New payment solution Axepta: enables online businesses in Italy to plug in their
         websites a secure and flexible payment module also allowing payment
         receipts from other European countries
                                                                                                                 1Q16            1Q17            1Q18           1Q19
 Revenues*: -5.3% vs. 1Q18
        Net interest income: -3.8% vs. 1Q18, impact of the low interest rate environment                    Off balance sheet savings
         and the positioning on clients with a better risk profile                                           (Life insurance and mutual funds)

        Fees: -7.4% vs. 1Q18, impact of non recurring items and decrease in                              €bn
                                                                                                                                             +4.1%
         financial fees vs. high base in 1Q18
                                                                                                                             35.5                           36.9
 Operating expenses*: -2.1% vs. 1Q18
        Effect of cost saving measures
 Pre-tax income**: €30m (-€22m vs. 1Q18)

                                                                                                                         31.03.18                        31.03.19

                Cost adaptation in a lacklustre economic context
                                                                                        * Including 100% of Italian Private Banking; ** Including 2/3 of Italian Private Banking

                                                                                            Fixed Income Presentation – May 2019                                         45
Domestic Markets
  Belgian Retail Banking - 1Q19
 Sustained business activity                                                                                     Loans
        Loans: +4.3% vs. 1Q18, good growth in loans to corporate customers,                                  €bn                          +4.3%
         increase in mortgage loans
                                                                                                                          104.1                            108.5
        Deposits: +4.1% vs. 1Q18, growth in current accounts and savings accounts
 Continued digital banking development & customer experience improvement
        Expanded the Hello home! offering (Belgium’s n°1 online mortgage loan application
         platform): bolstered customer services thanks to the new property evaluation module
         (partnership with BNP Paribas Real Estate Services and Immoprice)
 Revenues*: -2.0% vs. 1Q18                                                                                                1Q18                             1Q19
        Net interest income: -0.6% vs. 1Q18, impact of the low interest rate environment
         partly offset by increased volumes                                                                       Deposits
        Fees: -6.3% vs. 1Q18, in connection this quarter in particular with the rise in                       €bn
                                                                                                                                          +4.1%
         retrocession fees to independent agents
                                                                                                                          122.2                            127.2
 Operating expenses*: +1.0% vs. 1Q18
        -0.2% excluding the effect of taxes and contributions subject to IFRIC 21
         (€296m; +€10m vs. 1Q18)
        Effect of cost saving measures
 Pre-tax income**: €21m (-€58m vs. 1Q18)
        1Q18 cost of risk reminder: provisions offset by write-backs                                                     1Q18                              1Q19

                    Good business drive but impact of low rates
                                                                                      * Including 100% of Belgian Private Banking; ** Including 2/3 of Belgian Private Banking

                                                                                             Fixed Income Presentation – May 2019                                      46
Domestic Markets
  Other Activities - 1Q19
                                                                                                                                         Deposits
 Strong overall drive of the specialised businesses
                                                                                                                                     €bn
        Arval: +8.9% growth in the financed fleet vs. 1Q18*                                                                                   42.9                              44.5
        Leasing Solutions: rise in outstandings of +7.2% vs. 1Q18*
        Personal Investors (PI): rise in assets under management of +2.4% vs. 31.03.18                                                          22.8           -1.1%             22.5        PI

        Nickel: 94,000 accounts opened in 1Q19 (+18% vs. 1Q18)
 Luxembourg Retail Banking (LRB)                                                                                                                20.2           +9.1%             22.0        LRB
        Good deposit inflows, growth in mortgage and corporate loans
                                                                                                                                                1Q18                              1Q19
 Continued digital transformation
        Roll-out by Arval of a 100% digital vehicle rental offering for individual
         customers (Private Lease): already operational in the Netherlands                                                            Loans
         and now offered by Consorsbank in Germany                                                                                €bn
                                                                                                                                                                                39.5
 Revenues**: +6.5% vs. 1Q18                                                                                                                  36.2
                                                                                                                                                                                            Leasing
        Good business growth                                                                                                                                +7.2%*              20.6
                                                                                                                                               19.1                                         Solutions
 Operating expenses**: +3.5% vs. 1Q18
        As a result of business development                                                                                                                 +10.6%*             18.8 Arval
                                                                                                                                               17.1
        Positive jaws effect (+3 pts)
 Pre-tax income***: €253m (+14.1% vs. 1Q18)                                                                                                  1Q18                              1Q19

                                Good business drive
                    Positive jaws effect and sharp rise in income
                                                         * At constant scope and exchange rates; ** Including 100% of Private Banking in Luxembourg; *** Including 2/3 of Private Banking in Luxembourg

                                                                                                                        Fixed Income Presentation – May 2019                                     47
International Financial Services - 1Q19
 Sustained business activity                                                                    Outstanding loans
        Outstanding loans: +9.4% vs. 1Q18 (+6.4% at constant scope and exchange            €bn
         rates)
                                                                                                                   +9.4%             182
        Net asset inflows: +€3.0bn; assets under management: +2.3% vs. 31.03.18                      167
        Digital: already 2.5 millions digital clients in the Europe-Mediterranean
         networks and > 50% of contracts signed electronically at Personal Finance

 Revenues: €4,282m; +9.5% vs. 1Q18
        +7.8% at constant scope and exchange rates
                                                                                                     1Q18                           1Q19
 Operating expenses: €2,688m; +6.3% vs. 1Q18
        +2.9% at constant scope and exchange rates as a result of business                     Revenues
         development
                                                                                             €m
                                                                                                                4,282
        Largely positive jaws effect                                                               3,912 +9.5%
 Operating income: €1,165m; +13.6% vs. 1Q18                                                                                      1,427
                                                                                                     1,354                                     PF
        +16.6% at constant scope and exchange rates
 Pre-tax income: €1,279m (+4.7% vs. 1Q18)                                                                                        1,216
                                                                                                     1,101                                     IRB*
        +13.0% at constant scope and exchange rates
                                                                                                                                  1,640       Insurance
                                                                                                     1,456                                    & WAM

                                        Good business growth                                         1Q18                         1Q19
                                         Positive jaws effect
                                                                                      * Including 2/3 of Private Banking in Turkey and in the United States

                                                                                     Fixed Income Presentation – May 2019                             48
International Financial Services
  Personal Finance - 1Q19
 New brand image for Cetelem
 Continued the very good sales and marketing drive                                            Consolidated outstandings
        Outstanding loans: +12.2%, demand still sustained and effects of
         new partnerships                                                                                          91.0
                                                                                            €bn   81.1 +12.2 %
        Launch in France of C-Pay card associated with a revolving credit,
         which provides greater choice & autonomy in managing credit, flexible
         payment options and numerous benefits (discounts, coupons, etc.)
        New partnership between Consors Finanz and the # 1 comparison website in
         Germany, Check 24, to distribute a credit card with a revolving credit
 Good digital development                                                                        1Q18             1Q19
        120 robots operational (+24% vs. end 2018; target of 200 robots by end 2019)
        >32 million selfcare transactions done by clients (77% of total)
                                                                                               Gross operating income
 Revenues: +5.3% vs. 1Q18
                                                                                             €m
        In connection with the rise in volumes and the positioning on products with
                                                                                                   629    +4.3%    656
         a better risk profile
        Good revenue growth in particular in Italy, Spain and Germany
 Operating expenses: +6.2% vs. 1Q18
        Confirmation of the objective of a positive jaws effect this year
         (gradual effect of the cost saving measures)
 Pre-tax income: €340m (-8.6% vs. 1Q18)                                                          1Q18             1Q19
        Cost of risk: unfavourable base effect due to provision write-backs in 1Q18

                                 Continued good business drive
                                                                                       Fixed Income Presentation – May 2019   49
International Financial Services
  Europe-Mediterranean - 1Q19
 Merger of Raiffeisen Bank Polska* with BGZ BNP Paribas going well                                                                                                                        Deposits**
               The new combined entity becomes BNP Paribas Bank Polska                                                                                                                €bn
                                                                                                                                                                                                                 +3.9%**
               Active implementation of cost synergies: closure of 97 branches in 1Q19
                                                                                                                                                                                                      38.9                           40.4
 Business activity
               Loans: +2.2%** vs. 1Q18, growth in particular in Poland and Morocco
               Deposits: +3.9%** vs. 1Q18, increase in particular in Turkey
               Good digital development: already 2.5 million digital customers***
                                                                                                                                                                                                       1Q18                         1Q19
 Revenues****: +12.1%** vs. 1Q18
               Up in all regions: effect of increased volumes and margins,                                                                                                                Loans**
                good level of fees
                                                                                                                                                                                       €bn
 Operating expenses****: -0.1%** vs. 1Q18                                                                                                                                                                       +2.2%**
               Good cost containment and effect of the first synergies in Poland                                                                                                                      37.0                          37.8
               Largely positive jaws effect
 Pre-tax income*****: €185m (+75.9%** vs. 1Q18)
               -2.7% at historical scope and exchange rates (reminders: high level of
                non operating items in 1Q18 and strong depreciation of the Turkish lira)
                                                                                                                                                                                                       1Q18                         1Q19

                                                                      Good overall performance
                                                                      Largely positive jaws effect
  * Activities acquired: business of Raiffeisen Bank Polska excluding the foreign currency retail mortgage loan portfolio and excluding a limited amount of other assets, acquisition finalised on 31 October 2018; ** At constant scope and exchange rates;
                                                      *** Customers of the digital banks or customers who use digital banking services at least once a month; **** Including 100% of Turkish Private Banking; ***** Including 2/3 of Turkish Private Banking

                                                                                                                                                                            Fixed Income Presentation – May 2019                                    50
International Financial Services
  BancWest - 1Q19
                                                                                                                                                   Customer deposits*
 Business drive
                                                                                                                                               $bn
        Loans: +0.5%* vs. 1Q18, moderate growth in individual and corporate loans                                                                                        +2.5%
        Deposits: stable* vs. 1Q18, +2.5% increase in customer deposits**
        Private Banking: $14.3bn of assets under management as at 31.03.19                                                                                   54.1                      55.5
         (+8.2%* vs. 31.03.18); « Best private bank in US Western Region »
         (Global Finance Magazine)
        Digital: > 14,900 new accounts opened online in 1Q19 (+61% vs. 1Q18);
         roll-out of many robots this quarter (ex. Robotnik: robot analyzing client data
         to improve the quality of service in cash management)                                                                                               1Q18                       1Q19

 Revenues***: -1.7%* vs. 1Q18                                                                                                                     Loans*
        Decrease in net interest margin this quarter partially offset by increased fees                                                       $bn
                                                                                                                                                                          +0.5%
 Operating expenses***: -1.1%* vs. 1Q18                                                                                                                                                60.7
                                                                                                                                                              60.4
        Effect of cost reduction measures: headcount reduction and transfer of support
         functions in a less costly area (Arizona)

 Pre-tax income****: €101m (-10.7%* vs. 1Q18)
        -1.5% at historical scope and exchange rates (positive foreign exchange effect)
                                                                                                                                                              1Q18                       1Q19

                                        Good cost containment
                                                                                                           * At constant scope and exchange rates (USD vs. EUR average rates: +8,2% vs. 31.03.18);
                                        ** Deposits excluding treasury activities; *** Including 100% of Private Banking in the United States; **** Including 2/3 of Private Banking in the United States

                                                                                                                                Fixed Income Presentation – May 2019                               51
International Financial Services
  Insurance & WAM - Asset Flows and AuM - 1Q19
                                                                                  Evolution of assets under management*
 Assets under management*: €1,075bn as at 31.03.19                         €bn
                                                                                                      +42.5        +5.7       -3.6      TOTAL
        +4.6% vs. 31.12.18 (+2.3% vs. 31.03.18)
        Net asset inflows: +€3.0bn, still challenging context at the                                               Foreign   Others
                                                                                                                   exchange
         beginning of the quarter given the sharp fall in the markets                       +3.0                     effect
         at end of last year
                                                                                           Net asset Performance
        Largely positive performance effect (+€42.5bn) on the back             1,028       flows       effect                          1,075
         of the rebound of financial markets
        Favourable foreign exchange effect (+€5.7bn) in particular
         due to the appreciation of the US dollar
                                                                                31.12.18                                                31.03.19
 Net asset inflows: +€3.0bn in 1Q19
        Wealth Management: net asset inflows in particular in                  Assets under management* as at 31.03.19
         France, Germany and Asia
        Asset Management: slight overall asset outflows, asset inflow             Insurance: 248                                Wealth
         in money market funds                                                                                                 Management:
                                                                                                                                   377
        Real Estate Services: good asset inflows in France                        Real Estate
         and Germany                                                               Services: 29
        Insurance: good asset inflows, in particular in unit-linked policies

 Asset Management: success of the new Private Debt platform                                                                           €bn
  launched in early 2017                                                           Asset Management: 421
        8 billion euros of assets under management

                     Significant rise in assets under management
                                                                                                                                 * Including distributed assets

                                                                                                   Fixed Income Presentation – May 2019                  52
International Financial Services
  Insurance - 1Q19
 Good business development
                                                                                                        Revenues
        Sustained asset inflows in unit-linked policies (42% of gross asset inflows)
                                                                                                      €m
        Good development of the property & casualty insurance offering in the FRB network
         via Cardif IARD: nearly 140,000 contracts at the end of March 2019
                                                                                                                                874
                                                                                                                    +32.1%
        Good performance of the international Savings and Protection Insurance business                      661
        Energy transition commitment: target of €3.5bn in green investments
         by the end of 2020

 Implementation of the digital transformation and new technologies
        Creditor protection insurance: roll-out of a digital client portal in the Nordic countries
         to file claims online                                                                               1Q18              1Q19

 Revenues: €874m; +32.1% vs. 1Q18                                                                       Pre-tax income
        Positive impact of the strong rebound of financial markets (31.03.19 vs. 31.12.18;           €m
                                                                                                                                520
         reminder: booking of part of the assets at market value)                                                   +40.8%
        Good business activity
                                                                                                              369
 Operating expenses: €389m; +6.0% vs. 1Q18
        As a result of business development
 Pre-tax income: €520m; +40.8% vs. 1Q18
                                                                                                             1Q18              1Q19

                             Sharp rise in income
         Positive impact of the rebound of the markets vs. 31.12. 18
                                                                                             Fixed Income Presentation – May 2019     53
You can also read