Rheinmetall Group Corporate Presentation - August 2020 - Rheinmetall AG ...
←
→
Page content transcription
If your browser does not render page correctly, please read the page content below

Rheinmetall Group
Corporate Presentation
August 2020

Rheinmetall Group
Mobility and security form the DNA of the business model
RHEINMETALL GROUP
INTEGRATED TECHNOLOGY GROUP FOR SECURITY AND MOBILITY
Automotive Our heart beats for your engine Defence Force protection is our mission
Tier 1 supplier System house for land based operations
Business
Model
High-tech products for global markets Leading provider of innovative solutions
Gaining powertrain neutrality Internationalization focused on home
markets
Megatrend mobility Increasing demand for security
Growing demand for clean mobility Geostrategical powershifts
Market
driver
Global LV production with growth Constantly changing conflict situations
Increased regulation Rising defence/security budgets
Corporate Presentation August 2020 2
Rheinmetall Group
Highlights

Group performance indicator                                                                   Strategy roadmap
 Grow sales        ~8% op.                                                                      Organic                International
 around 8%         margin                RHEINMETALL                                            growth                 expansion

 Targeted 2-4%
 Cash on sales
                   30-35%
                   payout ratio
                                           GROUP                                                Leading by
                                                                                                innovations
                                                                                                                       Targeted
                                                                                                                       acquisitions

AUTOMOTIVE Our heart beats for your engine        2019                             DEFENCE Force protection is our mission
Op. margin         €2,736m        44%               Sales                          56%            €3,522m                 Op. margin
6.7%                 €184m        35%            Oper. Result                      65%             €343m                       9.8%
                    *€447m                      Order backlog                                    €10,399m
                     11,405       49%           Headcount**                        51%              12,100
                                        * Short-term; **Headcount at capacities;

                                                                                                  Corporate Presentation August 2020   3
Rheinmetall Group
   Financial overview - Growth in all relevant KPI
   Sales, operating result and operating margin                                                          Operating FCF and operating FCF to Sales
   In €m                                                                                                 In €m / in %
                                                                                                                                                          4,7%                        5,0%
6.500                                                                      6.255         12               400                                                                                      5
                                                             6.148                                                                                                                  314
                                              5.896                                      10               300                                             276                                      4   2-4%
6.000
                             5.602                                                       8                                                                                                         3   OFCF
                                                                                                          200                          161
5.500       5.183                                              8,0%           8,1%                                                                                                                   TARGET
                                                                                         6                                               2,9%                                                      2
                                6,3%               6,8%                                                   100
                                                                                         4                                29                                                                       1
                5,5%                                                 491           505
 500                   287             353            400                                                    0
                                                                                         2                               0,6%                                                                      0
                                                                                                                                                                            -0,6%
      0                                                                                  0               -100                                                         -35                          -1
                2015            2016               2017        2018           2019
            Op. Margin         Sales         Op. Result                                                                  2015            2016             2017       2018            2019
                                                                                                                 oFCF           oFCF/Sales

   Earnings and dividend per share                                                                        Net financial debt and Net debt to EBITDA
      In € / in %                                                                                         In €m
 12                                             32,4%                                    40                 Cash        0.17x
                              30,9%                                          30,9%          Payout Ratio
 10          28,4%                                          29,6%                                        300
                                                                                            30-35%
                                                                           7,77          30 of EPS
  8                                                         7,10                                         200                                                                              0.07x             0.1
  6                          4,69             5,24                                       20                                                                230          0.04x
           3,88                                                                                          100
  4
                                                                   2,10           2,40   10                                                   19
  2                 1,10            1,45             1,70                                                  0                                                                -30                             0.0
                                                                                                                         -81                                                                 -52
  0                                                                                      0              -100
              2015             2016                2017       2018           2019                           Debt 2015                        2016          2017         2018              2019
            Payout Ratio        EPS          DPS                                                                 Net debt to EBITDA            Net debt

                                                                                                                                                          Corporate Presentation August 2020            4
Rheinmetall Automotive
Products per division

   MECHATRONICS                HARDPARTS                 AFTERMARKET

           PUMP TECHNOLOGY          SMALL BORE PISTONS                      HARDPARTS

        AUTOMOTOVE EMISSION
                    SYSTEMS                  BEARINGS                  MECHATRONICS

             SOLENOID VALVES        LARGE BORE PISTONS
           COMMERCIAL DIESEL
                   SYSTEMS                   CASTINGS

                 ACTUATORS

                                                            Corporate Presentation August 2020   5
Rheinmetall Defence
Products per division

   WEAPON AND                       ELECTRONIC                      VEHICLE
   AMMUNITION                       SOLUTIONS                       SYSTEMS                 HX-FAMILY

       MID & LARGE CALIBER AMMO     INTEGRATED ELECTRONIC SYSTEMS               TACTICAL VEHICLES

     MID & LARGE CALIBER WEAPONS      AIR DEFENCE & RADAR SYSTEMS                LOGISTIC VEHICLES

                                           TECHNICAL PUBLICATIONS         Medium wheeled Medium tracked
             PROTECTION SYSTEMS
                         - ACTIVE                                               Heavy tracked
                        - PASSIVE
                      - SOFTKILL

                                                                       Corporate Presentation August 2020   6
One Rheinmetall
Realization of growth in changing market conditions
Positioning as integrated technology group for Mobility and Security
Realization of growth potentials in changing market environments
ONE Leveraging strengths by bundling and channeling our expertise and
RHEINMETALL competencies, e.g. different technologies
Change perception and increase attractiveness as an employer
One Rheinmetall One Rheinmetall One Rheinmetall
Phase I Phase II Phase III
Initiatives addressing culture Focus on technologies Commercialization
and cooperation
2016-2018 2018 ff. starting 2021
Corporate Presentation August 2020 7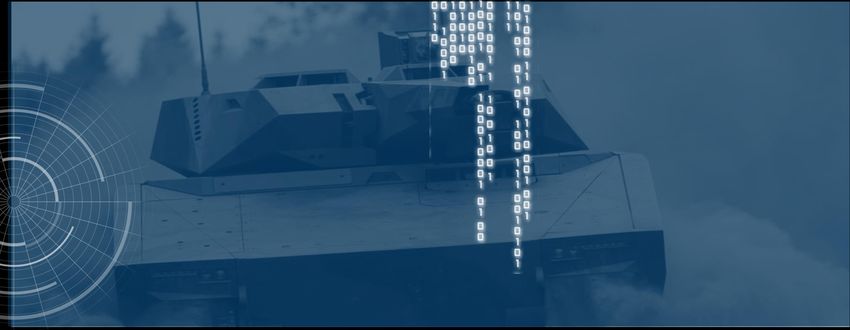
Automotive – A changing world

                                Corporate Presentation August 2020   8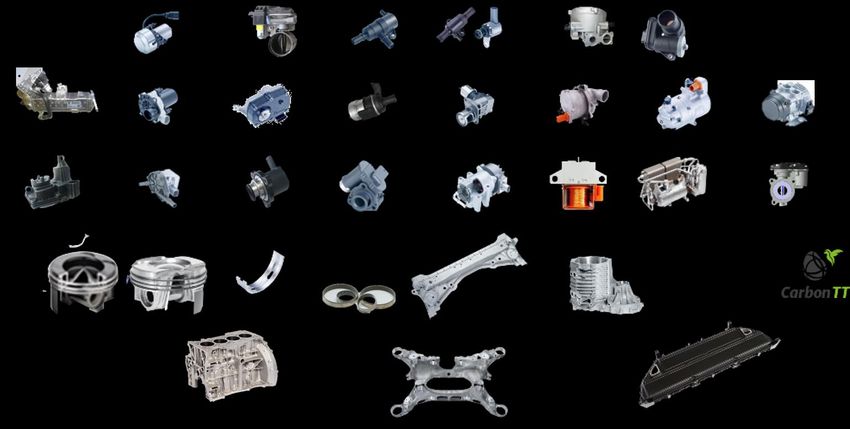
Automotive
Leading technology and market positions

Key Figures 2019     Sales by division*                          Sales by region                            Sales Total Management View
Sales:     €2.7bn   Aftermarket                      Hardparts          Asia         4%
                                                                                              RoW
                                                                                                             China JV-Sales
                                    13%                                                                      in €bn
                                               33%                             18%                                                1.1
Op. result: €184m                                                                           43%
                                                                   USMCA
                                                                              16%                  Europe
                                   54%                                                                w/o                                2.7
Op. margin: 6.7%    Mechatronics                                   Germany          19%           Germany                                          Consolidated
                                                                                                                                                   Sales

Op. FCF:   €73m      Operating result by division*               Sales by customer                           Global set up
                    Aftermarket                                                                >10% Ford,
                                                     Hardparts        Other
R&D:       €143m                          26%                                              23%       VW
                                   19%                                                                              12                  27
                                                                 2-5%                              5-10%
                                                                                                                                                   12
                                                                             44%                                                               3
Capex:     €163m                                                 Daimler,                    16% Renault/
                                                                 DAF, Volvo,                      Nissan,                   4
                                         64%                     PSA, BMW,           17%         GM, FCA
Headcount:11.405    Mechatronics                                 CAT/Perkins                                Sites per continent
                                                                                                                                                    *unconsolidated

                                                                                                              Corporate Presentation August 2020             9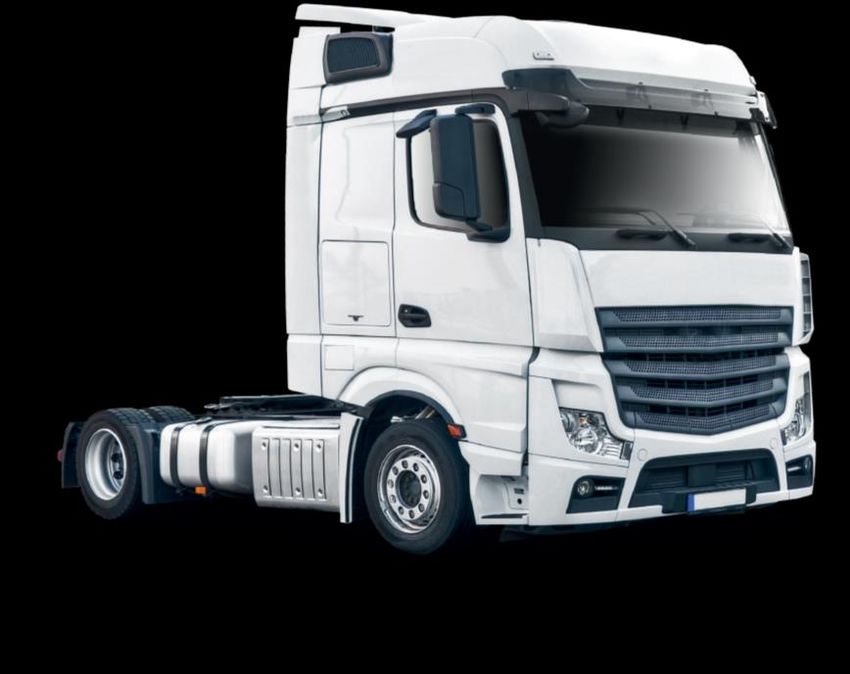
Automotive
Leading technology and market positions
Sales driver Segment Structure Key Competitor Differentiator
Hardparts Hardparts Strong brand
Megatrend mobility Pistons Mahle, Nemak, GGB,
Growing demand for Castings Tenneco (Federal Global footprint
Bearings Mogul), Dong Yang Strong partnerships
clean mobility
Mechatronics Mechatronics
Global LV production Pump Technology Magna, Bosch, Denso, (Hasco, Shriram, Riken, ZYNP)
with further growth Auto. Emission Systems Valeo, Schaeffler Wide technology portfolio
Commercial Diesel Systems
Increased regulation Solenoid Valves Extensive product Know-How
Actuators
Aftermarket Aftermarket
Hardparts Tenneco (Federal
Mechatronics Mogul), Mahle,
Bosch, Valeo
Corporate Presentation August 2020 10Automotive overview
Product portfolio by division and engine type
VACUUM PUMPS EXHAUST CONTROL
FUEL TANK ISOLATION THERMAL
MANAGEMENT HRB eCATHODE VALVE
MECHATRONICS
VALVE
VALVE GEN. 3
ELECTRICAL COOLANT GASOLINE EGR HIGH-VOLTAGE E-MOTOR COOLING
EGR MODULE SC AIR SYSTEM eWastegate PUMP COOLANT PUMP eCC
Actuator
TURBO ACTUATOR VTG EVAP ELEC. BYPASS VALVE MULTI PURPOSE VALVE ELECTRICAL OIL PUMPS CONTACTORS THERMO MODULE FUEL CELL CONTROL VALVE
25% Share Carbon TT
ALU PISTONS NON-ENGINE E-Motor HOUSING
POLYMER BEARINGS STRUCTURAL PARTS
HARDPARTS ENGINE BLOCKS
ICE EV / FUEL CELL
BATTERY BOXES
Corporate Presentation August 2020 11Drivers for growth
Rising global fleet and regulatory restrictions are supporting our growth
LV production forecast* Further regulatory pressure*** Automotive sales distribution
[mUnits] by engine type**
CO2 NOx
Fuel Cell AP
101 in g/km in mg/km
93 Core Diesel
89 Electric
15% -24% -56% Others
10% 7%
Plug-in hybrid -37% Fuel independent
125 180 22%
70 95 16% products
Full hybrid
18% 59
Gasoline mild 80
25%
74% hybrid 15%
71%
Gasoline Truck
47% 33% 2015 2020 2030 EU5 EU6 37% 3%
Diesel mild
hybrid Large-Bore
Next regulation deadline approaching Gasoline
Diesel Pistons
in 2020
17% 16% ICE Real driving emission(RDE) testing will
9% 7%
create further pressure to reduce
2019 2020 2025 2030 emissions by hardware installation
First city ban for diesel engines
announced in Germany
* IHS 07/2020 and company estimates
** Rheinmetall Automotive sales FY 2019
*** 95g = 4.1l Gasoline or 3.6l Diesel, 2030 estimates based on Regulation (EU) 2019/631
Corporate Presentation August 2020 12Automotive Market trends
The growth drivers remain strong
NT
E 3+ Efficiency
(CO2 Reduction)
Emission
(Reduction)
Electrification Outside
powertrain
The innovation pipeline is packed!
Corporate Presentation August 2020 13Efficiency
CO2 - reduction with Automotive products – gasoline engine vehicle
130 g 95 g
CO2/km CO2/km
2015 2021
-1 g -3 g -3 g -7 g -2 g -2 g
CO2/km CO2/km CO2/km CO2/km CO2/km CO2/km
Variable Tribology Electr. control Variable Electr. Lightweight
oil pump system valve and variable valve train EGR system design parts
coolant pump
*Reference: 1.4L 4-cylinder. TC DI gasoline engine (115kW), approx. 138 g CO2/km in NEDC
Corporate Presentation August 2020 14Facing technological disruption
Rheinmetall needs to manage the transition
Corporate Presentation August 2020 15Electrification
Rheinmetall Automotive products
Life time order value of €1.3bn booked*
* Rheinmetall Automotive and Joint Ventures, incl. BEV and Hybrid
Corporate Presentation August 2020 16Innovative products for a variety of applications
High El. Vapor El. Climate El. Cooling High Voltage Multi Purpose Compact Door
Voltage Pump Compressor Pumps Recirculation Valve Actuator
4,000 Contactor Blower
Book to bill
3,000
Sales
Order intake 1.7x
1.9x ratio
1.5x 1.5x 1.5x
2,000
1,000 >50% of order
intake for
new business
0
2015 2016 2017 2018 2019
Estimated >€0.6bn €700m > €2.5bn >€1.5bn >4m vehicles
Market until 2026
potential Examples
in 2025
Corporate Presentation August 2020 17Micro Mobility
Starting with competitive product into a booming market
High growth market Unique selling proposition
European market with 10% CAGR between 2018 and Smooth phasing of engine support
2030 Excellent freewheeling
High market concentration with Bosch representing Low weight and compact build
almost 50% of market share Low noise emission
E-bike market price averaged at €3.000 last 3 years High thermic stability
Interesting connectivity features
Speedy service concept
9,0
Development Start of 8,5
8,0
cost of € ~30m Production 7,4
6,9
until 2022 5,9
6,4
5,4
4,9
4,4
3,8
3,3
2,9
2018 2019 2020 2021 2022 2023 2024 2025 2026 2027 2028 2029 2030
European e-Bike sales forecast [mUnits] Corporate Presentation August 2020 18Diversification
Increasing portfolio for non-LV applications
Trucks Large bore pistons Bearings & Aftermarket
continuous casting
Diverse portfolio for E.g. ship and locomotive
truck applications pistons Sanitary application Global supply of spare parts
Corporate Presentation August 2020 19Trucks
Diverse portfolio for truck applications Permaglide bearings
for truck compressors
and truck hydraulics
Main coolant
pumps
Aluminum pistons
Auxiliary
coolant pumps
Steel pistons
Electrical oil pumps
Piston rings
Cooperation with
Riken
Bushings for
injection pumps
Main-bearings
Sales Connecting rod bearings
in €m CAGR +4%
Coolant
valves 436 Bearings for seat adjustments and doors
386 404
351 338
EGR cooler modules
Variable valve Control
and mixer modules
Exhaust gas flaps Dual poppet valves
2015 2016 2017 2018 2019 EGR reed valves
Hydraulic valves
Electrical Pressure High
Cylinder bypass regulating performance
bore coating valves valves actuators
Corporate Presentation August 2020 20Automotive China
Outperforming the market
Highlights Sales China
1,149
in €m 972 1,003
871 934 WFOEs
Partner of local big players SAIC and HASCO (50/50 528
681
joint ventures) 401
JVs (100%)
Biggest casting capacities in China – technology leader
Regulation (China 6) – provides substantial growth 2012 2013 2014 2015 2016 2017 2018 2019
potential for mechatronics division
Sales China by division CAGR +9%
Strong demand for NEV products in €m Mechatronics
China Story on track: product pipeline supports growth
Hardparts
ambitions
Aftermarket
Demand for Mechatronics products key driver
2016 2017 2018 2019
EBIT China 79
71 76 76 WFOEs
in €m
53 53
37
30 JVs (100%)
2012 2013 2014 2015 2016 2017 2018 2019
Corporate Presentation August 2020 21Defence – Managing the “super cycle”
Corporate Presentation August 2020 22Defence
Leading supplier with an increasing international presence
Key Figures 2019 Sales by division* Sales by region Order backlog by region
Sales: €3.5bn Aus/NZ RoW RoW
Weapon and 13% Germany
1%
USMCA 1% Germany 27% 22%
27% Ammunition 3% Aus/NZ
Op. result: €343m 41%
48% USMCA
23% 3%
Asia / 28%
Vehicle 25% Electronic Asia / 19%
Op. margin: 9.8% Systems
Middle East 20%
Solutions Europe Middle East Europe
Op. FCF: €266m Operating result by division* Order backlog by division Global set up
Other
Weapon and Weapon and
R&D: €75m Ammunition Ammunition
Vehicle 21% 1
35% 9 80
Systems 43%
Capex: €166m 5
60% 19% 10
Electronic Vehicle Electronic 5
22%
Headcount: 12,100 Solutions Systems Solutions
Sites per continent
*unconsolidated
Corporate Presentation August 2020 23Defence
Leading technology and market position
Sales driver Structure of Corporate Segments Key Competitor Differentiator
Increasing demand Vehicle Systems Vehicle Systems Reputation as trustful and
for security Tactical Vehicles General Dynamics, reliable company
Logistic Vehicles BAE, KNDS, Scania, International footprint
Geostrategic power Iveco, Hanwha
shifts Broad product portfolio
Weapon and Ammunition Weapon and
Constantly changing Weapon and Munition Ammunition International presence
conflict situations Protection Systems Nammo, Northrop System integrator
Propulsion Systems Grumman, Plasan,
Rising defence/ Eurenco, GD, Kongsberg Modular and open architecture
security budgets Electronic Solutions Electronic Solutions Weapon and sensor
Integrated Electronic Solutions R&S, CAE, Saab, platforms
Air Defence and Radar Systems Thales, Rafael, Elbit Excellent engineering
Technical Publications Systems, Safran, Know-How & capabilities
Hensoldt
Corporate Presentation August 2020 24Defence
Managing the super cycle
Demand for
next generation
1990 Upscaling of systems
forces and
Downscaling Inflection modernization
Return to treaty
of forces and point and territorial
armament NATO
Out of area defence
missions 2% target
2014
Annexation committment
Crimea
Corporate Presentation August 2020 25Defence super cycle
Successful internationalization provides diverse sources of growth
Our home markets
Germany Australia United Eastern
Kingdom Europe
Largest customer Established „home JV with BAE serves Modernization to
Budget increase: market“ „home market“ NATO standards
Commitment to Land 400 program MIV and VJTF participation
1.5% in 2024 as demand driver Challenger LEP IFV tender pipeline
100% Equipment Ammunition program
level framework Ammunition
More personnel contract framework
contract
Corporate Presentation August 2020 26Defence tender overview
High demand could lead to promising super cycle
UK Eastern Europe
MIV Boxer Lithuania: Boxer
Challenger Poland: Leopard II
Hungary: Leopard, Howitzer,
France IFV(wheeled/tracked)
Trucks Czech Rep: IFV (tracked)
MGCS Slovakia: IFV
Germany Bulgaria: IFV (wheeled)
USA Trucks Romania: IFV (wheeled)
Ammunition IDZ Slovenia: APC (wheeled)
Fuzes VJTF Puma
OMFV Load Handling System
Leopards
Heavy transport helicopter
2. Puma lot
2. IDZ lot
International Customers Boxer variants Australia
MENA Ammunition Land 17 1 C.2 Ammo
South-East Asia Fox Land 121 3a, 5b Trucks
Algeria TEN (D-LBO) Land 400 II Boxer CRV
Indirect fire Land 400 III Lynx
Green: booked business / black: potential MGCS Simulation M1
Corporate Presentation August 2020 27German defence
NATO commitment key driver for German demand
Lead role in Very High Readiness Joint Task Force ( VJTF)
Bundeswehr ‘19 ‘23 ‘27 ‘31 ’32+
2016
White paper
04/2018 VJTF´23 1x Division 3x Division 3x Division
Concept VJTF´19 (1 Brigade) (3x Brigade) (8x Brigade) (10x Brigade)
Bundeswehr
09/2018 ~2.200 ~9.000 ~30.000
Capability vehicles vehicles vehicles
profile
100% equipment and digitization
Corporate Presentation August 2020 28German defence budget
Investment expenses and Rheinmetall-share - budgets become sizeable
in €m
Expense increase based on 3 pillars:
More budget, investment share increased
by 36% from 2018 to 2019: if political
8.263 1.5% commitment is to be achieved in
2024 this could lead to €~12 bn
6.011 6.063
investment spend
5.327
5.025
5.419
Rheinmetall More personnel, return to ~200.000
soldiers
avg. 20%-25% share
Rheinmetall More equipment (100% equipment level)
avg. 10%-15% share
NATO and VJTF commitments as
strong drivers for budget increase
2014 2015 2016 2017 2018 2019 2020* 2021* 2022* 2023* 2024*
*based on BMWi GDP forecast Oct. 19; assumption 20% of German defence budget investive
Corporate Presentation August 2020 29German Defence
Additional structural demand of German armed forces
Vehicles
Fox Boxer Trucks Puma Leopard 2
(>500 vehicles) (~150 vehicles) (>10.000 vehicles) (~250 vehicles) (>200 vehicles)
Programs and ammunition
NNBS TLVS/Next Gen. Patriot DLBO TEN Ammunition Military Camps
(Short range air defence) (Tactical air defence) (former MoTaKo) Long term doubling potential Build, operate and rebuild
Corporate Presentation August 2020 30Australia
Successful establishment of a new “home market”
2020
MilVehCoE
Military Vehicle
2018 Center of Excellence
Land 17: 155mm Munition
Framework Contract:
2017 EUR 60m p.a.
Supashock 2018-2023
49% Rheinmetall
„Brain-Trust“ 2022/2023
T
2017 LYNX
2018 Land 400 Phase 3
JV Rheinmetall NIOA
BOXER
Munition 2019 Down selected
Land 400 Phase 2 Delivery exp. 2023-2032
51% Rheinmetall
Delivery 2019 - 2026 EUR 5.6bn
EUR 2.1bn
2013
(SOP Australia 2021)
TRUCKS
LAND 121 Phase 3B / 5B
1st & 2nd order
Delivery 2016-2024,
€2bn & 0.4bn Trucks Boxer
2013 Corporate Presentation August 2020 31United Kingdom - Joint Venture witch BAE
Creating a new “home market” and strengthening our position
LEGACY BUSINESS EXPANSION OF PRODUCT PORTFOLIO
BAE UK business Future
Armoured engineering vehicles and Boxer Mechanized Infantry Vehicle (MIV)
bridge-laying tanks - 500 vehicles @ € 1.4bn
+
AS 90 self-propelled artillery system Challenger 2 Life Extension Program
Force protection components - potential order size 148 MBT @ € 0.8-1.2bn
Services Next generation of battle tanks
- 7.500 MAN vehicles under service
Corporate Presentation August 2020 32System house for land based operations
Integrating components to systems
VJTF
System-of-Systems
System house
Systems Armored Infantryman
Puma Gladius
Platforms
Key Components
Lance turret Protection Ammunition Laser opto-sensoric
Corporate Presentation August 2020 33Total life cycle potential
Platform sales are just the tip of the iceberg – success creates opportunities
1X SALES OF PLATFORM
2X LIFECYCLE SPENDINGS
Rheinmetall creates additional business opportunities
over the entire life cycle of 50 years
Ammunition
Spare parts
Service & Maintenance
Training & Simulation
Technical Documentation
Upgrades (Life time extension)
Corporate Presentation August 2020 34FINANCIALS
Corporate Presentation August 2020 35Ad-hoc summary
Management took action to cope with industry changes
Corona with heavy negative impact on automotive production and demand
Market Global LV production is expected to decline by 21.9%* in 2020
Return to 2019 levels delayed by 3-4 years
Impairment test of Rheinmetall’s Automotive business triggered need for value
Impairment adjustment due to sustainable weakening of mid-term market expectations
Non-cash impairment effect of €300m, almost entirely in the Hardparts division
Announcement of restructuring in Hardparts and Mechatronics
Rightsizing
Restructuring provision of €40m expected in Q3
*IHS 4 August 2020 Corporate Presentation August 2020 36Restructuring details
First measures of restructuring in Automotive communicated
Evaluation of strategic options in the Automotive segment ad-hoc announced July 27th
Total accrual volume of €40m will be booked in Q3 with cash-effect between 2020-22
Hardparts [~€24m]:
Closure of US small bore pistons site until 2022/23
Relocation of production to low-cost countries
Adjustment of capacities to market demand in Brazil, Germany and the Czech Republic
Mechatronics [~€16m]:
Adaptation of capacities
Realignment of structures to reduce dependency on combustion engine
Preparation for new markets: transfer of technology to new applications
Targeted savings of 40 to 50 €m already effective in 2022/23
Corporate Presentation August 2020 37Crisis management with focused activities
Smooth restart from lockdown
Health and safety first! Daily Corona board-reports
Protect our Ensuring protection for our employees 6 CEO letters
Global Corona incident monitoring Hygiene concept was successful
people
Internal communication of measures Low infection rate (Q2 2020 Group: Key financial data
Corona impact overshadowed excellent Defence performance
Sales Operating result and EBIT in €m Earnings per share
in €m Operating margin in % in €
-15.8% -67.3% -439%
1,471 110 1.70
-244 1,239 0.46
-14 26
-78
7.4%
-17% -1% +2% Adjusted EPS
36 Reported EPS
4 0
-72% +4% 0% 2.9%
-302
-5.76
-266
Q2 Oper- FX M&A Q2 Q2 Oper- FX M&A Op. res. Special EBIT Q2 Q2
2019 ational 2020 2019 ational Q2 items Q2 2019 2020
2020 2020
Corporate Presentation August 2020 39Q2 2020 Group: Operating free cash flow
Automotive earnings drop main cause for weak cash flow generation in Q2
Operating free cash flow per quarter
in €m
2016 2019
2017 2020
2018
Low operational performance and impairment
charges, both in Automotive
Q1 Q2 Q3 Q4 D&A inflated by corresponding impairments
Operating free cash flow bridge Opportunistic sourcing in Automotive and
in €m business related increase of NWC in Defence
-79
Strict capex management in Automotive
0 -221
-319 -84
271 -22 11
Q2 EAT D&A Δ Pension Δ WC other Capex Q2
2019 2020 Corporate Presentation August 2020 40Active capex management in both segments
Capital expenditure
in €m
Capex review yields strong cash reduction
Both segments will reduce capex in 2020
Automotive to contribute most with a
reduction between 25 to 30%
H1 Automotive capex already cut by €31m
or 46%
Automotive -25 to
-30%
IFRS 16 peak in 2020
IFRS 16 impact includes non-cash effect of
-10%
Defence
€73m in 2020 after €64m in 2019
Single biggest effect in 2020 results from
long-term lease agreement for
MilVehCoE/Australia of €52m
2020 2020
pre-corona budget target
Corporate Presentation August 2020 41Q2 2020 Group: Group key financials
Balance sheet and financials remain solid after impairment
Equity and Equity ratio Equity ratio Maturity profile Ʃ 1.172
in €m and % Total equity in €m 50 Commercial Paper
208 Other & Leasing
3,000 28.5 30.6 30.3 40 2020 2021 2022 2023 2024 2025 2026ff.
27.9 26.4 Bank loans
2,000 262
20
1,000 1,982 1,990 2,272 2,241 1,848 28 Promissory
250
45 402
73 notes
0 0 122 136
30.06.2019 30.09.2019 31.12.2019 30.03.2020 30.06.2020 250
250 EIB loan
Net financial debt and Net financial debt/EBITDA (LTM) 30.06.2020
in €m and ratio
Net financial debt/EBITDA (LTM)
Net debt
Equity ratio remains on solid level
0
0.81x 0.87x Net debt and KPI with normal seasonality
-52
-249 0.75
-386
-660 -586 Cash on balance €586m
0.07x 0.50
-500
0.46x 0.25 Undrawn credit lines of €0.7bn per end of Q2
0.32x
-1,000 0.00 Investment grade rating with stable outlook
30.06.2019 30.09.2019 31.12.2019 30.03.2020 30.06.2020
Corporate Presentation August 2020 42Q2 2020 Automotive: Highlights
Management implemented extensive and fast-acting saving measures
Summary savings measures
in €m
52
Global measures
Hiring freeze in all Automotive entities
Total Automotive staff reduced by 11%
“Kurzarbeit” savings of €19m
Total: €55m
-153 Country specific measures
-6 Voluntary redundancy programmes
22 -52
Early retirement schemes
Working hour adjustment
33
Operating Change pre- Personnel other Changes at- Operating
result measures equity results result
Q2 2019 Q2 2020
Corporate Presentation August 2020 43Q2 2020 Automotive: Highlights
Fast-acting cost cutting helped Q2 performance
Quarterly sales and margin development Comments on quarterly performance
In €m and %
Smooth restart of production after lockdown
7.2 6.5 6.2
1.7 Sales volumes declined as expected, with sequential monthly
improvement
-15.3 Outperformance of relevant market* by almost 10pp
726 659 637 618 Successful implementation of strict cost measures improved
338 operating leverage to 27%
Q2 Q3 Q4 Q1 Q2
Lower results and opportunistic sourcing burdened OFCF
In €m Q2 2019 Q2 2020 ∆ YTD 2019 YTD 2020 ∆
Order intake 674 353 -47.6% 1,409 796 -43.5%
Sales 726 338 -53.4% 1,440 956 -33.6%
Operating result 52 -52 -200.0% 102 -41 -140.7%
Operating margin in % 7.2% -15.3% -2250 bp 7.1% -4.3% -1140 bp
Special items 1 -300 2 -300
EBIT 53 -352 -764.2% 104 -341 -427.9%
Operating Free Cash Flow 62 -97 -256.5% -14 -146 -942.5%
Operating FCF / Sales 8.5% -28.7% -3720 bp -1.0% -15.3% -1430 bp
Corporate Presentation August 2020 44
*IHS Markit: 4 August 2020; global LV growth adjusted for ChinaQ2 2020 Automotive: Divisional highlights
Dramatic volume decline drove results negative
Sales Automotive Operating result Automotive
in €m in €m
Margin Margin Mechatronics
-200%
-53%
Q2 2019
52
Q2 2020 • Massive volume decline
726 7.2% -15.3%
8.6% 35
Hardparts
407 3.8% 10 • Massive volume decline
-58%
10.2% 9
-78% 2 3.2% • Q2 19 included equipment sales
-2
338 of €14m
-25 -14.3%
172 -171% • Lower at-equity results
252
-52%
-360% -26 -21.2%
122 Aftermarket
92 -26% 68
-4 • Sales more resilient
-24 -23 -52 • Consolidation of micro-mobility
Q2 Q2 Q2 Q2 result
2019 2020 2019 2020
Corporate Presentation August 2020 45Q2 2020 Automotive: Highlights
All end-markets impacted by volume drop
Sales split LV/ Non-LV Sales split Non-LV
in €m / in % in €m / in %
Delta
absolute in %
-53% Diesel -102 -63.8%
726 Gasoline -146 -57.5%
other LV -32 -61.8%
160 -41%
260 LV Business -280 -60.2%
LV: Truck -68 -57.8%
64% 254 117 Large Bore -8 -33.4%
338 153 other -7 -25.0%
52 58 23 Aftermarket -24 -26.3%
LV: 49
108 55% 28 15
20 21
260 Non-LV Business -107 -41.2%
92
153 68
Q2 Q2 Q2 Q2
2019 2020 2019 2020
Corporate Presentation August 2020 46Q2 2020 Automotive: China performance
Sales recovery and positive margin development
Sales* Comments on the quarter
in €m
+3%
271 280
13 -4 Sales increase of +3% compares to a market
248
recovery of 9% (IHS Markit 4 August, 2020)
239
32 31 Sales development held back by customer mix
Q2 Oper- FX Q2
2019 ational 2020
All plants operational, business activity
EBIT* approaching 100% pre corona level
in €m
+31%
21 EBIT further recovered
16 5 0
21 JV EBIT margin increased from 6.8% to 8.3%
16
0 0
Joint Venture
Wholly owned foreign
Q2 Oper- FX Q2 enterprise
2019 ational 2020
*Including 100% figures of 50/50 JV, consolidated at equity Corporate Presentation August 2020 47Q2 2020 Automotive: Regional sales split
Automotive with stronger performance in Europe and USMCA
-45%
Regional sales
in % vs. IHS Global IHS
LV production +9%
-62% -53% -7%
Q2 19 Q2 20 -48%
-62% +3%
JV JV
Relevant
Q2 19 Q2 20 Q2 19 Q2 20 Q2 19 Q2 20 Q2 19 Q2 20
global IHS
Germany China**
LV production*
-66% -55% -69% -57%
Q2 19 Q2 20
-53%
Automotive
sales
Q2 19 Q2 20 Q2 19 Q2 20 Q2 19 Q2 20 Q2 19 Q2 20
Europe (excl. Germany) USMCA
Greyish columns: IHS global LV production, 04/08/20 Q2 19 Q2 20
Blueish columns: Automotive consolidated Q2 sales
Corporate Presentation August 2020 48
*IHS data adjusted for China volumes to match Automotive regional sales split; ** China Total Management ViewQ2 2020 Defence: Highlights
Outstanding performance
Quarterly sales and margin development Comments on quarterly performance
In €m and % Resilient demand environment
1,324
15.8 Order intake above expectations
823 901
746 740 Strong sales and operating result increase driven by WA and VS
10.3
8.1
including early deliveries at customer request and unplanned sales
7.8 3.9 for medical protection equipment
Q2 Q3 Q4 Q1 Q2 OFCF declined on higher business activities and increased capex
In €m Q2 2019 Q2 2020 ∆ YTD 2019 YTD 2020 ∆
Order intake* 501 752 50.1% 1,065 1,483 39.2%
Sales 746 901 20.8% 1,375 1,641 19.3%
Operating result 60 93 55.0% 69 122 76.8%
Operating margin in % 8.1% 10.3% 220 bp 5.0% 7.4% 240 bp
Special item -2 -2 -2 -2
EBIT 58 91 56.9% 67 120 79.1%
Operating Free Cash Flow -131 -141 -7.6% -224 -293 -30.8%
Operating FCF / Sales -17.6% -15.7% 190 bp -16.3% -17.9% -160 bp
*Order intake is reported on the basis of booked business
Corporate Presentation August 2020 49Q2 2020 Defence: Divisional highlights
Favorable volume growth and product mix
Sales Defence Operating result Defence
in €m in €m
Margin Margin Weapon & Ammunition
Q2 2019 Q2 2020 • Early shipment on customer
+21% 55%
request helped Q2
901 8.1% 93 10.3%
• Unplanned first deliveries of PPE*
746 278 30 10.9%
34%
207
200% Electronic Systems
60 • Solid sales driven by VJTF and
224 4.7% 18
202
11% 10 8.2% Gladius projects
6%
8.5% 17
18%
Vehicle Systems
457
389
33
46%
48
10.5% • Strong tactical vehicle sales
8.5%
• Ramp-up of Boxer projects
-51 -57 0 -4
Q2 Q2 Q2 Q2 *Personnel protective equipment
2019 2020 2019 2020
Corporate Presentation August 2020 50Q2 2020 Defence: Order overview
Stronger than expected order intake
Order intake by division Order backlog profile
in €m in €m
+22%
+50%
1,786 96 10,125
752
-64
8,307
295
501 €1,8bn €2,1bn €6,2bn
102
265
Weapon and Ammunition
69
411 Electronic Solutions
Vehicle Systems
199
Consolidation
-31 -56
Q2 Q2 30.06. Oper- FX M&A 30.06. 2020e 2021e 2022e ff.
2019 2020 2019 ational 2020
Corporate Presentation August 2020 51Logistic vehicles – a success story
German framework contract for 2.000 load handling systems with first order
Total Framework value* Thereof already* Remaining order potential
delivered €0.5bn
€4.2bn booked €0.6bn €3.1bn
Germany: €2.4bn
Others: €0.7bn
2021 2022 2023 2024 2025 2026
* As of 30 June 2020 Corporate Presentation August 2020 52Stronger than average first half helps to meet FY guidance
Sales Distribution
in €m
H2 +6% +7%
H1
3,522
3,221 Stronger than average first half 2020 (+19%)
H2 H2
Customer induced shift of sales into Q2 at the
-3% -1%
2,147 expense of Q3
1,958 (61%)
(61%) Confirmation of FY sales growth of 6-7% guidance
H1
implies weaker H2 y-o-y
+19%
FY growth still backend loaded driven by high Q4
1,641 1,641 sales volume in Division WA
1,263 1,375
(44%) (44%)
(39%) (39%)
2018 2019 2020e (min) 2020e (max)
Corporate Presentation August 2020 53OUTLOOK
2020
Corporate Presentation August 2020 542020 Guidance update
Trading update FY 2020 Guidance
Sales decline of ~15% in Q3 with Management still refrains to provide a detailed
AUTOMOTIVE
an operating leverage expected Automotive FY guidance. Automotive is currently
around 30% targeting an operating result corridor between
€-30m and break-even, if current circumstances do not
change substantially (e.g. no additional lockdown or
comparable business disruption and no material change
in IHS growth assumptions* for H2)
Second half on the level of last Guidance specified:
DEFENCE
year’s strong performance sales growth expectation of 6-7% and
operating margin around 10%
*as of 4 August 2020
Corporate Presentation August 2020 55Appendix
Corporate Presentation August 2020 56Sustainability
Path to CO2 neutrality already started 2040
CO² neutral
2020 - 2040
2021 Milestone plan re
Reporting CO2 neutrality
analogous to 3 years increments
2023
UN Global
CDP
2020 Compact
2017 GRI-Report 2022
First CSR ratings selection TCFD (Task Force on Climate-related Financial
MSCI: BBB 2020 Disclosures)
ISS-oekom: D Report on contribution to
2017 Sustainalytics: 51 Sustainable Development Goals
2015 First CSR 2020
First non Report Triple Bottom Line
financial data
2014 2018 2019
Global compliance Statement on Updated CSR ratings selection
organisation white MSCI: AA
phosphorous ISS-oekom: D+
2009 ammunition Sustainalytics: 60
Statement on cluster
munition and anti-
personnel landmines Corporate Presentation August 2020 57Sustainability
ESG @Rheinmetall
E
Automotive Product portfolio actively reduces CO² emission
2040 Reduction energy intensity (MWh/EUR m revenue) 2015: 229,4 | 2019: 157,2
Reduction THG intensity (tCO2/EUR m revenue) 2015: 101,2 | 2019: 65,7
CO2 Revenue coverage ISO 14001 72,4 %
Revenue coverage ISO 50001 84,4 %
neutral Environmental issues | Part of Business Partner Check
S
Transparency in the Supply Chain | Suppliers EU-registered: PM: ~ 60 % and NPM: ~ 56 %
Human Rights | In-house DD 2019 as per DIHR| Part of Business Partner Check since 2019
Social Health & Safety | ISO 45001 | 14 companies certified
Responsible Diversity | Goals 2020-2025 | Women in management development programs
Corporate Citizenship | Sponsoring 2019: EUR 876k | Donations 2019: EUR 486k
G
Compliance Management System - IDW PS 980 approved | Extensive training
Robust Data Privacy | Set-up of network infrastructure as part of CMS
Strict regime | 2019: 33.529 entries in War Weapons Book | 104 export licenses german weapons of
Governance war control act (KWKG)| 752 export licenses Foreign Trade and Payments Ordinance (AWG)
Product responsibility
Model Reporting | Contribution to SDGs & GRI Reporting | Annually from 2020 onwards
CSR Ratings | 10 agencies
Corporate Presentation August 2020 58Active board remuneration schemes
Current and new remuneration policy for contracts starting in 2020
Current policy New policy
100% annual target salary
100% annual target salary
Fixed annual remuneration Fix 39% 33%
Fixed annual remuneration
Fix over 12 months,
60% over 12 months, 60%
including fringe benefits including fringe benefits
financial targets (EBT, ROCE)
EBT 50% STI & non-financial targets
ROCE 50%
STI 1) 27% 22% (e.g. strategy implementation and sustainability) STI 1)
Threshold ≤70% 100% ≥110% STI x
40% Threshold ≤80% 100% ≥120% 40%
Variable performance payment
Payout (linear) 0% 100% 200%
Variable performance payment
Modifier Payout 0% 100% 250%
(cap) (+/- 20 %)
(cap w/o Modifier)
3 years ØEBT ØEBT ØEBT x Factor I 3 years ØEBT (100% at €500m, cap at €750m) 50%
(100% at €200m, cap at €300m) (individual factor)
Individual factor II TSR vs peer performance (adj. TSR MDAX) 50%
LTI x +
Payout Ø last 12 months (div. adjusted) TSR vs adjusted
(50% shares (4 years deferred) +50% cash + 34% 45% MDAX; ranking of companies by percentile; payout LTI
Factor calculated by base LTI value multiplied by % linked
20% of share value in cash) TSR
to percentile performance
Percentil 0 50 75
Special bonus in exceptional cases at the Payout (linear) 0% 100% 150%
discretion of the supervisory board Special bonus (50% shares (4 years deferred) + 50% cash + 20% of shares additionally in
cash)
Annual report 2019, p. 144-155 100% total
1) Calculated on target achievement 100% active
compensation 1) Corporate Presentation August 2020 59European Defence
Consolidation landscape Governmental shareholding restricts room
for cross-border consolidation
Big common armament programs could be
catalysts for further consolidation
49.9%
Kongsberg
Nammo
50% Rheinmetall’s approach:
Patria
Saab
JV partnerships with companies in different
Cobham
nations instead of “putting all eggs in one
BAE Systems Chemring Rheinmetall PL RO HUN CZ basket”
KMW/Nexter
Thales RUAG Sufficient organic growth potential, but
suitable M&A transactions are possible
Oto Melara
Aselsan
25% state-owned Rheinmetall
Corporate Presentation August 2020 60Our capital allocation policy is geared towards further growth
Funding of growth (organic and M&A)
9.4%
Dividend to shareholders (Payout ratio 30-35%)
Q3 ‘19 level
(target level
Improvement of pension funding via CTA 50-60%)
Corporate Presentation August 2020 61Group 2015 – 2019
Key figures (as reported)
in €m 2015 2016 2017 2018 2019
Balance Sheet Total assets 5.730 6.150 6.101 6.759 7.415
Shareholder's equity 1.562 1.781 1.870 2.173 2.272
Equity ratio (in %) 27,3 29,0 30,7 32,1 30,6
Pension liabilities 1.128 1.186 1.080 972 1.169
Net financial debt -81 19 230 -30 -52
Net financial debt / EBITDA 0,17 -0,03 -0,37 0,04 0,07
Net gearing (in %) 5,2 -1,1 -12,3 1,4 2,3
Income Sales 5.183 5.602 5.896 6.148 6.255
statement Operating result 287 353 400 491 505
Operating margin (in %) 5,5 6,3 6,8 8,0 8,1
EBITDA 490 581 626 836 792
EBIT 287 353 385 518 512
EBIT margin (in %) 5,5 6,3 6,5 8,4 8,2
EBT 221 299 346 485 477
Net income 160 215 252 354 354
Earnings per share (in EUR) 3,88 4,69 5,24 7,10 7,77
Dividend per share (in EUR) 1,10 1,45 1,70 2,10 2,40
ROCE (in %) 10,6 12,3 13,8 17,1 15,4
CF statement Free cashflow from operations 29 161 276 -35 314
Headcount Employees (Dec. 31) according to capacity 20676 20993 21610 22899 23780
Corporate Presentation August 2020 62Segments 2015 – 2019
Key figures
Automotive Defence
2015 2016 2017 2018 2019 in €m 2015 2016 2017 2018 2019
2.621 2.670 2.922 2.888 2.705 Order intake 2.693 3.050 2.963 5.565 5.186
445 458 520 478 447 Order backlog (Dec. 31) 6.422 6.656 6.416 8.577 10.399
2.592 2.656 2.861 2.930 2.736 Sales 2.591 2.946 3.036 3.221 3.522
216 223 249 262 184 Operating result 90 147 174 254 343
8,3 8,4 8,7 8,9 6,7 Operating margin (in %) 3,5 5,0 5,7 7,9 9,8
335 356 367 421 348 EBITDA 175 239 268 403 450
216 223 227 266 186 EBIT 90 147 172 247 341
8,3 8,4 7,9 9,1 6,8 EBIT margin (in %) 3,5 5,0 5,7 7,7 9,7
167 149 154 161 143 Capex 96 95 89 101 166
96 105 106 26 73 OFCF -38 103 238 -29 266
10.934 10.820 11.166 11.710 11.405 Employees (Dec. 31) according to capacity 9.581 10.002 10.251 10.948 12.100
1.450 1.499 1.621 1.664 1.525 Sales 881 1.111 1.175 1.056 1.018
Weapon &
118 140 176 171 118 Mechatronics Operating Result 73 108 117 121 123
Ammunition
8,1% 9,3% 10,9% 10,3% 7,7% Margin 8,3% 9,7% 10,0% 11,5% 12,1%
952 921 968 988 937 Sales 759 745 691 839 948
Electronic
73 62 60 65 28 Hardparts Operating Result 12 25 20 46 75
Solutions
7,7% 6,7% 6,2% 6,5% 3,0% Margin 1,5% 3,4% 2,9% 5,5% 7,9%
285 319 358 367 361 Sales 1.195 1.392 1.480 1.568 1.787
Vehicle
27 29 33 36 35 Aftermarket Operating Result -9 29 53 108 150
Systems
9,5% 9,1% 9,2% 9,7% 9,8% Margin -0,8% 2,1% 3,6% 6,9% 8,4%
Corporate Presentation August 2020 63Continuing ROCE improvement
ROCE
in %
25%
20.2% 19,6%
20% 19.0% 18.8% 18.7%
16.7% 17.1%
15.9% 15,4%
15% 12.3% .13,4% 13,1%
9.8% 11.8% 11,0 % Group
10.7% 10.6%
10%
6.1%
4.7%
5% 3.9%
0.3%
0%
-5% -4.6%
2013 2014 2015 2016 2017 2018 2019
Group Defence Automotive
Corporate Presentation August 2020 64Next events and IR contacts
Next Events IR Contacts
Bankhaus Lampe Deutschlandkonferenz Dirk Winkels
All investor meetings Head of IR
Commerzbank Corporate Conference will be conducted as Tel: +49-211 473-4749
telephone conferences Email: dirk.winkels@rheinmetall.com
Morgan Stanley Industrials CEOs unplugged
René Weinberg
UBS Quo Vadis Investor Trip 2020 Senior Investor Relations Manager
Berenberg u. Goldman Sachs German Corporate Conference Tel: +49-211 473-4759
Email: rene.weinberg@rheinmetall.com
Q3 2020 Earnings call 6 November 2020
Rosalinde Schulte
Investor Relations Assistant
Tel: +49-211 473-4718
Email: rosalinde.schulte@rheinmetall.com
Quick link to documents
Corporate Presentation Interim Reports Annual Reports
Corporate Presentation August 2020 65Disclaimer
This presentation contains “forward-looking statements” within the meaning of the US Private Securities Litigation Reform Act of 1995 with respect to Rheinmetall’s
financial condition, results of operations and businesses and certain of Rheinmetall’s plans and objectives. These forward-looking statements reflect the current views of
Rheinmetall’s management with respect to future events.
In particular, such forward-looking statements include the financial guidance contained in the outlook for 2020.
Forward-looking statements are sometimes, but not always, identified by their use of a date in the future or such words as “will”, “anticipates”, “aims”, “could”, “may”,
“should”, “expects”, “believes”, “intends”, “plans” or “targets”. By their nature, forward-looking statements are inherently predictive, speculative and involve risk and
uncertainty because they relate to events and depend on circumstances that will occur in the future. There are a number of factors that could cause actual results and
developments to differ materially from those expressed or implied by these forward-looking statements. In particular, such factors may have a material adverse effect on
the costs and revenue development of Rheinmetall. Further, the economic downturn in Rheinmetall’s markets, and changes in interest and currency exchange rates, may
also have an impact on Rheinmetall’s business development and the availability of financing on favorable conditions. The factors that could affect Rheinmetall’s future
financial results are discussed more fully in Rheinmetall’s most recent annual and quarterly reports which can be found on its website at www.rheinmetall.com.
All written or oral forward-looking statements attributable to Rheinmetall or any group company of Rheinmetall or any persons acting on their behalf contained in or
made in connection with this presentation are expressly qualified in their entirety by factors of the kind referred to above. No assurances can be given that the forward-
looking statements in this presentation will be realized. Except as otherwise stated herein and as may be required to comply with applicable law and regulations,
Rheinmetall does not intend to update these forward-looking statements and does not undertake any obligation to do so.
This presentation does not constitute an offering of securities or otherwise constitute an invitation or inducement to any person to underwrite, subscribe for or otherwise
acquire or dispose of securities in Rheinmetall AG or any of its direct or indirect subsidiaries.
Rheinmetall AG and its affiliates are neither associated with nor provide any support to American Depository Receipts programmes (ADR) or comparable offerings or
investment schemes related to shares in Rheinmetall AG in the United States of America or any other jurisdiction. Therefore, neither Rheinmetall AG nor any of its
affiliates has and or will accept any responsibility or liability whatsoever in relation to such ADR programmes or comparable investment schemes.
Corporate Presentation August 2020 66You can also read