Roadshow Presentation - Q1 2018 Released on April 25, 2018
←
→
Page content transcription
If your browser does not render page correctly, please read the page content below

Roadshow
Presentation
Q1 2018
Released on April 25, 2018

Table of contents

        1. Latest Results                                                                                    3
        2. Overview and Strategy                                                                             14
        3. Market Overview                                                                                   24
           - Household Care                                                                                  25
           - Food & Beverages                                                                                28
           - Bioenergy                                                                                       30
           - Agriculture & Feed                                                                              34
           - Technical & Pharma                                                                              40
        4. Sustainability                                                                                    41
        5. Financials and Governance                                                                         46

22   Latest Results • Overview and Strategy • Market Overview • Sustainability • Financials and Governance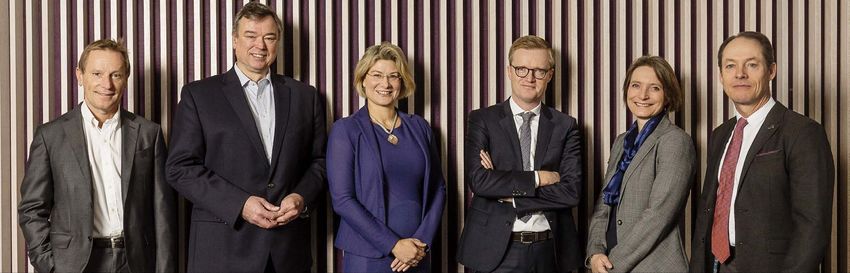
Highlights
                                                                               Distribution of sales & organic growth, Q1 y/y
Q1 sales in line with expectations; strong margins
                                                                                                   -10%
• Organic sales growth                      +2%
                                                                                                     6%
                                                                                       -5%
• Largest industries growing                                                                 15%                        +1%
                                                                                                                  33%
  • Household Care                          +1%
  • Food & Beverages                        +5%
                                                                                          18%
  • Bioenergy                               +9%                                     +9%
  • Agriculture & Feed                      -5%
                                                                                                          28%
  • Technical & Pharma                      -10%                                                                   +5%

                                                                                  Household Care                   Food & Beverages
• Q1 2018 as expected overall. Household Care slightly higher, Agriculture &
                                                                                  Bioenergy                        Agriculture & Feed
  Feed somewhat lower
                                                                                  Technical & Pharma
• Negative currency impact on sales of close to 8%. USD/DKK -13%
• Strong EBIT margin at 28.9% despite currency headwind                                         Reported EBIT margin
• Healthy pipeline with many near-to-market opportunities and product
                                                                                                                         28,9%
  launches expected during the year

2018 outlook maintained on all parameters                                                                 27,0%
                                                                                          26,3%
• Q1 in line to reach full-year 4-6% organic sales growth
• All segments expected to contribute to organic sales growth
• EBIT margin ~28%. Step-up in activity level
                                                                                          Q1'16           Q1'17          Q1'18

3
Organic sales growth by geography

                                 -3%
                                  Q1 y/y

                                                            +13%
       +1%
         Q1 y/y
                               36%                             Q1 y/y
                               of sales

    33%                                                    22%
                                                            of sales
    of sales

                    +1%
                      Q1 y/y

                  9%                       +6%      35%
                                                    Emerging markets
                  of sales                 Q1 y/y
                                                                  65%
                                                     Developed markets
                                                                         +0%
                                                                         Q1 y/y

4
Household Care
                                                                                                                              33%
                                                                                                                              of sales

Sales in Household Care slightly better than expected                                  Quarterly y/y organic sales growth

• Organic growth Q1 2018 y/y +1%                                                                             4%
• Mixed performance in laundry; soft start in developed markets offset by good
  development in emerging markets                                                        1%        1%                           1%
• China, Southeast Asia and India delivered solid growth
• Global customers continue to focus on cost optimizations
• Strong growth in dishwash with new innovation targeting dried-in cereals
                                                                                                                       -3%
                                                                                        Q1'17     Q2'17     Q3'17     Q4'17    Q1'18
Top 20 customers, emerging markets and rollout of our freshness &
hygiene platform remain top priorities in 2018
• The freshness & hygiene platform is being rolled out as planned and is expected to
  contribute to growth in the second half of 2018
• Emerging markets a top priority, supporting solid growth
• Tailored approach for top 20 customers will continue

5
Food & Beverages
                                                                                                                           28%
                                                                                                                           of sales

Solid start to the year supported by recent product innovation                     Quarterly y/y organic sales growth

and focused sales efforts                                                                                11%
                                                                                                10%
• Organic growth Q1 2018 y/y +5%                                                                                    9%
• Solid growth across all major industry segments                                     6%
                                                                                                                             5%
• Baking performed well despite reduced prices in North America. US
  Freshkeeping patent expired in March 2018. Strong growth in Asia Pacific and
  Latin America
• Nutrition performed well, supported by our Saphera® product for lactose
                                                                                    Q1'17     Q2'17     Q3'17      Q4'17    Q1'18
  reduction in dairy
• Starch delivered solid growth across markets
• Beverages flat compared to last year, distilling growth balanced by brewing
  decline

2018 priorities and new initiatives
• Leverage new baking lab in Turkey to pursue opportunities for baking customers
  in the Middle East and Africa
• Continued up-manning in 2018; focus on emerging markets
• Newly launched innovation for vegetable-oil processing and grain milling
  contributing positively to sales growth in 2018 from a low base

6
Bioenergy
                                                                                                                                 18%
                                                                                                                                 of sales

Continued good momentum in enzymes for biofuels                                           Quarterly y/y organic sales growth

• Organic growth Q1 2018 y/y +9%
• US and global ethanol production estimated to have been flat in Q1 2018. Producer
                                                                                                                16%
  margins are improving but inventories remain elevated                                                                   14%
• Good growth in enzymes for conventional biofuel across all geographies                               8%                          9%
                                                                                            6%
• Newly launched yeast product, Innova® Drive, well received by the market

                                                                                           Q1'17     Q2'17     Q3'17     Q4'17    Q1'18
Bioenergy priorities and market trends in 2018
• Continued strong focus on tailoring process-specific solutions to individual customer
  needs
• New innovation expected to be delivered during 2018
• US ethanol exports up. Potential trade conflict creates some uncertainty
• Our expectations are based on current political conditions
  • Mandates could drive volumes in China and Brazil
  • Opportunities, as well as uncertainties, to US biofuel policies

7
Agriculture & Feed
                                                                                                                            15%
                                                                                                                            of sales

Soft start due to comparisons and poor farm economics                               Quarterly y/y organic sales growth

• Organic growth Q1 2018 y/y -5%                                                                           8%

• Sales to animal feed ended down as expected due to tough comparisons                 2%
• BioAg sales decreased following continued poor farm economics and new import
  tariffs on pulses in India
                                                                                                                             -5%
• Registrations obtained for                                                                                         -7%
  • Acceleron® B-360 ST
                                                                                                -16%
  • Alterion®, our first probiotic product for poultry, in all main regions
                                                                                     Q1'17     Q2'17     Q3'17      Q4'17   Q1'18

Strong focus on innovation and market expansion
• Strong pipeline development, new products and regional expansion in BioAg drive
  long-term growth
• New innovation expected in animal health & nutrition later this year
• Production and shipments of Acceleron® B-360 ST will commence in second half
  of 2018 as planned

8
R&D update

             Innova® Drive – improving ethanol yield through faster fermentation
             Our first launch within yeast for conventional biofuels that enables faster
             fermentation and works well under acidic and high-temperature conditions
             Innova® Drive enables leverage of our market-leading position within enzymes
             to perfectly match yeast and enzymes

             Licheninase – new enzyme class for automatic dishwash
             Novozymes has developed a novel enzyme class: a third enzyme class for
             automatic dishwash. This enzyme targets tough soiling such as dried-in cereals,
             solving an everyday consumer challenge

9
Q1’18 financials

Sales as expected; strong margins
• Overall sales growth as expected                                                         Key financials         Realized   Realized
                                                                                           (DKKm)                  Q1’18      Q1’17
• Largest industries growing
• 6% organic sales growth in emerging markets                                              Organic sales growth     2%         3%
• Negative currency impact of ~8% on sales, mainly from weak USD/DKK at -13%
                                                                                           Currency impact on
• EBIT margin solid at 28.9% despite negative currency impact. On par with Q1 2017         sales
                                                                                                                   ~ -8%      +1%
  excluding reorganization costs
• Net profit growth of 5% driven by higher EBIT, hedging gains, lower provision for SARs   Gross profit margin     57.8%      57.8%
  and lower tax rate
                                                                                           EBIT margin             28.9%      27.0%
• Free cash flow impacted by timing in working capital
                                                                                           Net profit growth        5%         4%

                                                                                           Net investments
                                                                                                                    281        271
                                                                                           excl. M&A

                                                                                           Free cash flow
                                                                                                                    403        738
                                                                                           excl. M&A

                                                                                           ROIC incl. goodwill     25.2%      24.9%

10
2018 outlook
Guidance maintained on all parameters
• Organic sales growth expectation of 4-6% with growth from all segments Key financials Realized Outlook
(DKKm) Q1’18 2018
• As communicated in February 2018, sales growth in the first half expected to
be slower than in the second half of the year Organic sales
2% 4-6%
growth
• EBIT margin ~28%. Step-up in activity level as we move through the year.
Currency headwind easing through the year based on current spot rates EBIT margin 28.9% ~28%
• Free cash flow excl. M&A at DKK 2.3-2.6bn. Lower net investments relative to
2017 Net profit growth 5% ~0%
Net investments
281 1,300-1,500
excl. M&A
Free cash flow
403 2,300-2,600
excl. M&A
ROIC incl. goodwill 25.2% 24-25%
11Summary
• On track to deliver 4-6% organic sales growth for the
full year
• Delivering on key strategic initiatives
• Strong innovation agenda with many near-to-market
opportunities
12Our business is about turning amazing science into sustainable biological answers in a growing world
6,500 2nd 48% 76 million
More than 6,500 active and In 2017, Science Magazine Market leader in industrial In 2017, our customers
pending patents ranked Novozymes the enzymes with an estimated avoided an estimated 76
world’s second-best science 48% of the global enzyme million tons of CO2 by
employer market in 2017 applying our products
⅓ sales 8 new
in EM 13% products 6,200
Roughly ⅓ of sales of our revenue is reinvested In 2017, we launched eight More than 6,200 employees
generated in emerging in R&D new impactful products on six continents
markets
13Overview and Strategy
Novozymes at a glance
 World leader in Bioinnovation                                                                                Company background
                       Global presence                                                                        Listed                       2000
                          • ~6,300 employees
                                                                                                              Ticker                       NZYM B
                          • ~700 products sold in 140 countries
                          • Major production footprint in 3 regions                                           Exchange                     Nasdaq Copenhagen

                        Market leader
                          • ~48% Novozymes
                          • Serving +40 different end markets

                       R&D focused                                                                             5 years of organic growth & EBIT
                          •   ~1,400 people employed in R&D
                          •   ~6,500 patents
                          •   ~ 13% of sales invested in R&D                                                        +7%        +7%       +4%        +2%    +4%
                                                                                                                                                                    32%
                          •   Innovation focused on enzymes and microbes                                                                                            31%
                                                                                                                           EBIT margin
                                                                                                                                                  14.142   14.531   30%
                        Solid financials (2017)                                                                                          14.002
                                                                                                                                                                    29%
                          • USD 2.4bn in sales                                                                                 12.459

                                                                                                             DKKm
                                                                                                                    11.746                                          28%
                          • ~28% EBIT margin
                                                                                                                                                                    27%
                          • ~25% ROIC
                                                                                                                                                                    26%
                                                                                                                                                                    25%
                       Majority owner Novo Holdings                                                                                                                 24%
                          • Controls ~25.5% of the capital                                                                                                          23%
                          • ~70% of the votes                                                                                                                       22%
                          • 2 seats on the Board of Directors                                                       2013        2014     2015       2016   2017

15   Latest Results • Overview and Strategy • Market Overview • Sustainability • Financials and Governance
Experienced leadership team
– with 22 years seniority on average
Thomas Peder Prisca Anders Tina Andrew
Videbæk Holk Nielsen Havranek-Kosicek Lund Fanø Fordyce
COO & Executive Vice President, CEO & President CFO & Executive Vice President, Executive Vice President, Executive Vice President, Executive Vice President,
Research, Innovation & Supply Novozymes since 1984 Finance, IR, IT & Legal Household Care & Agriculture & Bioenergy Food & Beverages
Novozymes since 1988 Novozymes since 2018 Technical Industries Novozymes since 1993 Novozymes since 1993
Novozymes since 1999
16 Latest Results • Overview and Strategy • Market Overview • Sustainability • Financials and GovernanceUniquely diversified group
- creates synergies and opportunities
Household Care Food & Beverages Bioenergy Agriculture & Technical &
Feed Pharma
Laundry detergents, Baking, Starch to syrups, Conventional biofuels Animal feed Textile & leather, Pulp &
Dishwash detergents, Brewing & alcohol, Healthy Cellulosic biofuels Animal health paper, Wastewater
Cleaning products concepts BioAgriculture
32% of sales
28% of sales
18%of sales
15% of sales
7%
of sales
Organic growth, average Organic growth, average Organic growth, average Organic growth, average Organic growth, average
9%
~3% ~5% 9%
~7% ~7% ~7% 13%
19% 19%
12% 11% 9%
5% 7%
4% 4% 5% 5% 6% 6%
3%
2% 2% 2%
1% 1%
-5% -3% -3%
2013 2014 2015 2016 2017 2013 2014 2015 2016 2017 2013 2014 2015 2016 2017 2013 2014 2015 2016 2017 2013 2014 2015 2016 2017
17 Latest Results • Overview and Strategy • Market Overview • Sustainability • Financials and GovernanceSolid financial track record driven by innovation
17 years of innovation driven growth
30% 16.000
28%
26% 14.000 Strong performance since
24% 2000
22% 12.000
• ~3x Sales
20% • ~5x EBIT
10.000
18% • ~6x Net Profit
16% • DKK ~26bn in FCF
8.000
14%
12%
6.000 Innovation is the core
10%
8% • DKK ~22bn spent on R&D since
4.000 IPO
6%
• +100 new product launches
4% 2.000 • Close to 600bps in gross margin
2% expansions mainly through
0% 0 productivity improvements
Sales DKKm EBIT margin R&D/Sales ROIC
18 Latest Results • Overview and Strategy • Market Overview • Sustainability • Financials and GovernancePriority innovation platforms
Arrows denote progress to next phase over the past 12 months
19 Latest Results • Overview and Strategy • Market Overview • Sustainability • Financials and GovernanceOur global business serves a large number of local markets
and industries
36%
EMEA
NZ: HQ, Production R&D
Main markets: HHC, F&B, Feed
Acc CAPEX: ~ DKK 6.9bn
FTE’s: ~2,900
5Y Avg growth: +5%
20%
34%
ASIA PACIFIC
NORTH AMERICA NZ: Production, R&D
NZ: Production, R&D Main markets:
Main markets: F&B, HHC, Tech & Feed
Acc CAPEX: DKK ~2,8bn
Bioenergy, HHC, F&B, BioAg 10% FTE’s: ~1,800
Acc CAPEX: ~DKK 4bn
FTE’s: ~1,300 5Y Avg growth: +4%
5Y Avg growth: +4%
LATIN AMERICA
NZ: Production
Main markets: HHC,
Feed, BioAg & F&B
Acc CAPEX: ~DKK 400m
Main sites with production and R&D
FTE’s: ~350
5Y Avg growth: +6%
Satellite production site
Satellite R&D site
Percentage of total sales (2017)
20 Latest Results • Overview and Strategy • Market Overview • Sustainability • Financials and GovernanceOur set of competitive advantages across the value
chain has led to a unique market leading position
Scale Quality Sustainability High barriers
• Production: 5 core plants • Superior logistical agility • Sustainability is in our • Unique market-leading
in 3 regions due to full control of value DNA helping our position in a global niche
chain customers to save an
• Novozymes’ R&D • Strong technology
investment equals 2/3 of • Ability to tailor solutions estimated 76 million tons backbone and
total industry investments to specific customer and of CO2 (2017) competences
market needs • Triple bottom line
• Technical services: half of • More than 6,500 patents
commercial organization • First mover in a number • Pioneering life cycle • Diverse biotech know how
“on site” of markets lead by ability assessment and investments needed
to innovate documentation
• Market & technology to compete
coverage • High quality products that
• Long term trusted partner
meet regulatory
for our customers
requirements
• Extensive know-how and
• Wide range of solutions manufacturing expertise
and product offerings
21 Latest Results • Overview and Strategy • Market Overview • Sustainability • Financials and GovernanceDeveloping new technology and
business platforms
Continued development …creates opportunities to
in our technology base… develop new business platform
Molecular biology
Strain development using protein
engineering, genetic modification, DNA
sequencing, etc
Bio-
Yeast
Agriculture
Bio-informatics & Systems biology
Application of computer algorithms in the
computational discovery of enzymes in DNA Vegetable Freshness
databases oil Water &
processing hygiene
Screening systems
Application of high-throughput robotics to Grain Sugarcane
find the best enzyme candidates milling platform
Industrial-scale fermentation
Production of enzymes and proteins whilst
continuously optimizing and improving
yields
22 Latest Results • Overview and Strategy • Market Overview • Sustainability • Financials and GovernanceEnzyme technology improves Novozymes’ profitability
3 ways to gain productivity improvements:
Novozymes dedicates 10-15% of R&D spend to productivity improvement programs
Purification
Raw materials
Fermentation
Enzymes
Formulation
Micro-organisms
1 2 3
Improve production strain Optimize industrial production Improve enzyme efficacy
Ability to produce more enzymes Process optimization Protein engineering of enzymes
per m3 fermentation tank through Equipment optimization improves efficacy. Customers buy
genetic engineering of host Input optimization efficacy, not volume
organism
23 Latest Results • Overview and Strategy • Market Overview • Sustainability • Financials and GovernanceMarket Overview
Household Care overview
                                                                                                                                                32%
                                                                                                                                                of sales

                                           Business Characteristics

•    Mainly laundry detergents but expanding into dishwash                                                   5 year organic growth
                                                                                                              +9%       +4%      +1%    +2%      +1%
•    Top three detergent producers make up ~50% of the global market; top 20 at
     ~80%                                                                                                    Sales in DKKm              4.702    4.717
                                                                                                                                4.632
•    Developed markets ~2/3 of global market
                                                                                                                       4.353
Key industry trends                                                                                           4.222
• Growth in the liquid and unit dose market, driven by consumer convenience and
     stronger investments in these categories
• Rising demand for solutions tailored to emerging-market needs such as hot and
     humid conditions and demand for mild hand-washing alternatives                                           2013     2014     2015    2016     2017
• Certain global customers under pressure leading to formulation changes

                                                                                                              Applications
Product launches 2017
                                                                                                              • Laundry detergents (+85%)
• Medley® 2.0 – The second generation of our multienzyme solution for laundry
    detergents ensuring strong and stable wash performance                                                    • Automatic dishwash
• Progress® excel – A new premium liquid detergent enzyme that enables                                        • Hand dishwash
    superior wash performance at all temperatures                                                             • Professional cleaning
• Progress® In – A new enzymatic solution to help detergent producers in                                      NZ market share
    emerging markets develop better detergents                                                                • >60%
• Freshness & hygiene – First groundbreaking solution from the freshness &
                                                                                                              Competition
    hygiene platform in Household Care
                                                                                                              • Dupont

25   Latest Results • Overview and Strategy • Market Overview • Sustainability • Financials and Governance
Our enzyme technology adds significant benefits
Eliminate Remove stains, Decrease dose, Preserve fabric Save energy, Deal with complex
harsh chemicals boost whiteness increase performance texture, color water, time hygiene issues
26 Latest Results • Overview and Strategy • Market Overview • Sustainability • Financials and GovernanceConsumers are shifting from traditional detergents to
new formats and increased performance
Global market 2010 Global market 2020E
USD USD
~42bn +50bn
Powder
Liquid
Unit dosage Powder Liquid Unit Dose
100%
90%
80%
70%
Big differences in 60%
detergent 50%
applications across 40%
geographies 30%
20%
10%
0%
North America Europe (CWE) APAC RoW
Developed Markets Emerging Markets
Powder Liquid Unit dose
27 Latest Results • Overview and Strategy • Market Overview • Sustainability • Financials and GovernanceFood and Beverages overview
28%
of sales
Business Characteristics
Processing agricultural inputs Food products 5 year organic growth
• Relatively few product categories • Baking main market +3% +4% +5% +2% +9%
• Fragmented global customer base • Broad customer/application base Sales in DKKm 4.041
• ~60% direct sales • ~80% direct sales 3.278
3.715 3.740
3.190
2013 2014 2015 2016 2017
Key industry trends
• Consumer focus on health, wellness and natural products
• Raw material volatility and focus on production process optimization
Applications
• Customers consolidating operations in order to increase overall efficiency
• Baking
• Starch conversion
• Brewing and Beverage alcohol
Product launches 2017 • Nutrition
• Palmora® – Our first solution for the palm oil industry, which improves yield and NZ market share
plant performance for palm oil producers
• 30-40%
• Frontia® – A new technology for grain-milling customers that delivers better
Competition
yields in starches and gluten and reduces energy consumption in wheat and
corn-milling operations • DSM, Dupont, regional
28 Latest Results • Overview and Strategy • Market Overview • Sustainability • Financials and GovernanceThe grain value chain
• Significant presence in starch - industry leaders in enzymatic starch conversion for sweeteners
• Portfolio that includes LpHera®, Extenda®, Secura® and Sweetzyme®
• Frontia® opens a new segment with our starch customers in wet milling, enhancing the yield of key value streams - protein and starch
Starch slurry Refining
Corn Starch from wet mill
Wet mill
Liquefaction Saccharification Purification Isomerization
Novozymes Extenda® Novozymes Sweetzyme® Fructose syrups
Refinery
Milling Novozymes LpHera®
Frontia® Fiber Novozymes Secura®
Gluten
Maltose Glucose Mixed
syrups syrups syrups
Grain milling Starch processing
Starch
29 Latest Results • Overview and Strategy • Market Overview • Sustainability • Financials and GovernanceBioenergy overview
18%
of sales
Market Characteristics
Conventional biofuels Biomass Conversion 5 year organic growth
• Starch based ethanol is mainly a US • Global business +12% +19% ´-5% -3% +11%
market (+85%) • Dependency on political mandates Sales in DKKm
• US corn ethanol industry affected by • Few players – investments can hard to 2.543 2.644
2.270 2.438
corn and ethanol prices attract 1.909
• Ethanol makes up ~10% of US
gasoline consumption
Key industry trends 2013 2014 2015 2016 2017
• Growing calls for CO2 reduction in the transportation sector
• Political push in favor of biofuels in several regions
Applications
• Volatility in commodity prices affects customer margins
• Corn ethanol
• Biomass Conversion
• Yeast (new)
Product launches 2017/18 • Sugarcane
• Spirizyme® T – An advanced suite of glucoamylases that free up residual sugar in NZ market share
corn so that it can be fermented into ethanol, thereby increasing ethanol yield • >50%
• Innova® Drive – a new yeast strain that help ethanol producers reduce process Competition
complexity and impact from process upsets – and get more ethanol from their raw • Dupont, regionals and other
materials technologies
30 Latest Results • Overview and Strategy • Market Overview • Sustainability • Financials and GovernanceEthanol production
Global ethanol production Ethanol producer margin
Bn gallons
30 1,60
1,40
margin cents per gal
25
1,20
Contribution
20 1,00
15 0,80
0,60
10
14.8 15.2 15.8 16.2 0,40
13.8
5 0,20
0 0,00
2013 2014 2015 2016 2017
NA Brazil EU China RoW Total
Ethanol Contribution Margin
Price development in ethanol and corn US Ethanol inventories
$ per gal $ per bu
3,5 9,0 26
Barrels in thousands
8,0 24
3,0
7,0 22
2,5 20
6,0
18
2,0 5,0
16
4,0 14
1,5
3,0 12
1,0 2,0 10
Corn Ethanol
US fuel inventory
Sources: EIA, Ethanol RFA
31 Latest Results • Overview and Strategy • Market Overview • Sustainability • Financials and GovernanceAddressing complexity in bioethanol production
Designing enzymes for individual plants
Using our diagnostic program to deliver custom fermentation solutions, tailored to a plant’s unique operating conditions
Past Present Future
From standard to Basic products for Multiple offerings Increasingly customized solutions
more customized liquefaction and across liquefaction, for liquefaction and
saccharification saccharification and saccharification, novel solutions for
solutions
now also yeast other process steps
The Ethanol Process:
Enzymes are applied in multiple stages, along with yeast in fermentation
32 Latest Results • Overview and Strategy • Market Overview • Sustainability • Financials and GovernancePolicy objectives point to a doubling of ethanol by 2030 vs. today
EUROPEAN UNION
EU Renewable Energy Directive:
10% in transport by 2020* +1bn
Post 2020 framework under
TOTAL ADDITION BY 2030 development incl. mandate for 2G
Ambitious national policies
~ 24bn gallons/year 1G and/or 2G in FIN, SE, DK,
~ 90bn liters/year IT, FR, SK
~ 1bn gl/year
+1bn gl by 2030
+5bn
+13bn
NORTH AMERICA CHINA
Renewable Fuel Standard: E10 by 2020:
36bn gallons ethanol per 5 billion gallons
year by 2022 of which 16bn By 2025
gallons are cellulosic. US ambition to have large
moving slowly from E10 scale production of 2G
towards E15 +4-6bn INDIA
~ 16bn gl/year Strong governmental
+13bn gl by 2025/2030 push for public investment in 2G
11 biorefineries by 2022
LATIN AMERICA 22.5% ethanol blending
Biofuels Brazil: E27 + doubling goals by 2022
of volumes of ethanol ~ 250m gl/year
• Overall biofuels represent 4% of ROAD transport fuels today. In US needed by 2030 to +150m gl/year 2G by 2030
biofuels make up 10%, while its 27% in Brazil achieve climate ambition
Argentina: E12
• Ethanol makes up 3/4 of all biofuels produced today Mexico: E10 +150m
• US and Brazil dominate the global market with 70% of biofuels production ~ 8bn gl/year
(85% of ethanol) - mainly from corn or sugarcane +4-6bn gl by 2030
* indicative 0,5% for 2G and max 7% 1G
33 Latest Results • Overview and Strategy • Market Overview • Sustainability • Financials and GovernanceAgriculture and Feed overview
15%
of sales
Market Characteristics
Animal Health & Nutrition BioAg 5 year organic growth
• Sales and distribution through • Sales and distribution through +5% +7% +19% +5% -3%
partnerships partnership with Monsanto
Sales in DKKm
• Applications mainly for mono-gastric • Americas ~90% of sales
2.130 2.207 2.108
animals (poultry and swine) • Key crops: Soy, corn, pulses and 1.728
1.669
canola
Key industry trends 2013 2014 2015 2016 2017
• Consumer focus on health, wellness and natural products
Applications
• Focus on yield-gains
• Enzymes for animal feed
• Sensitivity to fluctuations in commodity prices among farmers
• Animal probiotics
• Consolidation of large agricultural companies
• Bioyield enhancement and Biocontrol
in Agriculture
Product launches 2017 NZ market share
• BioAg: Acceleron® B-200 SAT – By enabling additional upstream treatment in • 25-30% (Feed enzymes)
soybeans, this enhanced isoflavonoid stimulates beneficial microbe growth in the
• Leading producer of inoculants (BioAg)
soil and improves nutritional uptake
Competition
• BioAg: Acceleron® B-300 SAT – a biological upstream seed treatment product
containing a fungus, Penicillium bilaii to boost corn yields (Novozymes launch in • Feed: Dupont, AB Vista,
Q4’16 – Alliance launch in Q1’17) • BioAg: BASF, Bayer etc.
34 Latest Results • Overview and Strategy • Market Overview • Sustainability • Financials and GovernanceInoculants hold significant opportunity for market expansion across
crops and geographies
Factors driving inoculant growth:
Soybean Pulses Alfalfa Canola Corn Wheat Cotton Rice
Market expansion Global Planted Acres1
Significant opportunity across crops and (5 year avg. ~ 260m ~190m ~15m ~85m ~425m ~549m ~80m ~400m
geographies 2009–2013)
Inoculants Treated Acres2
~55-60% ~ 15% ~50% ~ 5% ~ 5%BioAg Alliance Pipeline
Industry’s most advanced microbials platform and R&D capability
The BioAg Alliance: R&D Development Pipeline TheBioAg
The BioAg Alliance
Alliance
PHASE 1: PHASE 2: PHASE 3: PHASE 4:
DISCOVERY: EARLY ADVANCED
Biologicals
PROOF OF CONCEPT PRE-LAUNCH
DEVELOPMENT DEVELOPMENT
10’s of Thousands
of Microbes
Thousands of
Candidates
Hits
Confirmed Hits /
Commercial Leads
Commercial
Candidates
Final Launch
Preparation
Pipeline Highlights:
• Corn BioYield 2 – Expected to commence
Collaborative Corn, Corn production in the second half of 2018 for
Soy and BioYield 3 Soy sales in 2019; branded as Acceleron B-360 ST1
partnerships and Bio-Nematicide Corn BioYield 2
Wheat
branded as • Corn BioYield 3 strains progress in Phase 2
BioYield
research are driving Pipeline Acceleron B360 with broader testing, fermentation and
Soy BioYield 2 for ST1
innovative solutions to BioControl S.A. formulation development
Pipeline
produce food in a • Soy BioYield 2 inoculants advanced for North
Soy BioYield 2 for
and South America , providing new longer life
sustainable way N.A.
rhizobium and easier handling benefits
Pipeline Advancement
Our technologies are on
Commercial Highlights Two products launched in 2017:
>80M acres today
Biological products like Acceleron B-300 SAT can increase nutrient
• Corn BioYield 1: Acceleron B-300 SAT in the U.S. with global
availability, which can lead to enhanced root and shoot development,
expansion opportunity (launched by NZ in Q4’16)
supporting stress tolerance, increased yield potential and ability to
absorb and store carbon • Soy BioYield 1: Acceleron B-200 SAT for soybeans in the U.S.
1 To be stacked with B-300 SAT
36 Latest Results • Overview and Strategy • Market Overview • Sustainability • Financials and GovernanceScientific evidence supports enzyme penetration
- enabling livestock farmers to reduce feed cost
Market is sensitive to feed and meat Low margins leave the producer different Scientific education of customers to
price changes options increase penetration
70% of total cost of poultry production is feed In tough conditions the producer sees two options: • Enzyme inclusion increases the efficiency of
including additives which is around 5%. • Cost out = reduce enzyme inclusion poultry producers
• Increase efficiencies = increase enzyme • Lack of scientific understanding drives
Poultry producer margins are low when: inclusion uneconomical customer decisions
• Feed prices are high
• Meat prices are low The degree of enzymatic and nutritional
understanding determines the decision:
Feed formulation is an art and the nutritionist is often
the decision maker. The scientific & nutritional • Advanced/’modern’ customers increase enzyme
philosophies combined with commodity prices inclusion
determine enzyme inclusion levels • Simple/traditional customers reduce enzyme
inclusion
37 Latest Results • Overview and Strategy • Market Overview • Sustainability • Financials and GovernanceAttractive value propositions in feed enzymes
Phytase ProAct® Others
phosphate protein energy
Only 3-30% of phosphate in feed is available Maximizing protein utilization and Xylanase & glucanase increase non-starch
to the animal improving nutritional value polysaccharide digestion
Ronozyme NP® releases half of the phosphate Improves protein digestibility by Amylase improves starch digestibility,
bound – Ronozyme HiPhos® releases nearly >20%, increasing feed conversion releasing more energy
all of it
Reduces need for additional protein feed, Cellulase improves fiber digestion
Significant reduction in phosphorous such as soybean meal
excretion from animals as farmers can save Grain feed savings of ~2.5% and less
25-100% of added phosphate pollution (ammonia, nitrate, nitrous oxide
and CO2)
Forceful pursuit of science leadership with DSM alliance Estimated penetration across species
across species, product classes and regions
100%
75%
Phytases Proteases 50%
80-90%
Carbohydrases 25%
35-45%
10-15%
0%
Phytase Carbohydrase Protease
38 Latest Results • Overview and Strategy • Market Overview • Sustainability • Financials and GovernanceAnimal health & nutrition
The world needs sustainable efficiency gains in animal production. Improving the yield in animal production would have significantly
positive impact in terms of global warming and use of agricultural land
• 9+ billion people by 2050
• Protein demand to double next 40 years
• Feed costs in 50% of costs in animal production
• Arable land per capita expected to decrease by 35% from 2000 to 2050
• Antibiotic resistance and regulation are driving the need for alternatives to antibiotics
Our partners
In 2015 we initiated a partnership with In 2016 H1, Alterion® was released In March 2017 we embarked on a new
Adisseo with the shared ambition to enter together with Adisseo which is a probiotic strategic collaboration with Boehringer
and develop the market for probiotics at for poultry at grow-out farms, as the first Ingelheim in probiotics for poultry
grow-out farms product in our innovation cluster “Natural hatcheries
growth promotion”
39 Latest Results • Overview and Strategy • Market Overview • Sustainability • Financials and GovernanceTechnical & Pharma overview
7% of sales
Business Characteristics
Wastewater Treatment Textile, Leather and Pulp & paper 5 year organic growth
• Microorganisms for industrial use in • Enzymatic solutions and technical +6% +9% +6% +13% +2%
wastewater treatment support for processing textiles and
• New initiatives to target e.g. sludge leather Sales in DKKm
982 1.055 1.021
watering and membrane cleaning • Solutions for process optimization for 829
paper producers 757
Key industry trends
• Increasing demand for wastewater solutions due to increasing water
quality/pollution cleanup regulations
2013 2014 2015 2016 2017
• Consumer demand for improved textile quality and longevity
• Enzymatic solutions optimizing processes and lowering chemical use Pharma divested end 2017 (~1/3 of business)
Applications
Launch of new innovation priority platform “Solutions for water”
• Wastewater / Textiles / Leather / Pulp
• Solving the world’s water challenges presents a monumental challenge for
& Paper / Biocatalysis
society. As part of the SDG’s the UN has defined Clean Water and Sanitation as
goal #6 Novozymes market share
• We are investing in biotechnological solutions for water treatment that could be • ~50% (enzymes only)
used for; cleaning fouling on water treatment systems, degrading compounds in Competition
process water and wastewater, removing and recovering nutrients from • Dupont + regional
wastewater and generating energy, such as biogas from wastewater
40 Latest Results • Overview and Strategy • Market Overview • Sustainability • Financials and GovernanceSustainability
New long-term targets focus on world impact 2020

 New IMPACT targets                                                                                              Novozymes’                      Updated operational targets
 •   10 transformative innovations                 • Save 100 million tons of CO2                            unique contribution:                Environment                             People
 •   5 partnerships for change                     • Reach 6 billion people with our                                                             • Energy efficiency                     • Occupational accidents
 •   Educate 1 million people                        biological solutions                                                                        • Water efficiency                      • Employee absence
 •   Enable Zymers to develop                                                                                                                    • Reduction in CO2 intensity            • Employee “satisfaction and
                                                                                                                                                 • Renewable energy                        motivation”
                                                                                                                                                 • Supplier program                      • Employee “opportunities for
                                                                                                                                                 • Gold Class RobecoSAM rating             development”
                                                                                                                                                 • Carbon Disclosure Project A List      • Women in senior management

World needs – areas where we can make an impact

                    Climate            Sustainable                                                           Health and                                          Economic               Job        Supply chain
                                                                                                                              Education
                    change               growth                                                              livelihoods                                          growth              creation     management

Company performance – the traditional view on sustainability

                                                                                                                                                                           Business
        Resource             Sustainable              Product                                        Human &          Employee        Health &                                               Corporate
                                                                                                                                                                          integrity &
        efficiency          raw materials           stewardship                                     labor rights     satisfaction      Safety                                                governance
                                                                                                                                                                           antitrust

                             Environmental                                                                             Social                                           Governance (economic)

42   Latest Results • Overview and Strategy • Market Overview • Sustainability • Financials and Governance
We plan to continue our journey of operational excellence
• Novozymes has over time proved how investments in efficiency and optimization programs pay off not only
from a sustainability perspective but also from an economic perspective
• In the US we have a biogas plant which turns wastewater into steam
• 24% of the total energy consumed comes from renewable sources; mainly windfarms
Decoupling resource consumption from Steady improvement in employee metrics
economic growth 15
Gross profit
150% 3%
Sales
Change since 2005
Accidents per million
Employee absence
10
working hours
100% 2%
Water
5
50% Energy 1%
CO2 emissions
0% 0 0%
2005 2006 2007 2008 2009 2010 2011 2012 2013 2014 2015 2016 2017 2000 2001 2002 2003 2004 2005 2006 2007 2008 2009 2010 2011 2012 2013 2014 2015 2016 2017
Accidents per mill. working hours Employee absence (%)
44 Latest Results • Overview and Strategy • Market Overview • Sustainability • Financials and GovernanceWe are reducing CO2 emissions together with our
customers by offering solutions that help produce
more with less
In 2017, Novozymes helped customers save 76 million tons of CO2 through the application
of Novozymes’ products
Detergent: Animal feed: Textile: Cereals:
100 kg CO2 80 kg CO2 1100 kg CO2 110 kg CO2
per ton of laundry per ton of feed per ton of fabric per ton of bread
Agriculture: Beverage: Leather: Paper making:
15 kg CO2 25 kg CO2 100 kg CO2 150 kg CO2
per ton of corn per 1000 liters of beer per ton of hide per ton of pulp
Vegetable oil: Starch based biofuel Biomass based biofuel: Cosmetics:
44 kg CO2 1100 kg CO2 2200 kg CO2 190 kg CO2
per ton of oil per 1000 liters of ethanol per 1000 liters of ethanol per ton of fatty acid ester
44 Latest Results • Overview and Strategy • Market Overview • Sustainability • Financials and GovernanceNovozymes’ remuneration principles for the
Executive leadership team
Remuneration principles ensure close alignment with long term shareholder interests, links remuneration to shareholder gainsand losses,
and ensures management retention
Annual remuneration scheme Long term incentive program (2017-2019)
Salary and cash bonus Economic Profit (75% of the program)
100
18 90
Max 2 months of base salary cash bonus
% stock & options awarded
80
Months of salary per year
16 linked to fulfilment of EBIT and 70
14 sustainability targets 60
12 50
10 Max 3 months of base salary cash bonus 40
8 linked to fulfilment of personal targets 30
6 20
10
4 0
Base salary
2
1,0 2,0 3,0 4,0 5,0 5,5 6,0 6,5 7,0 7,5 8,0
0
Bn DKK of acc. economic profit
Conditions for long term program
Organic growth (25% of the program)
100
• The incentive program consists of 50% stock options and 50% stocks with the 90
% stock & options awarded
opportunity to double annual remuneration. Awards will depend on accumulated 80
economic profit generated (75%) as well as average organic sales growth (25%). 70
• Economic profit is defined as: NOPAT - (Avg. inv. capital * WACC) 60
• NOPAT is adjusted for hedging result to eliminate impact of currency fluctuations 50
as well as for any impacts from major acquisitions. A fixed WACC of 6% will be 40
used during the entire program 30
20
• Stock options will be awarded annually (3-year vesting period), stocks in 2020 (no
10
vesting period). Maximum clause caps upside (max. cap = 2x intrinsic value at 0
establishment ex. inflation)
1% 2% 3% 4% 5% 6% 7%
Organic Sales growth
45 Latest Results • Overview and Strategy • Market Overview • Sustainability • Financials and GovernanceFinancials and Governance
Historical performance demonstrates track of delivery
                                                                                                                                        Long term targets
                                               17 years of organic growth
                                                                                                                  16.000
                                                                                                                  14.000
                                                                                                                  12.000
                                                                                                                  10.000

                                                                                                                          DKKm
                                                                                                                  8.000
                                                                                                                                             Return
                                                                                                                  6.000
                                                                                                                  4.000
                                                                                                                                          to historical
                                                                                                                  2.000
                                                                                                                                        organic revenue
                                                                                                                  0                      growth rates

                        Profitability has benefitted from productivity improvements and
                                          operational leverage 2000-2017
                                                                                                             27,9% 30%
                                                                                               24,7%
                                                                                                                  25%
                                                                                                                                             ≥26%

                                                                                                                          EBIT margin
                                         19,2%                      20,0%
       16,7%                                                                                                      20%
                                                                                                                                           EBIT margin
                                                                                                                  15%
                                                                                                                  10%
                                                                                                                  5%
                                                                                                                  0%

47   Latest Results • Overview and Strategy • Market Overview • Sustainability • Financials and Governance
Historical performance demonstrates track of delivery
Net interest-bearing debt
2.000 1,0
0,8 Long term targets
1.000 0,6
NIBD/EBITDA
0,4
0,2
DKKm
0 0,0
-0,2
0-1x
-1.000 -0,4 Net interest bearing-
debt-to-EBITDA
Net Interestbearing debt NIBD/EBITDA
15.000 ROIC 30%
25%
10.000 20%
ROIC
DKKm
15% ≥25%
5.000 10%
5%
ROIC incl. goodwill
0 0%
Invested Capital ROIC
CAPEX
2.000 14%
12%
CAPEX/Sales
1.500 10%
8% ~8%
1.000
DKKm
6%
4%
CAPEX to Sales
500
2%
0 0%
CAPEX CAPEX to Sales
48 Latest Results • Overview and Strategy • Market Overview • Sustainability • Financials and GovernanceNovozymes carries limited exposure to raw
material fluctuations
Factors impacting COGS Split of Cost of Goods sold
• Productivity improvements, input prices, currency Raw materials consist primarily of different
carbohydrates. Approximately 50% of raw material
• Note: accounting practice implies that there is a input are e.g., sucrose, maltose, glucose, starch.
time lag between current price levels and COGS
Energy/utilities &
others; 20%
Factors impacting Novozymes’ input prices
• Geographical location, e.g., differences in input
• Contractual agreements, e.g., timing, duration
• Substitution possibilities, i.e., flexibility in use of
different inputs, not dependent upon one source
Raw
materials;
• Price development on other products produced by 35% Indirect
production
our suppliers from the same input costs; 45%
49 Latest Results • Overview and Strategy • Market Overview • Sustainability • Financials and GovernanceSince 2000 DKK ~25bn has been returned to
shareholders through dividend or share buybacks
At the annual shareholders’ meeting in March 2018, a dividend of DKK 4.50 per share for the 2017 financial year (an increase of
13% compared with 2016), was approved. This resulted in a total dividend payment of approximately DKK 1,318 million,
corresponding to a payout ratio of 42.3%.
Novozymes decided to initiate a new stock buyback program worth up to DKK 2.0 billion in total, or a maximum of 20 million shares.
The program began in early 2018 and will run for the remainder of the year.
Accumulated dividends of DKK ~11bn and stock buybacks of DKK ~14bn have been returned to the shareholders since 2000
Dividend per share, DKK
Dividend / Buybacks 4,50
5.000 5,00
4,00
Dividend Buyback Dividend per share 3,50
4.500 4,00
3,00
2,50 3,00
4.000 2,20
1,90
1,60
DKK million
1,05 1,15 2,00
3.500 0,80 0,90 1,00
0,63 0,70
0,33 0,40 0,45 1,00
3.000
0,00
2.500
2.000 -1,00
2.000
2.000 2.000
2.000
-2,00
1.500
-3,00
832
1.000 -4,00
1.053 1.107 400
847 1.190 1.318
500 500 1.062
392 786 925 -5,00
424 600 687
185 326 358 504
124 146 162 217 231 255 278 309
0 -6,00
2000 2001 2002 2003 2004 2005 2006 2007 2008 2009 2010 2011 2012 2013 2014 2015 2016 2017
50 Latest Results • Overview and Strategy • Market Overview • Sustainability • Financials and GovernanceShareholder distribution
Novozymes “B”-shares are listed on the Copenhagen Shareholder distribution of B common stock*
stock exchange under the symbol “NZYM B” Novo Holdings was the only major stockholder holding more
than 5% of Novozymes common stock
Two share classes; A and B shares
North America;
• All “B”- shares listed in Copenhagen under the 27%
symbol “NZYM B”
• All “A” share capital and 24,031,400 “B”-shares are Novo
held by Novo Holdings, who is fully owned by the Holdings;
Novo Nordisk Foundation 10%
Rest of Europe;…
Rest of
As of December 2017 World; 3%
• Novo Holdings, owned 25.5% of the share capital and
controls 71.2% of votes (all A shares & ~10% of B
Own shares;
shares)
5% Denmark;
• Novozymes had more than 55,000 shareholders of 17%
whom 95% were private shareholders in Denmark
• ~50 institutional investors incl. Novo Holdings owned UK; 25%
~50% of the B-shares
*Distribution equals where
shares are managed, Dec 2017
51 Latest Results • Overview and Strategy • Market Overview • Sustainability • Financials and GovernanceFoundation ownership advocates long-term focus
Purpose of the Foundation: Structure of Novo Holdings and ownership
The Novo Nordisk Foundation is an independent
Danish foundation with corporate interests.
The objective of the Novo Nordisk Foundation is
twofold: to provide a stable basis for the commercial
and research activities conducted by the companies
within the Novo Group and to support scientific and
humanitarian purposes.
350
300
No of shares – millions
250
Financial Novo Group Principal
200 investments companies: investments
Venture capital Sonion
150 Seed capital Chr. Hansen
Free-float Xellia
100 Treasury
Foundation
50
0
A-shares B-shares
52 Latest Results • Overview and Strategy • Market Overview • Sustainability • Financials and GovernanceOur investor relations team Further investor relations information is available from the company homepage at investors.novozymes.com Tobias Björklund Elsebeth Kjærsgaard Klaus Sindahl Naja Wivel Head of investor relations IRO IRO Coordinator +45 3077 8682 +45 3077 2510 +45 5363 0134 +45 3077 2076 tobb@novozymes.com elgs@novozymes.com ksdh@novozymes.com nwv@novozymes.com 53 Latest Results • Overview and Strategy • Market Overview • Sustainability • Financials and Governance
Forward-looking statements

     This presentation and its related comments contain forward-looking statements, including statements about
     future events, future financial performance, plans, strategies and expectations. Forward-looking statements are
     associated with words such as, but not limited to, "believe," "anticipate," "expect," "estimate," "intend," "plan,"
     "project," "could," "may," "might" and other words of similar meaning.

     Forward-looking statements are by their very nature associated with risks and uncertainties that may cause
     actual results to differ materially from expectations, both positively and negatively. The risks and uncertainties
     may, among other things, include unexpected developments in i) the ability to develop and market new
     products; ii) the demand for Novozymes’ products, market-driven price decreases, industry consolidation, and
     launches of competing products or disruptive technologies in Novozymes’ core areas; iii) the ability to protect
     and enforce the company’s intellectual property rights; iv) significant litigation or breaches of contract; v) the
     materialization of the company’s growth platforms, notably the opportunity for marketing biomass conversion
     technologies or the development of microbial solutions for broad-acre crops; vi) the political conditions, such as
     acceptance of enzymes produced by genetically modified organisms; vii) the global economic and capital
     market conditions, including, but not limited to, currency exchange rates (USD/DKK and EUR/DKK in particular,
     but not exclusively), interest rates and inflation; viii) significant price decreases on inputs and materials that
     compete with Novozymes’ biological solutions. The company undertakes no obligation to update any forward-
     looking statements as a result of future developments or new information.

54
You can also read