European Traded Gas Hubs: German hubs about to merge - Oxford Institute for Energy Studies
←
→
Page content transcription
If your browser does not render page correctly, please read the page content below

July 2021

                     European Traded Gas Hubs:
                      German hubs about to merge

OIES Paper: NG 170                Patrick Heather, Senior Research Fellow
The contents of this paper are the author’s sole responsibility. They do not
         necessarily represent the views of the Oxford Institute for Energy Studies or any of
                                            its members.

                                          Copyright © 2021
                               Oxford Institute for Energy Studies
                                  (Registered Charity, No. 286084)

  This publication may be reproduced in part for educational or non-profit purposes without special
permission from the copyright holder, provided acknowledgment of the source is made. No use of this
  publication may be made for resale or for any other commercial purpose whatsoever without prior
                  permission in writing from the Oxford Institute for Energy Studies.

                                      ISBN 978-1-78467-179-2

                                                                                                  i
Acknowledgements
I would like to thank all those who helped me in the writing of this Paper and who answered my many
questions; in particular: Bassam Abdel Alim, Richard Black, Benjamin Durand, Grégory Héloir, Bert
Hoven, Sybren de Jong, Ciaran Roe, Egbert-Jan Schutte-Hiemstra, Gregor Spilker, Jonathan Stern,
and if I have omitted anyone I sincerely apologise but thank you all the same!
The task of collecting all the relevant trading data was made easier by the help and assistance I
received from several companies, in particular my thanks to: Argus, ICIS, LEBA, and S&P Global
Platts for providing OTC and Asian markets data as well as background information and news items;
thanks to CME, ICE and PEGAS for supplying data files of their exchange trades; thanks to the
various market participants who advised, informed and helped me during the writing of this paper.
Lastly, but by no means least, I would like to thank my colleagues at the OIES for their ongoing help,
guidance and encouragement, and in particular to Jim Henderson for his support and patience! Many
thanks also to Kate Teasdale and John Elkins for their help in preparing the paper for publication.

                                                                                                     ii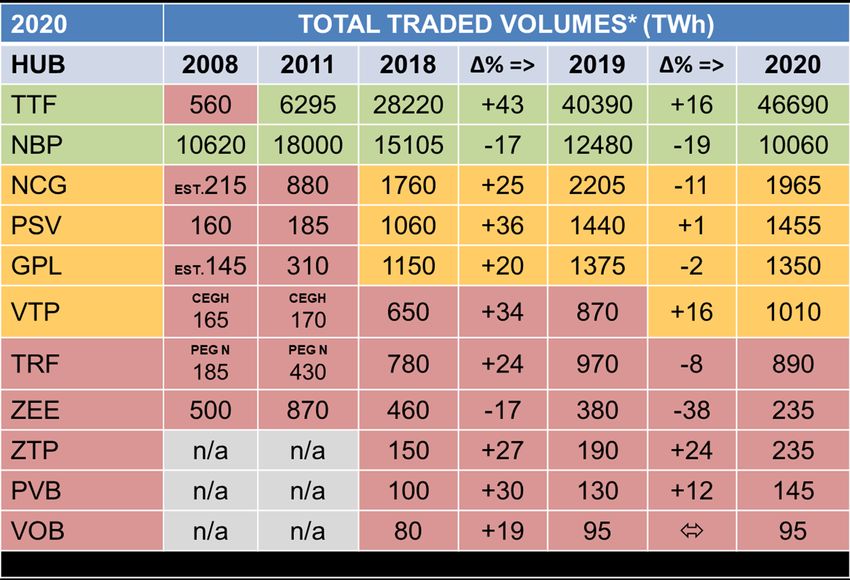
Contents
Acknowledgements ................................................................................................................................. ii
Figures ................................................................................................................................................... iii
Maps....................................................................................................................................................... iii
Tables..................................................................................................................................................... iii
Executive Summary ................................................................................................................................ 1
1. Introduction ......................................................................................................................................... 2
2. Setting the scene… ............................................................................................................................. 2
3. Review of the 5 Key Elements in 2020 ............................................................................................... 4
4. NBP continues to slip but the Belgian ZEE is worst performer in 2020 .............................................. 7
5. A summary of the traded gas hubs in 2020 ........................................................................................ 9
6. What are the prospects for the new German hub and the other second tier hubs? ......................... 12
7. TTF amongst the global pricing benchmarks for gas ........................................................................ 16
8. Conclusion ........................................................................................................................................ 18
9. Bibliography ...................................................................................................................................... 21
10. Appendix ......................................................................................................................................... 22
   Chronology of the European traded gas hubs .................................................................................. 22

Figures
Figure 1: Traded volume development: 2014–2020 ............................................................................... 8

Maps
Map 1: European gas regions, markets and hubs: 2020 ....................................................................... 3

Tables
Table 1: Traded products - 2020 ............................................................................................................. 4
Table 2: Traded volumes - 2020 ............................................................................................................. 5
Table 3: Churn rates - 2020 .................................................................................................................... 6
Table 4: Summary of the 5 Key Elements - 2020 ................................................................................... 9
Table 5: Traded volumes: emerging hubs - 2020 ................................................................................. 10
Table 6: Global Gas Benchmarks Churn Ratios - 2020 ........................................................................ 17

                                                                                                                                                            iii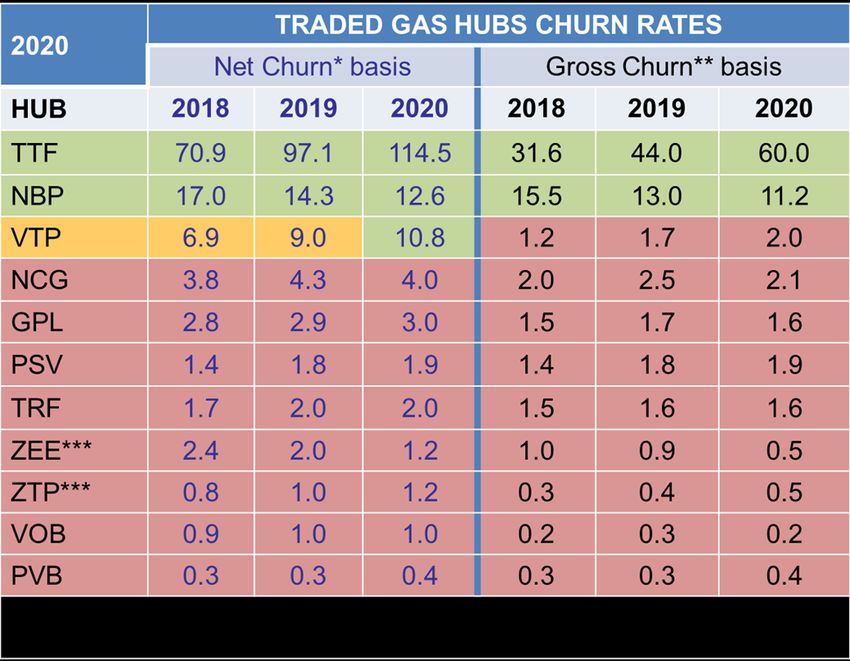
Executive Summary
Germany is finally going to merge its two gas hubs in October 2021, a merger which has strong
political backing. The aims and ambitions of the regulator and the TSOs is that the Trading Hub
Europe will bring increased liquidity to the German gas market, making it one of the most attractive
and liquid gas trading hubs in Europe, an international hub linking other European gas markets.
Unfortunately, the statistical trading data and the French experience of hub mergers suggest it will
struggle to succeed.
On the wider European level, the vision set out some 20 years ago of a fully liberalised traded gas
market is now almost fulfilled, with just a few more changes needed to be made.
On the Iberian Peninsula, Portugal has yet to establish a virtual trading hub and the proposed merged
PT/ES Iberian Gas Hub project has failed to materialise. Croatia and Slovenia have liberalised their
gas markets but there is no standardised OTC trading, no exchange trading, and indeed no virtual
gas hub.
The Balkan countries have finally all created virtual hubs but are at varying degrees of development.
A similar situation has developed in north east Europe, with progress being made on establishing a
Baltic regional market area consisting of the gas markets in Estonia, Latvia, and Finland. Lithuania
has yet to confirm that it will link up with its neighbours. The gas markets of Denmark and Sweden
have merged, as have those of Belgium and Luxembourg.
Although not part of the European Union, Ukraine has been keen to align itself with the EU’s energy
Directives and has implemented a number of reforms starting the process of liberalisation. There is
still much more to do but, given the relatively large size of its gas market in the region, it may realise
its ambitions to become a regional hub.
The results of the 5 Key Elements for 2020 show an overall increase in European traded volumes.
The TTF has consolidated its position at the top of the rankings and has increased both its ‘net’ and
‘gross’ churn scores; it is a mature and very liquid hub. NBP continued its slow decline: it has many
different participants but the range of traded products is narrowing, nevertheless it is still a mature and
quite liquid gas hub.
At a global level, Henry Hub is the most liquid traded benchmark gas hub. TTF and NBP are
important benchmarks in their own market areas and are also benchmark hubs for their regions. JKM
is the leading LNG price marker in Asia.
The final conclusion of this paper is that the political will in Ukraine could see it become a SEE
regional hub in the future; that the TTF is most likely to remain the European gas price benchmark as
well as a global benchmark; and that the new German Trading Hub Europe is very unlikely to reflect
its name.

                                                                                                                  1
   The contents of this paper are the author’s sole responsibility. They do not necessarily represent the views
                         of the Oxford Institute for Energy Studies or any of its Members.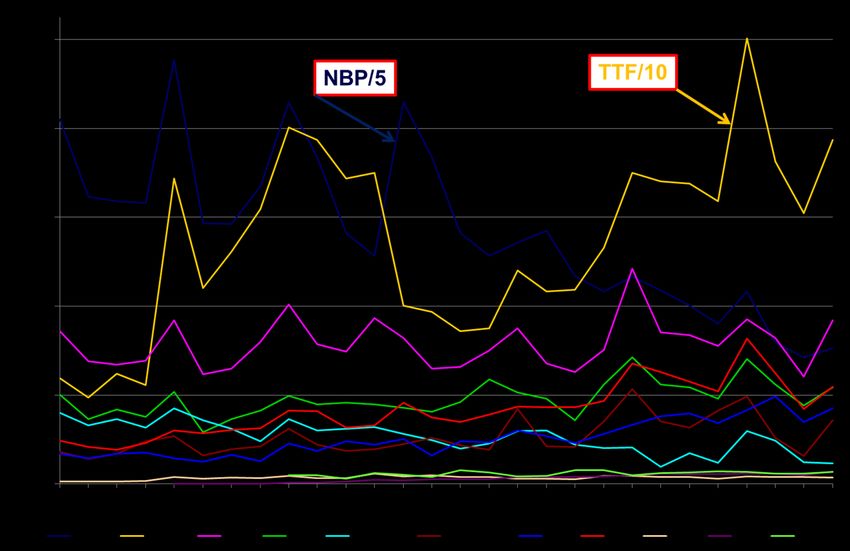
1. Introduction
The Author has been following the development of the European traded gas hubs over many years
and has already published a number of Papers and Insights on the subject. 1 His attention is now
turning to the development of traded gas markets in Asia and to the relative importance of global gas
pricing benchmarks.
The stated aim of the Federal law which has mandated the German hubs merger 2 is to increase
liquidity in the gas market, and the German TSOs have the ambition for the new hub to be an
international hub linking the German with other European gas markets. 3 Given the country’s large
physical consumption and total physical throughput, this should be a possibility but begs the
questions of why the NCG and GPL hubs have not developed more than they have and whether, if
that is due to there being two hubs rather than one, simply merging them will now have the desired
effect? The results of the French hubs merger do not augur well for such a success in Germany.
This Paper, after analysing the results of the trading data in 2020, will examine its prospects and
assess whether this or any other of the hubs can indeed aspire to being a regional benchmark?
Having established last year that the Dutch TTF hub is now not only the leading hub in Europe4 but
has also become a global pricing benchmark, this paper will review how all the other European hubs,
and in particular the German hubs, are faring and what their outlook is.

2. Setting the scene…
Map 1 shows all the European gas hubs that were operational as at the end of 2020. The colour
scheme indicates which hubs are categorised5 as ‘Mature’, ‘Active’, ‘Poor’ and ‘Inactive’. There are
just two Mature hubs, the Dutch TTF and the British NBP; four Active hubs, the Italian PSV, the
German NCG and GPL, and the Austrian VTP; and five Poor hubs, the French TRF, the Spanish
PVB, the Belgian ZEE and ZTP, and the Czech VOB; the remaining hubs are all classed as Inactive.
It also shows the planned German THE hub.
Two new hubs became operational during 2020; the Bulgarian virtual hub (VTT6) and the Romanian
virtual trading point (PVT7). The Author has removed from the map the two planned regional hubs in
Central Europe8 as both projects seem to have been dropped, but has kept the Mediterranean Gas
Hub, an EU project that lingers on but with very little firm direction or progress; 9 the Iberian Mibgas
hub concept is also still ‘alive’ but with no development since last reported on; 10 and the Baltic
regional hub is still in the process of being developed by merging markets in the four participating
countries.11 Finally, the Ukraine national gas hub will most certainly be created but is taking time to
develop and come into effect.

1
  All of which are listed in the Bibliography and are available to download from the OIES website:
https://www.oxfordenergy.org/authors/patrick-heather/
2
  The planned merger of NCG and GPL into a new Trading Hub Europe (THE) is due to take effect on 1st October 2021.
3
  Full details are given in Section 6 below.
4
  See Heather (2020).
5
  As defined by the Author, following his 5 Key Elements analysis; see Heather (July 2019), Section 2.
6
  Virtualna Tŭrgovska Tochka (VTT).
7
  Punctul Virtual de Tranzactionare (PVT).
8
  CEETR and V4 which were initiatives to join, through trading and in various combinations, the gas hubs of Poland, Austria,
Slovakia, Czech Republic, and Hungary.
9
  See last EC updated statement on “Developing the Mediterranean hub”, 17th March 2020:
https://ec.europa.eu/energy/topics/energy-security/diversification-of-gas-supply-sources-and-routes_en
10
   See Heather (July 2019), p.21 and Heather (March 2019), p.45.
11
   So far, Estonia and Latvia have a merged Market Area; Finland to merge in 2021; it is uncertain when Lithuania will join.

                                                                                                                               2
     The contents of this paper are the author’s sole responsibility. They do not necessarily represent the views
                           of the Oxford Institute for Energy Studies or any of its Members.
Despite the Covid-19 pandemic, total traded volumes in 2020, across all the European traded gas
hubs, reached an all-time high 12 but with significant differences from hub to hub, which will be
explained in this review.
With regard to the total physical gas consumption across the 14 countries 13 surveyed, there was
actually a slight reduction over the previous year which, set against the rise in total trading, resulted in
an increase of about 10% in the aggregated churn rates. Indeed, the overall net churn rates of these
14 countries rose from 12.9 times in 2019 to 14.2 times in 2020; the overall gross churn rates rose
from 7.5 times in 2019 to 8.2 times in 2020. These figures show that Europe taken as a whole is
finally becoming a mature gas market; however, about 73% of the total traded volumes were recorded
at just one hub, the Dutch TTF.
Map 1: European gas regions, markets and hubs: 2020
At a European level, there was a 12% decrease in OTC trading and a small decrease (just 2%) in
exchange spot trading. These were more than compensated for by a significant rise of 32% in
exchange futures and options trading, which gave a modest overall increase in total trading of 5.9%.
The move from OTC dominating European gas trading to exchange trading having a small advantage
is due entirely to the strong increase in exchange trading at the Dutch TTF, where its share has gone
from 31% in 2018 to 54% in 2020, whilst the total volumes at TTF rose 65% in that time. This shows
how TTF has consolidated its position as the leading gas hub in Europe.
12
Total volumes, including OTC and exchange spot and futures trades: 64,415TWh, a rise of 5.9% on the previous year.
13
GB; NL; DE; FR; BE; AT; IT; CZ; ES; DK; PL; HU; BG; SK.
3
The contents of this paper are the author’s sole responsibility. They do not necessarily represent the views
of the Oxford Institute for Energy Studies or any of its Members.3. Review of the 5 Key Elements in 2020
The analysis this year reveals that the number of ‘active’ participants 14 rose at four of the top seven
hubs and stayed about unchanged at the other three. For the remaining hubs, the number of active
participants actually fell in 2020 compared to the previous year. The more ‘active’ participants there
are, the more liquidity there will be in a market, which is especially important in the mid-far curve for
risk management trades.
As will be shown throughout this analysis, the Austrian VTP improved on every metric, including
seeing a significant increase in the number of active participants; the other hubs that saw a rise in
participants were TTF, NBP and PSV. The hubs where the number of participants remained about
unchanged were the Spanish PVB, and the German NCG and GPL; on this first metric there are
already a reasonable number of market participants and it is unlikely to increase after the merger.
The remaining hubs all saw a fall in the number of participants, especially so at the French TRF and
the Belgian ZEE and ZTP; the Czech VOB only saw a small reduction.
Table 1: Traded products - 2020
Sources: OTC: LEBA, ICIS; Exchange: ICE, ICE-Endex, PEGAS, CME, GME; MIBGAS; P. Heather
A good measure of a hub’s maturity is the types of products available to trade and their traded
volumes, which are a good indication of whether a market is used for balancing or risk management.
Table 1 shows that in 2020 the only two hubs to have a number of product categories in green (the
highest level of activity) were the TTF and NBP, reflecting absolute traded volumes of more than
14
For an explanation and methodology, see: Heather (July 2019), pp.3-5. The actual 2020 scores are shown in Table 4 below.
4
The contents of this paper are the author’s sole responsibility. They do not necessarily represent the views
of the Oxford Institute for Energy Studies or any of its Members.600TWh in the OTC product types and more than 500TWh in each of the exchange product types. No
other hub has a product category in green. In fact the German NCG did have OTC seasons in green
in 2019 but last year went back in to the amber category.
The overall hub scores fell for seven of the hubs (TTF, NBP, NCG, GPL, TRF, ZEE, ZTP), stayed the
same for two hubs (PSV, VOB), and increased for the remaining two hubs (VTP, PVB); however, the
order changed a little with PSV now just ahead of the two German hubs, PVB just ahead of ZEE, and
VOB ahead of ZTP which is ranked last. On this metric, for there to be further development of the
merged German hub, there would need to be a significant increase in traded volumes in most OTC
products and generally in all exchange traded products.
The ICE exchange introduced futures contracts at the Austrian VTP hub and, although the PEGAS
platform introduced Spanish PVB products in 2019, they only really started to trade in 2020 and even
took 4 percentage points in market share away from the MIBGAS exchange.
There are still only two hubs that recorded exchange financial options trading in 2020, TTF
(3,664TWh) and NBP (379TWh), both on the ICE exchange, and representing 14.58% and 5.16%
respectively of exchange trading. 15
Table 2: Traded volumes - 2020
Sources: 2008: converted from bcm in IEA 2009 Natural Gas Review, p.30;
2011-2020: LEBA, ICIS, ICE, ICE-Endex, EEX, Powernext, PEGAS, CME, CEGH, GME; MIBGAS; P. Heather
High absolute traded volumes are usually indicative of a liquid market with a large number and varied
range of participants; depending on the size of the underlying physical market, this will likely also
indicate a large churn rate. In Table 2, 16 mature hubs are shown in green; the active hubs, with
developing depth, liquidity and transparency in amber; and the poor hubs, which cannot yet be
considered as deep, transparent or liquid, in red.
15
Equivalent to 7.8% and 3.8% respectively of total exchange and OTC trading.
16
The methodology used in this table is: (Volumes) Green: =/>5000; Amber:The recent trend in rising traded volumes at TTF and decreasing NBP volumes, as a result in part of
hedging and risk management trading moving away from the British Sterling denominated hub to the
Dutch Euro denominated hub, is once again apparent in 2020. The TTF volumes rose by 15.6% whilst
those at NBP fell by 19.4%. The Austrian VTP actually saw the largest increase (15.8%) and the
Spanish PVB rose by 9.5%17 but for both hubs this was from a far lower base.
Hubs that recorded a fall in traded volumes were the Belgian ZEE and ZTP which fell by a
combined17.6%,18 followed by the French TRF which fell by 8.2%, and the German NCG and GPL
combined which fell by 7.5%. This is despite the increasing German and Belgian physical demand
which should have encouraged more, not less, trading. The result of the fall in German traded
volumes and the increase in those at TTF means that the Dutch hub is now more than fourteen times
larger than the two German hubs combined. This position does not augur well for the new merged
German hub which is expected to start trading from October 2021.
Another important metric is the traded gas hubs churn rate. 19 In this one metric all others are,
necessarily, reflected: if there are many participants, trading many different products in large
quantities, then the churn rate is likely to be high. The churn rate is used by traders as a ‘snapshot’ of
a market’s liquidity; some traders will not participate in markets with a churn of less than 10 and many
financial players will only participate when the churn is above 12. In his analysis the Author has
determined that a hub is ‘mature’ when the churn rate is 10 times or more.
Table 3: Churn rates - 2020
Sources: 2018-2020: LEBA, ICIS, ICE, ICE-Endex, PEGAS, CME, CEGH, GME; MIBGAS; P. Heather
17
Note that the figure of 12% in the table is based on the rounded volumes stated.
18
The ZEE recorded the largest drop of all the hubs at -38.6%, whilst the ZTP had a 23.2% increase but from a lower base.
19
For an explanation, see: Heather (July 2019), p 11.
6
The contents of this paper are the author’s sole responsibility. They do not necessarily represent the views
of the Oxford Institute for Energy Studies or any of its Members.New for this year’s hubs update paper, Table 3 shows the hubs’ net20 market churn rates for the last
three years as well as the gross21 churn. The Author believes that using a net churn methodology can
be appropriate in the early stages of the development of a hub, as it is initially more focused on the
Market Area (in most cases, national) balancing requirements. However, to judge the growing liquidity
and maturity of a hub, as it trades further down the curve and attracts risk management volumes, the
gross churn methodology is more accurate as it shows a given hub’s ability to be a pricing benchmark
beyond its own market area. This is because there are many various reasons for the amount of
trading effected at a given hub: trading of actual physical gas or trading to hedge and risk manage
gas, both destined for consumption in that hub area; but also, trading in relation to quantities of gas
destined for export to neighbouring market areas.
The results for 2020 show that TTF remains at the top of the rankings and has in fact increased both
its ‘net’ and ‘gross’ churn scores;22 NBP is still a mature market but, as total traded volumes have
eased, then the churn rates have also. This, along with PSV and PVB, are the only three hubs where
the gross churn calculation is almost the same as, or only slightly less than, the net calculation; this is
because very little gas is re-exported from Spain23, Italy and Britain.
This is in stark contrast with the Austrian VTP, which posted a 20.4% increase in its gross churn rate.
However, given that very large quantities of physical gas flow through the country for onward
transportation, the gross churn is a fraction of the net churn. The net churn though is now over 10
times and means that VTP is only the third hub ever to have achieved this in Europe and puts it in the
‘mature’ category on this basis.
Germany is Europe’s largest physical gas market and much hope is being placed on the new merged
hub becoming a leading hub, as will be explained later. However, the results of the churn for both
NCG and GPL are poor and, despite combined total traded volumes being some 3¼ times larger than
those at VTP, the combined net churn is much lower and the gross churn a little lower. 24 Again, this
position does not augur well for the new merged German hub.
Other notable changes from 2019 are that PSV is continuing to slowly climb up the rankings, whilst
TRF is stagnant (and dropping a place to be positioned behind PSV), and the two Belgian hubs
combined have dropped by almost 20%, mainly due to the ZEE hub. Finally, and despite being last in
the rankings, the Spanish PVB churns (both net and gross) rose by about 1/3 rd and the gross churn,
at 0.4, is more than that at the Czech VOB and almost the same as at each of the Belgian hubs.
4. NBP continues to slip but the Belgian ZEE is worst performer in 2020
When looking at the development of the total traded volumes over the past seven years the gradual
decline of the NBP is clear to see, fairly slowly at first but, since 2018 it has been more pronounced.
The overall combined ZEE and ZTP traded volumes have also been declining slowly but surely over
the whole period; there was an apparent uplift in early 2020 due to an increase in ZTP volumes but
this was not sufficient to counter the heavy drop in ZEE volumes: together the Belgian traded volumes
fell by 100TWh from 2019 to 2020.25
Figure 1 shows the traded volume development for all the main hubs from 2014 to 2020. In order to
be able to show comparative trends better on the chart, the TTF line represents that hub’s total
volumes divided by ten and the NBP line represents that hub’s total volumes divided by five.
20
The net churn is the total traded volumes at a given hub, divided by its consumption, as defined and used by the EU.
21
The gross churn is the total traded volumes at a given hub, divided by its physical demand or throughput.
22
The gross churn increased by 36.6% year on year, the largest increase of all the hubs listed in the table.
23
From the PVB grid; there have been historically some large re-exports of LNG.
24
The combined churn rates for Germany are Net Churn 3.48; Gross Churn 1.88.
25
The reasons behind the fall in NBP and ZEE were explained in Heather (2020), pp.6-7.
7
The contents of this paper are the author’s sole responsibility. They do not necessarily represent the views
of the Oxford Institute for Energy Studies or any of its Members.The figure clearly shows the wide variations between the European hubs with TTF firmly set at the top
with NBP in second; they are followed by a band of middle ranking hubs led by NCG, PSV and GPL,
slightly ahead of VTP, TRF and the Belgian hubs; at the bottom of the graph are the remaining three
hubs: VOB, PVB and the Polish VPGS.
Apart from a small and short-lived peak in early 2019, the NCG has remained relatively flat in third
place over the past seven years, with the GPL hub rising only very gradually; the PSV however, can
be seen to have consistently increased its traded volumes over the period, surpassing GPL since the
start of 2019. The TRF has also been almost unchanged over the period, although it did increase its
volumes marginally in 2018 and a little bit more in 2019. The Austrian VTP having started this period
below TRF and the Belgian hubs, has had a consistent gradual rise in traded volumes to end up
above those hubs at the end of 2020.
All the hubs show a dip in 202026 before rebounding at the end of the year.
By examining the traded volume development over this period, it is clear that the lack of progress of
NCG and GPL, both in absolute terms and in comparison to the other hubs, does not augur well for
the new merged German hub.
Figure 1: Traded volume development: 2014–2020
Sources: LEBA; ICIS; ICE; ICE-Endex; EEX; Powernext; PEGAS; CEGH; GME; CME; MIBGAS; TGE; P.
Heather
26
This is in direct response to a drop in physical demand after the outbreak of the Covid-19 pandemic.
8
The contents of this paper are the author’s sole responsibility. They do not necessarily represent the views
of the Oxford Institute for Energy Studies or any of its Members.5. A summary of the traded gas hubs in 2020
Table 4 summarises the 5 Key Elements in 2020 for the 11 main traded gas hubs in Europe. The
combination of each of the Key Elements and their respective scores is what determines the overall
rankings of the hubs, as can be easily observed by the colour coding, used in the table and in the
map.
TTF and NBP are still the only two mature 27 ‘tier one’ hubs, scoring a maximum 15 and 13
respectively. Interestingly for the hub that ‘led the way’ in terms of market liberalisation, copied to a
large extent by Continental Europe, NBP is now becoming more focused once more on spot/prompt
balancing needs and on the near to mid-curve with the front months, quarters and seasons contracts
trading the most and with much less interest than in previous years on contracts further forward. This
has led to a slightly lower score this year for the traded products which has lost NBP another point in
the hub score.
There is then a gap to the four active 28 ‘tier two’ hubs. Compared to 2015, the Italian PSV has jumped
from a score of 7 to 10 in 2020; the Austrian VTP up from 6 to 9; but the two German hubs are
essentially the same29 as five years previously, both at 9. This confirms the other factors that show
that the German hubs have generally fared badly despite their potential for growth and that the Italian
and Austrian hubs have in fact continued to progressively move forward on all counts.
Table 4: Summary of the 5 Key Elements - 2020
Source: Calculated from previous tables
27
Those hubs with a score of 12/15 or more.
28
Those hubs with a score of 8/15 to 11/15.
29
In 2015 NCG had a hub score of 10/15 and GPL a score of 8/15.
9
The contents of this paper are the author’s sole responsibility. They do not necessarily represent the views
of the Oxford Institute for Energy Studies or any of its Members.Of the five poor30 ‘tier three’ hubs the French TRF has stayed unchanged since its hub score of 7 in
2015, despite the small increase in traded volumes described in the previous section, and the ZEE
hub31 has dropped a point. However, both the remaining Spanish PVB and the Czech VOB have
increased their hub score, from 3 and 4 respectively.
Not surprisingly, as the hub score is reflective of the result of each of the 5 Key Elements, the position
of the two existing German hubs is clearly one of middling ‘tier two’ hubs that have not really
progressed over time; this does not augur well for the new merged German hub.
The remaining 11 hubs shown as operational but ‘inactive’ on Map 1 are still struggling to develop; all
but the PVT, Baltic and VTT were described in detail in Heather (2019).32 Several of these hubs have
been established for a number of years but have struggled to gain traction, in particular the Greek
HTP, which has yet to actually start trading anything other than very small quantities of balancing gas.
This has been due to various political, regulatory and IT issues although, according to Argus Media, 33
the Greek system operator Desfa expects a gas trading platform to be finally launched in June 2021,
operated by HEnEx, and initially offering just spot and prompt products; Month-ahead and near curve
products will be added at a later stage.
Trading at the Danish hubs fell by a massive 60% from 2019 with the reduction in OTC trading the
greatest. The Hungarian MGP fell by a large amount also, overall a decrease of 31% all in the
exchange trading whereas the OTC saw a very slight increase. The Slovak SVOB however, had a
53% increase in trading, all of which is OTC, albeit from a much lower base. As in 2019, the Irish hubs
do not appear 34 to have traded more than some balancing deals. The Turkish UDN hub saw a
marginal increase in traded volumes.
Table 5: Traded volumes: emerging hubs - 2020
Sources: ICIS, PEGAS, TGE, CEEGEX, HUDEX, EPİAŞ, BGH, GET Baltic, BRM; P. Heather
30
Those hubs with a hub score of 5/15 to 7/15.
31
In 2015, the results for ZEE also incorporated those of ZTP.
32
See: Heather (July 2019), pp.18-22.
33
See Argus Media, 23rd November 2020: https://www.argusmedia.com/en/news/2162554-june-launch-for-greek-gas-trading-
platform
34
Despite searching the TSO and broker websites, the Author has not found any data on wholesale gas trading for 2020.
10
The contents of this paper are the author’s sole responsibility. They do not necessarily represent the views
of the Oxford Institute for Energy Studies or any of its Members.Table 5 does not include the Irish hubs but does show the traded volumes in 2020 for the remaining nine emerging hubs, including the two newly formed hubs and the Baltic-Finland trading area. According to the total traded volumes, Romania’s gas hub has got off to a good start. There is no established OTC market in the country and wholesale gas trading has been taking place for some time on the two regulator licensed ‘centralised gas markets’, the state owned OPCOM 35 and the private Romania Commodity Exchange (BRM36). In October 2019, the Romanian gas TSO (Transgaz) signed a cooperation agreement37 with the Austrian CEGH to establish and operate the PVT virtual gas hub in Romania from February 2020. It is very difficult to find out whether all of the trading reported by the two exchanges was for delivery at the PVT although the BRM Framework Contract for the Sale-Purchase of Natural Gas, 38 as updated in October 2020, does state that deliveries are to be made at the virtual hub. What can be ascertained is that all trading in 2020 was exchange physical forwards and not cleared futures derivatives, some of it executed in auction sessions and some in continuous trading. The BRM had about 93% of total volumes but does not clearly display the data on its website; the Author found the data in a BRM presentation39 to the Energy Community. The OPCOM had very few trades indeed listed on their website: no Within Day, no Day Ahead and no OTC cleared deals at all. The site does list
Bulgartransgaz set up the Balkan Gas Hub (BGH) trading platform in January 2019, which went live
on 2nd January 2020 46 and offers spot and forward contracts 47 , as well as a brokering service,
conducted on the Trayport Exchange Trading System. In its first year of trading, total trades
amounted to 3.38TWh of which forward contracts accounted for 83%. The BGH website 48 states that
the trading platform aims to successfully become “the first liquid physical and trading gas hub in the
South Eastern Europe region”.
Moving to north-east Europe, the traded gas markets there have been developing very slowly towards
a common gas market but more still needs to be done to achieve the goals set out in the energy
treaty signed in 2015.49 The gas markets of Latvia and Estonia have now merged50 and, together, will
further merge with Finland’s gas market during 2021. In the interim, and following the signing of an
Inter TSO Compensation agreement,51 those three countries have operated a single gas transmission
tariff zone since January 2020. However, despite the earlier energy treaty, Lithuania’s participation in
a fully merged Baltic-Finland balancing zone is currently uncertain.
The merged LV-EE zone, the single transmission tariff and the commissioning of the Balticconnector
pipeline have certainly improved liquidity in those markets, traded on the GET Baltic exchange
platform. 52 Lithuanian market traded volumes have also improved and, since early 2020, the
exchange has also posted the combined traded volumes of the three market areas under the banner
of ‘Baltic-Finland’ and the volumes in the table are these as listed on the exchange’s website. 53
There is no standardised OTC contract as such but, according to ICIS, “a large number of deals are
still occurring bilaterally”.54 At the exchange, traded volumes have slowly been increasing but are still
relatively small, accounting in total for about just 11% of the combined area’s physical demand;55 92%
of the combined traded volumes were in the spot products, whereas trading at each market area was
sporadic in the monthly products and LV-EE did not trade monthly products at all. FI traded in just 6
months of the year and LT in 9 months.
The goal of a regional Baltic hub is currently partly achieved in that all four market areas can be
traded on the one exchange and from 2021 three of the countries will have formed a single Market
Area but, until Lithuania agrees to merge its zone with the other three, there cannot be a true ‘Baltic’
Market Area.

6. What are the prospects for the new German hub and the other second tier
hubs?
According to the Author’s classification of European hubs, as shown by the colour scheme in Map 1,
there are four tiers of the operational hubs in Europe: two Mature hubs, four Active hubs, five Poor
hubs, and ten Inactive hubs. The second tier hubs are PSV, NCG, GPL, and VTP.
The question asked in the introduction was whether the new merged German hub, or one of the other
two active hubs, could aspire to being more than just a national hub? Could one of them become a
regional hub? This section will assess how each of the Active hubs is faring and what is their outlook.

46
   Bulgartransgaz press release, November 2019: https://bulgartransgaz.bg/en/news/balkan-gas-hub-starts-multilateral-e-trade-
in-the-natural-gas-market-in-bulgaria-and-the-region-566.html
47
   Within-Day, Day-Ahead, Weekend, Individual Days; 60 forward Months, 20 forward Quarters, 5 forward Calendar Years.
48
   Balkan Gas Hub: https://www.balkangashub.bg/en
49
   See Heather (2015), p.39.
50
   ICIS European Gas Hub Report, Q4-2020, p.52.
51
   See Heather (July 2019), p.21.
52
   The Lithuanian products were launched in 2012, the Latvian and Estonian in 2017, and the Finish in 2020.
53
   See: https://www.getbaltic.com/en/market-data/trading-data/
54
   ICIS European Gas Hub Report, Q4-2020, p.51.
55
   The physical gas demand of the Baltic States plus Finland amounted to about 65TWh.

                                                                                                                          12
     The contents of this paper are the author’s sole responsibility. They do not necessarily represent the views
                           of the Oxford Institute for Energy Studies or any of its Members.
Additionally, it will review the progress of the gas market in Ukraine which, although still in its infancy,
has made a lot of progress in moving towards a liberalised traded market and has the aspiration of
becoming a regional hub for south east Europe.
It could be argued that all of the current second tier hubs (the Active hubs) could or indeed should
have already performed better over the past decade; the reality is that the composition of the second
tier hubs has changed over the past ten years but they have been of very little ‘threat’ to the mature
hubs, according to their trading presence and characteristics. The German NCG has always been in
this category, although the German GPL only became an Active hub in 2015; two years later they
were joined by the Austrian VTP and Italian PSV both just behind the German hubs. These four hubs
were still the only Active hubs in 2020 but their order has changed with the PSV having a hub score of
10/15, ahead of NCG, VTP and GPL, each on 9/15 but then ranked according to the other metrics.56
Before assessing the prospect of the new German hub becoming more prominent and even becoming
a regional hub, it is worth reviewing the progress of the French traded gas market as it too is today
the result of successive hub mergers; the TRF in 2020 was ranked 7th and is classified as a poor hub.
The TRF is the result of the consolidation of the five French balancing hubs, 57 created in 2004, to the
present day two, with just one trading area. It was expected to bring more liquidity to the market and
to boost its place among its neighbouring hubs. Unfortunately, the French traded gas market has
been very slow to develop and analysis of the trading results given in the Five Key Elements shows
that they have barely changed over the past few years; indeed, comparing 2015 with 2020, the only
clear change is that the traded volumes have increased from 500TWh to 890TWh and that compares
with 430TWh58 in 2011.59 Despite this being an increase of just over double in ten years, only a little
less than the increase for the German hubs combined, it pales into insignificance when compared to
PSV, TTF and VTP.60
This example does not bode well for the promise of greater liquidity at the new Trading Hub Europe
(THE), the merged German gas hub due to commence trading on 1st October 2021.
There used to be 19 balancing zones in Germany which, after a period of consolidation between 2009
and 2011,61 resulted in the two hubs today. After that last merger in 2011 there was immediately talk
of continuing the process and creating just one hub for the whole country. A group of long-distance
TSOs expressed their disapproval of a further consolidation of gas market areas and various
alternative proposals were suggested. These included some form of market coupling of gas trading
and capacity trading between the two areas, without the need for merging the whole grid system.
Following the inconclusive long-term results of the French market coupling between PEG Nord and
PEG Sud, this idea was rejected.
In 2012, all 12 German TSOs submitted a cost-benefit analysis of a merger of the two German gas
market areas to BNetzA62 as part of their obligations under the Gas Grid Access Ordinance, the result
of which was that the idea was rejected on the grounds that the costs far outweighed any potential
benefits63 to the consumer. Despite the methodology of their analysis having been disputed, it was
generally felt at that time that a further consolidation of market areas was not urgent.
56
See Table 4.
57
For more detail, see Heather (2012), pp.18-20; and Heather (2020), p.8.
58
This volume was for the PEG Nord balancing area, the most traded by far of the three balancing areas in 2011.
59
Although the Author did not calculate the 5 Key Elements in 2011, the traded volume rankings (in TWh) in that year were:
NBP 18000, TTF 6295, NCG 880, ZEE 870, PEG Nord 430, GPL 310, PSV 185, VTP 170.
60
NCG+GPL increased by 2.8 times; PSV increased by 7.9 times; TTF by 7.4 times; and VTP by 5.9 times.
61
For more detail, see Heather (2012) pp.16-17.
62
Bundesnetzagentur, the German energy regulator.
63
For more detail, see Heather (2015), p.16.
13
The contents of this paper are the author’s sole responsibility. They do not necessarily represent the views
of the Oxford Institute for Energy Studies or any of its Members.Following the updated Gas Target Model 2, published by ACER in January 2015, which set out
criteria to assess the liquidity of wholesale natural gas markets and a process for regulators to review
whether their market areas met these criteria, BNetzA deemed that NCG and GPL did not fully meet
the criteria and that they should consider the proposed options for market integration.
This led to a period of consultation with the German gas industry, culminating in a draft amendment to
the Gas Network Access Ordinance in May 2017, 64 which was passed into law that August.65 The
amended Section 21 states that “Gas transmission system operators forming market areas pursuant
to Section 20 shall cooperate with the aim of increasing liquidity in the gas market.66 They shall
merge the two existing market areas to form one joint area no later than 1 April 2022”. 67 It is
interesting to note that the stated aim for merging the two hubs is to increase market liquidity.
Once that the Amendment was passed into law, the industry started to work collaboratively on how
best to make the target of hub merger happen. Several working groups were established under the
banner of the Market Area Convergence project (Marco). Three alternative start dates were
considered: 1st October 2021, 1st April 2022, and 1st October 2022; the TSOs opted for the earliest
date as being the most manageable from an operational point of view.
In April 2021, a cooperation agreement was signed 68 between NCG and GPL and a joint project
website was launched.69 The website talks about “GPL and NCG [being] two of the most liquid trading
hubs” and the press release says that the new hub “is to become one of the most attractive and liquid
gas trading hubs in Europe”. They have also created a new hub joint TSO website, optimistically
called tradinghub.eu!70
Simply calling the new hub ‘Trading Hub Europe’ and creating such an appropriately named domain
name will not in themselves make the new THE more liquid than the existing combined NCG and GPL
hubs are today; indeed, that aspiration is a long way from the reality, as demonstrated in the analysis
of the hubs shown in this paper. The combined churn rates are far from reflecting a mature liquid
market, the total traded volumes are reasonable and are ‘the best of the rest’ after TTF and NBP but,
it must be stressed that the TTF volumes are over 14 times greater than NCG and GPL combined!
The NCG press statement went even further by stating that “due to its central location in the heart of
Europe, the new Germany-wide market area will act as an international hub linking other European
gas markets”.71 There would need to be a massive and fundamental shift towards trading at the THE
before it could even start to encroach on TTF’s dominance and be deemed a true ‘hub for Europe’.
The best result that is realistically achievable is to regain 3 rd place in the overall rankings, after TTF
and NBP, just ahead of PSV and VTP, although given that both these hubs have improved so much in
the past few years, even that goal might be elusive.
The Italian PSV has indeed come a long way since 2011 both in its own right and compared to the
combined German hubs and currently looks set to continue to improve its standing amongst the
European hubs. There has been a strong political will in Italy to see a strong PSV gas hub that can
64
See Ministry Press Statement, 24th May 2017: https://www.bmwi.de/Redaktion/EN/Pressemitteilungen/2017/20170524-
bundeskabinett-bringt-aenderung-der-gasnetzzugangsverordnung-auf-den-weg.html
65
See the BNetzA Gas Net-work Access page:
https://www.bundesnetzagentur.de/EN/Areas/Energy/Companies/NetworkAccess_Metering/GasNetworkAccess/GasNetworkAc
cess_node.html
66
Emphasis in the original text.
67
For a brief overview of the background to the merger, see the Market Area Convergence project (Marco) presentation at the
eWorld conference in Essen, 6th February 2019: http://www.marktgebietszusammenlegung.de/wp-
content/uploads/Presentation_eworld_2019_02_06_EN.pdf
68
See NCG press release, 22nd April 2021: https://www.net-connect-germany.de/en-
gb/Home/ctl/NewsDetails/mid/1564?popUp=false&newsID=B0858B1B-516E-410F-B69D-E0761F89B3D0
69
https:// www.marktgebietszusammenlegung.de/en/Home
70
https://www.tradinghub.eu/en-gb/Home
71
Emphasis added.
14
The contents of this paper are the author’s sole responsibility. They do not necessarily represent the views
of the Oxford Institute for Energy Studies or any of its Members.provide a marker price for Mediterranean gas and this has resulted in significant changes to its market
structure, especially since 2014. The result is a PSV hub that has gone from 7 th in the European
rankings in 2011 to 4th in 2020. The combined German hubs’ traded volumes were 6.4 times greater
than PSV’s in 2011 and only 2.3 times greater in 2020. That shows the relative difference in market
development between the two countries.
The Author commented in a previous paper 72 that “although the PSV hub is not perfect and still has
further to go on the road to maturity, it could become the reference hub for southern Europe, giving
the pricing signals to attract LNG and possibly become, in time, a supply route for gas into northern
Europe”; that statement remains true in 2021.
Turning to the remaining second tier hub, the Austrian VTP, it is also clear that this hub has
progressed very well since 2011. It is the virtual hub that took over in Austria from the previous
physical CEGH trading point, established in January 2013 after politically driven reform 73 aimed at
improving that country’s gas market liquidity, a similar aim as that stated today for the new German
hub. Although less spectacular than at PSV, nonetheless the VTP has seen its total traded volumes
increase nearly six-fold from 2011 to 2020, but from a slightly lower base than the Italian hub. This
places the size of the VTP very nearly one third that of the combined German hubs.
Because of the very large and important Baumgarten physical import terminal, bringing pipeline gas
from eastern Europe into the Austrian grid for onward transportation to Italy, Germany and the Czech
Republic, the geographical importance of the VTP cannot be understated. However, now that TTF
has become the leading gas benchmark for Europe, and despite the improving trading results of VTP,
it remains difficult to judge how it can grow much more. The most positive prospect for VTP is to
consolidate its already growing position as a reference pricing hub for eastern European countries, in
particular, Slovakia, Hungary, Bulgaria and Romania.
That prospect though will depend on the developments in the eastern and southeastern European
gas markets, where there has been much talk of creating a regional hub for many years now. 74
Greece first mentioned its aspiration to become such a hub in the early 2010’s and so too have other
countries such as Romania and Bulgaria. More recently, Ukraine has come to the fore as being a
contender.
Ukraine is a member of the Energy Community 75 and has been keen to align itself with the EU’s
energy Directives. In so doing, it has implemented a number of reforms starting the process of
liberalisation in the energy markets and in gas these have already had a marked effect. It has started
to dismantle the incumbent’s76 monopoly and unbundled the TSO and other parts of the business.
There is also a burgeoning exchange, the UEEX,77 which offers gas contracts; these are primarily pre-
payment trades conducted during several auction sessions per day and not what are referred to as
exchange trading in western Europe. The contracts offered are primarily spot/prompt with low
volumes traded, and some forward months with limited trading.
However, there is still much more to do. 78 A proposed gas release programme has been debated for
some time now and remains to be agreed and brought in; the exchange needs to offer post-payment
trading and, ideally, cleared trading; further reforms of the physical upstream and downstream are
needed and more unbundling.
72
See Heather (March 2019), pp.27-29.
73
For more information, see Heather (2012), pp.14-16.
74
For more information, see Heather (2015), pp.50-55.
75
The Energy Community is an international organisation which brings together the European Union and its neighbours to
create an integrated pan-European energy market.
76
Naftogaz.
77
Ukrainian Energy Exchange: https://www.ueex.com.ua/eng/
78
See Energy Commission Position Paper: “Gas market design in Ukraine”, November 2020: www.energy-
community.org/news/Energy-Community-News/2020/11/26.html
15
The contents of this paper are the author’s sole responsibility. They do not necessarily represent the views
of the Oxford Institute for Energy Studies or any of its Members.Despite the apparent barriers, there is a strong willingness on the part of the Energy Community to help Ukraine develop its energy markets, as well as concrete financial and advisory help from international bodies such as the EBRD, the World Bank and USAid. Given Ukraine’s geographical position and its good gas pipeline connections with Poland, Slovakia, Hungary, and Romania, with their onward connections to Bulgaria, Greece, Austria, Czech Republic, and Germany, there is much at stake with their gas market reform. The real possibility, if they get it right, would be to become in time an east European regional gas hub. 7. TTF amongst the global pricing benchmarks for gas The Author has been following the development of gas trading activity in the Asia-Pacific region for a number of years and, since 2019, has developed a methodology to try to compare the churn rates 79 of the main representative gas markets around the world. The Dutch TTF is truly the leading pricing benchmark for North-West Europe and indeed many other European countries also, as well as being used to price some LNG cargoes destined for Europe. It has become an investment asset class80 in its own right and there are signs that it is becoming a global benchmark too. Not only have the TTF total traded volumes grown to such an extent that its gross churn has very nearly doubled in 3 years, its churn calculated against the much greater physical consumption figure of the countries surrounding the Netherlands, and whose shippers are known to be using TTF for their risk management, has now grown to over 20 times. This section looks at TTF in the global context, alongside the other European benchmark, NBP, and against the US Henry Hub (HH), and the LNG pricing benchmark, JKM. 81 As described in detail in last year’s paper,82 Henry Hub is the pricing benchmark in North America,83 with most of the other 32 Market Centers (or hubs) being priced by differential against it. HH is used to price physical gas contracts in North America, and is also used to price some LNG cargoes destined for South America, Asia and Europe. It is extensively used for risk management of physical gas portfolios and is an investment asset class in its own right. The British NBP was the north west European benchmark hub for over a decade but has since lost that mantle to TTF; it remains the pricing benchmark for the British Isles and is also used to price most LNG cargoes destined for the British Iles. Finally, and although not strictly a ‘hub’, the JKM has become the pricing benchmark for LNG cargoes delivered into Asia, although it has also been used to price LNG cargoes to other parts of the world. For the purposes of calculating the churn rates, the relevant denominators used are the gas consumption in the United States, Canada and Mexico for HH; the gas consumption in France, Germany, Austria, Czech Republic, and Benelux for TTF; the gas consumption in the United Kingdom and the Republic of Ireland for NBP; and the LNG imports into Japan, Korea, Taiwan, and China for JKM. Table 6 shows the results of this global comparison and uses a similar colour coding84 to the Author’s European hubs analyses. It shows which benchmarks are illiquid, mature, liquid and very liquid. The results clearly show that HH is the premier global gas benchmark with an impressive churn of 57 (up 79 Note that these are calculated using consumption as the denominator and so for TTF and NBP the results are different to the gross churn rates in Table 3. For JKM, the denominator is LNG imports. 80 Part of the Futures asset class of investments. 81 Japan Korea Marker, a price marker published daily by S&P Global Platts. 82 See Heather (2020), pp.9-10. 83 It is the most used benchmark in the US and Mexico, although less so in Canada where three liquid local hubs are also used; see: https://www.cer-rec.gc.ca/en/data-analysis/energy-commodities/commodity-prices-trade-updates/ 84 Dark Green/Very Liquid:=/>40; Mid Green/Liquid:15
from 45.5 times last year) when compared to US consumption alone. The rise can be attributed to a
large increase in HH trading,85 set against a small fall in physical consumption. There is no doubt that
this is a very mature and very liquid gas pricing benchmark and remains so even after Mexican
consumption is added (the churn falls slightly to 54 times) and after including Canadian consumption
(the churn is a little lower still at 47 times).
TTF, when compared to the consumption in the five countries of its main sphere of influence, has a
very respectable churn of 21.4 (up from 17.9 times last year). The rise can be attributed to a large
increase in TTF trading, set against a fall in physical consumption. 86 There is no doubt that this is a
mature and liquid gas pricing benchmark.
Table 6: Global Gas Benchmarks Churn Ratios - 2020

Sources: JODI, S+P Global Platts, CME, LEBA, ICIS, ICE, ICE-Endex, PEGAS; P. Heather

NBP, when compared to the consumption across the United Kingdom and the Republic of Ireland,
has a churn of 11.8 times (down from 13.4 last year); this is due to both a large fall in total traded
volumes and quite a large fall in physical consumption in the UK and Ireland. 87 It can still, however, be
considered a mature gas pricing benchmark.
S&P Global Platts refined their JKM price assessment to use a MOC88 methodology in early 201889
and it is effectively still in its infancy as a reference price marker. Nevertheless, it is being used

85
   Total HH ICE+CME traded volumes, 2019: 430715TWh; 2020: 526747TWh; an increase of 22.3%.
86
   Total TTF traded volumes rose 15.6% year/year; physical consumption in the stated countries fell by 3.7%.
87
   Total NBP traded volumes fell by 19.4% year/year; physical consumption in the stated countries fell by 8.3%.
88
   Market On Close.
89
   Since Q2-2018, the JKM price assessment has been according to MOC assessment methodology. For more information, see
‘How does Platts assess JKM™?’: https://www.spglobal.com/platts/en/our-methodology/price-assessments/lng/jkm-japan-
korea-marker-gas-price-assessments

                                                                                                                    17
     The contents of this paper are the author’s sole responsibility. They do not necessarily represent the views
                           of the Oxford Institute for Energy Studies or any of its Members.
increasingly to price LNG spot cargoes and some medium-term cargoes, for delivery in the Asia-
Pacific region; it has also been used to price cargoes for delivery further afield.
There are two exchanges offering JKM futures and options derivative contracts, 90 the ICE and CME.
Trading at these exchanges has grown exponentially over the past few years, albeit from a very low
base,91 reaching 832,501 lots in 2020, an increase of 50% over 2019 and equivalent to 160MT LNG.
Physical JKM cargoes are offered for sale, bid to purchase, and traded on the Platts APAC 92 tab of
the webICE trading platform. It is this, and especially the MOC ‘window’ from 4-4.30pm Singapore
time, that provides S&P Global Platts with the necessary data to be able to assess the JKM daily
marker price.
There is no doubt that this marker price is gaining support from the LNG industry, with producers,
aggregators and buyers using it more each year. In 2020, the number of bids placed during the MOC
window totaled 643, the number of offers 473, and 37 trades were concluded; this is equivalent to
approximately 2.42MT. These may not seem large numbers but they are genuine physical bids, offers
and deals that help set the price of many more physical cargoes that are then priced using the JKM
marker. Indeed, Platts have indicated93 to the Author that a recent snapshot of public domain LNG
cargo deals reveals that there were 23 cargoes with full or partial JKM indexation.
Asia has started to liberalise its gas markets but still has a long way to go; the increase in short term
and spot LNG trades94 and the use of the JKM as a price formation process are helping the transition
to take place. The JKM, when compared to its main sphere of influence, has a churn of 0.79 (up from
0.54 times in 2019 and just 0.20 in 2018). This is an illiquid market but is clearly showing signs of
growth. The rise can be attributed to the very large increase in JKM trading, set against a small
increase in physical consumption.95
8. Conclusion
Previous publications by this Author have followed and analysed the development of the European
traded gas hubs. Map 1 illustrates how the vision set out some 20 years ago of a fully liberalised
European traded gas market is now almost fulfilled, with just a few more changes needed to be made.
Portugal has no virtual trading hub, although there is a regulated ‘virtual point’, and there is no
balancing zone with daily balancing, as required under the European Network Code. Any balancing is
done against the Spanish PVB and, despite the MIBGAS exchange offering PT contracts, there have
been no such trades at all. This situation needs to be resolved by either developing PT trading or
realising the PT/ES merged Iberian Gas Hub. 96 Croatia and Slovenia have liberalised their gas
markets but there is no standardised OTC trading, no exchange trading, and indeed no virtual gas
hub.97
Other countries such as Greece do now have a virtual gas hub set up but one that does not yet trade,
nor is there an OTC traded market. Its neighbouring countries - Bulgaria, Romania and Hungary - are
finally making strides to develop gas trading, as explained in section 5 of this Paper. Ukraine,
although not a European Union Member State, has aligned its energy policies with EU policy and is in
90
JKM derivatives trading was launched in 2012.
91
Total JKM ICE+CME traded volumes, 2015: 2791 lots/0.5MT; 2017: 50476 lots/10MT; 2019: 556565 lots/107MT.
92
APAC = Asia Pacific.
93
Telephone interview and emails, 15th June 2021.
94
GIIGNL 2021 Annual Report, p.7: Spot and short-term trades 2019:119MT (34% total trades); 2020: 142.5MT (40% total
trades), an increase in volume of 19.8%.
https://giignl.org/sites/default/files/PUBLIC_AREA/giignl_2021_annual_report_apr27.pdf
95
Total LNG imports into JKTC rose by 2.5% from 199MT in 2019 to 204MT in 2020.
96
A description of the proposed Mercado Ibérico del Gas (Mibgas) regional hub is given in Heather (March 2019), pp. 6-7.
97
For more information on the situation in Portugal, Croatia and Slovenia, see Heather (July 2019), pp.21-22.
18
The contents of this paper are the author’s sole responsibility. They do not necessarily represent the views
of the Oxford Institute for Energy Studies or any of its Members.You can also read