2020 SUMMER RESOURCE ADEQUACY IN THE ERCOT REGION - May 7, 2020 - National Energy ...
←
→
Page content transcription
If your browser does not render page correctly, please read the page content below

2020 SUMMER RESOURCE
ADEQUACY IN THE ERCOT
REGION

May 7, 2020

DOE/NETL-2020/2603
Disclaimer

This report was prepared as an account of work sponsored by an agency of the United
States Government. Neither the United States Government (USG) nor any agency
thereof, nor any of their employees, makes any warranty, express or implied, or assumes
any legal liability or responsibility for the accuracy, completeness, or usefulness of any
information, apparatus, product, or process disclosed, or represents that its use would
not infringe privately owned rights. Reference therein to any specific commercial
product, process, or service by trade name, trademark, manufacturer, or otherwise
does not necessarily constitute or imply its endorsement, recommendation, or favoring
by the USG or any agency thereof. The views and opinions of authors expressed therein
do not necessarily state or reflect those of the USG or any agency thereof.

All images in this report were created by the National Energy Technology Laboratory
(NETL), unless otherwise noted.
Cover page photo: © mimadeo / Adobe Stock
2020 SUMMER RESOURCE ADEQUACY IN THE ERCOT REGION

Authors
Kirk Labarbara,1 ShangMin Lin,1 C. Elise Logan1, John H. Brewer, III2*

1Deloitte, Mission Execution and Strategic Analysis (MESA)
2NETL
*Corresponding contact: John.Brewer@netl.doe.gov, 304-285-4858

Acknowledgements
The authors would like to recognize and thank Mr. Peter Warnken, Manager of Resource
Adequacy at the Electric Reliability Council of Texas, for his careful review and insightful
comments on this study.

Suggested Citation:
K. Labarbara, S. Lin, C. E. Logan, J. Brewer, "2020 Summer Reliability in ERCOT," National
Energy Technology Laboratory, Pittsburgh, February 18, 2020.

This report was prepared by MESA for the U.S. Department of Energy (DOE) NETL. This
work was completed under DOE NETL Contract Number DE-FE0025912. This work was
performed under MESA Activity 202.004.004.
2020 SUMMER RESOURCE ADEQUACY IN THE ERCOT REGION

This page intentionally left blank.
2020 SUMMER RESOURCE ADEQUACY IN THE ERCOT REGION

TABLE OF CONTENTS
List of Exhibits .............................................................................................................................. i
Acronyms and Abbreviations .................................................................................................. ii
Executive Summary ................................................................................................................. 1
1 Historic Resource Adequacy in ERCOT ........................................................................... 2
2 ERCOT Summer Scenarios ...............................................................................................19
3 Summary ..........................................................................................................................24
4 References .......................................................................................................................25

LIST OF EXHIBITS
Exhibit 1-1. Graph of ORDC..................................................................................................... 3
Exhibit 1-2. Hourly capacity, demand, and reserve for ERCOT on August 13 2019 ............ 5
Exhibit 1-3. Hourly capacity, demand, and reserve for ERCOT on August 15, 2019 ........... 6
Exhibit 1-4. Average annual real-time energy market and natural gas prices [17] ........... 7
Exhibit 1-5. ERCOT Estimate Summer Reserve Margin and Average Energy Market Price
from 2012 to 2019 [19] ............................................................................................................. 7
Exhibit 1-6. ISO/RTO averaged monthly average real-time energy market price ($/MWh)
[21] ............................................................................................................................................ 8
Exhibit 1-7. ERCOT generation capacity changes and projection changes from 2014 to
2022 [22] ................................................................................................................................... 9
Exhibit 1-8. ERCOT new vs retired (retired before 2019) thermal generation plant emission
performance and efficiency [21] ..........................................................................................10
Exhibit 1-9. CREZ and projects (2014) ....................................................................................12
Exhibit 1-10. ERCOT wind generation cumulative and proposed capacity (MW) with IA
signed (as of January 8, 2020) [29]........................................................................................12
Exhibit 1-11. ERCOT monthly natural gas price compares to monthly hub average real-
time and day ahead market LMP (top) and ERCOT monthly natural gas generation
percentage (bottom) [21] .....................................................................................................14
Exhibit 1-12. ERCOT EEA matrix...............................................................................................15
Exhibit 1-13. ERCOT ERS deployment on August 13, 2019 ....................................................16
Exhibit 1-14. Demand response scenarios and calculations ...............................................17
Exhibit 1-15. Reserve margin estimation by ERCOT CDR from 2020 to 2024 [13] ...............18
Exhibit 2-1. Peak load under scenarios .................................................................................20
Exhibit 2-2. Available generating capacity ..........................................................................20
Exhibit 2-3. Base scenario (76,696 MW peak) .......................................................................21
Exhibit 2-4. Base + Outages (80,727 MW peak) ....................................................................21
Exhibit 2-5. Base + Outages + Extreme Weather (83,979 MW peak) ..................................22
Exhibit 2-6. Base + Outages + Extreme Weather + Past Wind (83,979 MW peak)..............22
Exhibit 2-7. Number of days with reserve shortfall under four modeled scenarios ............23

 i
2020 SUMMER RESOURCE ADEQUACY IN THE ERCOT REGION

ACRONYMS AND ABBREVIATIONS
CDR Capacity, Demand and MESA Mission Execution and Strategic
 Reserves Analysis
CO2 Carbon dioxide mins Minutes
CONE Cost of new entry MMBtu Million British thermal unit
COVID-19 Coronavirus disease 2019 MW Megawatt
CREZ Competitive Renewable MWh Megawatt hour
 Energy Zone(s) NERC North American Electricity
DC Direct current Reliability Corporation
DOE Department of Energy NETL National Energy Technology
EEA Energy Emergency Alert Laboratory
EORM Economically optimal reserve NG Natural gas
 margin NOx Nitrogen oxides
ERCOT Electric Reliability Council of OPEC+ Organization of Petroleum
 Texas Exporting Countries plus
ERS Emergency Response Service Russia
GW Gigawatt PJM PJM Interconnection
HSL High sustained limit PRC Physical responsive capability
Hz Hertz PTC Production tax credit
IA Interconnection agreement PUCT Public Utility Commission of
 Texas
IMM Independent market monitor
 RE Reliability Entity
ISO Independent system operator
 RTO Regional transmission
ITC Investment Tax Credit
 organization
kV Kilovolt
 SARA Seasonal Assessment of
kWh Kilowatt-hour Resource Adequacy
LaaR Loads acting as a Resource SO2 Sulfur dioxide
lbs Pounds SPP Southwest Power Pool
LMP Locational marginal price TDSP Transmission and/or Distribution
LOLE Loss of load expectation Service Provider
LOLH Loss of load hours TSP Transmission Service Provider
LTRA Long-Term Reliability U.S. United States
 Assessment VRE Variable renewable energy
Mcf Million cubic feet resources
MERM Market equilibrium reserve
 margin

 ii
2020 SUMMER RESOURCE ADEQUACY IN THE ERCOT REGION

EXECUTIVE SUMMARY
Anticipated reserve margins in the Electric Reliability Council of Texas (ERCOT) have risen from
the 8.6 percent reported in ERCOT’s Final Seasonal Assessment of Resource Adequacy (SARA)
for Summer 2019 to 10.7 percent for Summer 2020 in ERCOT’s Capacity, Demand and Reserves
[CDR] report published in December 2019 and 2020 Summer Preliminary SARA published in
March 2020. [1] [2] [3] This is well below the current minimum target reserve margin of 13.75
percent set by the ERCOT Board of Directors [4], and only slightly above the 10.25 percent
market equilibrium reserve margin (MERM), and 9.0 percent economically optimal reserve
margin (EORM) levels identified by Brattle in a study done for ERCOT in late 2018. [5] Despite
tight operating conditions, ERCOT was able to maintain the system with no load shedding
events over 2018 and 2019. [6]
Using data from ERCOT’s Preliminary 2020 Summer SARA, CDR, and historical performance data,
three economic dispatch scenarios using PROMOD were developed to assess the risk to ERCOT
of a load shedding event for Summer 2020.a The results suggest that ERCOT could make it
through the summer season without a loss of load event, as long as the weather remains
normal, even though ERCOT will be well below its minimum reserve margin target. However, if
demand reaches previous growth adjusted historical peak levels, ERCOT is likely to find itself
operating in emergency conditions during the summer peak, which is usually the end of July
through mid-August. Under these conditions, on multiple days load would exceed capacity;
although ERCOT would call on its operating tools to maintain reliability and continue serving
load, those measures alone may not be sufficient to avert a shedding of load. Of course,
electricity demand in ERCOT is currently being depressed due to the global Coronavirus disease
2019 (COVID-19) pandemic. Load associated with the oil and gas industry may recover slowly
from low oil prices. Whether and how economic activity within Texas rebounds as the state re-
opens during its perennially hot summers, along with need for more power generation, remains
highly uncertain at the time of this writing.

a These scenarios were completed prior to the issuance of ERCOT’s Final SARA for Summer 2020, which projects a peak
load 1,496 MW lower than the preliminary

 1
2020 SUMMER RESOURCE ADEQUACY IN THE ERCOT REGION

1 HISTORIC RESOURCE ADEQUACY IN ERCOT
In 2012, Electric Reliability Council of Texas (ERCOT), working with the Public Utility Commission
of Texas, commissioned The Brattle Group (“Brattle”) to investigate the question of whether
ERCOT’s market design could sufficiently maintain resource adequacy. Unlike other
independent system operators (ISOs) and regional transmission organizations (RTOs) that
operate capacity, energy, and ancillary service markets, ERCOT operates only energy and
ancillary service markets. When Brattle’s study, “ERCOT Investment Incentives and Resource
Adequacy,” was published, ERCOT was struggling to attract investment in new generation
projects, and reserve margins were predicted to fall below 10 percent. [7]
The Brattle study determined that if ERCOT maintained only a 10 percent reserve margin, this
would, on average, “result in approximately one load-shed event per year with an expected
duration of two-and-a-half hours, and thirteen such events in a year with a heat wave as severe
as the one in 2011.”b [7] In 2011, Texas experienced both extreme cold weather, with a record
winter peak demand in February, and unusually hot weather, with June–August temperatures
that were the hottest on record. The average 24-hour statewide temperature from June through
August was 86.8 degrees Fahrenheit, the hottest three months on record. [8] Dallas experienced
70 days where temperatures hit 100 degrees Fahrenheit that summer. [9] In August of that
year, ERCOT was forced to trigger emergency operating procedures six times. [7]
In another Brattle study, "Estimation of the Market Equilibrium and Economically Optimal
Reserve Margins for the ERCOT Region," which was completed in 2018 as an update to the 2014
study “Estimating the Economically Optimal Reserve Margin in ERCOT,” the market equilibrium
reserve margin (MERM) and the economically optimal reserve margin (EORM) of ERCOT’s
wholesale electric market were estimated. [10] [5] The MERM describes the reserve margin that
the market can be expected to support in equilibrium, as investment in new supply resources
responds to expected market conditions, where a marginal unit’s revenue and cost of a new
entry (CONE) intersect. The EORM represents a balance between increased capital costs and
decreased reliability-related operating costs and provides a gauge for evaluating the expected
MERM. Under projected 2022 market conditions, the suggested EORM is 9.0 percent, and the
MERM is 10.25 percent. At the given MERM value, the system could expect to experience 0.5
events per year loss of load expectation (LOLE),c and 0.8 events per year LOLE at the EORM
value. [5]
To address the absence of the capacity market to attract new resources for the market, ERCOT
implemented the Operating Reserve Demand Curve (ORDC) on June 1, 2014. The ORDC is used
to create a real-time reserve price adder, to reflect the value of reserves in the real-time market,
based on the probability that reserves for the ERCOT system fall below a minimum level of

b For reference, the traditional 1 day-in-10 years reliability planning criteria used by industry equates to 2.4 hours per year.
c LOLE is defined as the expected number of days in which the available generation capacity is insufficient to serve the
demand at least once per day. LOLE counts the days meeting this criterion, regardless of the number of consecutive or
nonconsecutive hours in the day. [41] For reference, the traditional 1 day-in-10-years reliability planning criteria used in
industry is reflected on an LOLE basis. On loss of load hours (LOLH) basis; this is equivalent to 2.4 hours per year. Both are
unconcerned with the magnitude or number of outages. [42]

 2
2020 SUMMER RESOURCE ADEQUACY IN THE ERCOT REGION

2,000 MW. The ORDC curve is constructed by Value of Lost Load (VOLL), System Lambda (λ), and
Loss of Load Probability (LOLP), as shown in the following equation:
 = ( − λ) ×
Where VOLL is set to be equal to the system wide offer cap, which is currently 9,000 $/MWh; λ
is the price of matching generation and demand at the reference bus; and LOLP is calculated by
a normal distribution built from the historical difference between hour ahead reserve and real-
time reserve.d A typical ORDC graph is shown in Exhibit 1-1. Roughly speaking, the ORDC makes
nearly zero impact when the reserve is above 6,000 MW. Value increases as reserves tighten,
reaching the maximum when reserves drop below 2,000 MW.

 Exhibit 1-1. Graph of ORDC

 Used with permission from ERCOT [11]

Then, ERCOT uses the ORDC to calculate two price adders: Real-Time On-Line Reserve Price
Adder for all resources that could be available to dispatch within 30 minutes, and Real-Time Off-
Line Reserve Price Adder for all other resources that could be available to dispatch within an
hour. These two price adders are then incorporated into the ERCOT real-time energy market to
pay resources for their value of reserves and energy. Note that ORDC and its associate price
adders are only used in the ERCOT real-time energy market; they are not included in the ERCOT
day-ahead energy market.

d More detailed mathematical discussion for the ORDC and LOLP can be found in an ERCOT online course and training.
[45]

 3
2020 SUMMER RESOURCE ADEQUACY IN THE ERCOT REGION

In response to low reserve margins in recent years, the Public Utilities Commission of Texas
(PUCT) directed ERCOT to adjust the ORDC in 2019, particular in the calculation of LOLP to make
energy prices rise faster when reserve is low. Generation groups like Vistra Energy support this
change; they believe ERCOT should have proper price signals to support generation investment
for maintaining resource adequacy during periods of peak demand. [12]
After adjusting its market design to attract new generation investment and maintaining higher
reserve margins for several years, ERCOT began to realize the problem predicted by Brattle for
2014, with a projected reserve margin of 10.62 percent back in Summer 2018 and 8.36 percent
in Summer 2019. The predicted reserve margin increases slightly to 10.7 percent going into
Summer 2020.
The ERCOT Board of Directors has set the region’s planning reference margin level at 13.75
percent. [13] The North American Electricity Reliability Corporation (NERC) 2019 Long-Term
Reliability Assessment (LTRA) projected an anticipated reserve margin of 10.24 percent for
ERCOT in 2020. [6] In the early fall of 2017, ERCOT was notified of the retirements of 9 coal-
fired generating units between 2018 and 2020, which constitute the bulk of the retiring 5,622
megawatts (MW), which is around 6 percent of the total current system generation resource
capacity. In December 2019, ERCOT published its Capacity, Demand and Reserves (CDR) report,
which forecasts a reserve margin of 10.7 percent for Summer 2020. [2] Compared to the 13.75
percent reference reserve margin, the capacity shortfall is due to strong load growth in West
Texas, cancellation of gas-fired plants for 1,277 MW, and the delay of some new solar projects
for 1,056 MW. [2]
Comparing the forecast in the CDR and Summer 2020 Preliminary Seasonal Assessment of
Resource Adequacy (SARA) to Summer 2019 Final Seasonal Assessment of Resource Adequacy,
the adjusted peak demand increased from 74,853 MW to 76,696 MW.e This comes from robust
growth of oil and gas exploration activity in West Texas. [1] However, these values were
published prior to the domestic impact of Coronavirus disease 2019 (COVID-19) and the severe
collapse in oil prices driven by the destruction of fuel demand. While the total impact on these
factors on summer electricity supply and demand remain uncertain, ERCOT is proceeding with
the preparation of a revised summer peak demand forecast based on the latest county-level
economic forecasts provided by Moody’s Analytics. The revised peak demand forecast will be
included in ERCOT’s final summer SARA report to be released May 13, 2020. With current
demand profiles that ERCOT is reporting due to COVID-19, where daily peaks have been 2
percent lower and overall energy demand has been 4–5 percent below normal, the region may
not see peak summer demand at levels that require emergency actions to be taken. [14]
Total resource capacity increased from 78,929 MW to 82,430 MW. The majority of this capacity
increase comes from wind, followed by solar and natural gas-fired generation. Note that the
final 10.7 percent reserve margin from the CDR considers demand response programs under
ERCOT’s control, which include registered Load Resources that provide operating reserves in the
day-ahead Ancillary Service market, Energy Response Service (discussed in detail later in this

e Note that the peak demand in Summer 2019 was 74,820 MW, which was very close to the 2019 SARA forecast value.

 4
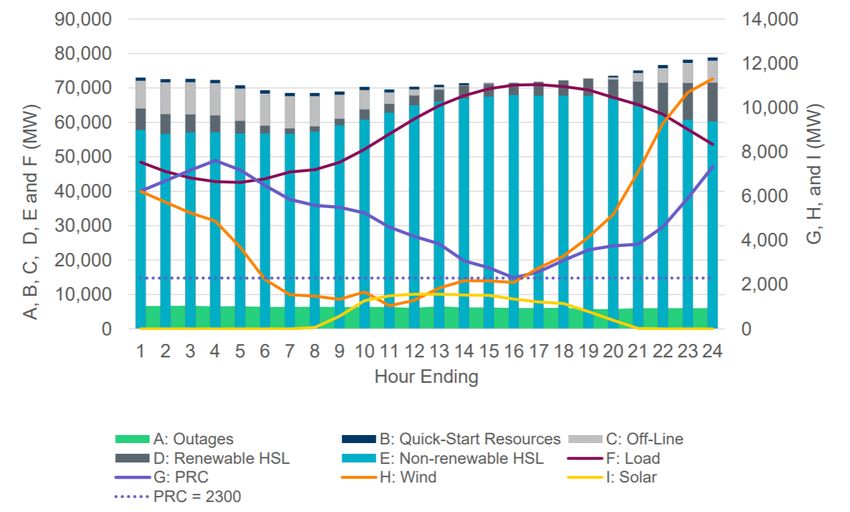
2020 SUMMER RESOURCE ADEQUACY IN THE ERCOT REGION

section), and utility-offered load management programs triggered during summer-season
Energy Emergency Alerts (EEAs) declared by ERCOT. These programs account for 2,216 MW.
For Summer 2019, there were multiple days with tight resource adequacy and low operating
reserves; ERCOT announced EEA Level-1 events twice.f However, on the peak demand day
August 12, no EEA was announced due to greater wind generation than occurred on the days
with EEA-1 events (2,549 MW more than predicted in the 2019 Final SARA; lower than SARA
projected wind presented when reserves reached their lowest levels on the days with EEA-1).
For both EEA Level-1 (EEA1) days, August 13 and August 15, Emergency Response Service was
deployed, and more than 900 MW of load reduction responded. This prevented the need for
escalation to EEA Level-2 (EEA2) or EEA Level-3 (EEA3) and an LOLE event due to rotating
outages. Detailed generation, reserve, and demand variation for these two days are shown in
Exhibit 1-2 and Exhibit 1-3. [15]

 Exhibit 1-2. Hourly capacity, demand, and reserve for ERCOT on August 13 2019g

 Used with permission from ERCOT [15]

f More detail about ERCOT EEA definition can be found in Exhibit 1-12 later in this section.
g HSL: High Sustained Limit; PRC: Physically Responsive Capacity

 5
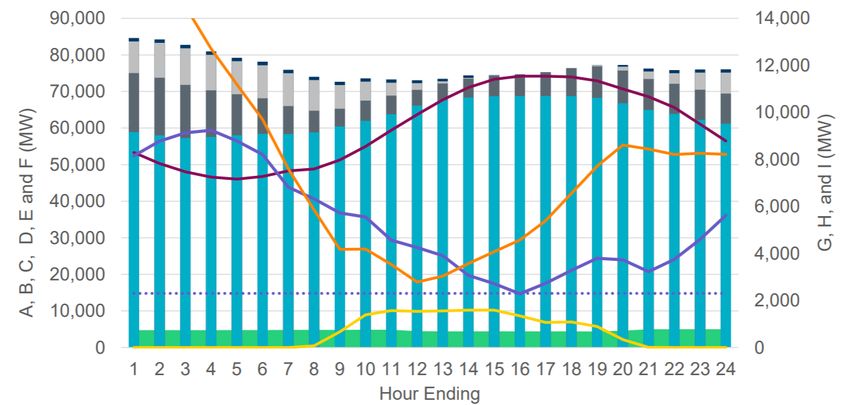
2020 SUMMER RESOURCE ADEQUACY IN THE ERCOT REGION

 Exhibit 1-3. Hourly capacity, demand, and reserve for ERCOT on August 15, 2019

 Used with permission from ERCOT [15]

An October 2017 article in Power magazine points to a roughly 50 percent drop in wholesale
power prices in ERCOT’s energy market since 2011 as the primary driver of the recent plant
retirements. [16] In 2016, average annual real-time energy market prices in ERCOT were
$24.62, down from $53.23 in 2011, although they increased slightly in 2017 to $28.25, as seen
in Exhibit 1-4. [17] The Power article posits that coal and nuclear units in ERCOT are becoming
unprofitable, and the retirements announced in the fall of 2017 were economic decisions by
generator owners who determined that the plants were unable to earn a profit under existing
market conditions. [16] In 2018, AEP Texas also scheduled to retire Oklaunion, a 650-MW coal-
fired power plant in 2020 due to unfavorable market condition. AEP Texas stated that the cost to
generate energy from Oklaunion is no longer competitive in ERCOT. [18] Note that in Exhibit 1-4,
the ERCOT real-time energy market price in 2018 jumped to $35.63 per megawatt-hour (MWh),
a 26 percent increase from 2017.h This was due to the combination of increased natural gas
prices and decreased capacity reserve margins. [17]

h The ERCOT 2019 State of the Market Report has not yet been released as of the date of this publication.

 6
2020 SUMMER RESOURCE ADEQUACY IN THE ERCOT REGION

 Exhibit 1-4. Average annual real-time energy market and natural gas prices [17]

 $60 $6

 $50 $5

 $40 $4

 $/MMBtu
 $/MWh

 $30 $3

 $20 $2

 $10 $1

 $0 $0
 2010 2011 2012 2013 2014 2015 2016 2017 2018 2019

 Average annual real-time energy market prices Natural gas prices

The recent thermal plant retirements result in a lower summer reserve margin for these years.
The lower reserve margin is a major factor causing higher summer energy prices, as shown in
Exhibit 1-5. The reserve margins are the estimated values from SARA and CDR reports published
by ERCOT each year, not the operating reserves from summer peak days. As seen in Exhibit 1-5,
the reserve margin has dropped nearly half from 17.71 percent to 8.36 percent from 2015 to
2019, while the average summer energy price increased from $25.50/MWh to $47.45/MWh
from 2015 to 2019. The energy prices are from ERCOT’s real time energy market average hub
prices in June, July, August, and September. [19]

 Exhibit 1-5. ERCOT Estimate Summer Reserve Margin and Average Energy Market Price from 2012 to 2019 [19]

 $50 25%
 $45
 Average Summer Energy Price ($/MWh)

 Estimated Reserve Margin
 $40 20%
 $35
 $30 15%
 $25
 $20 10%
 $15
 $10 5%
 $5
 $0 0%
 2012 2013 2014 2015 2016 2017 2018 2019

 Average Summer Price Reserve Margin

 7
2020 SUMMER RESOURCE ADEQUACY IN THE ERCOT REGION

A lower reserve margin not only helps cause higher average energy market price in summer, but
also results in higher price fluctuations. Exhibit 1-6 shows the monthly hub average real-time
energy prices in ERCOT compared with those for other ISOs/RTOs in the United States (U.S.)
over the last seven years. While the overall energy price is relatively low in ERCOT, energy price
spikes occur in winter and summer, when demands are highest and wind resources reach their
lowest seasonal output levels. Energy price ranges from $15 to $97 per MWh in ERCOT, which is
the 5th largest swing among market regions; only ISO New England and ISO New York
experienced wider swings of $145 and $99, respectively. Price spikes in ERCOT are significantly
higher in Summer 2019 than previous years. On August 13, 2019, real-time energy price even
reached the market price cap of $9,000/MWh, [20] showing the resource adequacy problem
ERCOT is facing as a result of low reserves.

 Exhibit 1-6. ISO/RTO averaged monthly average real-time energy market price ($/MWh) [21]

 $180
 Monthly Average Real-Time Energy

 $160
 Market Price ($/MWh)

 $140
 $120
 $100
 $80
 $60
 $40
 $20
 $0
 Dec-12 Aug-13 Apr-14 Dec-14 Sep-15 May-16 Jan-17 Sep-17 May-18 Feb-19 Oct-19
 California ISO ($48.25) PJM ISO ($73.79) SPP ($24.89)
 New York ISO ($99.02) Midcontinent ISO ($43.53) New England ISO ($145.74)
 ERCOT ISO ($81.87)
 Values in legend indicate the range between the lowest and highest prices in each respective region.

The generation capacity changes to date and projected changes within ERCOT from 2014 to
2022, are shown in Exhibit 1-7. Wind and natural gas capacity compose the majority of new
generating capacity in ERCOT, while solar generation saw steady relative growth. In 2017,
ERCOT added more than five gigawatts (GWs) of new capacity, with 57 percent coming from
variable renewable energy (VRE) sources. In 2020, more than 13 GW of new capacity will be
added with more than 98 percent being VRE. Coal has been the largest capacity on a fuel type
basis that has been retired to date with an additional 650 MW of coal-fired capacity scheduled
to be retired on October 1, 2020. Apart from coal, about 3.7 GW of natural gas has also retired
from 2014 to 2019 with 804 MW of natural gas-fired capacity currently scheduled to be retired
by late 2021.

 8
2020 SUMMER RESOURCE ADEQUACY IN THE ERCOT REGION

 Exhibit 1-7. ERCOT generation capacity changes and projection changes from 2014 to 2022 [22]

 15,000
 13,000
 11,000
 9,000
 Capacity (MW)

 7,000
 5,000
 3,000
 1,000
 -1,000
 -3,000
 -5,000
 2014 2015 2016 2017 2018 2019 2020 2021 2022

 New Gas New Wind New Solar Retired Gas Retired Coal

 Note: Negative capacity indicates retirement, while positive capacity indicates addition

The following plots further compare the fossil fired generation fleet between the new
generation on-line and retired generation within the last five years. The top three plots of
Exhibit 1-8 show that newly added natural gas capacity emission rates are much less than that
of the retired capacity. The newly added generators have a zero-emission rate for sulfur dioxide
(SO2) for most months since 2014. With higher emission rate capacity retiring and lower
emission rate natural gas capacity and VRE coming on-line, overall emissions in ERCOT are
declining. The very bottom plot of Exhibit 1-8 shows the efficiency comparison between newly
added and retired generation in ERCOT. Newly added generators have a higher average
efficiency than retired generators from July 2014 to December 2018. Note that the retired
plants (red curve) stops at December 2018 because all retired power plants had ceased
generation by December 2018.

 9
2020 SUMMER RESOURCE ADEQUACY IN THE ERCOT REGION

 Exhibit 1-8. ERCOT new vs retired (retired before 2019) thermal generation plant emission performance and
 efficiency [21]

 200

 Weighted Average CO2
 150

 Emission Rate
 (lb/MMBtu)
 100

 50

 0
 14-Aug 27-Dec 10-May 22-Sep 4-Feb 18-Jun
 Wtd Avg CO2 Emissions Rate - New Wtd Avg CO2 Emissions Rate - Retired

 0.25
 Weighted Average NOx

 0.2
 Emission Rate

 0.15
 (lb/MMBtu)

 0.1
 0.05
 0
 Aug-13 Dec-14 May-16 Sep-17 Feb-19 Jun-20
 Wtd Avg NOx Emissions Rate - New Wtd Avg NOx Emissions Rate - Retired

 0.3
 Weigthed Average SO2

 0.2
 Emission Rate
 (lb/MMBtu)

 0.1

 0
 Aug-13 Dec-14 May-16 Sep-17 Feb-19 Jun-20
 Wtd Avg SO2 Emissions - New Wtd Avg SO2 Emissions - Retired

 0.5
 Average Plant Efficiency

 0.4
 0.3
 0.2
 0.1
 0
 Aug-13 Dec-14 May-16 Sep-17 Feb-19 Jun-20
 Efficiency - New Efficiency - Retired

There are other factors behind the retirement of at least one of these plants, the Big Brown
plant owned by Vistra Energy Corp. As part of a planned merger with Dynegy, Inc., Vistra was
directed by PUCT in PUCT Control No. 47801 to divest itself of at least 1,281 MW of generation
to avoid market power concerns. In order to comply, Vistra chose to market three natural gas

 10
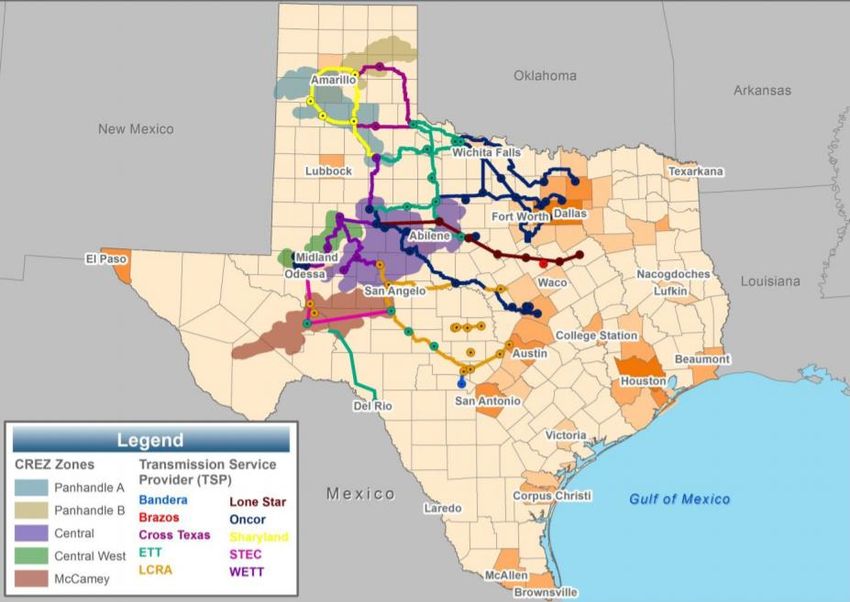
2020 SUMMER RESOURCE ADEQUACY IN THE ERCOT REGION

plants and to market, or retire, in the absence of a buyer, the two units, total 1.2 GW, coal-fired
Big Brown plant. [23] [24]
Since the majority of new generation in ERCOT’s queue is either natural gas, wind, or solar, as
discussed above, the decline in wholesale power prices is being driven by the dynamics of
increased natural gas-fired generating capacity, low natural gas prices, and subsidized wind
power. [16] In the view of ERCOT’s independent market monitor (IMM), Potomac Economics,
lower wholesale power prices are proof that market competition is working, and that less
efficient, higher-cost generation is being driven out of the market in favor of lower-cost
generation. [16] [17]
A 2017 report by IHS Markit offers a different assessment of the state of ERCOT’s energy
market. IHS Markit asserts that subsidizing the cost of renewable generation is distorting the
market, causing the share of wind generation to exceed its cost-effective level. [25] The study
argues that wind output is disproportional to the ERCOT demand curve, which means wind
generates more power while demand and market clearing prices are lower. With subsidies, it
distorts the wholesale energy prices and even causes negative prices in ERCOT.i On the other
hand, major transmission projects have been built to transmit renewable-generated power, and
the cost of those projects is not accounted for in wholesale energy prices.
One of the largest transmission investment projects in Texas was the establishment of
Competitive Renewable Energy Zones (CREZ). In 2005, Texas Senate Bill 20 was passed requiring
the design of a transmission plan to deliver wind generation from windy, but less populated
CREZ in West Texas, to end-users in Texas demand centers (Exhibit 1-9). The CREZ transmission
projects were completed in 2014 and are able to accommodate 18.5 GW of electricity flow with
approximately 3,600 circuit miles of 345-kilovolt (kV) transmission lines. The total project cost
was around $6.9 billion. [26] After the completion of the CREZ transmission projects in January
2014, wind curtailment dropped to 0.5 percent from 17 percent back in 2009, but with more
and more proposed wind and solar generation projects in the queue, congestion could possibly
return as these projects enter service if transmission constraints return. Benefitting from
federal and state subsidies, including the wind production tax credit (PTC), an additional total of
about 23.1 GW of wind capacity has been proposed, with more than 8 GW of wind generation
having signed interconnection agreements (IAs) with posted financial security and slated to
come online in 2020, as shown in Exhibit 1-10; however, only 3.5 GW is approved for
synchronization, as of the time of writing. [27] Because of the intermittent nature of wind
generation, ERCOT optimistically expects to receive a 63% contribution from coastal projects,
29% from projects in the Texas panhandle, and 16% from projects elsewhere in the state, based
on the historical performance of existing projects during average weather conditions. [3] This
means that ERCOT only plans for 637 MW from this 3.5 GW (18%) and potentially less, if
conditions approach those projected in the SARA low wind scenario.

iA November 2019 study by authors from Lawrence Berkeley National Lab concluded that the frequency of negative
prices in the ERCOT West region has ranged from below 2% to nearly 10% across the period covering 2011 to 2017. [44]

 11
2020 SUMMER RESOURCE ADEQUACY IN THE ERCOT REGION

 Exhibit 1-9. CREZ and projects (2014)

 Used with permission from ERCOT [28] [26]

 Exhibit 1-10. ERCOT wind generation cumulative and proposed capacity (MW) with IA signed (as of April 13,
 2020) [29]

 40,000
 35,000
Generation Capacity (MW)

 30,000
 25,000
 20,000
 15,000
 10,000
 5,000
 0

 Cumulative Installed, No FS, and FS Posted Cumulative MW Installed
 Cumulative MW Synchronized IA Signed-Financial Security Posted
 IA Signed-No Financial Security Other Planned

 12
2020 SUMMER RESOURCE ADEQUACY IN THE ERCOT REGION

PTC is a production-based credit for the first 10 years of a wind generation project’s operation.
It was set at 1.5 cents per kilowatt-hour (kWh) in 1992 and is indexed to inflation so it is now
worth 2.5 cents per kWh pre-tax in 2019. [30] This is close to some wholesale electricity prices
in the United States. [31] The Department of the Treasury has estimated PTC to be the most
expensive energy-related tax credit, and 47th most expensive overall, under the U.S. tax code,
with $1 to 4 billion in credits forecast annually from 2020 to 2029, for a total of nearly $34
billion.j [32] Wind capacity beginning construction after December 31, 2019, no longer qualifies
for the credit under the phase-out and sunset provisions set by Congress in late 2015.
While traditional generation resources receive some federal subsidies, they are not as
substantial as the PTC. With the PTC, wind generation is able to bid into the market at prices
lower than its true cost, thereby undercutting other forms of generation. IHS Markit estimates
that without subsidized wind, the market clearing price in ERCOT during peak periods would
have been about one-third higher in 2014. Although IHS Markit does not state that wind
subsidies are the cause of plant retirements in ERCOT, this price change would be large enough
to change the economic calculation for recently retired coal- and gas-fired generating units. [25]
For solar energy, the Solar Investment Tax Credit (ITC) is a significant subsidy to support the
growth of solar energy in the United States. The ITC was created and enacted in 2006 with the
passage of the Energy Policy Act of 2005. Since then, solar energy has grown rapidly, with
average annual growth of 50 percent over last decade. After the multi-year extension passed by
Congress in 2015, ITC provides a 30 percent tax credit for investment in an eligible solar
residential or commercial property that began construction by 2019. Commercial solar projects
that begin construction in 2020, 2021, or 2022 will get a 26, 22, or 10 percent tax credit,
respectively. For residential solar projects, the same tax credits apply for projects that begin
construction in 2020 or 2021. [33] The Department of the Treasury has estimated that the ITC
will provide a total of almost $27 billion in credit from 2020 to 2029.k [32]
Low natural gas price is also a major driver for the decreasing wholesale power price ERCOT. The
top plot of Exhibit 1-11 shows the correlation between natural gas price, day ahead, and real-
time LMP in ERCOT. The natural gas price curves and LMP curves have similar trends and
fluctuations except for a few LMP summer spikes. The bottom plot of Exhibit 1-11 shows the
monthly natural gas generation percentage, on a MWh basis as a percentage of all energy
generated in ERCOT in each month. As seen in the plot, ERCOT relies heavily on natural gas-fired
electricity generation, with more than 50 percent of natural gas in summer. ERCOT’s IMM,
Potomac Economics, also points out that natural gas prices have and will continue to be a
primary driver for the electricity prices. [17] With coal plants retirement and new natural gas
plants added in the ERCOT power grid, the electricity price in ERCOT might become more
volatile and experience larger price fluctuation. This is because coal prices are historically more
stable than natural gas, and natural gas price fluctuations can lead to unstable LMP prices.
Unlike other regions of the nation where natural gas price volatility often drives the highest

jFor comparison, the much more politicized and publicly visible Earned Income Tax Credit and Student Loan Interest
deductions are projected at $52 billion and $24 billion, respectively, over the same period.
kFor an additional comparison the nearly $61 billion value of the combined ITC and PTC exceeds the combined total of
all other energy-related tax credits and deductions by more nearly $16 billion. [32]

 13
2020 SUMMER RESOURCE ADEQUACY IN THE ERCOT REGION

spikes in LMP seen throughout the year, spikes in ERCOT are primarily driven by increased
demand during the summer cooling season. [34]

 Exhibit 1-11. ERCOT monthly natural gas price compares to monthly hub average real-time and day ahead
 market LMP (top) and ERCOT monthly natural gas generation percentage (bottom) [21]

 $180 $14.00
 $160
 $12.00
 $140
 $10.00

 NG Price ($/Mcf)
 $120
 LMP ($/MWh)

 $100 $8.00

 $80 $6.00
 $60
 $4.00
 $40
 $2.00
 $20
 $0 $-
 Oct-06 Jul-09 Apr-12 Dec-14 Sep-17 Jun-20

 ERCOT Day Ahead LMP ERCOT Hub Real Time LMP NG Price

 70%

 60%
 NG Generation Percentage

 50%

 40%

 30%

 20%

 10%

 0%
 Oct-06 Jul-09 Apr-12 Dec-14 Sep-17 Jun-20
 NG Percentage

 Source: ABB Velocity Suite and EIA

Not everyone shares IHS Markit’s perspective on the impact these price distortions have on
ERCOT’s market. A Greentech Media article published in June 2018 argues that ERCOT has
saved customers billions by not developing a capacity market, while also maintaining resource
adequacy and transitioning to cheaper sources of electricity. [35] The article acknowledged that
ERCOT would be operating with tight reserves in Summer 2018, but maintained that ERCOT had
enough operating tools to manage a situation where peak load might come close to exceeding

 14
2020 SUMMER RESOURCE ADEQUACY IN THE ERCOT REGION

available capacity. In fact, Texas did not suffer from any energy emergency events during
Summer 2018, and in 2019, only two EEA1 events occurred on August 13 and 15.
ERCOT has defined EEA levels and procedures to utilize operational tools and send out alert
communications when reserve is low to maintain system reliability. ERCOT uses physical
responsive capability (PRC) as a trigger for EEA. [36] [37] PRC represents the grid’s response
time to disturbances from online generating and load resources. The real-time PRC is published
on the ERCOT System Ancillary Service Capacity Monitor page.l The EEA trigger criteria and
corresponding operation for each level are shown in Exhibit 1-12. In Summer 2011, with the
severe heat wave, ERCOT issued EEA1 six times and EEA2 twice. As stated in the previous
section, ERCOT issued EEA1 twice in Summer 2019.

 Exhibit 1-12. ERCOT EEA matrix
 Emergency
 Trigger Criteria Grid Operation Other Operation
 Level
 PRC < 2,500 MW • Issue “Watch” to ERCOT Market • Notify PUCT and
 Control
 with no expectation Participants Texas RE
 Room
 to recover within • Release non-spinning reserves • Provide update to
 Watch
 30 minutes (mins) ERCOT board
 • Issue EEA 1 to ERCOT Market Participants • Contact utility
 • Import energy from DC tie • Update grid
 PRC < 2,300 MW
 EEA1 – • Implement 30-minute ERS condition on social
 with no expectation
 Power
 to recover within • Deploy responsive reserve media and update
 Watch
 30 mins • Launch TDSP load management program app status
 • Release news if
 appropriate
 PRC < 1,750 MW • Issue EEA 2 to ERCOT Market Participants
 with no expectation • Deploy demand response resource
 EEA2 – to recover within • Deploy remaining ERS
 Power 30 mins or • Instruct transmission service provider to Same as above
 Warning frequency below use voltage reduction
 59.91 Hz for more • Begin block load transfer to other grids
 than 15 mins
 PRC < 1,000 MW • Issue EEA 3 “Rotating Outages” to ERCOT
 with no expectation Market Participants
 EEA3 – to recover within • Instruct transmission operators for load
 Power 30 mins or shedding Same as above
 Emergency frequency below
 59.91 Hz for more
 than 15 mins

In addition to internal generation resources, ERCOT can utilize direct current (DC) ties to import
energy from neighboring systems. There are two DC ties between ERCOT and the Southwest
Power Pool (SPP) and three DC ties between ERCOT and Mexico’s state-owned electric utility,
Comisión Federal de Electricidad. The combined DC ties allow the import of up to 1,250 MW to
help ERCOT manage tight reserves. [38] There are also switchable generation units on the

l http://www.ercot.com/content/cdr/html/as_capacity_monitor.html

 15
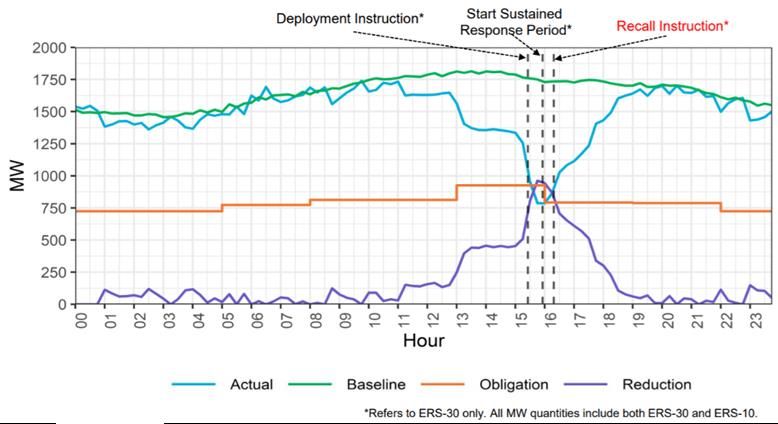
2020 SUMMER RESOURCE ADEQUACY IN THE ERCOT REGION

border of the ERCOT grid that can provide electricity to ERCOT, if needed. These switchable
units serve customers in SPP or the Midcontinent ISO but maintain an operating agreement
with ERCOT allowing ERCOT to request assistance from these units during an energy emergency.
ERCOT procures Emergency Response Services (ERS) three times annually (for four-month
service) to help avoid load shedding during a grid emergency. Qualified loads and generators
can offer to provide ERS to ERCOT through their qualified scheduling entities. ERCOT publishes
the procurement results on their website.m As an example, for Time Period 4 (17:00 to 19:00)
from February 1 to May 31, 2019, ERCOT procured 825 MW of non-weather sensitive 30-
minutes response time ERS from 361 load resources and 26 generation resources. [39]. These
generation and demand response resources can help ERCOT avoid a load shedding event during
energy emergency situations.
Demand response is an ability from the load side to reduce or shift electricity consumption
when the price is high or when the reliability of the grid is endangered. Customers who are
capable of demand response can participant in ERCOT’s market in three ways. The first is to
become an ERCOT Load Resource to participate in ERCOT’s day-ahead energy market, real-time
energy market, or ancillary service market. The second is to participate in ERCOT ERS (as
described above). The last method is to opt into the transmission or distribution utility’s
demand response program. On August 13, 2019, the ERCOT EEA 1 announcement day, ERS
were deployed as shown in Exhibit 1-13 to ease the emergency condition.

 Exhibit 1-13. ERCOT ERS deployment on August 13, 2019

 Used with permission from ERCOT [15]

In ERCOT, price responsive load may not receive proper price benefit of their load shifting action
because the load zone settlement point prices are the average of 5-minute bus locational
marginal prices (LMP) during the 15-minute period. The payment of retail load is to multiply 15-
minute energy by the 15-minute settlement point price. This calculation will cause
disconnection when load demand’s response action is based on 5-minute price. For example,

m http://www.ercot.com/services/programs/load/eils/

 16
2020 SUMMER RESOURCE ADEQUACY IN THE ERCOT REGION

Exhibit 1-14 lays out a theoretical example of price responsive and non-price responsive load
scenarios with identical total electricity usage. With the current ERCOT settlement calculation,
the options result in the exact same amount of electricity cost during this 15-minute period,
indicating there is no benefit for demand response. In the demand response scenario, load
should be paying only $15,000 (300 kWh times $50/kWh), which is half of the cost shown in
Exhibit 1-14.

 Exhibit 1-14. Demand response scenarios and calculations

 0-5 minute 5-15 minute 10-15 minute 15-minute
 Scenario Price Cost
 ($125/kWh) ($125/kWh) ($50/kWh) (kWh)

 Demand
 0 kWh 0 kWh 300 kWh 300 kWh $100/kWh $30,000
 Response
 Flat
 100 kWh 100 kWh 100 kWh 300 kWh $100/kWh $30,000
 Demand

ERCOT realized that demand response load is not receiving proper benefits and planned to
address it by integrating telemetry signals for 5-minute energy usage data. An extra credit or
charge would be created by multiplying 5-minute energy by 5-minute LMP. This credit or charge
would be applied to an ERCOT Balancing Account. By fixing this problem, it helps to attract
more responsive loads and the current responsive loads to respond better to real-time market
price. [40]
Another point made by the Greentech Media article is that there is uncertainty around the
correct reserve margin. [35] Utility standard for decades has been to plan to a one day in ten
years’ LOLE. However, LOLE events are rare enough that it is difficult to determine what level of
reserves are necessary to prevent such an event. This is especially true now that transmission
operators have increasingly sophisticated tools at their disposal for managing load, including
demand response and interruptible load. A 2014 paper by Brattle suggested that to plan for the
1-in-10 LOLE standard, ERCOT needed a reserve margin of 14.1 percent, although in its
consideration, the economically optimal reserve margin was 10.2 percent. [10] Under the 10.2
percent reserve margin scenario, ERCOT could still meet a 24-hours in 10 years loss of load
hours (LOLH) standard (e.g., 2.4 hours in a given year). Under such a standard, an LOLE event is
unlikely to be a sustained system-wide blackout, but controlled rolling outages that leave
individual customers without power for several minutes. [10]
There is potential for several EEA events in ERCOT during Summer 2020 due to the low capacity
reserve. ERCOT plans to utilize its operational tools and ask consumers for voluntary
conservation to manage the operation during these EEA events. Once all resources are
deployed, ERCOT can instruct transmission or distribution providers to initiate rotating outages
to protect the entire grid. However, it is not clear whether these tools will be sufficient.
Exhibit 1-15 shows the summer reserve margin forecast beyond 2020 based on ERCOT CDR. The
reserve margins will have a sudden increase in 2021 (around 5 percent and 8 percent for the
May and December 2019 CDR respectively), and then steadily decrease under both curves. The
increase in 2021 is caused by new planned resources. The majority of those resources are

 17
2020 SUMMER RESOURCE ADEQUACY IN THE ERCOT REGION

renewable—about 5 GW of solar and 2 GW of wind. After the generation surge in 2021, there
are few generation increases but steady load growth, which results in reserve margin decline.
Even though the reserve margin is decreasing after 2021, it will stay above the NERC reserve
margin level of 13.75 percent until 2024 according to the latest CDR forecast. Note that it is
typical for generation developers to submit interconnection requests up to two to four years
before the plan in-service dates. Therefore, CDRs will report little planned capacity beyond four
years, and planning reserve margin will always decrease as long as load growth is positive.

 Exhibit 1-15. Reserve margin estimation by ERCOT CDR from 2020 to 2024 [13]

 20%

 15%

 10%

 5%

 0%
 2020 2021 2022 2023 2024

 May 2019 CDR December 2019 CDR Reserve Margin Level

 18
2020 SUMMER RESOURCE ADEQUACY IN THE ERCOT REGION

2 ERCOT SUMMER SCENARIOS
ERCOT releases several resource adequacy assessments throughout the year, with the primary
assessments being the SARA and the CDR. SARA releases are seasonal, with the Preliminary
Summer 2020 SARA released in March prior to the domestic impacts of COVID-19 and collapse
of oil prices due to the breakdown of OPEC+. [3]n The summer SARA includes scenarios with a
range of potential risks, including typical maintenance and forced thermal outages, extreme
forced outages, low wind output, and a peak load adjustment accounting for extreme weather.
In order to evaluate these scenarios, data was evaluated from a variety of sources, including the
preliminary summer SARA, the most recent CDR, and ERCOT performance data from 2019. The
SARA predicts a peak demand of 76,696 MW. This prediction is based on normal weather
conditions and does not account for higher-than-average temperatures. [13] Data from ERCOT
performance during Summer 2019 was used to develop wind generation profiles.
Using this data, four scenarios were developed using ABB’s PROMOD IV to assess the LOLE
event risk to ERCOT for Summer 2020, as shown in Exhibit 2-1. Generation in the model was
updated using the generation available in the December 2019 CDR.o Model peak loads were
updated to match information in the SARA. The Base scenario uses the SARA Summer 2020
peak load estimate. The Thermal Forced Outages (“Outages”) scenario adds the thermal forced
outages in the SARA to peak load, under the assumption that typical thermal forced outages are
outages that should be expected on a typical summer weekday.p Unlike maintenance outages,
forced outages are not planned and cannot be postponed under an emergency situation. This
scenario gives a picture of the expected change between available capacity (shown in Exhibit
2-2) and peak load under normal weather conditions. The Extreme Weather Seasonal Load
(“Extreme Weather”) scenario assumes an extreme weather event similar to what happened in
2011 in the ERCOT region. The Past Wind scenario substituted 2019 ERCOT summer hourly wind
generation for the wind generation profiles in PROMOD and uses the same peak load from the
extreme weather scenario. These new wind generation profiles were used when calculating
dispatch using the Extreme Weather scenario peak loads, to provide a picture of generation
performance with wind generation experienced in 2019. The use of the 2019 ERCOT summer
hourly wind profile, in place of the existing wind profiles in PROMOD results in wind generation
on the same scale, with different periods of high and low production. The result is the
frequency of these shifts from high to low is slightly lower in the 2019 ERCOT data, compared to
the existing wind profiles. The lower frequency of shifts results in slightly longer periods of high
and low production, with some of those low points being lower than the output using the
existing profiles by 100–300 MW, while the average hourly output for the study period remains

n While this text was in review, ERCOT issued its final SARA for the 2020 Summer which projects a peak load 1,496 MW less
than the preliminary SARA. [45]
o PROMOD model data is created using provided ABB interconnection model and updated using available information
from regulatory filings and other sources. Model thermal and renewable generation was updated to match summer as
closely as possible using available information.
p Since specific generator forced outages cannot be predicted and a random selection would impact the network
congestion component of the dispatch, the outage totals were added to the demand side, since a shift in the overall
supply curve or a shift in the demand curve have the same net effect toward obtaining the marginal generation cost.

 19
2020 SUMMER RESOURCE ADEQUACY IN THE ERCOT REGION

within 55 MW in each scenario. These four scenarios are used in PROMOD to provide a
simulation of generation and load for the summer season.q PROMOD uses the updated peak
loads, along with past hourly demand, to generate future hourly demand estimates. Historic
renewable production data and data from National Renewable Energy Laboratory is used by
ABB to provide the profiles used to estimate wind and solar generation on an hourly basis.
These factors combine to create an hourly estimate of available capacity in the model.

 Exhibit 2-1. Peak load under scenarios Exhibit 2-2. Available generating capacity

 Scenario Peak Load (MW) Category Capacity (MW)
 Base 76,696 Thermal* 71,300
 Outages 80,727 Hydro (Derated) 460
 Extreme Weather 83,979 Wind (Derated) 7,043

 Past Wind 83,979 Solar (Derated) 2,842
 DC Ties (Derated) 854
 Interruptible Loads 2,160
 Total Capacity 84,657

 *Includes switchable units

As seen in Exhibit 2-1 and Exhibit 2-2, available on-peak reserve generating capacity, including
DC ties and interruptible loads called in emergency situations, exceeds load in the Extreme
Weather scenario by only 678 MW. The exhibits below show the on-peak reserve capacity of
each day compared against the minimum target reserve margin of 13.75 percent. The reserve
capacity is the available capacity at each hour, minus the total load at that hour. Exhibit 2-3
through Exhibit 2-6 show the results of the PROMOD runs. Exhibit 2-7 shows the number of
days on-peak reserve capacity fell below Reference margins, EEA event thresholds, and zero, in
each scenario. In only the first two scenarios, ERCOT is expected to have sufficient reserves
capacity to meet peak load. In the Extreme Weather scenario, on-peak reserve capacity dips
below zero for five days. In the Past Wind scenario, on-peak reserve capacity dips below zero
for three days during the end of July and beginning of August. The magnitude of the shortfall in
August is over 5 GW. ERCOT considers any period where reserves fall below 1,000 MW and an
EEA Level 3 is triggered to be a loss of load event, regardless of whether reserves remain above
zero. By this metric, the simulations indicate a predicted LOLE of eight days in the Extreme
Weather scenario, and three days in the Past Wind scenario. Exhibit 2-7 summarizes the EEA
events that result in each scenario.

q June 1 through September 30.

 20
2020 SUMMER RESOURCE ADEQUACY IN THE ERCOT REGION

 Exhibit 2-3. Base scenario (76,696 MW peak)

 14,000

 On-Peak Reserve Capacity (MW)
 12,000
 10,000
 8,000
 6,000
 4,000
 2,000
 0

 Reserve Capacity (MW) Reference Margin (13.75%) EEA 1 (2,300 MW)
 EEA 2 (1,750 MW) EEA 3 (1,000 MW)

 Exhibit 2-4. Base + Outages (80,727 MW peak)

 15,000
On-Peak Reserve Capacity (MW)

 10,000

 5,000

 0

 Reserve Capacity (MW) Reference Margin (13.75%) EEA 1 (2,300 MW)
 EEA 2 (1,750 MW) EEA 3 (1,000 MW)

 21
2020 SUMMER RESOURCE ADEQUACY IN THE ERCOT REGION

 Exhibit 2-5. Base + Outages + Extreme Weather (83,979 MW peak)

 15,000

On-Peak Reserve Capacity (MW)
 10,000

 5,000

 0

 -5,000

 Reserve Capacity (MW) Reference Margin (13.75%) EEA 1 (2,300 MW)
 EEA 2 (1,750 MW) EEA 3 (1,000 MW)

 Exhibit 2-6. Base + Outages + Extreme Weather + Past Wind (83,979 MW peak)

 15,000
 On-Peak Reserve Capacity (MW)

 10,000

 5,000

 0

 -5,000

 -10,000

 On-Peak Reserve Capacity (MW) Reference Margin (13.75%) EEA 1 (2,300 MW)
 EEA 2 (1,750 MW) EEA 3 (1,000 MW)

 22
2020 SUMMER RESOURCE ADEQUACY IN THE ERCOT REGION

Exhibit 2-7. Number of days with reserve shortfall under four modeled scenarios

 Scenario Reference Margin EEA 1 EEA 2 EEA 3
 Base 33 0 0 0
 Outages 47 5 2 0
 Extreme Weather 53 15 11 8
 Past Wind 54 6 5 3

 23
2020 SUMMER RESOURCE ADEQUACY IN THE ERCOT REGION

3 SUMMARY
ERCOT is continuing to face a test of both its operating system and its energy-only
market. As discussed in Section 1, the ERCOT market has successfully functioned to
date. While annualized wholesale prices have declined and emissions have decreased,
summer seasonal prices have increased and with higher price spikes. Going into
Summer 2020, however, the energy-only market is contending with a low reserve
margin, caused by a number of generating capacity retirements in 2017, delays in new
capacity projects coming online since 2018, and continued strong load growth in West
Texas and other areas in the ERCOT region. ERCOT will have to rely on other tools until
the reserve margin returns to levels where there is less risk of EEA. Even with those
tools, the market construct implemented by ERCOT runs the risk of higher energy prices
and situations that trigger EEAs in the Summer of 2020.
The PROMOD scenarios described in Section 2 suggest that ERCOT could make it through
the summer season without an LOLE event, as long as the weather remains normal, even
though ERCOT will be well below its minimum target reserve margin. If demand in the
region reaches potential peak levels, escalated for extreme weather, problems could
arise on the system. ERCOT could then find itself operating in emergency conditions
during the height of the summer peak demand season, which is usually the end of July
through mid-August. Should these conditions occur, ERCOT will need to call on its
operating tools to maintain reliability and continue serving load, and those measures
alone may not be sufficient to avert a shedding of load. However, if the demand profiles
that ERCOT is currently seeing due to COVID-19 continue, where daily peaks have been 2
percent lower and overall energy demand has been 4–5 percent below normal, the
region may not see peak summer demand at levels that require emergency actions to be
taken. The energy-only market, combined with subsidized renewables and cheap natural
gas prices driving out other forms of generation, may result in lower wholesale energy
prices than other market models that pay for capacity, but it may also be taking greater
reliability risks.

Post-Script (5/29/2020): Without reconducting the simulations and simply
applying the changes between ERCOT’s preliminary and final SARAs as a post-
process adjustment, indicates that the results may change slightly with some
days changing their EEA severity. It does not, however, indicate that events may
not occur this summer, only that their frequency and level of severity may be
reduced, with EEA 3 events still projected to occur in the Extreme Weather and
Past Wind Scenarios.

 24
2020 SUMMER RESOURCE ADEQUACY IN THE ERCOT REGION

4 REFERENCES

 [1] Electric Reliability Council of Texas, Inc. (ERCOT), "Final Seasonal
 Assessment of Resource Adequacy for the ERCOT Region," 2019. [Online].
 Available: http://www.ercot.com/content/wcm/lists/167022/SARA-
 FinalSummer2019.xlsx. [Accessed February 2020].
 [2] Electric Reliability Council of Texas, Inc. (ERCOT), "Report on the
 Capacity, Demand and Reserves (CDR) in the ERCOT Region, 2020-2029,"
 ERCOT, Austin, December 2019.
 [3] Electric Reliability Council of Texas, Inc. (ERCOT), "Preliminary Seasonal
 Assessment of Resource Adequacy for the ERCOT Region Summer 2020,"
 5 March 2020. [Online]. Available:
 http://www.ercot.com/content/wcm/lists/197378/SARA-
 PreliminarySummer2020.pdf. [Accessed April 2020].
 [4] North American Electric Reliability Corporation (NERC), "2018 Summer
 Reliability Assessment," June 2018. [Online]. Available:
 https://www.nerc.com/pa/RAPA/ra/Reliability%20Assessments%20DL/NER
 C_SRA_05252018_Final.pdf. [Accessed 15 June 2018].
 [5] The Brattle Group, "Estimation of the Market Equilibrium and
 Economically Optimal Reserve Margins for the ERCOT Region, 2018
 Update," 20 December 2018. [Online]. Available:
 http://www.ercot.com/content/wcm/lists/167026/2018_12_20_ERCOT_ME
 RM_Report_Final.pdf. [Accessed 18 April 2019].
 [6] North American Electric Reliability Corporation (NERC), "2019 Long-Term
 Reliability Assessment," 5 December 2019. [Online]. Available:
 https://www.nerc.com/pa/RAPA/ra/Reliability%20Assessments%20DL/NER
 C_LTRA_2019.pdf. [Accessed 9 February 2020].
 [7] The Brattle Group, "ERCOT Investment Incentives and Resource
 Adequacy," 1 June 2012. [Online]. Available:
 http://www.ercot.com/content/gridinfo/resource/2015/mktanalysis/Brattl
 e_ERCOT_Resource_Adequacy_Review_2012-06-01.pdf. [Accessed 15
 June 2018].
 [8] J. Forsyth, "Scorching Texas summer heat trumps Dust Bowl record,"
 REUTERS, 8 September 2011. [Online]. Available:
 https://www.reuters.com/article/us-weather-texas-dustbowl/scorching-
 texas-summer-heat-trumps-dust-bowl-record-idUSTRE7876LX20110908.
 [Accessed 2020].
 [9] B. Israel, "Dallas Sets Record for Most 100-Degree Days," LIVESCIENCE, 13
 September 2011. [Online]. Available:
 https://www.livescience.com/16036-dallas-heat-record.html. [Accessed
 2020].

 25
You can also read