Zero-Emission Bus Evaluation Results: King County Metro Battery Electric Buses - FEBRUARY 2018
←
→
Page content transcription
If your browser does not render page correctly, please read the page content below
Zero-Emission Bus Evaluation
  Results: King County Metro
      Battery Electric Buses
                       FEBRUARY 2018
                                FTA Report No. 0118
                        Federal Transit Administration

                                       PREPARED BY
                                          Leslie Eudy
                                     Matthew Jeffers
                National Renewable Energy Laboratory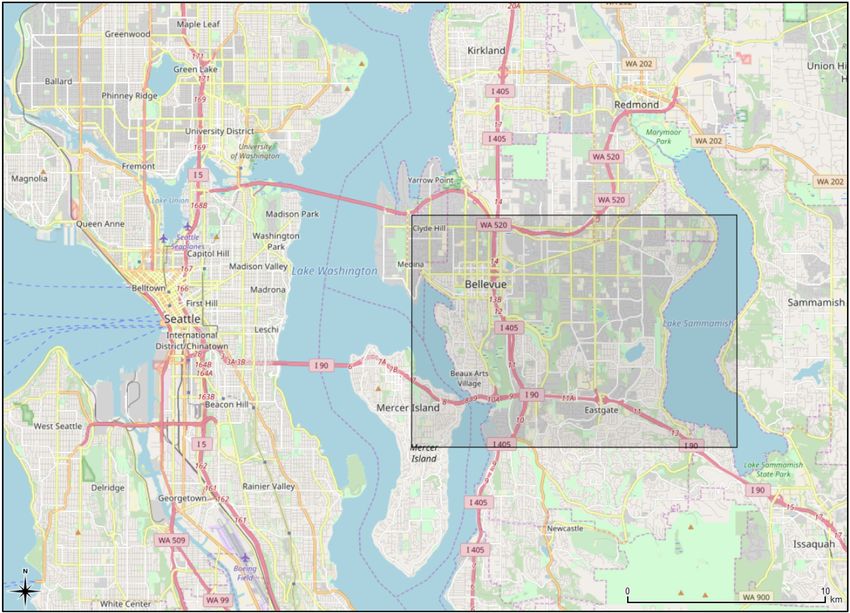
COVER PHOTO
Courtesy of King County Metro (Seattle) Proterra Catalyst fast-charge battery electric bus. Photo courtesy of National Renewable
Energy Laboratory.

DISCLAIMER
This document is disseminated under the sponsorship of the U.S. Department of Transportation in the interest of information
exchange. The United States Government assumes no liability for its contents or use thereof. The United States Government
does not endorse products of manufacturers. Trade or manufacturers’ names appear herein solely because they are considered
essential to the objective of this report.
Zero-Emission Bus
Evaluation Results:
King County
Metro Battery
Electric Buses

FEBRUARY 2018
FTA Report No. 0118

PREPARED BY

Leslie Eudy
Matthew Jeffers
National Renewable Energy Laboratory
15013 Denver West Parkway
Golden, CO 80401

SPONSORED BY

Federal Transit Administration
Office of Research, Demonstration and Innovation
U.S. Department of Transportation
1200 New Jersey Avenue, SE
Washington, DC 20590

AVAIL ABLE ONLINE

https://www.transit.dot.gov/about/research-innovation

                    FEDERAL TRANSIT ADMINISTRATION      i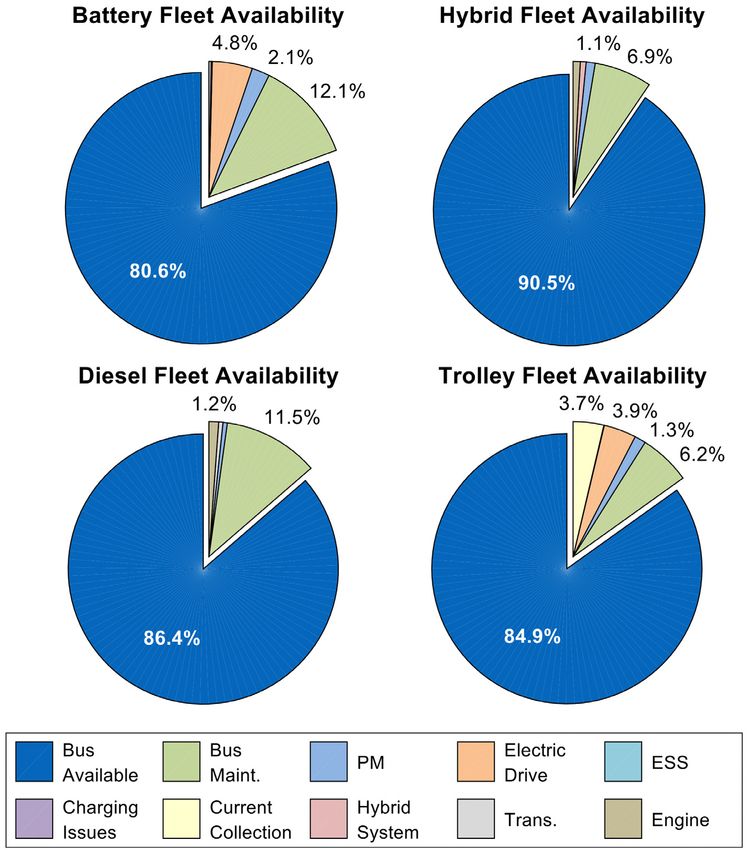
Metric
                     MetricConversion
                      Metric Conversion
                             Conversion Table
                                          Table
                                        Table

SYMBOL    WHEN YOU KNOW                 MULTIPLY BY                TO FIND             SYMBOL

                                           LENGTH

  in            inches                       25.4                 millimeters             mm

  ft             feet                       0.305                   meters                 m

  yd             yards                      0.914                   meters                 m

  mi             miles                       1.61                 kilometers              km

                                          VOLUME

 fl oz       fluid ounces                   29.57                  milliliters            mL

  gal           gallons                     3.785                    liters                L

  ft3          cubic feet                   0.028                cubic meters              m3

 yd3          cubic yards                   0.765                cubic meters              m3

                 NOTE: volumes greater than 1000 L shall be shown in m3

                                            MASS

  oz            ounces                      28.35                   grams                  g

  lb            pounds                      0.454                 kilograms                kg

                                                                  megagrams
  T       short tons (2000 lb)              0.907                                      Mg (or "t")
                                                               (or "metric ton")

                                 TEMPERATURE (exact degrees)

  o                                       5 (F-32)/9                                       o
      F       Fahrenheit                                            Celsius                    C
                                         or (F-32)/1.8

                                                               FEDERAL TRANSIT ADMINISTRATION           iv
                                                                       FEDERAL TRANSIT ADMINISTRATION        ii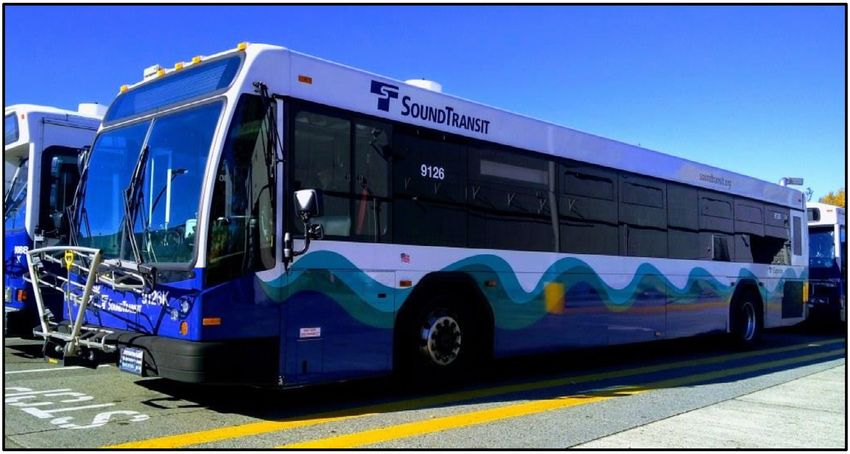
REPORT DOCUMENTATION PAGE                                            Form Approved
                                                                     OMB No. 0704-0188
Public reporting burden for this collection of information is estimated to average 1 hour per response, including the time for reviewing instruc-
tions, searching existing data sources, gathering and maintaining the data needed, and completing and reviewing the collection of information.
Send comments regarding this burden estimate or any other aspect of this collection of information, including suggestions for reducing this
burden, to Washington Headquarters Services, Directorate for Information Operations and Reports, 1215 Jefferson Davis Highway, Suite 1204,
Arlington, VA 22202-4302, and to the Office of Management and Budget, Paperwork Reduction Project (0704-0188), Washington, DC 20503.

1. AGENCY USE ONLY                          2. REPORT DATE                                    3. REPORT TYPE AND DATES COVERED
                                               February 2018                                     April 2016–March 2017
4. TITLE AND SUBTITLE                                                                         5. FUNDING NUMBERS
   Zero-Emission Bus Evaluation Results: King County Metro Battery Electric Buses

6. AUTHOR(S)
   Leslie Eudy, Matthew Jeffers

7. PERFORMING ORGANIZATION NAME(S) AND ADDRESSE(ES)                                          8. PERFORMING ORGANIZATION REPORT NUMBER
  National Renewable Energy Laboratory
  15013 Denver West Parkway                                                                      FTA Report No. 0118
  Golden, CO 80401

9. SPONSORING/MONITORING AGENCY NAME(S) AND ADDRESS(ES)                                       10. SPONSORING/MONITORING AGENCY REPORT
   U.S. Department of Transportation                                                             NUMBER
   Federal Transit Administration
   Office of Research, Demonstration and Innovation                                              FTA Report No. 0118
   East Building
   1200 New Jersey Avenue, SE
   Washington, DC 20590
11. SUPPLEMENTARY NOTES           [https://www.transit.dot.gov/about/research-innovation]

12A. DISTRIBUTION/AVAILABILITY STATEMENT                                                      12B. DISTRIBUTION CODE
     Available from: National Technical Information Service (NTIS), Springfield, VA 22161.
     Phone 703.605.6000, Fax 703.605.6900, email [orders@ntis.gov]                                 TRI

13. ABSTRACT
   This report summarizes the experience and results from a battery electric bus (BEB) demonstration funded by the Federal Transit
   Administration (FTA) under the Transit Investments for Greenhouse Gas and Energy Reduction (TIGGER) program. In 2010, King County
   Metro transit agency in Seattle, Washington, received funding from a TIGGER award to add three zero-emission BEBs to its fleet. The
   BEBs in service at King County Metro are 40-foot fast-charge electric transit buses built by Proterra. FTA is collaborating with the U.S.
   Department of Energy (DOE) and DOE’s National Renewable Energy Laboratory (NREL) to conduct in-service evaluations of advanced
   technology buses developed under its programs. This report presents evaluation results for the BEBs in comparison to a selection of
   baseline buses. The focus of the analysis is on one year of data from April 2016 through March 2017.

14. SUBJECT TERMS                                                                             15. NUMBER OF PAGES
    Federal Transit Administration; Office of Research, Demonstration, and Innovation;          67
    Transit Investments for Greenhouse Gas and Energy Reduction; TIGGER

 16. PRICE CODE

 17. SECURITY CLASSIFICATION        18. SECURITY CLASSIFICATION         19. SECURITY CLASSIFICATION         20. LIMITATION OF ABSTRACT
     OF REPORT                          OF THIS PAGE                        OF ABSTRACT
     Unclassified                       Unclassified                       Unclassified

                                                                                             FEDERAL TRANSIT ADMINISTRATION                         v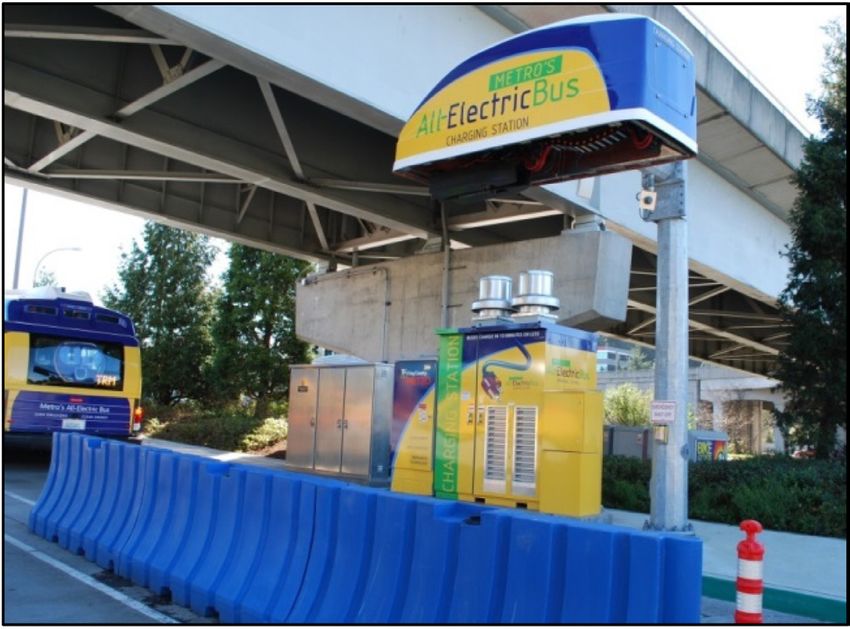
TABLE OF CONTENTS

         1    Executive Summary
         6    Section 1:   Introduction
         7    Section 2:   Zero-Emission Bus Evaluations Planned
         7      Select Projects
         8      Evaluation Protocol
         15   Section 3:   KC Metro BEB Evaluation Results
         15     Fleet Profile—KC Metro
         16     Bus Technology Descriptions
         18     Charging and Maintenance Facilities
         19     In-Service Operations Evaluation Results
                Summary of Achievements and Challenges
        48    Appendix: KC Metro Fleet Summary Statistics
        53      Fleet Summary Statistics—SI Units
        54      Additional Charts for KC Metro Evaluation
              Acronyms and Abbreviations
              Glossary

                                                  FEDERAL TRANSIT ADMINISTRATION   vi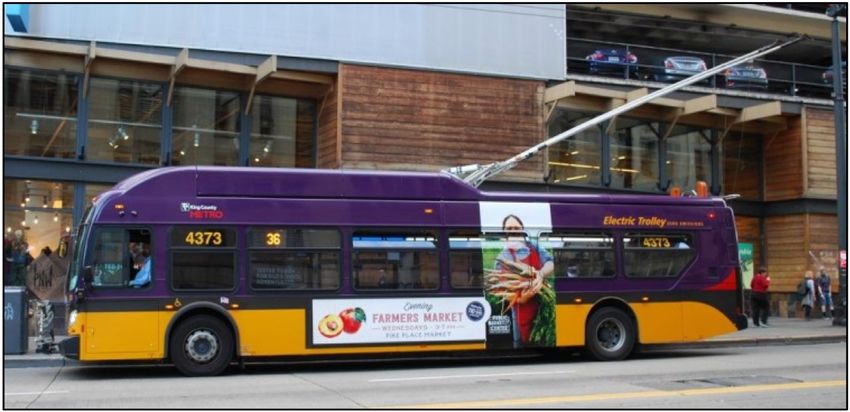
LIST OF FIGURES

         15       Figure   3-1:   KC Metro Service Area Map with Shaded Bellevue Region
         17       Figure   3-2:   KC Metro Proterra Catalyst Battery Electric Bus
         17       Figure   3-3:   KC Metro New Flyer Diesel Hybrid Bus
         17       Figure   3-4:   Gillig Diesel Bus Operated by KC Metro for Sound Transit
         18       Figure   3-5:   KC Metro New Flyer Electric Trolley Bus
         19       Figure   3-6:   Fast-Charge Station at KC Metro Park-and-Ride
         20       Figure   3-7:   Route Map for KC Metro Routes 226 and 241
         21       Figure   3-8:   Battery Charge and Discharge Power and State of Charge for
        						                    One Example Charge Cycle
         22       Figure 3-9:     Cumulative Miles and Hours for Battery Bus Fleet
         23       Figure 3-10:    Average Monthly Miles for All Four Bus Fleets
         26       Figure 3-11:    Monthly Availability for All Four Bus Fleets and Reasons for
        						                    Unavailability for Battery Fleet
         27       Figure 3-12:    Overall Availability for All Four Bus Fleets During Evaluation
        						                    Period
         28       Figure 3-13:    Monthly Charges and Monthly Energy Consumption for
        						                    Battery Fleet
         29       Figure 3-14:    Monthly Fuel Economy for Battery, Hybrid, and Diesel Bus
        						                    Fleets
         31       Figure 3-15:    Monthly Fuel Cost per Mile for Battery, Hybrid, and Diesel Bus
        						                    Fleets
         32       Figure 3-16:    Breakdown of Monthly Electric Utility Costs
         34       Figure 3-17:    Summary of Propulsion-Related Roadcalls for All Four Bus
        						                    Fleets, Organized by Subsystem
         35       Figure 3-18:    Cumulative Bus MBRC and Propulsion-Related MBRC for All
        						                    Four Bus Fleets
         37       Figure 3-19:    Monthly Scheduled and Unscheduled Maintenance Cost per
        						                    Mile for All Four Bus Fleets
         39       Figure 3-20:    Monthly Maintenance Cost per Mile by System for Battery Bus
        						                    Fleet
         40       Figure 3-21:    Monthly Maintenance Cost per Mile by System for Hybrid Bus
        						                    Fleet
         41       Figure 3-22:    Monthly Maintenance Cost per Mile by System for Diesel Bus
        						                    Fleet
         42       Figure 3-23:    Monthly Maintenance Cost per Mile by System for Trolley Bus
        						                    Fleet
         45       Figure 3-24:    Monthly Operations (Maintenance and Fuel) Cost for Battery,
        						                    Hybrid, and Diesel Bus Fleets
         54       Figure A-1:     Monthly Average Price for Electricity and Diesel Fuel
         54       Figure A-2:     Monthly Availability for Battery Buses

                                                       FEDERAL TRANSIT ADMINISTRATION         vii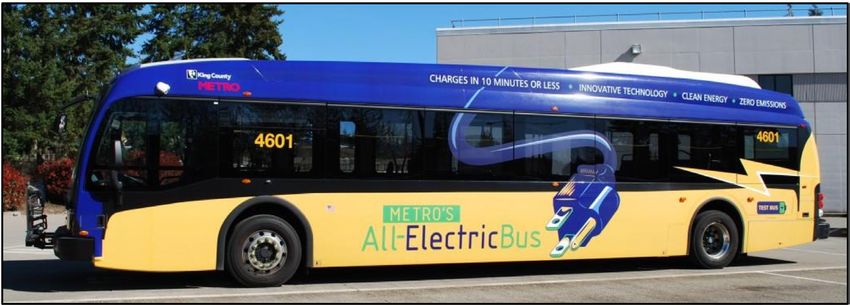
LIST OF TABLES

                 Table ES-1:     Summary of Evaluation Results
                 Table 2-1:      Selected Evaluation Projects
          8      Table 2-2:      DOE/FTA Performance, Cost, and Durability Targets for
                                 FCEBs
          16     Table 3-1:      System Descriptions for the Battery Electric, Hybrid, Diesel,
                                 and Trolley Buses
                 Table 3-2:      Average Monthly Mileage (Evaluation Period)
         25      Table 3-3:      Summary of Availability by Bus for All Four Fleets
         27      Table 3-4:      Summary of Availability and Unavailability by Category for
                                 All Four Fleets
         30      Table   3-5:    Mileage, Fuel Use, and Fuel Economy
         33      Table   3-6:    Utility Electricity Rates
         36      Table   3-7:    Total Work Order Maintenance Costs
         38      Table   3-8:    Work Order Maintenance Cost per Mile by System
         43      Table   3-9:    Propulsion-Related Work Order Maintenance Costs by System
         45      Table   3-10:   Overall Operations (Maintenance and Fuel) Cost per Mile
         48      Table   A-1:    Fleet Operations and Economics
         48      Table   A-2:    Maintenance Costs
         49      Table   A-3:    Breakdown of Maintenance Costs by System
         53      Table   A-4:    Fleet Operations and Economics (SI)
         53      Table   A-5:    Maintenance Costs (SI)

                                                      FEDERAL TRANSIT ADMINISTRATION        viii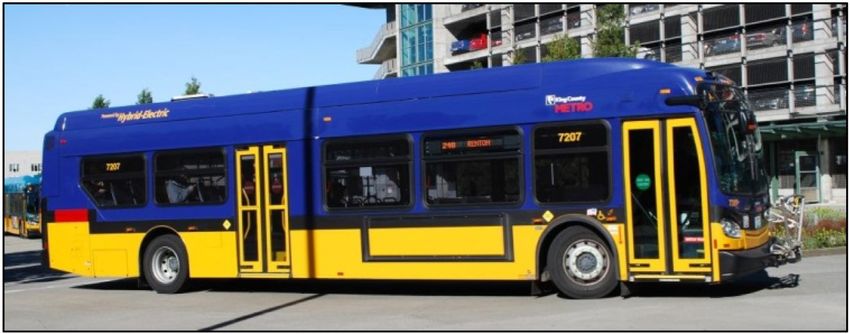
ACKNOWLEDGMENTS

This report could not have been possible without the cooperation of King
County Metro, Proterra, and others. King County Metro staff provided data on
the electric and baseline buses, reviewed analyses and reports, and participated in
meetings to discuss the agency’s overall experience. Proterra provided selected
data from the on-board data loggers and reviewed reports. The U.S. Department
of Transportation’s Federal Transit Administration provided funding for the
evaluation. The authors thank the following individuals:

King County Metro
George Stites
Leo Hrechanyk
Jim Hunley
Kim Martin
Daniel Santon
Cindy Sattler
Bonnie Davis-Losey
Larry Schwerzler
Lynn Matteoni

Proterra
Mike Finnern
Seneca Schepmann
Derrick Allen

U.S. Department of Transportation Federal Transit Administration,
Office of Research, Demonstration and Innovation
Sean Ricketson
Mike Baltes
Marcel Belanger

U.S. Department of Transportation Research, Development, and
Technology Office
Shawn Johnson

                                        FEDERAL TRANSIT ADMINISTRATION           ix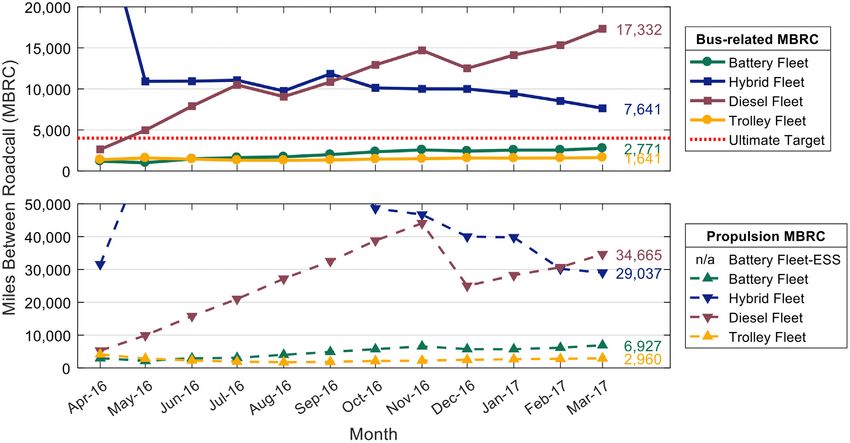
ABSTRACT

This report summarizes the experience and results from a battery electric bus
(BEB) demonstration funded by the Federal Transit Administration (FTA) under
the Transit Investments for Greenhouse Gas and Energy Reduction (TIGGER)
program. In 2010, King County Metro transit agency in Seattle, Washington,
received funding from a TIGGER award to add three zero-emission BEBs to its
fleet. The BEBs in service at King County Metro are 40-foot fast-charge electric
transit buses built by Proterra. FTA is collaborating with the U.S. Department
of Energy (DOE) and DOE’s National Renewable Energy Laboratory (NREL) to
conduct in-service evaluations of advanced technology buses developed under its
programs. This report presents evaluation results for the BEBs in comparison to
a selection of baseline buses. The focus of the analysis is on one year of data from
April 2016 through March 2017.

                                         FEDERAL TRANSIT ADMINISTRATION            x
EXECUTIVE The U.S. Department of Transportation’s Federal Transit Administration
SUMMARY (FTA) supports the research, development, and demonstration of low- and
zero-emission technology for transit buses. FTA funds a number of research
projects with a goal of facilitating commercialization of advanced technologies
for transit buses that will increase efficiency and lower tailpipe emissions. FTA
is collaborating with the U.S. Department of Energy (DOE) and DOE’s National
Renewable Energy Laboratory (NREL) to conduct in-service evaluations of
advanced technology buses developed under its programs. NREL uses a standard
evaluation protocol for evaluating the advanced technologies deployed under the
FTA programs.
FTA seeks to provide results from new technologies being adopted by transit
agencies. The eight evaluations selected to date include battery electric buses
(BEBs) and fuel cell electric buses (FCEBs) from different manufacturers operating
in fleets located in both cold and hot climates. NREL recently completed a
yearlong evaluation of a fleet of BEBs in service at King County Metro (KC
Metro) in Seattle, Washington. KC Metro’s service area covers more than 2,000
square miles of King County, including the Seattle metro area. In February 2016,
the agency began operating a fleet of three BEBs in its service area. The focus of
the analysis is on one year of data from April 2016 through March 2017.
The BEBs in service at KC Metro are fast-charge, composite buses built by
Proterra. KC Metro and NREL selected three conventional technologies for
comparison to the BEBs: standard diesel buses from Gillig, diesel hybrid buses on
New Flyer’s Xcelsior platform, and electric trolley buses on New Flyer’s Xcelsior
platform. Buses in all four fleets are 40-foot, model year 2015 buses. The four
bus fleets included in the evaluation are referred to in this analysis as the battery
fleet, hybrid fleet, diesel fleet, and trolley fleet. In the introduction and summary
sections of this report, the term “BEB” is used when referring to battery bus
technology, transit bus evaluations, and NREL’s analysis protocol. Table ES-1
provides a summary of the results for the battery fleet and baseline fleets.
The battery fleet accumulated 83,128 miles during the year, which is 27,709 miles
per bus. The average monthly operating mileage per bus was 2,309 miles. The
battery buses accumulated more miles than the diesel and trolley buses, but
fewer miles than the hybrid buses. This is a function of planned use of the buses.
The battery fleet is restricted to KC Metro routes 226 and 241, and the hybrid
fleet is randomly dispatched on all routes, which include commuter routes.
This results in a higher average speed for the hybrid buses and a faster mileage
accumulation. The trolley buses are limited to the network of catenary lines in
and around downtown Seattle, which results in lower speeds and fewer operating
miles. The diesel buses are operated on one specific route on weekdays only.
FEDERAL TRANSIT ADMINISTRATION 1EXECUTIVE SUMMARY
Table ES-1 Data Item Battery Hybrid Diesel Trolley
Summary of Evaluation Number of buses 3 10 3 10
Results Total mileage in data period 83,128 435,552 69,329 180,554
Average mileage per bus 27,709 43,555 23,110 18,055
Average monthly mileage per bus 2,309 3,630 1,926 1,505
Availability (85% is target) 80.6 90.5 86.4 84.9
Fuel economy (kWh/mile) 2.36 — — 2.57
Fuel economy (miles/dge ) a
15.9 6.3 5.3 14.7
Average speed, including stops (mph)b 14.8 15.2 14.6 9.0
Miles between roadcalls (MBRC) – bus c
2,771 7,641 17,332 1,641
MBRC – propulsion system only c
6,927 29,037 34,665 2,960
Total maintenance cost ($/mile)d 0.26 0.32 0.46 0.46
Maintenance – propulsion system only ($/mile) 0.05 0.12 0.13 0.17
a
Diesel gallon equivalent.
b
Based on scheduled revenue service.
c
MBRC data cumulative through March 2017.
d
Work order maintenance cost.
The overall average availability for the battery fleet was 80.6%. For the baseline
buses, the overall average availability was 90.5% for the hybrid fleet, 86.4% for
the diesel fleet, and 84.9% for the trolley fleet. Issues relating to general bus
maintenance accounted for most of the downtime for all four fleets. The battery
buses experienced several issues with the electric drive system.
The battery buses had an overall average efficiency of 2.36 kWh per mile, which
equates to a fuel economy of 15.9 miles per diesel gallon equivalent (mpdge). The
hybrid buses had an average fuel economy of 6.3 mpdge, and the diesel buses had
a fuel economy of 5.3 mpdge. Monthly energy use data were not available for the
trolley buses; however, a sample of total mileage and energy use for two of the
trolley buses representing a 13-month period of operation was used to calculate
an estimated average fuel economy of 14.7 mpdge for the trolley fleet.
During the data period, KC Metro paid an average of $0.20/kWh for electricity
for the battery buses and $1.60/gal for diesel fuel. The fuel economy advantage
of the hybrid fleet over the diesel fleet results in a slightly lower per-mile fuel
cost for the hybrid fleet ($0.25/mi) compared to the diesel fleet ($0.30/mi). The
per-mile fuel (electricity) cost for the battery fleet was $0.57/mi. The electricity
cost per mile calculation includes all electricity that KC Metro purchased from
the utility. This represents the “grid-side” fuel cost per mile, not the “bus-side”
fuel cost per mile. Despite having an average fuel economy that is 2.5 to 3 times
higher than that of the baseline bus fleets in the evaluation, the battery fleet had
higher per-mile fuel costs due to the large difference between diesel fuel and
electricity prices.
FEDERAL TRANSIT ADMINISTRATION 2EXECUTIVE SUMMARY
KC Metro incurs demand charges when charging rates exceed 50 kW during
the billing period. These demand charges made up a significant portion of the
utility bills each month—between 34% and 54%. The monthly demand charges
are inversely proportional to the monthly mileage of the battery fleet. Thus, the
relative cost of demand charges decreases as the battery fleet mileage increases
and the fast charger is more fully utilized. The charger utilization will increase
as more battery buses are added to the route, or as the existing battery buses
operate more frequently, or both.
The transit industry measures reliability as mean distance between failures, also
documented as miles between roadcalls (MBRC). NREL tracks bus reliability
categorized by total bus roadcalls, propulsion-related roadcalls, and energy
storage system-related roadcalls. Propulsion-related roadcalls are a subset of
total bus roadcalls for each bus fleet. Energy storage system-related roadcalls are
a subset of the propulsion-related roadcalls, specific to the energy storage system
of the battery buses. The diesel fleet had the highest bus MBRC at 17,332. The
hybrid bus fleet achieved 7,641 MBRC. The battery fleet MBRC and trolley fleet
MBRC are currently below 3,500.
The battery fleet propulsion-related MBRC was 6,927. Propulsion-related MBRC
for the diesel and hybrid baseline fleets were similar to each other—34,665 and
29,037, respectively. The propulsion-related MBRC for the trolley buses was
2,960, which reflects the trolley fleet’s low average mileage and early issues with
the current collection system.
NREL also analyzed work order data to provide a comparison of maintenance
costs between the battery fleet and the baseline fleets. After removing accident-
and warranty-related items for all fleets, the average per-mile maintenance cost
for the data period was $0.26/mi for the battery buses, $0.32/mi for the hybrid
buses, $0.46/mi for the diesel buses, and $0.46/mi for the trolley buses. During
the data period, the maintenance cost for the battery buses was 17.8% less than
that of the hybrid buses; 44.1% less than that of the diesel buses; and 43.2% less
than that of the trolley buses. These combined totals include scheduled and
unscheduled maintenance.
NREL analyzed the maintenance data to determine costs by vehicle system. The
systems with the highest percentage of maintenance costs for the battery buses
and diesel buses were 1) cab, body, and accessories; 2) propulsion-related; and 3)
preventive maintenance inspections. The systems with the highest percentage of
maintenance costs for the hybrid buses were 1) propulsion-related; 2) cab, body,
and accessories; and 3) preventive maintenance inspections. The systems with the
highest percentage of maintenance costs for the trolley buses were 1) cab, body,
and accessories; 2) propulsion-related; and 3) HVAC.
FEDERAL TRANSIT ADMINISTRATION 3EXECUTIVE SUMMARY
As with all new technology development, lessons learned during this project
could aid other agencies considering BEB technology. KC Metro reports that it
has had a positive experience with Proterra and that the manufacturer is very
responsive. Proterra has expressed appreciation with KC Metro’s feedback on
the bus design and has used that input to make improvements. KC Metro reports
the following successes:
• Implemented the agency’s first BEB fleet
• Accumulated more than 100,000 miles on the battery buses in the first 15
months of revenue service
• Increased operation of the battery fleet since the end of the data collection
period
• Initiated an order of eight more fast charge BEBs through a Low-No award.
Issues and lessons learned include the following:
• Charger availability – Availability of the on-route fast charger is critical
for operation of a fast-charge BEB fleet. Downtime of the charger results in
downtime for the fleet. KC Metro experienced this issue when the charger
was damaged. While the issue was minor, the resulting downtime of the
charger caused a major service interruption for the battery bus fleet during
the two weeks it took to repair the charger.
• Operator training – Driver training is an ongoing challenge because the
BEBs operate differently from the conventional buses in the agency’s fleet.
The primary training differences are learning the charger docking procedure
and ensuring the BEBs are fully charged before returning to the base at the
end of a shift. Once KC Metro installs a fast charger at the base, the need to
fully charge the BEBs at the end of the day will no longer be necessary. Any
new operators for the routes serviced by the BEBs need to be trained on
the operational differences. Transit agencies deploying electric buses should
consider this when planning training programs.
• Operations planning – The scheduling department needs to understand
the operational differences for fast charged BEBs. The short range of these
buses requires them to operate on a selection of routes that return to the
charging station regularly. Schedulers need to limit service to the selected
routes until the agency adds chargers to other locations. The agency also has
layovers planned in its route schedules. With conventional buses, an operator
can shorten the layover to make up lost time and keep buses on schedule.
For electric buses, however, that planned layover includes time for charging.
Shortening the layover to make up schedule slip could result in the bus not
getting a full charge.
• Parts list for inventory – Parts availability is a common issue with agencies
deploying advanced technology buses. KC Metro reports that Proterra has
delivered parts quickly, but the agency needs to keep some parts on hand to
FEDERAL TRANSIT ADMINISTRATION 4EXECUTIVE SUMMARY
speed up the process. The agency is working with Proterra to develop a list
of parts for on-site inventory.
KC Metro is committed to an environmentally-friendly fleet and plans to
purchase 120 BEBs by 2020. In 2017, the agency entered into a contract with
Proterra to purchase up to 73 BEBs.
FEDERAL TRANSIT ADMINISTRATION 5SECTION
Introduction
1 The U.S. Department of Transportation’s (DOT’s) Federal Transit Administration
(FTA) supports the research, development, and demonstration of low- and zero-
emission technology for transit buses. FTA funds a number of research projects
with a goal of facilitating commercialization of advanced technologies for transit
buses that will increase efficiency and lower tailpipe emissions. These programs
include the following:
• National Fuel Cell Bus Program (NFCBP) – a $180 million, multi-year,
cost-share research program for developing and demonstrating commercially
viable fuel cell technology for transit buses.
• Transit Investments for Greenhouse Gas and Energy Reduction
(TIGGER) – $225 million for capital investments that would reduce
greenhouse gas emissions and/or lower the energy use of public
transportation systems.
• Low or No Emission Vehicle Deployment Program (Low-No)
– $186.9 million in funding (FY13–FY17) to transit agencies for capital
purchases of zero-emission and low-emission transit buses that have been
largely proven in testing and demonstration efforts but are not yet widely
deployed.
FTA understands the need to share early experience of advanced technologies
with the transit industry. FTA is funding evaluations of a selection of these
projects to provide comprehensive, unbiased performance results from advanced
technology bus development, operations, and implementation. These evaluations
have proved useful for a variety of groups including transit operators considering
the technology for future procurements, manufacturers needing to understand
the status of the technology for transit applications, and government agencies
making policy decisions or determining future research needs. The evaluations
include economic, performance, and safety factors. Data are collected on the
operation, maintenance, and performance of each advanced technology fleet and
a comparable baseline fleet operating at the same site (if available).
The purpose of this report is to outline the evaluation plan and analysis protocol
and present the results from a one-year evaluation of three battery electric
buses (BEBs) at King County Metro in Seattle, Washington.
FEDERAL TRANSIT ADMINISTRATION 6SECTION
Zero-Emission Bus
2 Evaluations Planned
FTA is collaborating with the U.S. Department of Energy (DOE) and DOE’s
National Renewable Energy Laboratory (NREL) to conduct in-service evaluations
of advanced technology buses. For more than a decade, NREL has been
evaluating advanced technology transit buses using a standard data collection and
analysis protocol originally developed for DOE heavy-duty vehicle evaluations.
Funding for these evaluations has come from several agencies including FTA,
DOE, and the California Air Resources Board. NREL has evaluated fuel cell
electric buses (FCEBs) as well as BEBs following this standard protocol. DOT’s
Research, Development, and Technology Office (OST-R) also has an interest in
zero-emission bus (ZEB) technology deployment and commercialization. OST-R
is coordinating and collaborating with FTA on the evaluation process and results
by providing funding to cover additional evaluations. This section provides the list
of evaluations selected to date and outlines the protocol used for collecting and
analyzing the data.
Selected Projects
NREL uses a set of criteria to prioritize the available projects for selection
that include number of buses deployed, record-keeping practices of the transit
agency, commitment level of the bus original equipment manufacturer (OEM),
and the availability of appropriate baseline buses for comparison. The criteria
are not intended to be rigid; however, the determination of priority is based on
how many criteria are met. In consultation with FTA, NREL has selected several
projects that are in the highest priority category. Other projects will be chosen
as more information becomes available. Table 2-1 lists the projects selected for
evaluation as of the publication date of this report.
FEDERAL TRANSIT ADMINISTRATION 7SECTION 2: ZERO-EMISSION BUS EVALUATIONS PLANNED
Table 2-1 Selected Evaluation Projects
Site # Transit Agency and Location Project Description Evaluation Status
1 King County Metro, Seattle, WA 3 Proterra 40-ft Catalyst buses and 1 fast-charge station Completed
10 BYD 40-ft BEBs, overnight charging with 1 inductive
2 Long Beach Transit, Long Beach, CA Initiated April 2017
charger on route
Central Contra Costa Transit Authority, 4 Gillig/BAE Systems 29-ft BEBs, overnight charging
3 Initiated April 2017
Concord, CA with 1 inductive charger on route
Orange County Transportation Authority, 1 American Fuel Cell Bus (AFCB): BAE Systems, Ballard
4 Initiated June 2016
Santa Ana, CA Power Systems, and ENC
Stark Area Regional Transit Authority, Initiated August
5 7 AFCBs
Camden, OH 2017
Massachusetts Bay Transportation 1 AFCB with Nuvera PowerTap system fueling Initiated January
6
Authority, Boston, MA infrastructure 2017
Southeastern Pennsylvania Transportation
7 25 Proterra 40-ft Catalyst E2 BEBs Planned 2018
Authority, Philadelphia, PA
8 Duluth Transit, Duluth, MN 6 Proterra 40-ft Catalyst E2 BEBs Planned 2018
Evaluation Protocol
In 2012, DOE and FTA established performance and cost targets for FCEBs.1
Interim targets were set for 2016 along with ultimate targets that FCEBs would
need to meet to compete with current commercial-technology buses. DOE
and FTA have not established performance targets specific to BEBs, but the
performance targets established for FCEBs were based on typical conventional
buses and the targets could be considered appropriate for any advanced
technology. Table 2-2 shows a selection of these technical targets for FCEBs.
Table 2-2 DOE/FTA Performance, Cost, and Durability Targets for FCEBsa
Units 2016 Target Ultimate Target
Bus lifetime years/miles 12/500,000 12/500,000
Power plant lifetimeb hours 18,000 25,000
Bus availability % 85 90
Fuel fills per day 1 (SECTION 2: ZERO-EMISSION BUS EVALUATIONS PLANNED
NREL uses a standard evaluation protocol for evaluating the advanced
technologies deployed under the FTA programs. Data parameters include the
following:
• Bus system descriptions
• Operations duty-cycle description
• Bus use and availability
• Energy/fuel consumption and cost
• Maintenance cost
• Roadcalls
• Infrastructure and facility modification descriptions
• Capital costs
• Implementation experience
For each selected fleet, NREL collects all fueling/charging, cost, and maintenance
data for a period of 12 to 18 months to provide a full year of operation data
for the analysis. For each site, NREL collects data on conventional technology
baseline buses for comparison. For most fleets, the baseline buses are diesel
buses. For fleets that do not operate diesel buses, the baseline buses are usually
compressed natural gas (CNG) buses. Other technologies, such as diesel
hybrid buses, will be included in the evaluation if they are available. The best
comparisons are made between buses of the same make, model, production year,
size, and route deployment. In that case, the only difference is the propulsion
system. This is not always possible. NREL works with the transit agency to
determine which vehicles the agency has in operation and selects the best
possible baseline match for each evaluation based on what is available. The
following sections outline the analysis approach for each parameter.
Bus System Descriptions
This category of data includes general descriptions of the buses and systems.
NREL provides a form that the agency fills out for both the ZEBs and baseline
vehicles. The form asks for specifications of the vehicle propulsion system and
subsystems as well as accessory equipment. This information documents that
the baseline vehicles are similar in equipment to the advanced technology buses.
NREL collects these data at the beginning of the project; however, changes may
be required if major systems are altered.
Operations Duty-Cycle Description
NREL collects duty-cycle descriptions from the transit agency to understand
how the ZEBs are used compared to the baseline buses. Data collected include
descriptions of the expected routes, operating hours during a typical work day,
FEDERAL TRANSIT ADMINISTRATION 9SECTION 2: ZERO-EMISSION BUS EVALUATIONS PLANNED
number of days per week that the vehicle is operated, the amount of fuel and
range (in miles) that are expected during a given work day and between fueling/
charging, and other information on how the vehicles are used. Transit agencies
typically provide these data in text format. NREL uses the data to determine
an average operating speed. Occasionally, bus OEMs provide detailed Global
Positioning System (GPS) data from the on-board data collection systems. In
those cases, NREL will develop specific route maps showing the planned use of
the ZEBs.
Bus Use and Availability
Bus use and availability are indicators of reliability. Lower bus usage may indicate
downtime for maintenance or purposeful reduction of planned work for the
buses. NREL expresses bus use as average miles accumulated per month. NREL
uses a general target of 3,000 miles per month for this metric; however, the
monthly miles for each agency will vary depending on the planned use of the
buses. If a ZEB fleet does not meet this target, it does not indicate a specific
limitation for the technology. NREL collects the mileage data for the ZEBs and
baseline buses and calculates average monthly miles accumulated per bus.
Availability is the number of days the buses are actually available compared to the
days that the buses are planned for operation, expressed as percent availability.
The analysis calculates availability for morning pull-out and doesn’t necessarily
reflect all-day availability. Transit agencies typically have a target of 85%
availability for their fleets to allow time to handle scheduled and unscheduled
maintenance. The sources for availability data vary from fleet to fleet. NREL
works with each agency to determine the best source for the data. In addition
to tracking the overall availability, NREL collects the reasons for unavailability.
Categories for unavailability include issues related to general bus systems,
preventive maintenance, electric drive, battery system, and fuel cell system.
These data help indicate whether the issues are due to the advanced technology
components or are problems with conventional bus systems.
Energy/Fuel Consumption
Data needed for this category include records of each fueling or charging event.
For liquid- and gas-fueled buses, NREL collects individual fueling records (amount
of fuel, odometer reading, hour reading, date, and fueling time) and fuel prices
(each fuel, each time the fuel price changes—price and date). For the BEBs,
NREL collects daily energy use (total kWh, number of charges, miles traveled)
and utility bills for each charging location (in-depot or on-route fast charger).
NREL analyzes these data to calculate monthly fuel economy and fuel/energy
cost per mile. For the BEBs, NREL uses the bus energy use and utility energy
data to calculate the charging losses.
FEDERAL TRANSIT ADMINISTRATION 10SECTION 2: ZERO-EMISSION BUS EVALUATIONS PLANNED
To compare the electrical energy used by the BEBs to the diesel fuel energy used
by the baseline hybrid and diesel buses, the electrical energy is converted to
diesel gallon equivalent (dge). The energy content of each fuel2 is used to create
the conversion factor shown below:
• Lower heating value for diesel fuel = 128,488 Btu/gal
• U.S. average energy content of electricity = 3,414 Btu/kWh
• Conversion factor = 128,488 Btu/gal / 3,414 Btu/kWh = 37.64 kWh/gal
Maintenance Cost
Maintenance data include each repair action—such as preventive (scheduled)
maintenance, unscheduled maintenance, and roadcalls—and date of repair, labor
hours, number of days out of service, odometer reading, parts replaced, parts
cost, and descriptions of problem reported and actual repair performed. NREL
also collects data and cost for any fluid addition (oil, transmission fluid, deionized
water). Engine oil changes are included as part of preventive maintenance. The
maintenance data are used to estimate operating costs (along with fuel and
engine oil consumption costs). Because accident-related repairs are extremely
variable from bus to bus, NREL eliminates those costs from the analysis for both
ZEB and baseline bus fleets.
NREL also eliminates warranty cost data from the operating cost calculation
because those costs are covered in the purchase price of the buses. Labor costs
may be included in this analysis depending on the mechanic who performed the
work (operator or manufacturer) and whether those hours were reimbursed
under the warranty agreement. For consistency, NREL uses a labor cost of $50/
hour. Cost per mile is calculated as follows:
Cost per mile = [(labor hours * $50/hr) + parts cost] / mileage
NREL calculates total cost per mile as well as scheduled and unscheduled
cost per mile. To understand the differences between conventional and ZEB
technology, NREL presents the cost per mile by vehicle system. The work orders
are coded using vehicle maintenance reporting standards (VMRS) developed by
the American Trucking Association to aid the industry in tracking equipment
and maintenance using a common standard. The propulsion-related systems
were chosen to include only those systems of the vehicles that could be affected
directly by the selection of a fuel or advanced technology. NREL bases the VMRS
coding on parts that were replaced. If there was no part replaced in a given
repair, then NREL selects the code by the system being worked on. System
categories include the following:
2
Alternative Fuels Data Center, fuel properties database, http://www.afdc.energy.gov/fuels/
fuel_properties.php.
FEDERAL TRANSIT ADMINISTRATION 11SECTION 2: ZERO-EMISSION BUS EVALUATIONS PLANNED
• Cab, body, and accessories – includes body, glass, cab and sheet metal, seats
and doors, and accessory repairs such as hubodometers and radios
• Propulsion-related systems (subsystems included):
–– Engine/power plant (includes fuel cell for FCEBs)
–– Electric propulsion system
–– Fuel system
–– Exhaust
–– Non-lighting electrical system—general electrical, charging, cranking,
ignition
–– Air intake
–– Cooling
–– Transmission
–– Hydraulic
• Preventive maintenance inspection (PMI) – labor for inspections during
preventive maintenance
• Brakes – includes brake pads, disks, calipers, anti-lock braking system, and
brake chambers
• Frame, steering, and suspension
• HVAC
• Lighting
• Air system (general)
• Axles, wheels, and drive shaft
• Tires
Roadcalls
All roadcalls are marked in the maintenance data collected. A roadcall, or
revenue vehicle system failure, is defined as a failure of an in-service bus that
causes the bus to be replaced on route or causes a significant delay in schedule.
If the problem with the bus can be repaired during a layover and the schedule
is kept, this is not considered a roadcall. The analysis described here includes
only roadcalls that were caused by “chargeable” failures. Chargeable roadcalls
include systems that can physically disable the bus from operating on route, such
as interlocks (doors, air system), engine, or things that are deemed to be safety
issues if operation of the bus continues. They do not include roadcalls for issues
with components such as radios, fareboxes, or destination signs.
The transit industry measures reliability as mean distance between failures, also
documented as miles between roadcalls (MBRC). MBRC is calculated by dividing
the number of miles traveled by the number of roadcalls. NREL uses the roadcall
FEDERAL TRANSIT ADMINISTRATION 12SECTION 2: ZERO-EMISSION BUS EVALUATIONS PLANNED
data to calculate cumulative MBRC over time. MBRC results in the report are
categorized as follows:
• Bus MBRC – includes all chargeable roadcalls. This category includes
propulsion-related issues as well as problems with bus-related systems such
as brakes, suspension, steering, windows, doors, and tires.
• Propulsion-related MBRC – includes roadcalls that are attributed to the
propulsion system and is a subset of the bus MBRC. Propulsion-related
roadcalls can be caused by issues with the engine, transmission, batteries,
fuel cell system, or electric drive.
• Energy storage system (ESS)-related MBRC – includes roadcalls attributed to
the ESS only (specific to BEBs).
• Fuel cell system-related MBRC – includes roadcalls attributed to the fuel cell
and balance of plant only (specific to FCEBs).
Transit agencies are required to report costs and specific performance data to
FTA through the National Transit Database (NTD). After Congress required data
reporting in 1974, FTA developed the NTD as a repository of financial, operating,
and asset condition data for American transit agencies. These data are published
on the NTD website.3 The vehicle maintenance reliability metrics used by the
NTD are as follows:
• Major mechanical system failure – a failure of some mechanical element of
the revenue vehicle that prevents the vehicle from completing a scheduled
revenue trip or from starting the next scheduled revenue trip because actual
movement is limited or because of safety concerns.
• Other mechanical system failure – a failure of some other mechanical element
of the revenue vehicle that, because of local agency policy, prevents the
revenue vehicle from completing a scheduled revenue trip or from starting
the next scheduled revenue trip even though the vehicle is physically able to
continue in revenue service. Examples include a malfunction in the farebox
or the air conditioner.
Total revenue system failures would be a sum of the two categories. The NTD
categories do not exactly match the roadcall definitions used in the standard
NREL protocol. The primary difference is that NTD’s other mechanical system
failures category includes failures of items such as fareboxes and destination
signs. This results in the NTD total failures being higher than that of the NREL
analysis. Removing these failures from the NTD data would result in higher
overall industry average MBRC. In addition, the NTD major mechanical system
failure category includes some roadcalls that are not for the propulsion system.
The NTD has no category for power plant failures; therefore, there is no direct
comparison for fuel cell system-related or ESS-related MBRC.
3
NTD website, https://www.transit.dot.gov/ntd.
FEDERAL TRANSIT ADMINISTRATION 13SECTION 2: ZERO-EMISSION BUS EVALUATIONS PLANNED
Infrastructure and Facility Modification Descriptions
At the beginning of the data collection period, NREL collects details on the
fleet’s operations including a description of facilities and services, maintenance
and fueling practices, and any other information needed to get a complete
understanding of the fleet’s experience with the ZEBs. Descriptions of facilities
include fueling, charging, maintenance, and vehicle storage facilities that may be
associated with the ZEBs.
Capital Costs
Data on capital costs include costs for any facility modifications that are required
for operation of ZEBs. The vehicle capital costs include the costs for new
vehicles and propulsion systems.
Implementation Experience
The experiences of a transit agency in implementing any new technology are
an important part of fully understanding the current status of that technology.
NREL collects data on the fleet implementation experience to document the
background work needed for successful implementation of ZEBs, as well as some
of the potential pitfalls and lessons learned. The types of information collected in
support of this activity include:
• Documentation of the history that led to the agency’s decision to purchase
ZEBs, its previous experience with alternative fuels, etc.
• Roles of important supporting organizations such as vehicle manufacturer
and supplier, fuel suppliers, and federal, state, or local government agencies.
• Specific incentives for advanced technology vehicles, and regulations or
disincentives for the other options that helped form the agency’s decision to
purchase ZEBs.
• Driver, fleet personnel, and customer perceptions of the new technology
vehicles.
• Special fleet needs such as mechanic, driver, or technician training
requirements, special equipment, and safety issues.
• Description of the training implementation strategy including employee
orientation, operations and maintenance personnel, and the costs of this
training.
• What it took to bring these vehicles into revenue service, and what
technical/non-technical hurdles were overcome.
FEDERAL TRANSIT ADMINISTRATION 14SECTION
KC Metro BEB Evaluation
3 Results
In February 2016, King County Metro (KC Metro) began operating a fleet of three
battery electric buses in its service area. This section summarizes the evaluation
results for the battery buses in comparison to a selection of baseline buses. The
focus of the analysis is on one year of data from April 2016 through March 2017.
Fleet Profile—KC Metro
KC Metro provides public transit service to King County, Washington. Its service
area covers more than 2,000 square miles, including the Seattle metro area,
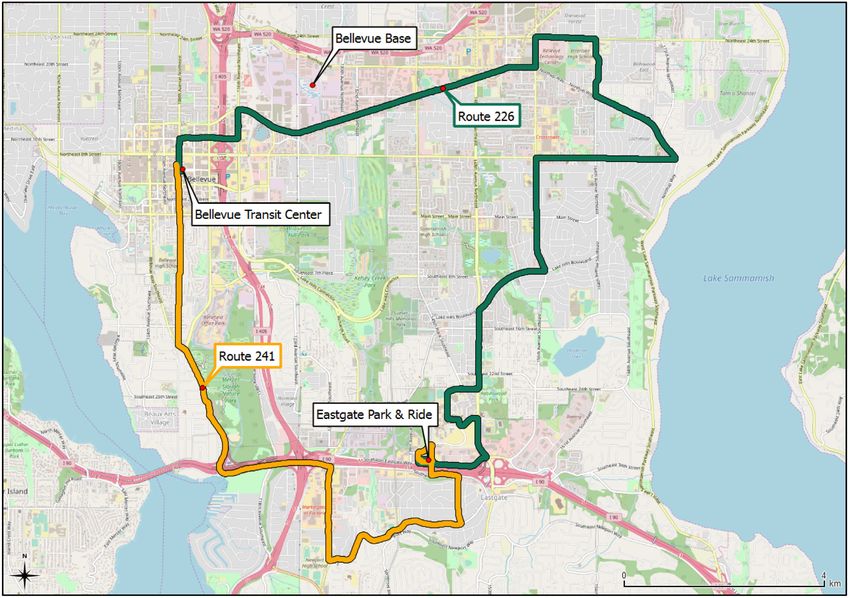
and contains more than 2 million residents. Figure 3-1 is a map showing part
of KC Metro’s service area (the shaded Bellevue region can be seen in greater
detail in Figure 3-7). KC Metro’s bus fleet operates on 215 routes and serves
Figure 3-1 KC Metro Service Area Map with Shaded Bellevue Region
FEDERAL TRANSIT ADMINISTRATION 15SECTION 3: KC METRO BEB EVALUATION RESULTS
approximately 395,000 passengers each weekday, on average. Its fleet of 1,500+
vehicles contains buses of several different propulsion types, including standard
and hybrid diesel buses, battery electric buses and electric trolley buses.
In 2010, KC Metro received funding from a TIGGER award to add three zero-
emission BEBs to its fleet. The agency selected Proterra’s 40-foot Catalyst BEB
for the project. Proterra was founded in 2004 with the mission to develop and
manufacture advanced technology all-electric heavy-duty vehicles. The Catalyst
BEB features a lightweight composite body and is capable of fast charging at stops
along its route.
Bus Technology Descriptions
The BEBs in service at KC Metro are fast-charge, composite buses built by
Proterra. Based on the in-service buses that KC Metro had available, NREL
selected three technologies for comparison to the BEBs including standard
diesel buses from Gillig as well as diesel hybrid and electric trolley buses on
New Flyer’s Xcelsior platform. Buses in all four fleets are 40-foot, model year
2015 buses. The four bus fleets included in the evaluation are referred to in this
analysis as the battery fleet, hybrid fleet, diesel fleet and trolley fleet. Table 3-1
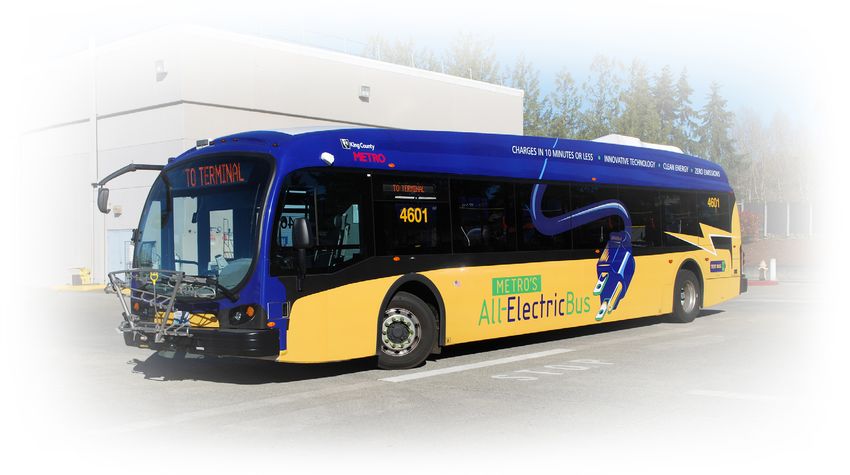
provides selected specifications for each bus type. Figure 3-2 is a photo of one of
the battery buses. The baseline buses are pictured in Figure 3-3, Figure 3-4, and
Figure 3-5.
Table 3-1 System Descriptions for the Battery Electric, Hybrid, Diesel, and Trolley Buses
Vehicle System Battery Hybrid Diesel Trolley
Number of buses
3 10 3 10
in evaluation
Bus manufacturer Proterra New Flyer Gillig New Flyer
Bus year and model 2015 Catalyst 2015 Xcelsior hybrid 2015 G27D102N4 2015 Xcelsior trolley
Length (ft) 42.5 41 40 41
Permanent magnet, UQM, Diesel engine, Cummins Diesel engine, Traction motor, 3 phase
Motor or engine
PP220 ISB-280, 6.7L Cummins ISL asynchronous AC
Rated power 220 kW peak (295 hp) 280 hp @ 2,700 rpm 280 hp @ 2,200 rpm 240 kW
Lithium-titanate batteries, Lithium-ion/FePO4 Lithium-ion/FePO4
Energy storage TerraVolt 331 volts, 105 batteries, 630 volts, 11.6 None batteries, 436 volts, 21
kWh total energy kWh total energy kWh total energy
Accessories Electric Electric Mechanical Electric
Bus purchase cost $797,882 $584,591 $497,103 $892,960
FEDERAL TRANSIT ADMINISTRATION 16SECTION 3: KC METRO BEB EVALUATION RESULTS
Figure 3-2
KC Metro Proterra
Catalyst Battery
Electric Bus
Figure 3-3
KC Metro New Flyer
Diesel Hybrid Bus
Figure 3-4
Gillig Diesel Bus
Operated by KC
Metro for Sound
Transit (photo
courtesy of KC Metro)
FEDERAL TRANSIT ADMINISTRATION 17SECTION 3: KC METRO BEB EVALUATION RESULTS
Figure 3-5
KC Metro New Flyer
Electric Trolley Bus
Charging and Maintenance
Facilities
The battery buses and hybrid buses operate out of KC Metro’s Bellevue Base.
The diesel buses are part of Sound Transit’s fleet but are operated by KC Metro
out of the agency’s East Base, which is across the street from the Bellevue Base.
The trolley buses operate in downtown Seattle and are housed and maintained
at KC Metro’s Atlantic Base. KC Metro staff maintains all the baseline buses
including performing most warranty work. The agency invoices the individual
OEMs for reimbursement of any work covered under warranty. Proterra has
an on-site technician that handles all warranty work on the battery buses.
Operators are expected to charge the buses at the fast-charge station prior to
returning to the base at the end of each day. KC Metro uses a slow charger at
the base for times when a bus needs additional charging. The installation of this
slow charger was the only modification needed to allow maintenance of the
battery buses inside the facility. Once KC Metro installs a fast charger at the
base, the need to fully charge the BEBs at the end of the day will no longer be
necessary.
KC Metro installed a fast charger at its Eastgate Park and Ride to charge the
buses. Figure 3-6 shows the fast-charge station.
FEDERAL TRANSIT ADMINISTRATION 18SECTION 3: KC METRO BEB EVALUATION RESULTS
Figure 3-6
Fast-Charge Station at
KC Metro Park-and-
Ride
In-Service Operations
Evaluation Results
This section focuses on the results of a full year of operation from April 2016
through March 2017 (the evaluation period). KC Metro put the battery buses
into service in February 2016. The diesel and trolley buses were placed into
service at about the same time as the battery buses. The diesel hybrid buses
were placed into service in 2015. The average odometer reading for each fleet at
the start of the evaluation was 2,274 miles for the battery buses, 25,351 miles for
the hybrid buses, 1,046 miles for the diesel buses, and 901 miles for the trolleys.
Route Assignments
KC Metro primarily operates the battery buses on routes 226 and 241, which
each connect the Bellevue Transit Center to the Eastgate Park-and-Ride and
together form a loop around the Bellevue/East Bellevue area. Figure 3-7 shows
the two routes on which the battery buses operate. These routes existed prior
to the deployment of the battery buses.
FEDERAL TRANSIT ADMINISTRATION 19SECTION 3: KC METRO BEB EVALUATION RESULTS
Figure 3-7 Route Map for KC Metro Routes 226 and 241
The battery buses charge at the fast-charge station during every pass through
the Eastgate Park and Ride. Figure 3-8 displays the power and state of charge
(SOC) of the ESS for one example charge/drive cycle along this route. After a
fast charge returns the ESS to a high SOC, the SOC slowly decreases as the bus
drives along the route. Some of the discharge power required to accelerate the
bus is returned to the ESS through regenerative braking when the bus slows
down. The next stop at the Eastgate fast charger boosts the SOC from 25% to
nearly 100% in approximately 10 minutes.
FEDERAL TRANSIT ADMINISTRATION 20SECTION 3: KC METRO BEB EVALUATION RESULTS
Figure 3-8 Battery Charge and Discharge Power and State of Charge for One Example Charge Cycle
Based on scheduled revenue service, the battery buses have an average speed
of 14.8 mph. The hybrid buses are randomly dispatched from the Bellevue base
and cover all routes, including some commuter service. This results in a slightly
faster average speed, at 15.2 mph. The diesel buses operate on a specific route
for Sound Transit with an average speed of 14.6 mph. The trolley buses operate
out of the Atlantic base and are limited to the network of catenary lines in and
around downtown Seattle. The trolley buses have on-board energy storage that
allows off-wire capability for a short range to change from wire to wire or avoid
temporary blockage of the street. Because they operate in the heavily congested
downtown area, the average speed for the trolley buses is much lower than
that of the other fleets, at 9.0 mph. These average speeds are calculated using
revenue service schedules and do not include deadhead or out of service miles.
Bus Use
Figure 3-9 tracks the accumulated mileage and operating hours of the battery
buses since they were placed into service. KC Metro has been operating the
battery buses continuously since February 2016, accumulating almost 100,000
total fleet miles by the end of March 2017.
FEDERAL TRANSIT ADMINISTRATION 21SECTION 3: KC METRO BEB EVALUATION RESULTS
Figure 3-9 Cumulative Miles and Hours for Battery Bus Fleet
Table 3-2 provides the evaluation period mileage for each bus and the average
monthly mileage by bus type, which is also displayed in Figure 3-10. The battery
buses each averaged between 1,200 and 3,100 miles per month, with an overall
fleet average of 2,309 monthly miles per bus. This is lower than the baseline
hybrid bus fleet average of 3,659 monthly miles per bus but higher than the
diesel and trolley bus fleet averages of 1,952 and 1,486 monthly miles per bus,
respectively. These differences are a result of the planned operation of these
fleets. The battery fleet is restricted to lines 226 and 241 and the hybrid fleet
is randomly dispatched on all routes, including commuter routes with higher
speeds which allows faster mileage accumulation.
Proterra was the primary source of data for the battery fleet mileage, charges,
and energy use during this evaluation. Proterra’s data collection system
malfunctioned during March 2017, resulting in a partial loss of data. To fill in
the gap in the Proterra data set, NREL obtained daily mileage totals from KC
Metro. The information presented in this report is a hybrid of mileage data
from Proterra and KC Metro to properly capture all the fleet mileage. Prior to
creating the hybrid data set, NREL verified that the records matched closely by
comparing the Proterra and KC Metro data sets during months for which there
were no data losses.
FEDERAL TRANSIT ADMINISTRATION 22SECTION 3: KC METRO BEB EVALUATION RESULTS
Table 3-2 Average Average
Total Total
Average Monthly Bus # Months Monthly Bus # Months Monthly
Mileage Mileage
Mileage Mileage
Mileage (Evaluation
Period) 4601 27,769 12 2,314 9124 22,231 12 1,853
4602 29,875 12 2,490 9125 24,091 12 2,008
4603 25,484 12 2,124 9126 23,007 12 1,917
Battery fleet 83,128 36 2,309 Diesel fleet 69,329 36 1,926
7239 50,912 12 4,243 4364 17,969 12 1,497
7241 46,888 12 3,907 4371 19,195 12 1,600
7245 49,780 12 4,148 4373 16,941 12 1,412
7246 45,338 12 3,778 4374 18,276 12 1,523
7247 46,376 12 3,865 4375 17,837 12 1,486
7249 47,034 12 3,920 4376 17,139 12 1,428
7250 40,185 12 3,349 4377 16,781 12 1,398
7252 36,305 12 3,025 4380 19,289 12 1,607
7253 34,532 12 2,878 4383 18,989 12 1,582
7254 38,202 12 3,184 4384 18,138 12 1,512
Hybrid fleet 435,552 120 3,630 Trolley fleet 180,554 120 1,505
Figure 3-10 Average Monthly Miles for All Four Bus Fleets
FEDERAL TRANSIT ADMINISTRATION 23SECTION 3: KC METRO BEB EVALUATION RESULTS
Availability
The availability analysis covers 12 months of data collection and evaluation,
August 2016 through July 2017. The date range for the availability analysis does
not exactly match the evaluation period date range discussed in other sections of
this report—April 2016 through March 2017—due to a delay in the collection of
availability data at the beginning of the evaluation. KC Metro provided daily status
reports to determine bus availability. The reports summarized open work orders
at 8:00am every morning. If one of the evaluation buses was included in the list, it
was deemed unavailable for service at morning pull-out (8:00am for this analysis).
NREL further analyzed the open work order reports to determine the primary
reason each bus was held out of service. These maintenance reasons were
grouped into the unavailability categories shown in the availability charts. The bus
maintenance category applies to all general maintenance issues not specific to a
powertrain. Other categories include preventive maintenance (PM), electric drive
system, ESS, charging issues, current collection, hybrid system, transmission, and
engine. Some of the categories are not applicable to all of the bus fleets.
KC Metro’s planned operation varies by bus fleet. The baseline hybrid and trolley
bus fleets are in service every day, including weekends. The standard diesel
buses in the evaluation operate on weekdays only. The battery fleet operates
on weekdays, with one battery bus also operating on Saturdays. During the
evaluation period, KC Metro did not plan to operate the battery buses on
Sundays. Thus, NREL based the availability analysis on a seven-day week for the
hybrid and trolley fleets and a five-day week (weekdays only) for the battery and
diesel fleets. The data presented are based on availability at morning pull-out,
as described above, and do not necessarily reflect all-day operation. There are
some instances when a bus was removed from service after being available at
morning pull-out, as well as instances when a bus that was unavailable at 8:00
AM became available for service later the same day. The frequency of these two
scenarios was not tracked or included in the analysis. Their impacts on the fleet
availability are largely expected to offset each other.
One of the battery buses was out of service for much of December and January
after being damaged by improper towing. NREL regards the matter as an
accident and not relevant to measuring bus technology performance. Therefore,
the downtime was removed from the analysis. The damage is considered to have
resulted from a lapse in training rather than a problem with the technology.
While other buses were involved in minor accidents during the data period, none
of the incidents resulted in significant downtime.
Table 3-3 summarizes the availability for the four fleets during the data period.
The overall average availability for the battery fleet was 80.6%. For the baseline
buses, the overall average availability was 90.5% for the hybrid fleet, 86.2% for
the diesel fleet, and 84.9% for the trolley fleet.
FEDERAL TRANSIT ADMINISTRATION 24You can also read