CFA Institute Research Challenge - Local Challenge Oriental Capital /Singapore Management University
←
→
Page content transcription
If your browser does not render page correctly, please read the page content below
CFA Institute Research Challenge
                                     Hosted by CFA Singapore

                           Local Challenge
        Oriental Capital /Singapore Management University

Oriental Capital Global Investment Research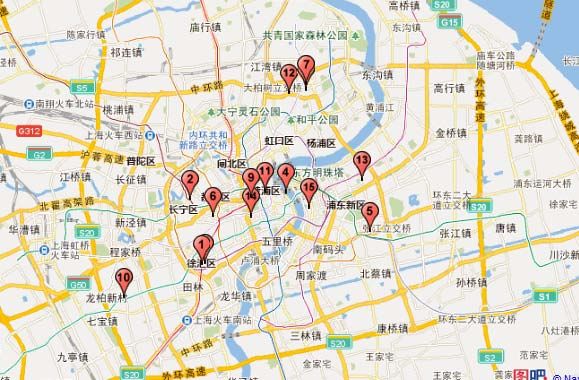
OSIM International (OSIM.SP)
OSIM: Unearthing a Hidden Gem                                                                                                  9 January 2013

OSIM Unparalleled in Massage Chair Business
                                                                                                                                            BUY
OSIM is peerless in the massage chair industry by possessing both                                                     Initiating Coverage
strong technological expertise and marketing capabilities. Its R&D
                                                                              Key Data                                                              Current
capabilities have allowed OSIM to launch many “world-first" products,
                                                                              Fair Value:                                                             S$2.18
and well-executed marketing campaigns have positioned OSIM as the             Prev Close:                                                             S$1.78
“go-to” brand for massage chairs. Such unique positioning has also            Upside:                                                                 22.5%
enhanced OSIM’s pricing power. We expect OSIM to preserve its                 STI:                                                                  3,223.80
unique positioning as its peers lack the capabilities to bridge the gap.
                                                                            Price Performance Chart
Market Underprices OSIM’s Growth Potential                                  OSIM Share Px                                                                       STI Index
                                                                                 (S$)
                                                                            2.00                                                                                  3,500
Recent slower than expected store expansion might have raised                                                                                                     3,000

concerns regarding OSIM’s growth prospects in China. We however             1.50
                                                                                                                                                                  2,500

remain bullish as China’s massage chair industry is forecasted to           1.00
                                                                                                                                                                  2,000

                                                                                                                                                                  1,500
grow 20% annually till 2015, and OSIM has more headroom for                                                                        Price Perf ormance             1,000
                                                                            0.50                                                   OSIM: +2483.5%
growth as its current market share is far lower than in other markets.                                                             STI Index: 83.1%
                                                                                                                                                                  500

OSIM’s premium and international brand positioning is also expected           -
                                                                                  Jan-09   Jul-09   Jan-10   Jul-10   Jan-11   Jul-11    Jan-12     Jul-12
                                                                                                                                                                  -
                                                                                                                                                             Jan-13
                                                                                                       OSIM                             STI Index
to appeal to the increasing affluent and savvy Chinese consumers.
Finally, management’s focus on tier one and two cities points to a
more targeted expansion strategy. We view this development
positively and expect capital utilization to improve moving forward.

Cash War Chest Offers Financial Independence and
Supports New Ventures
OSIM’s strong positioning and exposure to growth markets have
made it highly cash generative; it has amassed S$184.9m of cash as
of 3Q12. OSIM’s management has indicated its intent to hold
sufficient cash to avoid a replay of the credit crunch experienced in
2008. Excess cash will also provide the firepower to grow OSIM’s
peripheral businesses; management has indicated that it would focus
its resources on TWG Tea. We expect aggressive expansion in North
Asia given OSIM’s effective 74% stake and we are optimistic of TWG
Tea’s unique premium retail high-tea experience

Compelling Valuation
Our 3-stage DCF valuation results in a 12-month price target of
S$2.18, representing a 22.5% upside. We believe the market has
undervalued OSIM’s expansion strategy in China. In addition, the
penetration rate of massage chairs in North Asia (ex China) and
South Asia is also well-poised to rise, which will provide further top-
line growth for OSIM. Our target price implies a forward P/E of 13x,
lower than its 5-year historical average of 19x. With 2013 EPS growth
of 16%, we yield a PEG ratio of less than 1. At current market
valuation, OSIM is indeed a hidden gem for investors.

TAN Yong Yi                            LIM Wei                    TEO Jie Xiang
yongyi.tan.2009@smu.edu.sg             wei.lim.2009@smu.edu.sg    jiexiangteo.2009@smu.edu.sg
NAING Ye Lin                           Adam TAN Kian Hung
yelin.naing.2009@smu.edu.sg            adam.tan.2009@smu.edu.sg

Oriental Capital Global Investment Research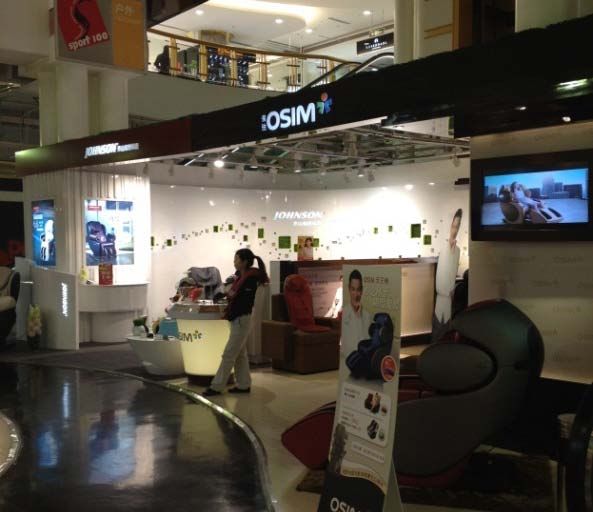
9 January 2013

About OSIM International
                                Company description
OSIM International is a         OSIM International is a Singapore-based retailer for luxury lifestyle health
luxury lifestyle and            products (notably massage chairs) and nutritional supplements. OSIM has
healthcare retailer with        four business units: 1. OSIM, a lifestyle product specialist (including massage
an Asian market focus           chairs), 2. GNC and RichLife, nutritional supplements retailers and
                                manufacturer (only RichLife), 3. TWG Tea, a luxury tea boutique and salon,
                                and 4. Brookstone, a US-based retailer, though this investment has been
                                written off in 2008.

                                Exhibit 1: OSIM Group derives 94% of its revenue from Asia
                                                                                                                                                      553,740
                                                               Others                                                                508,738           30,938
                                                                6%                                                    476,767
                                                                                                456,661                               41,614
                                                                                                                      58,210
                                                                                                71,530                                                205,397
                                                                                                                                     168,669
                                          South Asia                                                                  159,915
                                            37%      Revenue (FY11)                             159,996
                                                                 553.7m
                                                                           North Asia
                                                                             57%
                                                                                                                                     298,455          317,405
                                                                                                225,135               258,642

                                                                                                 2008                  2009            2010            2011
                                                                                                         North Asia             South Asia          Others

                                 Source: Company data

                                OSIM International reported record revenue of S$553.7m for FY11, and a
                                corresponding net profit of S$69.9m. Its Asian focus is evident; 94% of its
                                revenue is derived from Asia. OSIM’s management has also indicated that
                                OSIM constitutes 75% of the Group’s revenue for the first 9 months of FY12.

OSIM Unparalleled in Massage Chair Business
                                We think OSIM International’s stellar share price performance is driven by its
                                peerless positioning in the marketplace. Evaluating OSIM and its key
                                competitors on the basis of their marketing and product innovation (two
                                categories we think are key success factors), OSIM emerges as the best-
                                positioned firm given its unique blend of strong product line-up supported by
                                its well-established distribution channels and marketing efforts. The 2 x 2
                                matrix below summarizes our view on the marketplace.
                                Exhibit 2: OSIM Possesses Both Marketing and Technical Expertise

                                                                                                           1   Superior and Sustainable Research and
                                                                            1
                                                                                                               Development Capabilities Differentiates OSIM
                                                        High

                                                                                                               from OTO and OGAWA
                                  Marketing Expertise

                                                                                            2                  OSIM’s Strong Marketing Efforts Support
                                                                                                           2
                                                                                                               Product Line; Japanese Peers Lack Expertise
                                                        Low

                                                                 Low                     High

                                                                   Technical Expertise
                                 Source: Oriental Capital estimates

                                More importantly, we expect OSIM to remain unchallenged as we anticipate
                                significant difficulties for both clusters of competitors to bridge the differences.

                                                                                                                                                                3
    Oriental Capital Global Investment Research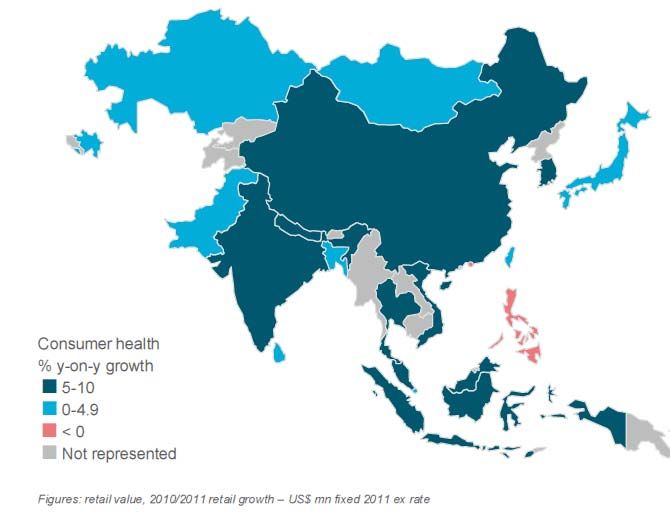
9 January 2013

                                1. Superior and Sustainable Research and Development
                                Capabilities Differentiates OSIM from OTO and OGAWA
We think OSIM’s product         Against OTO and OGAWA which employ similar marketing strategies, we
innovation is sustainable       think OSIM possesses superior product offering due to its R&D capabilities.
given strong JV                 Though OSIM products are not patentable which in turn often engender
partnership and CTO             imitation, we are encouraged by its stellar track record of product innovation.

                                Successful Product Launches & Awards Support Our View
                                OSIM’s superior R&D capability is manifested through its constant innovation;
                                OSIM is often the first among its peers to employ new breakthrough
                                technology within its products.
 Exhibit 3: OSIM Constantly Pioneers Technological Breakthroughs in its Products

           2005                           2008                         2010                       2011
     OSIM iDesire                    OSIM uCrown                OSIM uDivine                OSIM uPhoria
   World's first full body       World's First Anti-Stress   World's first Human-3D      World's first Tui-Na leg
   massage experience               Head Massager               massage chair                  massager
 Source: Company news

                                These innovative products have also received international recognition; OSIM
                                has won the Red Dot Design Award in 2005, 2007, 2008 and 2011 for its
                                products, which include uSpace, a massage chair, and uVenus, the world’s
                                 st
                                1 ambient purifier. OSIM’s success is testimony to its strong product offering
                                and gives us confidence in its R&D capabilities.

                                Close Ties with Daito and CTO Sustains R&D Superiority
                                We expect OSIM to preserve its R&D superiority as it maintains amicable
                                relationships with its strategic Japanese R&D partner, Daito and Chief
                                Technology Officer, Mr Tan Kia Tong.

                                OSIM maintains a close and long-standing relationship with its Japanese joint
                                venture partner, Daito Electric Machine Industry, which is responsible for both
                                R&D and manufacturing of OSIM’s products. OSIM currently maintains a 30%
                                stake in the JV entity, DT-OSIM Healthcare Appliances (Suzhou). Most
                                recently, OSIM acquired a 30% interest in Suzhou Daitec, yet another JV with
                                Daito. We view this positively and we expect the relationship to remain strong.

                                OSIM Chief Technology Officer (CTO), Mr Tan Kia Tong, has spearheaded
                                OSIM’s relentless ground-breaking R&D since he joined in 2002. Not
                                coincidentally, since 2003, OSIM launched many of its “World’s first” products
                                as seen in Exhibit 3.

                                2. OSIM’s Strong Marketing Efforts Support Product Line;
                                Japanese Peers Lack Expertise
                                Beyond a strong product offering, OSIM’s effective marketing campaigns
                                have positioned OSIM as the “go-to” brand for lifestyle products. A Frost and
                                Sullivan survey conducted in Hong Kong in 2010 revealed that 75% of all
                                respondents cited OSIM as the “top-of-the-mind” brand. Our check on
                                Facebook has also indicated that OSIM has gained the most traction; its Asia
                                Pacific pages have garnered 80% of the total “Likes” among the three brands.
                                                                                                                    4
    Oriental Capital Global Investment Research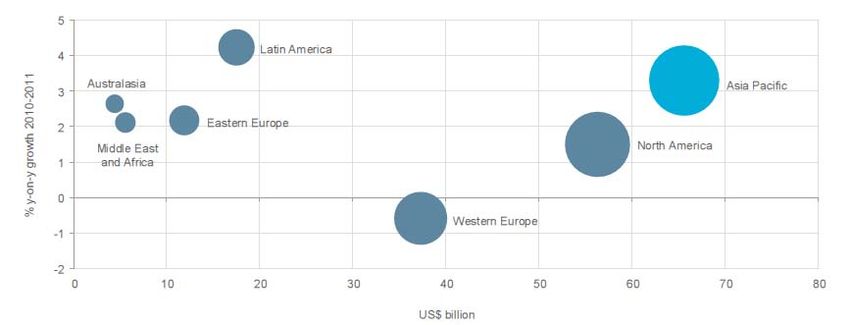
9 January 2013

Exhibit 4: OSIM clearly the “go-to” brand for massage chairs and lifestyle products
Frost and Sullivan Hong Kong Consumer Survey                              Brand Popularity Based on Social Media Traction
                                                                                                    OGAWA
    OSIM                                                   75.0%                                     6%

     OTO                   19.5%
                                                                                              OTO
                                                                                              14%
Panasonic          3.6%

   Sanyo      0.5%

   Others     0.0%

  OGAWA       0.0%                                                                                            OSIM
                                                                                                              80%
No brands
                  1.4%
identified
             0%           20%      40%           60%       80%

Source: Frost and Sullivan, Facebook, Oriental Capital estimates

                                     Though not representative of OSIM’s standing in all markets, we view this
                                     positively as OSIM clearly possesses expertise in establishing itself in
                                     markets beyond Singapore. This has also translated into financial success;
                                     engagement of Andy Lau to endorse uDivine proved to be a huge success.
                                     In the quarter following the launch of uDivine i.e. 1Q11, OSIM’s revenue grew
                                     12.3% QoQ, 15.7% YoY, and Andy Lau is now synonymous with uDivine.

                                     In contrast, Panasonic and Sanyo are manufacturers which utilize dealers to
                                     distribute their products, and hence marketing is often ceded to the dealers.
                                     Given that Panasonic and Sanyo have utilized such distribution method for all
                                     its products, we believe they lack in-house expertise for marketing and
                                     retailing. Ceding this control, both Sanyo and Panasonic will have lower
                                     control over marketing campaigns and customer relationships management.

                                     Though Panasonic and Sanyo possess comparable or even superior
                                     technology, their inability to support their products with commensurate
                                     marketing efforts diminishes their technological superiority.

                                     OSIM’s Unique Positioning Enhances Pricing Power
                                     OSIM’s unique positioning translates into increasing pricing power; our pricing
                                     benchmark reveals that OSIM’s price for its leg massager has steadily
                                     increased, while its competitors have reduced their prices. We view this
                                     positively given that uPhoria’s sales have been brisk, i.e. the higher prices did
                                     not impact demand for OSIM’s products.

                                     As for massage chairs, we see that OSIM has largely maintained its prices
                                     while OTO and OGAWA have reduced their prices, which provides further
                                     support for our view. (Refer to Appendix K)

                                     Exhibit 5: Strong Pricing Power of OSIM Relative to OTO, OGAWA
                                          Price of Leg
                                         Massager (S$)
                                          900

                                                                                               OSIM uPhoria
                                          700

                                          500
                                                                                                        OTO Powerflex
                                                                                                        OGAWA Foottee
                                          300
                                                  2003    2005     2007     2009   2010     2011     2012

                                                         OTO               Ogawa            OSIM

                                         Source: Company data, Oriental Capital estimates

                                                                                                                            5
     Oriental Capital Global Investment Research
9 January 2013

Market Underprices OSIM’s Growth Potential
                                      The recent slower than expected store expansion of OSIM (2 stores for 9M12
                                      vs. 50 as guided) might have raised concerns about OSIM’s growth potential.
                                      In particular, we think concerns might have been raised regarding the slowing
                                      Chinese retail market.

                                      On the contrary, we are bullish on China’s massage chair growth outlook. We
                                      considered the affordability of massage chairs to forecast future penetration;
                                      our correlation analysis of % of households with >US$25k income and
                                      massage chair penetration reveals a positive relationship. Significant growth
                                      is expected from China as its % of households with >US$25k income is slated
                                      to grow at a CAGR of 38.3% till 2017. OSIM’s significantly lower market share
                                      also provides more growth headroom. We coin this, the income effect.
  Exhibit 6: Asia’s economic growth expected to provide uplift in penetration rate
                                                                                    % of HH with
  Penetration                                                                     >US$25k income
    Rate (%)                                                                          Growth
  10%                                                                                 70%

                                                                                     60%
   8%
                                                  HK                 SG              50%

   6%                                                                                40%
                                                  y = 0.0673x + 0.0196
                           MY               TW                                       30%
   4%                                                                                20%

                                                                                     10%
   2%
              CN                                                                      0%
                                                                                                  China         Malaysia           Taiwan         Hong Kong      Singapore
   0%                                                                         OSIM's current
        0%          20%          40%        60%         80%           100% market share            15%               21%            65%             74%                   65%

                   % of Households with >US$25k Annual Income                                          2013          2014           2015           2016          2017

  Source: EIU, Frost and Sullivan, The Star, Company data, Oriental Capital estimates

                                      Beyond the income effect, we think longer term changes in consumer
                                      preferences i.e. preference effect can create new demand for healthcare
                                      products as consumers become increasingly savvy and knowledgeable.

                                      We substantiate our view by including Japan in our regression analysis.
                                      Though it has similar affluence levels as Singapore, its penetration is much
                                      higher. This, we think, is a reflection of higher consumer awareness towards
                                      healthcare products, and we anticipate other Asian countries to eventually
                                      catch onto similar trends. This will in turn enhance the relationship between
                                      income and penetration rate. Consumer healthcare spending in all five Asian
                                      markets is also expected to grow. Hence, we are cautiously optimistic of the
                                      potential upside that can arise from increasing consumer awareness towards
                                      healthcare products.

 Exhibit 7: Changes in Consumer Preferences Expected to Provide Further Sales Upside
                                                                                   Consumer Healthcare Spending Forecast
  Penetration                                                                      Growth Rate                                                            Market Size
   Rate (%)                                                                            (%)                                                                 (US$bn)
  30%                                                                                8%                                                                           28
                                                           JP
   25%                                                                                                                                                                24
                                                                                     6%                                                                               20
   20%
                                                                                                                                                                      16
                                                                                     4%
   15%                                                                                                                                                                12

                                                                                     2%                                                                               8
   10%                                     HK        y=   0.0146e2.4385x
                      MY             TW                                                                                                                               4
    5%                                                    SG
             CN                                                                      0%                                                                               -
                                                                                                  CN          HK            TW              SG         MY
    0%
         0%         20%      40%        60%      80%       100%            120%    CAGR           5.6%        1.8%          4.1%           1.4%        3.6%
                    % of Households with >US$25k Annual Income                             2012        2013    2014         2015      2016        Market Size (RHS)

 Source: EIU, Euromonitor International

                                                                                                                                                                            6
 Oriental Capital Global Investment Research
9 January 2013

                               Large & Growing Chinese Market Underpins OSIM’s Growth
                               OSIM is currently the largest player in China with a market share of ~15%.
                               We view OSIM’s market leadership position positively as we are bullish on the
                               Chinese massage chair market and we believe OSIM is best-positioned to
                               succeed. Three key insights give us confidence:

                                    •     China’s market for massage chairs is large and show strong
                                          untapped potential and high growth moving forward
                                    •     OSIM is poised to benefit from the large and growing market given its
                                          premium positioning and international brand recognition
                                    •     Management’s recent strategy of store rationalization i.e. to focus on
                                          key tier 1 and 2 cities is in the right direction

                               Exposure to Large Chinese Market with Huge Untapped
                               Growth Potential
OSIM’s share of pie has        OSIM currently has 274 stores in China with potential net new stores
tremendous potential           expected annually. The Chinese market is highly attractive, with the top eight
to increase amidst a           cities alone commanding a total market size of ~US$900m by 2015E.
fast-growing market
                               According to a report published by Hejun Consulting, the Chinese massage
                               chair industry is also expected to grow at ~20% CAGR from now till 2015E.
                               Frost & Sullivan has also projected the Chinese health and wellness
                               equipment industry to grow at 18.3% annually till 2015E to reach S$5.7bn.

                               With a large market and strong growth, we estimate OSIM’s current revenue
                               derived from China as a % of total potential market in China to be 4%. This is
                               in contrast to the 15% market share that OSIM currently has. Assuming that
                               OSIM maintains its market share as the market grows, we expect to see
                               revenue upside of ~73% above current levels in China.
                                Exhibit 8: Large and Growing Chinese Market Shows Upside Potential
                                     OSIM’s current revenue share
                                     Competitor’s estimated revenue share
                                     Total untapped potential revenue share

                                                                                                                                 Heilongjiang

                                                                                                                                    Jilin

                                                                                                                          Liaoning                 Beijing market:
                                                 Xinjiang                                                   Hebei                                  S$245m
                                                                                 Inner Mongolia               Beijing
                                                                 Gansu                                                                                   Tianjin available
                                                                                                               Tianjin
                                                                                                   Shanxi                                                market: S$145m
                                                                                     Ningxia                   Shandong
                                                                                                                                               Suzhou available
                                                               Qinghai       Gansu                                                             market: S$39m
                                                                                         Shaanxi    Henan                 Jiangsu

                                                  Tibet                                                         Anhui               Shanghai
                                                                                                     Hubei                                               Shanghai available
                                                                         Sichuan                                                Zhejiang
                                                                                                                                                         market: S$298m
                                                                                   Chongqing                 Jiangxi
                                                                                                   Hunan                                         Hangzhou available
                                                                                                                       Fujian
                                                                                      Guizhou                                                    market: S$48m
                                                                         Yunan                          Guangdong
                                                                                           Guangxi                                          Guangzhou available
                                                                                                                                            market: S$44m
                                                       Chongqing available                                          Shenzhen available
                                                       market: S$61m
                                                                                                     Hainan market: S$15m

                                Source: Oriental Capital estimates

                               OSIM’s Premium and International Positioning to Thrive in
                               Growing Chinese Luxury Market
                               The appeal of OSIM’s premium and international positioning increases as
                               consumers become more wealthy and savvy. Across all its competitors, OSIM
                               has the highest price points in China, cementing its premium positioning.

                                                                                                                                                                              7
   Oriental Capital Global Investment Research
9 January 2013
Exhibit 9: OSIM’s premium and international positioning caters strongly to the luxury market
Top 3 buying factors for Luxury Purchases
Osim/傲胜 Udivine Sport: RMB 44,000 2008 2010
Premium
美国喜健: RMB 35,800
1. Good material 1. Superior craftsmanship
荣泰: RMB 32,800 Ready- 2. Superior craftsmanship 2. Internationally well-known
Price of massage chairs
OTO Bodycare: RMB 29,800 to-wear 3. Innovative design brand
Panasonic//松下: RMB 32,000 3. Good material
1. Superior craftsmanship 1. Internationally well-known
KGC: RMB 17,400
Leather 2. Innovative design brand
LIFE POWER/生命动力: RMB 16,000
Mid-tier
goods 3. Good material 2. Superior craftsmanship
Ogawa/奥佳华: RMB 16,000 3. Good material
Dotast (多迪斯泰): RMB 14,767
1. Innovative design 1. Superior craftsmanship
艾力斯特: RMB 13,800 2. Superior craftsmanship 2. Innovative design
凯仕乐: RMB 12,188 Jewelry
3. Timeless style 3. Internationally well-known
brand
松科: RMB 9,900
司达康: RMB 9,900 1. Superior craftsmanship 1. Superior craftsmanship
Mass 2. Innovative design 2. Internationally well-known
Rovos/荣耀: RMB 8,400 Watches
KUS: RMB 7,980 3. Internationally well- brand
乐尔康: RMB 6,800 known brand 3. Innovative design
Source: McKinsey– Understanding China’s Growing Luxury Market, Oriental Capital estimates
International brand A McKinsey study on the Chinese luxury market indicates that “internationally
ranks high on luxury well-known brand” have in recent times emerged as the top three factors for
purchase luxury purchases across all surveyed categories (See Exhibit 9). OSIM’s
considerations global presence in 30 countries and 74% market share in Hong Kong
favoring OSIM (gateway to China) clearly signals its international status. Coupled with its
luxurious positioning, we believe OSIM can gain strong traction among
Chinese consumers.
In addition, a report published by Hejun Consulting Group shows OSIM
enjoying high brand awareness alongside its Japanese peers. However,
OSIM’s market share far supersedes that of its Japanese competitors. We
think their brand awareness might have stemmed from other products instead
of their massage chairs and hence the significantly lower market share.
Exhibit 10: OSIM Enjoys High Brand Awareness and Market Share
High
Brand Awareness
Chinese
players
Low
Low Market Share High
Source: Hejun Consulting Group
With a premium brand that we anticipate will become increasingly popular
among the Chinese consumers, and a leading position in brand awareness
and market share, we think OSIM is best-positioned among its peers to
succeed and capitalize on the rising demand for massage chairs in China.
OSIM is Geared to Succeed Strategically in China
OSIM has in recent times engaged in store rationalization across China
OSIM’s store closing down unprofitable outlets and moving focus toward key tier 1 and 2
rationalization
cities. We view this move favourably as the luxury market in China is heavily
focuses efforts on
skewed towards the top tier cities. The top 15 cities in China carry 71% of all
key luxury markets
luxury stores, and massage chair purchases are largely concentrated in tier 1
and 2 cities as illustrated in Exhibit 11 below.
8
Oriental Capital Global Investment Research9 January 2013
Exhibit 12: Luxury stores concentrated in top 15 cities; Massage chair purchases in tier 1 and 2 cities
Level of
No of Luxury Brands Stores (2011) Spend
Tier 1
Beijing 62 Tianjin 13 City
Shanghai 55 Suzhou 13 Tier 2
Highest
Concentration
Hangzhou 27 Nanjing 12 City
Chengdu 21 Dalian 12 Tier 3 Moderate
Concentration
City
Shenzhen 19 Qingdao 11
Shenyang 18 Kunming 11 Tier 4
City
Harbin 16 Wenzhou 11
Tier 5
Guangzhou 13 City
Developed Emerging Provincial Townships
Cities Cities Cities
Source: JLL, Hejun Consulting Group
Against a strong macro backdrop, OSIM’s well-aligned brand positioning and
strategic store rationalization plan will allow it to best capitalize on China’s
growth. We are thus bullish on OSIM’s growth prospects in China.
Cash War Chest Offers Financial Independence
and Supports New Ventures
OSIM’s massage chair business is now the de-facto cash cow for the Group.
Though there has been little net change in stores, profit before tax has
averaged S$10m or higher every quarter since 1Q10. With relatively muted
capital expenditure requirements and strong profits, OSIM’s massage chair
business generates strong free cash flows for the firm.
Exhibit 13: OSIM business highly cash generative for Group
PBT (S$m) % change in OSIM
stores
25 6%
20 4%
15 2%
10 0%
5 -2%
- -4%
1Q10 2Q10 3Q10 4Q10 1Q11 2Q11 3Q11 4Q11 1Q12 2Q12 3Q12
Profit before taxation % Change in Total Osim outlets
Source: Company data
Not surprisingly, OSIM has amassed S$184.9m cash as of 3Q12, and we
think this war chest allows OSIM to achieve two objectives: 1) to attain
financial independence, and 2) finance new promising business ventures
OSIM Seeks Financial Independence to Avoid Replay of
Financial Crisis
OSIM’s business performance nosedived during the financial crisis, with its
revenue falling 13% YoY and OSIM reported a net loss of S$98.0m (including
an impairment loss of S$77.3m). OSIM had also S$32.7m of debt that was
due in 2009. The poor macro outlook meant that OSIM had no access to debt
markets, and was compelled to turn to the equity market for capital.
In January 2009, OSIM announced a 2-for-9 rights issue at S$0.055 per
share, a 31% discount to the closing price of S$0.08 prior to the
announcement. We think the rights issue was launched at such steep
discount to compel shareholders to subscribe and it raised S$6.5m for OSIM.
9
Oriental Capital Global Investment Research9 January 2013
Though OSIM’s financials have now turned around, the management has
indicated its intent to hold sufficient cash to avoid a replay of the credit crunch,
which compelled it to raise equity capital under such unfavourable conditions.
We concur with the management, and think that such financial independence
would augment confidence in the financial health of OSIM.
TWG Tea Shows Growth Potential; Offers Value Accretive
Investment Opportunity
OSIM’s management has recently indicated its intent to scale back on
RichLife and GNC, and to channel resources towards expanding TWG Tea.
OSIM acquired 35% stake in TWG Tea in 2011, and concurrently set up TWG
Tea North Asia joint venture with TWG Tea, of which OSIM holds a controlling
60% stake (74% effective stake). Given its controlling stake in the North Asia
business, OSIM’s management has signalled its intent to roll out 5 – 8 stores
in each of the four countries within the region over the next 3 to 5 years.
TWG Tea is a luxury tea boutique and salon where its stores are situated in
upmarket malls across Asia. Bringing the hotel high-tea concept to retail mall
is first of its kind, and is currently an untapped market. Our visits to its stores
in Hong Kong, International Financial Centre, and Singapore, Marina Bay
Sands convinced us of TWG Tea’s success; stores were full throughout the
day, and also cater to tourists with its pre-packaged premium tea.
We view TWG Tea’s business highly favourably given its unique positioning
and think North Asia offers substantial growth opportunities. To substantiate
our view, we considered cities where TWG Tea can penetrate. Given its
premium positioning, we benchmarked TWG Tea’s expansion opportunities
against presence of luxury malls in the four regions, and came up with a list of
cities that can accommodate TWG Tea stores. Based on our estimates, there
are 22 cities that TWG Tea can potentially penetrate.
Exhibit 14: Cities which TWG Tea can potentially penetrate
Hong Kong China Korea Taiwan
Hong Kong Shanghai Beijing Chengdu Seoul Busan Taipei
Shenyang Shenzhen Wuhan Gyeonggi-do Ulsan Kao-hsiung
Ning Bo Xi-an Chong Qing Daegu Gwangju
Qingdao Nanjing Hang Zhou Incheon
Source: Oriental Capital estimates
Using GDP as an indicator, we estimated these 22 cities to collectively
support 62 TWG Tea stores, which is ~280% higher than the management’s
expansion plan. Hence, we remain bullish on the prospects of TWG Tea, and
believe that it will effectively utilize the capital that OSIM generates.
Attractive Valuation; TP: S$2.18
DCF fair value of We believe the market has not fully priced in OSIM’s growth prospects in
S$2.18 implies 22.5% China, where demand continues to be fuelled by both income and preference
upside effects. We foresee similar effects in North Asia (ex China) and South Asia,
albeit at a slower rate compared to China. For the GNC/RichLife business, we
estimate growth rates to follow healthcare spending patterns expected of the
respective geographical regions. We value OSIM using a 3-stage DCF model
with terminal growth of 1.5% and WACC of 13.8%. On this basis, we arrive at
a fair value of S$2.18, implying an upside of 22.5%. Our price target also
implies a forward P/E of 13x (lower than 5-year historical average of 19x).
With 16% 2013 EPS growth rate, we yield a PEG ratio below 1 for both
trading and forward P/E. These show us that OSIM is indeed a compelling
investment at current market valuation.
10
Oriental Capital Global Investment Research9 January 2013
Exhibit 14: DCF Valuation Reveals Value in OSIM
S$'000 2013F 2014F 2015F 2016F 2017F 2018F 2019F 2020F Terminal
EBIT(1-t) 100,677 114,174 129,520 142,878 156,888 163,392 171,113 177,297
Add: Depreciation & Amortisation 10,068 11,692 13,295 14,940 16,677 16,826 17,143 17,642
Less: Change in Non-Cash Working Capital 188 (1,588) (1,956) (2,068) (4,042) (388) (268) (173)
Less: Capital Expenditures (16,258) (17,740) (19,447) (21,413) (16,519) (17,320) (18,358) (19,605)
FCFF 94,675 106,539 121,413 134,336 153,003 162,511 169,630 175,161 1,442,652
Discount factor 0.88 0.77 0.68 0.60 0.52 0.46 0.41 0.36 0.36
PV 83,443 82,495 82,595 80,372 80,310 74,941 68,724 62,324 513,309
Enterprise Value 1,641,820
Less:
Net debt (cash) 40,578
Minority Interests 3,049
Equity Value 1,598,193
Fair value per share 2.18
Current share price 1.780
Upside 22.5%
Source: Oriental Capital estimates
Exhibit 15: Sensitivity reveals limited downside; Historical P/E indicates more upside potential
Share Price
(S$)
WACC
2.20 18x
Terminal Growth
2.18 12.8% 13.3% 13.8% 14.3% 14.8% 2.00 16x
0.5% 2.30 2.18 2.06 1.96 1.86 1.80
1.0% 2.37 2.24 2.12 2.01 1.91 1.60 14x
1.5% 2.45 2.31 2.18 2.06 1.96 1.40 12x
2.0% 2.53 2.38 2.25 2.12 2.01 1.20
10x
2.5% 2.63 2.46 2.32 2.19 2.07 1.00
0.80
0.60
Dec-10 Mar-11 Jun-11 Sep-11 Dec-11 Mar-12 Jun-12 Sep-12
Source: Oriental Capital estimates
Risks to Our BUY Call
Key risks to our investment thesis for OSIM are: 1. Slowdown in the Chinese
economy, 2. Corporate governance concerns arising from poor disclosure,
and 3. Weaker than expected demand for new products
Slowdown in the Chinese Economy
OSIM generates ~21% of its revenue from China. Given that OSIM’s products
are discretionary in nature, a slowdown in China can potentially heighten
earnings downside risk. However, OSIM caters largely to the luxury market
and we think these consumers’ purchasing power is unlikely to be significantly
impacted by an economic slowdown. Recent data has also indicated that the
Chinese economy has bottomed out and is once again picking up.
Corporate Governance Concerns Arising from Poor
Disclosure
OSIM’s poor financial and operating performance disclosure has raised
concerns regarding OSIM’s corporate governance. Though we concede that
there is room for improvement, it is reassuring that ~76% of Ron Sim’s wealth
stems from his direct stake in OSIM when calculated against his estimated
net worth of US$435m (Forbes, July 2012). Furthermore, Ron Sim has an
additional ~24% deemed stake in OSIM, which increases his stake in the firm.
Hence, we believe that his interests are aligned with that of the shareholders.
Weaker than expected Demand for New Products
OSIM’s strong growth trajectory has largely been driven by its strong product
offering, most notably the uDivine that was launched in 2010. Such success
also raises the bar for OSIM; we think it is essential for OSIM to continue
anticipating consumers’ preferences in order to lead its peers in product
innovation. Nonetheless, we take comfort from the fact that OSIM maintains
strong relationships with its JV partner and CTO.
11
Oriental Capital Global Investment Research9 January 2013
Disclaimer
Each research analyst primarily responsible for the content of this research report, in whole or in part,
certifies that with respect to each security or issuer that the analyst covered in this report: (1) all of the
views expressed accurately reflect his or her views about those securities or issuers; and (2) he or
she has given due credits and sources to the data, resources and information presented in this report
that have been derived from brokerage research reports and databases.
This report is published by Oriental Capital. Opinions are subject to change without notice. This
document is prepared for Oriental Capital clients. Please consult your financial advisor before
engaging in any transactions. Oriental Capital and the covering analyst accepts no liability whatsoever
for any direct or consequential loss arising from any use of this document or further communication
given in relation to this document.
12
Oriental Capital Global Investment Research9 January 2013
Appendix A: Financial Statements
Balance Sheet
S$'000 2010 2011 2012F 2013F 2014F 2015F
Current assets
Loans to associated companies - 12,800 1,170 1,204 1,279 1,371
Stocks 46,735 52,303 52,843 57,930 65,762 75,266
Trade debtors 38,003 40,974 42,472 46,561 51,427 57,311
Other debtors deposits and prepaid operating expenses 8,551 10,483 9,971 10,931 12,074 13,455
Due from subsidiaries (trade) - - - - - -
Due from subsidiaries (non-trade) - - - - - -
Due from affiliated companies (trade) 467 - 711 780 861 960
Due from affiliated companies (non-trade) 13 - 5 5 6 7
Due from associated companies (trade) - 1,016 523 573 633 705
Due from associated companies (non-trade) 1 260 236 259 286 319
Due from joint venture (trade) 1,828 - 768 842 930 1,036
Due from joint venture (non-trade) - - 52 57 63 70
Properties held-for-sale - - - - - -
Short term investment - 10,910 10,910 10,910 10,910 10,910
Fixed deposits 16,793 117,351 71,906 78,828 87,067 97,028
Cash and bank balances 56,364 76,462 202,729 262,921 330,714 408,376
Total Current Assets 168,755 322,559 394,297 471,800 562,012 666,813
Non-current assets
Fixed assets 18,635 19,872 24,647 30,837 36,885 43,036
Investment property - - 268 294 324 361
Subsidiaries - - - - - -
Associated companies and a joint venture 12,592 44,344 44,844 45,392 45,997 46,671
Intangible assets 16,648 16,543 17,029 17,561 18,149 18,804
Loan to an associated company - - - -
Long-term investment 13,428 17,459 7,479 8,199 9,056 10,092
Long-term receivables 7,480 7,941 10,134 11,109 12,270 13,674
Deferred tax assets 1,624 2,358 4,177 4,579 5,057 5,636
Total non-current assets 70,407 108,517 108,577 117,970 127,738 138,275
Total Assets 239,162 431,076 502,873 589,770 689,750 805,088
Current liabilities
Trade creditors 19,039 21,025 24,282 26,619 29,402 32,765
Other creditors and accruals 55,918 57,472 49,208 53,944 59,583 66,399
Provisions 5,682 5,860 6,609 7,246 8,003 8,918
Due to subsidiaries (trade) - - - - - -
Due to subsidiaries (non-trade) - - - - - -
Due to affiliated companies (trade) - - 3 3 3 4
Due to affiliated companies (non-trade) 79 38 60 66 73 81
Due to associated companies (trade) 19,433 22,448 17,675 19,376 21,401 23,850
Due to associated companies (non-trade) 218 292 255 280 309 345
Due to joint venture (trade) 99 - 353 387 427 476
Short-term bank loans 1,251 - 5,006 5,488 6,061 6,755
Provision for income tax 10,998 17,121 11,446 12,547 13,859 15,444
Bank loans - current portion 357 - 15,649 17,156 18,949 21,117
Obligations under finance leases - current portion 58 40 - - - -
Liability component of Convertible Bond-current portion - - - - - 117,040
Bills payable to banks (unsecured) 13,670 16,260 20,616 22,600 24,962 27,818
Bank overdrafts - - 292 320 353 394
Total Current Liabilities 126,802 140,556 151,453 166,032 183,385 321,406
Non-current liabilities
Liability component of Convertible Bond - 117,040 117,040 117,040 117,040 -
Bank loans - non-current portion - - - - - -
Obligations under finance leases - non-current portion 119 77 - - - -
Provision for pension benefits 445 513 482 529 584 651
Deferred tax liabilities 1,864 4,383 3,420 3,750 4,142 4,615
Total non-current liabilities 2,428 122,013 120,943 121,318 121,766 5,266
Total Liabilities 129,230 262,569 272,396 287,350 305,151 326,672
Equity attributable to equity holders of the Company
Share capital 72,410 63,983 63,983 63,983 63,983 63,983
Treasury shares (37,662) (14,277) (14,277) (14,277) (14,277) (14,277)
Equity component of convertible bonds – 3,773 3,773 3,773 3,773 3,773
Accumulated profits 98,018 144,810 206,663 278,606 360,785 454,602
Enterprise expansion funds 545 545 545 545 545 545
Capital reserves 4,863 5,477 5,477 5,477 5,477 5,477
Hedging reserve - - - - - -
Warrant reserve 7,699 - - - - -
Revaluation reserve 2,724 2,724 2,841 2,841 2,841 2,841
Premium on purchase of minority interests’ shares (10,171) (14,544) (14,544) (14,544) (14,544) (14,544)
Foreign currency translation reserve (30,302) (27,033) (27,033) (27,033) (27,033) (27,033)
108,124 165,458 227,428 299,371 381,550 475,367
Minority interests 1,808 3,049 3,049 3,049 3,049 3,049
Total equity 109,932 168,507 230,477 302,420 384,599 478,416
13
Oriental Capital Global Investment Research9 January 2013
Income Statement
S$'000 2010 2011 2012F 2013F 2014F 2015F
Revenue 508,738 553,740 587,149 643,666 710,941 792,277
Other operating income 15,415 13,082 13,205 14,476 15,989 17,819
Changes in inventories of finished goods (10,866) 5,568 540 5,087 7,832 9,504
Finished goods purchased (165,462) (177,533) (186,362) (202,257) (221,163) (244,001)
Employee benefits expense (79,404) (88,264) (93,589) (102,598) (113,321) (126,286)
Depreciation and amortisation expenses (11,276) (11,472) (8,797) (10,068) (11,692) (13,295)
Other operating expenses (186,732) (186,785) (198,054) (217,118) (239,811) (267,247)
Financial expenses (961) (3,108) (4,389) (4,389) (4,389) (4,389)
Financial income 197 1,238 3,280 4,648 5,783 7,070
Impairment loss on intangible assets (2,934) - - - - -
Impairment losses on quoted and unquoted equity shares - (8,896) - - - -
Reversal of impairment loss on unquoted equity shares - 930 - - - -
Share of profits/(losses) of associated companies and a joint
venture before financial expenses and impairment loss 975 (451) 500 548 605 674
Share of financial expenses of a joint venture - - - - - -
Share of impairment loss of a joint venture - - - - - -
Profit before taxation 67,690 98,049 113,483 131,994 150,774 172,126
Taxation (17,881) (28,110) (26,393) (30,698) (35,065) (40,031)
Profit for the year 49,809 69,939 87,090 101,296 115,709 132,095
Other comprehensive income:
Net gain in hedging reserve - - - - - -
Reclassification Adjustment - - - -
Revaluation reserve (2,513) - - - - -
Foreign currency translation (3,824) 3,393 - - - -
Other comprehensive income for the year, net of tax (6,337) 3,393 - - - -
Total comprehensive income for the year 43,472 73,332 87,090 101,296 115,709 132,095
80% 69% 19% 16% 14% 14%
Profit attributable to:
Equity holders of the Company 50,069 69,063 81,865 95,218 108,766 124,169
Non-controlling interests (260) 876 5,225 6,078 6,943 7,926
49,809 69,939 87,090 101,296 115,709 132,095
Total comprehensive income attributable to:
Equity holders of the Company 43,384 72,332 81,865 95,218 108,766 124,169
Non-controlling interests 88 1,000 5,225 6,078 6,943 7,926
43,472 73,332 87,090 101,296 115,709 132,095
Earnings per share (cents) 101% 38% 19% 16% 14% 14%
Basic 7 10 12 14 16 18
Diluted 7 9 11 13 15 17
Weighted Average number of Shares ('000) 13 16
For Basic 678,818 678,314 678,314 678,314 678,314 678,314
For Diluted 758,140 738,119 738,119 738,119 738,119 738,119
Key Assumptions (S$'000) 2012F 2013F 2014F 2015F 2016F 2017F 2018F 2019F 2020F
Revenue Assumptions
OSIM Revenue Growth %
China 25% 28% 28% 29% 20% 13% 9% 6% 4%
North Asia ex China 2.8% 7.0% 7.7% 7.8% 7.1% 7.3% 4.9% 3.3% 2.2%
South Asia 2.7% 8.5% 8.8% 9.3% 8.6% 8.7% 5.8% 3.8% 2.6%
America/Africa/Europe/Middle East/Oceania 0.0% 0.0% 0.0% 0.0% 0.0% 0.0% 0.0% 0.0% 0.0%
43.5%
Non-OSIM Revenue Growth %
GNC/RichLife 3.5% 3.5% 3.5% 3.5% 3.5% 1.5% 1.5% 1.5% 1.5%
TWG 50% 27% 21% 17% 15% 13% 11% 10% 9%
Net New Stores
China 2 12 12 12 12 8 5 4 2
North Asia ex China 0 3 3 3 3 2 1 1 1
South Asia 0 3 3 3 3 0 0 0 0
America/Africa/Europe/Middle East/Oceania 0 0 0 0 0 0 0 0 0
20
Capex Assumptions
OSIM China 120 720 720 720 720 480 320 213 142
OSIM (outside China) - 1,800 1,800 1,800 1,800 600 400 267 178
GNC 7,485 8,624 9,936 11,447 13,189 10,130 11,157 12,289 13,535
RichLife 968 1,115 1,284 1,480 1,705 1,309 1,442 1,589 1,750
TWG 5,000 4,000 4,000 4,000 4,000 4,000 4,000 4,000 4,000
Total Capex 13,572 16,258 17,740 19,447 21,413 16,519 17,320 18,358 19,605
14
Oriental Capital Global Investment Research9 January 2013
Cash Flow Statement
S$'000 2010 2011 2012F 2013F 2014F 2015F
Cash flows from operating activities
Profit before taxation 67,690 98,049 113,483 131,994 150,774 172,126
Adjustments for:
Share of losses of associated companies and a joint venture (975) 451 (500) (548) (605) (674)
Depreciation of fixed assets 10,047 10,958 8,797 10,068 11,692 13,295
Gain on disposal of unquoted equity shares - (7) - - - -
Depreciation of investment property - - - - - -
Loss on disposal of fixed assets (4,962) 187 - - - -
Gain on disposal of properties held-for-sale (78) - - - - -
Fair value gain on short term investments - (82) - - - -
Loss on disposal of a business operation - - - - - -
Loss on disposal of a subsidiary - - - - - -
Loss on liquidation of an associated company - - - - - -
Intangible assets written off - - - - - -
Amortisation of intangible assets 1,229 514 - - - -
Impairment loss on intangible assets 2,934 - - - - -
Impairment loss on fixed assets - - - - - -
Impairment losses on quoted and unquoted equity shares - 8,896 - - - -
Reversal of impairment loss on unquoted equity shares - (930) - - - -
Losses on deemed changes in shareholdings in a subsidiary and a joint venture - - - - - -
Share-based compensation expense - - - - - -
Write-off of fixed assets 2,122 282 - - - -
Write-off of intangible assets 192 23 - - - -
Financial income (197) (1,238) (3,280) (4,648) (5,783) (7,070)
Financial expenses 961 3,108 4,389 4,389 4,389 4,389
Provision 1,934 1,526 749 636 757 916
Operating profit before working capital changes 80,897 121,737 123,639 141,892 161,224 182,982
(Increase)/decrease in:
Stocks 10,866 (5,568) (540) (5,087) (7,832) (9,504)
Trade debtors (5,433) (2,971) (3,691) (5,064) (6,028) (7,287)
Other debtors, deposits and prepaid operating expenses (697) (3,878) 512 (960) (1,143) (1,381)
Due from affiliated companies (trade) 623 467 (711) (68) (82) (99)
Due from affiliated companies (non-trade) (9) 13 (5) (0) (1) (1)
Due from associated companies (trade) - (1,016) 493 (50) (60) (72)
Due from associated companies (non-trade) 31 (259) 24 (23) (27) (33)
Due from joint venture (trade) (1,422) 1,828 (768) (74) (88) (106)
Due from joint venture (non-trade) - - (52) (5) (6) (7)
(Decrease)/increase in:
Trade creditors (2,172) 1,986 3,257 2,337 2,782 3,364
Other creditors and accruals 20,251 (1,554) (8,264) 4,737 5,638 6,817
Due to affiliated companies (trade) - - 3 0 0 0
Due to affiliated companies (non-trade) (35) (41) 22 6 7 8
Due to associated companies (trade) 3,088 3,015 (4,773) 1,701 2,025 2,448
Due to associated companies (non-trade) (88) 74 (37) 25 29 35
Due to joint venture (trade) (124) (99) 353 34 40 49
Provision for pension benefits - - (31) 46 55 67
Bills payable to banks 4,897 2,590 4,647 2,012 2,396 2,896
Cash flows generated from operations 110,673 116,324 114,077 141,459 158,932 180,176
Income tax paid, net of refund (16,170) (17,089) (34,849) (29,669) (33,841) (38,551)
Net cash flows generated from operating activities 94,503 99,235 79,228 111,791 125,092 141,625
Cash flows from investing activities
Purchase of fixed assets (11,842) (12,193) (13,840) (16,284) (17,771) (19,484)
Proceeds from disposal of fixed assets 6,039 51 - - - -
Proceeds from disposal of a business operation - - - - - -
Proceeds from liquidation of an associated company - - - - - -
Proceeds from disposal of properties held-for-sale 3,368 - - - - -
Interest received 197 1,015 3,280 4,648 5,783 7,070
Dividend received from an associated company - - - - - -
Purchase of shares in subsidiaries - - - - - -
Acquisition of additional interests in subsidiaries - - - - - -
Increase in investment in an associated company - - - - - -
Increase in investment by a minority shareholder - - - - - -
Acquisition of intangible assets (552) (449) (486) (532) (588) (655)
Loan to an associated company - (12,800) (34) (75) (92)
Repayment of loan from an associated company 176 - 11,630
Acquisition of an associated company (408) (31,360) - - - -
Purchase of unquoted debt securities (12,498) - - - - -
Purchase of unquoted investment - - - (720) (857) (1,036)
Purchase of quoted equity shares and debt securitites - (23,755) - - - -
Proceed from disposal of unquoted equity shares - 937 9,980 - - -
Net cash flows used in investing activities (15,520) (78,554) 10,565 (12,923) (13,507) (14,197)
Cash flows from financing activities
Acquisition of non-controlling interests (1,856) (2,386) - - - -
Capital contribution from a non-controlling interest - 1,538 - - - -
Receipts from new bank loans - 12,800 20,655 1,988 2,367 2,861
Repayment of bank loans (24,890) (14,382) (4,389) (4,389) (4,389) (4,389)
Repayment of finance lease obligations (90) (57) - - - -
Retirement of Covertible Bonds - - - -
Purchase of treasury shares (41,608) (26,511) - - - -
Proceeds from issuance of ordinary shares - - - - - -
Proceeds from issuance of warrants - - - - - -
Proceeds from issuance of rights shares - - - - - -
Proceeds from issuance of convertible bonds (net) - 118,300 - - - -
Proceeds from exercise of warrants 17,745 30,277 - - - -
Proceeds from exercise of employees’ share options 779 464 - - - -
Dividends paid on ordinary shares (13,261) (21,913) (25,237) (29,353) (33,530) (38,278)
Interest paid (967) (594) - - - -
Net cash flows used in financing activities (64,148) 97,536 (8,971) (31,754) (35,552) (39,806)
Net Increase/Decrease in cash and cash equivalents 14,835 118,217 80,822 67,113 76,032 87,622
Net effect of exchange rates changes (4,912) 2,439 - - - -
Cash and cash equivalents at beginning of year 63,234 73,157 193,813 274,635 341,748 417,781
Cash and cash equivalents at end of year (Note 22) 73,157 193,813 274,635 341,748 417,781 505,403
15
Oriental Capital Global Investment Research9 January 2013
Appendix B: Method for Calculation of China’s
Market Size and OSIM’s Share of Market
Overview of Methodology
To better understand the size of China’s market potential and assess the headroom for growth of
OSIM in China, we embark on a three stage process to derive three key outcomes: (a) China’s market
potential, (b) OSIM’s share of the pie and (c) potential headroom for growth.
The three stage process is outlined as follows:
1) Estimating the size/ annual spend of China’s massage chair market by 2015E (based on key 8
cities by GDP)
2) OSIM’s current share of potential pie
3) Competitor’s current share of potential pie
Key Formulae:
Untapped market (2015E) = Total potential market spend (2015E) – OSIM’s share of pie (2012) –
Competitors share of pie (2012)
Step 1: Estimating the size/ annual spend of China’s massage chair market
In deriving a city breakdown of annual spend on massage chairs for China, we rely on a key formulae:
Size of City Spend (2015E) = CP x WHH x AHHS
CP: City Penetration (Derived from ~GDP per capita by 2015E) x China’s Working Population
Households
WHH: Working Household/ China’s Working Population Households
AHHS: Annual Household Spend (if within population who can afford massage chairs – based on
proxy from Hong Kong)
Variable 1: CP (City Penetration)
Referring to the breakdown of GDP per capita according to cities by China Statistical Yearly, we relied
on IMF China’s GDP growth rate forecast of 8.2% (2013E), 8.5% (2014E), and 8.5% (2015E) and
conservatively adopted an ~8% growth rate across different cities. Looking at the 2015E snapshot
GDP per capita of the 8 key cities we match these levels with peer countries on the later stage
massage chair market cycle and approximate the relevant penetration rates by 2015E.
Country US$ RMB Penetration Rates
Malaysia 10,085 62,8309 January 2013
Ns: Number of OSIM stores within the City (based on Dianping.com)
ARPS: Average revenue per store (derived based two separate methods)
Variable 1: Ns (Number of OSIM stores within the City)
Dianping.com is one of the most popular sites for review of retail, F&B and consumer related goods.
Using reviews provide us with the number of OSIM stores in each city coupled with their location and
even how the store front looks like. Relying on this informal method has provided us with greater view
into OSIM’s store count in each city for the 8 key cities.
Variable 2: ARPS (Average revenue per store)
Though management has no disclosure on OSIM’s ARPS in China specifically, they have given
indication that current sales per store remain low as compared to the other markets. We have sought
to derive ARPS via two different methodologies.
Method 1
Understanding from Hejun Consulting Group that OSIM China’s revenue is ~250 mil RMB, we
approximate OSIM sales in China to have hit ~339 mil RMB by 2012. This is derived from a growth in
massage chair quantity 10.5% (2011) and 12.9% (2012). , coupled with a growth in inflation at rates of
an average 4.21% (based on IMF for past two years). These growth rates in quantity and inflation give
us an ARPS of ~S$250,000 in 2012.
Method 2
Furthermore, we took an average of A class stores and B class stores of RMB 170m and RM 90m
respectively. This gives an average of ~S$260,000 per store which is in line with method 1.
We have employed the statistic in method 1 for conservatism purposes.
Step 3: Competitor’s current share of pie
Management has projected that current market share in China remains low (20 to 30%). Based on
Hejun Consulting Group, we derive OSIM’s market share of 14.5% that is approximated to hold
constant in 2012. Competitors occupy the rest of the current pie.
Conclusion
The total Chinese market/ annual spend by 2015E for the key 8 cities will avail S$894m. With OSIM
maintaining share of pie, this will constitute a high level of growth for OSIM China.
17
Oriental Capital Global Investment Research9 January 2013
Appendix C: Company Specifics
SWOT – OSIM’s Internal & External Operating Environment
Porter’s 5 Forces Analysis – OSIM, GNC, Richlife, TWG
18
Oriental Capital Global Investment Research9 January 2013
Appendix D: OSIM’s Strategic Store Locations
Beijing’s OSIM stores locality
Most OSIM stores in Beijing are located in the around the CBD and along the ring roads which are the
traditional urban or suburban markets with established demand.
19
Oriental Capital Global Investment Research9 January 2013
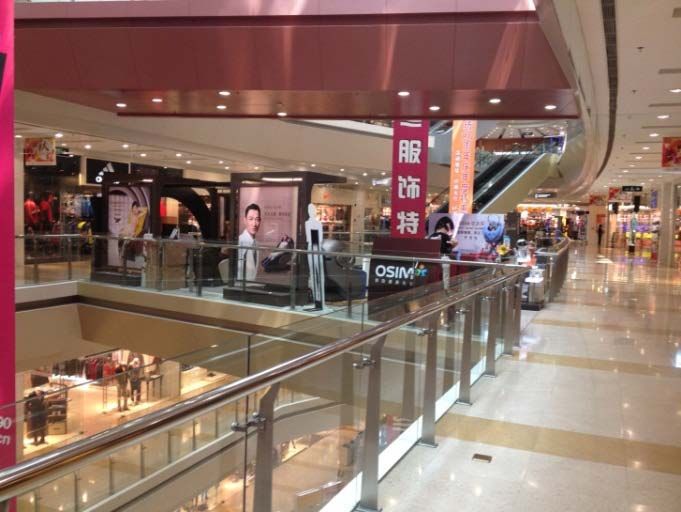
Shanghai’s OSIM stores locality
OSIM has large amount of stores in the Puxi area where most locals reside with a small cluster at Wu
Jiao Chang area (along metro line 10), a prominent suburban market with 4 large retail developments
and an upcoming office cluster with hospitality development slated in 2014.
Strong store position within malls (based on primary due diligence)
Based on our store visits in Shanghai, we note that OSIM places its outlets in areas of high footfalls
surrounded by lifestyle brands. There are few massage chair competitors in the vicinity and Andy Lau
is featured prominently as the celebrity endorsement figure for OSIM appealing to the Chinese market.
Appendix E: China Health and Wellness
Equipment Projections
According to Frost and Sullivan, China health and wellness equipment market is expected to grow
strongly in line with the growth in luxury market. By 2015E, the market would have had RMB
28.7billion in annual spend.
20
Oriental Capital Global Investment Research9 January 2013
Appendix F: OSIM’s Product Pyramid and
Timeline
2003
iSymphonic
2003 2004
iTwin iDesire
2006 2007 2007
uPilot uSqueez uPapa
2008 2009 2009 2009 2010
uCrown uDesire uKimono uSqueez Warm uMama Warm
2010 2011 2011 2011 2011 2012
uSoffa Petit uDivine Sport uPhoria uCrown Pro uPapa Music Sync uSoffa Runway
Relax + Relieve
Massage Chairs Massage Sofas Leg Massagers Upper body Massagers Head Massagers
Date Product Date Product Date Product Date Product Date Product
Feb-02 iMedic Jan-10 uSoffa Petit Feb-03 iTwin Dec-06 uZap Papa Aug-08 uCrown
Apr-03 iSymphonic Jun-10 uSoffa Dec-03 iSense Feb-07 uPapa May-11 uCrown Pro
Apr-04 iSymphonic AV Feb-12 uSoffa Runway Feb-05 iSqueeze Jun-09 uPapa Hug
Aug-04 NORO range Sep-07 uSqueez Apr-10 uMama Warm
Nov-04 iDesire Feb-09 uSqueez Warm Jul-11 uPapa Music Sync
Mar-06 iDesire ROBO Nov-11 uPhoria
Sep-06 iMedic Pro
Dec-06 uPilot
Dec-07 uSpace
Feb-08 uYoyo
Jul-08 uMedic
Apr-09 uDream
Jul-09 uDesire
Nov-10 uDivine
Aug-11 uDivine Sport
Sep-12 uDivine App
Tone + Shape
Slim Belts Pulse Massagers
Date Product Date Product
Oct-05 uZap Mar-05 iCheck 500
Dec-06 uZap Mini Mar-05 iTango
Oct-09 uKimono
Source: Company data
21
Oriental Capital Global Investment Research9 January 2013
Appendix G: China’s GDP per Capita (By Region)
GDP per Capita (RMB) 2011 2012 2013 2014 2015
Beijing 94,236 101,775 109,917 118,710 128,207
Tianjin 97,670 105,484 113,923 123,036 132,879
Hebei 39,630 42,801 46,225 49,923 53,917
Shanxi 36,607 39,535 42,698 46,114 49,803
Inner Mongolia 67,726 73,144 78,995 85,315 92,140
Liaoning 59,355 64,103 69,232 74,770 80,752
Jilin 47,519 51,321 55,426 59,860 64,649
Heilongjiang 38,410 41,483 44,802 48,386 52,257
Shanghai 95,710 103,367 111,637 120,568 130,213
Jiangsu 72,772 78,594 84,881 91,672 99,006
Zhejiang 69,244 74,783 80,766 87,227 94,205
Anhui 30,008 32,408 35,001 37,801 40,825
Fujian 56,423 60,937 65,812 71,076 76,763
Jiangxi 30,517 32,959 35,596 38,443 41,519
Shandong 55,094 59,501 64,261 69,402 74,954
Henan 33,576 36,263 39,164 42,297 45,680
Hubei 40,999 44,279 47,821 51,647 55,778
Hunan 34,905 37,698 40,714 43,971 47,488
Guangdong 59,287 64,030 69,153 74,685 80,660
Guangxi 29,534 31,897 34,448 37,204 40,181
Hainan 33,653 36,346 39,253 42,394 45,785
Chongqing 40,143 43,355 46,823 50,569 54,615
Sichuan 30,572 33,018 35,659 38,512 41,593
Guizhou 19,240 20,779 22,441 24,236 26,175
Yunnan 22,478 24,276 26,218 28,316 30,581
Tibet 23,382 25,253 27,273 29,455 31,811
Shaanxi 39,130 42,261 45,642 49,293 53,236
Gansu 22,916 24,749 26,729 28,867 31,177
Qinghai 34,414 37,167 40,140 43,351 46,819
Ningxia 38,481 41,559 44,884 48,475 52,353
Xinjiang 35,028 37,830 40,856 44,125 47,655
Source: China Statistical Yearly, Oriental Capital Estimates (based on 8% GDP growth rates)
22
Oriental Capital Global Investment Research9 January 2013
Appendix H: Asia Pacific Geographical
Consumer Health Growth
Appendix I: Measurement of Asia Pacific
Markets Healthcare Performance
23
Oriental Capital Global Investment Research9 January 2013
Appendix J: Spread of Luxury Brands Presence
in China
City Brands Classification City Brands Classification
Beijing 62 Emperor's city Hefei 2 Nascent
Shanghai 55 Emperor's city Hohhot 2 Nascent
Hangzhou 27 Rising bishops Tangshan 1 Nascent
Chengdu 21 Rising bishops Nanchang 1 Nascent
Shenzhen 19 Rising bishops Taizhou 1 Nascent
Shenyang 18 Rising bishops Shaoxing 1 Nascent
Harbin 16 Rising bishops Jinhua 1 Nascent
Guangzhou 13 Rising bishops Xuzhou 1 Nascent
Tianjin 13 Rising bishops Lanzhou 1 Nascent
Suzhou 13 Rising bishops Zhenjiang 1 Nascent
Nanjing 12 Rising bishops Handan 1 Nascent
Dalian 12 Rising bishops Haikou 1 Nascent
Qingdao 11 Rising bishops Huzhou 1 Nascent
Kunming 11 Rising bishops Foshan 0 Nascent
Wenzhou 11 Rising bishops Yantai 0 Nascent
Xi'an 10 Exploratory markets Dongguan 0 Nascent
Wuhan 9 Exploratory markets Nantong 0 Nascent
Changsha 8 Exploratory markets Zibo 0 Nascent
Ningbo 8 Exploratory markets Weifang 0 Nascent
Fuzhou 8 Exploratory markets Linyi 0 Nascent
Xiamen 8 Exploratory markets Jining 0 Nascent
Zhengzhou 7 Exploratory markets Jiaxing 0 Nascent
Wuxi 7 Exploratory markets Baotou 0 Nascent
Changchun 7 Exploratory markets Baoding 0 Nascent
Taiyuan 7 Exploratory markets Weihai 0 Nascent
Chongqing 6 Exploratory markets Zhongshan 0 Nascent
Nanning 6 Exploratory markets Luoyang 0 Nascent
Urmqi 6 Exploratory markets Daqing 0 Nascent
Jinnan 5 Exploratory markets Nanyang 0 Nascent
Shijiazhuang 5 Exploratory markets Yangzhou 0 Nascent
Guiyang 5 Exploratory markets Yancheng 0 Nascent
Changzhou 4 Exploratory markets Shantou 0 Nascent
Source: JLL REIS
24
Oriental Capital Global Investment Research9 January 2013
Appendix K: Growth in Households with
Income >US$25k
Number of HHs in key markets with nominal income >US$25k (millions)
25
Oriental Capital Global Investment ResearchAppendix L: OSIM’s Rise to Price Point Leadership
OSIM Panasonic OTO Ogawa
Products SGD Panasonic SGD OTO SGD Ogawa SGD
iSymphonic AV $6,250 EP3513KU $7,155 OTO Cyber Lounge $3,280 Smart 10 $2,650
iDesire $7,800 EP30005 $6,780 Master Relax MR-1390 $1,180 Smart 2000 $1,760
iDesire ROBO $6,888 EP1273 $3,766 OTO CYBER Plus CP-2500 $4,380 Ogawa Fujiiryoki SKS 1800 $9,211
iMedic Pro $3,888 EP3222 $5,517 OTO CYBER-Pro CX190 $3,680 Sensual Massage Chair $6,362
uPilot $7,800 EP1080K/L $2,471 Master Relax MR-1398 $1,680 Smart Aire 2D Plus $6,988
Across Time
uSpace $6,000 EP1082KL-TL $3,926 Cyber Indulge Massage Chair $3,280 Smart Ace Massage Chair $4,888
uYoyo $5,688 EP1285KL/TL $3,926 OTO Master Sense $2,480 Smart Mate $4,063
uMedic $3,888 EP30007 $8,180 OTO Adelle One AD-01 $2,980 Smart Aire 3D Plus $7,398
uDream $9,588 EP-MS10 $2,045 Cyber Wave CW-2800 $5,380 Smart Sense Trinity 3D $6,575
uDesire $3,888 EP-MS40 $3,409 Cyber-Pro CX-290 $2,980 Smart DeLight Quadro Tech $5,988
uDivine $5,488 EP-MA10 $4,720 Ogawa Smart Space XD Tech $2,017
uDivine Sport $7,399 EP-MA70 $9,990
uDivine App $6,088 EP-MS41 $2,299
Oriental Capital Global Investment ResearchAppendix M: OSIM Comparables Table
Market PER Est PER Est PER Est. Est. Net
Cap (x) Curr Yr Nxt Yr PBR EV/EBIT Margin ROE
Company Curr Price (US$'m) (x) (x) (x) DA (%) (%)
Anta Sports Products HKD 7.55 2,429.20 9.6 11 14.2 2.3 6.3 17.8 24.7
Belle Int'l HKD 18.06 19,649.70 27.3 25.8 22 5.8 17.6 14.1 23.2
Chow Sang Sang HKD 21.05 1,838.20 13.7 14.1 11.1 2.2 11.3 5.4 16.9
Chow Tai Fook Jewellery HKD 13.22 17,053.90 19.3 22 17.6 4.6 15.5 9.5 31.5
Daphe Int'l HKD 11.16 2,372.90 18.8 19.4 15.9 4.2 10.6 9.6 24.6
Emperor Watch & Jewellery HKD 1.03 892.7 11.7 13.9 11.2 1.7 10.3 7.6 15.7
FJ Benjamin SGD 0.315 146.7 14.4 12.1 11.7 1.3 9.2 3.5 9.1
Giordano HKD 7.61 1,515.00 15.8 16.7 14.6 4.2 10.5 12.4 27.3
Hengdeli Holdings HKD 2.96 1,677.20 11.3 13.5 12.1 2 9.1 6.6 19.1
Hour Glass SGD 1.69 325.3 7.2 N.A. N.A. 1.3 N.A. N.A. 19.8
Li Ning HKD 5.71 777.8 35.4 N.A. 45 1.3 34.7 -3.6 3.8
Lifestyle Int'l HKD 20.05 4,306.30 16.9 17.8 16.1 3.8 13 33.6 23.9
L'occitance Int'l HKD 24.6 4,687.00 28.2 25.9 21.7 5.5 15 12.5 20.7
Luk Fook Holdings Int'l HKD 27.4 2,082.30 13.4 13 10.8 2.9 9.2 9.2 29.6
Ogawa World Bhd MYR 0.35 13.8 69.7 N.A. N.A. 0.7 N.A. N.A. 0.6
Oriental Watch HKD 2.97 218.6 11.1 9.3 8.6 0.8 7.6 5.1 8.3
OTO Holdings HKD 0.53 21.9 8.8 13.3 17.7 0.6 N.A. 4.6 7.7
Parkson Retail HKD 6.74 2,443.60 14.4 16 14.5 2.8 9.2 19.7 20.6
Ports Design HKD 7.42 530.4 9.2 9.6 8.4 1.8 5.3 17.1 20.8
Prada HKD 75.2 24,822.80 43.4 30.5 24.1 10.4 17.7 18.5 28.5
Sa Sa Int'l HKD 6.52 2,377.60 24.5 22.3 18.5 11.4 15.4 10.7 51.1
Samsonite Int'l HKD 15.9 2,886.20 18.3 17.1 14.3 2.9 9.6 9.4 16.3
Trinity Limited HKD 5.3 1,178.50 16.8 16.1 14.4 2.8 11.8 18.6 16.9
Source: Bloomberg, Oriental Capital Estimates
Appendix N: Risks Assessment Matrix
Impact
• Weaker than
expected demand
for products
Major
• Corporate
governance issue
arising from poor
disclosure
• Lack luster • Misunderstanding
performance of customer
Moderate advertising demographics in
campaigns markets
• US Fiscal Cliff
• Higher than • Slowdown in the
expected Chinese economy
inflationary
Minor pressures
Probability
Low Medium High
Oriental Capital Global Investment ResearchYou can also read