INVESTOR PRESENTATION - FIRST QUARTER 2020 - Amazon S3

Page created by Duane Kim
 
CONTINUE READING
INVESTOR PRESENTATION - FIRST QUARTER 2020 - Amazon S3
INVESTOR
PRESENTATION
FIRST QUARTER 2020
INVESTOR PRESENTATION - FIRST QUARTER 2020 - Amazon S3
DISCLAIMER
This material is being furnished to you solely for your information on a confidential       whatsoever (in negligence or otherwise) for any loss howsoever arising from any use
basis and may not be reproduced, redistributed or passed on, in whole or in part, to        of this material or otherwise arising in connection with this material. This document
any other person. The information contained in this material is subject to changes          is for information purposes only and is neither an advertisement nor a prospectus.
without notice and past performance is not indicative of future results.
                                                                                            In the United Kingdom this material is only being distributed to, and is only directed
This presentation may contain certain “forward-looking statements” relating to GB           at (a) investment professionals falling within Article 19(5) of the Financial Services
Auto S.A.E. (the “Company”). These may be identified in part through the use of             and Markets Act 2000 (Financial Promotion) Order 2005 (as amended) (the
forward-looking terminology such as “will,” “planned,” “expectations” and                   “Financial Promotion Order”) and (b) high net worth companies and other persons
“forecast” as well as similar explanations or qualifiers and by discussions of strategy,    falling within Article 49(2)(a) to (d) of the Financial Promotion Order (all such
plans or intentions. These statements may include descriptions of investments               persons together being referred to as “relevant persons”). Any person in the United
planned or currently under consideration or development by the Company and the              Kingdom that is not a relevant person must not act or rely on this material. Any
anticipated impact of these investments. Any such statements reflect the current            investment or investment activity to which this material relates is available in the
views of the Company with respect to future events and are subject to certain risks,        United Kingdom only to relevant persons, and will be engaged in only with such
uncertainties and assumptions. Many factors could cause the actual results,                 persons.
performance, decisions or achievements of the Company to be materially different
from any future results that may be expressed or implied by such forward-looking            Neither this document nor any copy thereof may be taken or transmitted or
statements. Such forward-looking statements speak only as of the date on which              distributed, directly or indirectly, into the United States or to a U.S. Person (as
they are made. The Company does not undertake any obligation to update or revise            defined in Rule 902 of Regulation S under the U.S. Securities Act of 1933, as
any forward-looking statement, whether as a result of new information, future               amended (the “Securities Act”)), other than to qualified institutional buyers as
events or otherwise.                                                                        defined in Rule 144A under the Securities Act. The distribution of this document in
                                                                                            other jurisdictions may be restricted by law and persons into whose possession this
This material is presented solely for information purposes and is not to be construed       document comes should inform themselves about, and observe, any such
as a solicitation, inducement or an offer to buy, subscribe for or sell any securities or   restriction. Any failure to comply with these restrictions may constitute a violation
related financial instruments and should not be treated as giving investment, legal,        of the laws of any such other jurisdiction.
accounting, regulatory, taxation, or other advice. It has no regard to the specific
investment objectives, financial situation or particular needs of any recipient. No         By attending this presentation, you are agreeing to be bound by the foregoing
representation or warranty, either express or implied, is provided in relation to the       limitations. Any failure to comply with these restrictions may constitute a violation
accuracy, completeness or reliability of the information contained herein. None of          of applicable securities laws.
the Company, its affiliates, advisers or representatives shall have any liability

                                                                                                                                                                                     2
INVESTOR PRESENTATION - FIRST QUARTER 2020 - Amazon S3
OUTLINE

04   GB Auto Overview

10   GB Auto & Auto Related

23 GB Capital

26 Consolidated Financial Performance

29 Key Corporate and Shareholder Information
INVESTOR PRESENTATION - FIRST QUARTER 2020 - Amazon S3
I. GROUP OVERVIEW
INVESTOR PRESENTATION - FIRST QUARTER 2020 - Amazon S3
GB Auto Group is a leading automotive player and non-bank financial services provider in Egypt with the
Group’s operations split into core automotive (GB Auto & Auto Related) and high-margin financing
businesses (GB Capital).

                                                             GB AUTO

                                                                             GB CAPITAL
        GB AUTO & AUTO RELATED
                                                                        (FINANCING BUSINESS)

                                   Egypt Motorcycles &
   Egypt Passenger Cars                                                GB Lease           Mashroey
                                     Three Wheelers

     Egypt Commercial
                                                                                        Haram Tourism
   Vehicles & Construction              Egypt Tires                     Drive
                                                                                        Transport (HTT)
         Equipment

     Egypt After-Sales                   Regional                      Tasaheel

                INVESTOR PRESENTATION | FIRST QUARTER 2020                                                5
INVESTOR PRESENTATION - FIRST QUARTER 2020 - Amazon S3
GB Auto is comprised of diverse operations that span the value chain from manufacturing and
assembly to sales, after-sales, and trading.*
                                                 Egypt Motorcycles & Three
        Egypt Passenger Cars                                                                            Egypt CV&CE                                       Egypt Tires              Egypt After-Sales                        Regional
                                                        Wheelers

   Assembly:                                    Assembly:                                    Assembly:                                     Sales & Distribution:              Sales & Distribution:              Sales & Distribution:
   • Passenger car CKD and                      • Motorcycles and three-                     • Trucks                                      • Passenger car, van, truck,       • After-sales services and         • Imported CBU passenger
      imported CKD kits                           Wheelers CKD assembly                      Manufacturing:                                  construction equipment,            distribution of spare parts        car units in Iraq (Hyundai)
   Sales & Distribution:                        Manufacturing                                • Bus bodies                                    and bus tires                      for passenger cars,                with after sales service
   • Imported CKD kits with a                   • Motorcycles and three-                     • Trailers/superstructures                                                         motorcycles and three-           • Bajaj motorcycles and
     production capacity of                        wheelers components at                    Sales & Distribution:                                                              wheelers, and commercial           three-wheelers in Iraq
     c.80,000 units per year                       the Badr Facility                         • Trucks                                                                           vehicles                           with after sales services
   • CBU vehicles                               Sales & Distribution:                        • Buses                                                                          • Largest cross-country
                                                • Motorcycles and three-                     • Trailers/superstructures                                                         network of its kind, with
                                                  wheelers                                   • Construction/farming                                                             continual expansion
                                                                                               equipment

   1Q20 Gross Profit Margin 11.0%                  1Q20 Gross Profit Margin 18.1%               1Q20 Gross Profit Margin 7.4%                1Q20 Gross Profit Margin 24.3%     1Q20 Gross Profit Margin 18.2%   1Q20 Gross Profit Margin 10.1%

                28.0%                                         11.2%                                         4.5%                                            4.0%                          5.0%                              25.4%

       1Q20 Group Revenue                            1Q20 Group Revenue                           1Q20 Group Revenue                           1Q20 Group Revenue                1Q20 Group Revenue                 1Q20 Group Revenue
          Contribution                                  Contribution                                 Contribution                                 Contribution                      Contribution                       Contribution
          5-Year CAGR 3.5%                             5-Year CAGR 9.3%                             5-Year CAGR 1.3%                             5-Year CAGR 21.2%                5-Year CAGR 12.8%                  5-Year CAGR 46.3%

                16.5%                                         10.9%                                         1.8%                                            5.3%                          4.8%                              13.8%

     1Q20 Group Gross Profit                       1Q20 Group Gross Profit                      1Q20 Group Gross Profit                      1Q20 Group Gross Profit           1Q20 Group Gross Profit             1Q20 Group Gross Profit
          Contribution                                  Contribution                                 Contribution                                 Contribution                      Contribution                        Contribution
*GB Auto has one secondary line of business, Others, which consists of lubricants, pre-owned passenger cars, pre-owned commercial vehicles, and retail.

                              INVESTOR PRESENTATION | FIRST QUARTER 2020                                                                                                                                                                  6
INVESTOR PRESENTATION - FIRST QUARTER 2020 - Amazon S3
GB Capital is a leading non-bank financial services provider in Egypt and targets further
growth through expanding its existing businesses and adding new services.

       1Q20 Group Revenue                                                                                                                                                                      1Q20 Group Gross Profit
       Contribution                                      19.4%                                                                                                         45.2%                             Contribution

       5-year CAGR: 26.9%                                                                                                                                                                 Gross Profit Margin: 35.6%

                                                                                                     Consumer Finance and
                                             Leasing                                                                                                                             Microfinance
                                                                                                          Factoring

  •     Established in 2008, GB Lease              •   Car rental company HTT joined GB          •   Drive provides factoring services to a   •   Established March 2010 and offers        •    Launched in August 2015, Tasaheel is
        provides business-to-business lease            Capital in late 2012, operating on a          diversified client base, ranging from        asset-based microfinance lending to           a microfinance company focused on
        finance solutions. It is non-exclusive         quasi-operational lease basis.                business-to-business (SMEs) to               eligible clients in the low-income            direct lending to microfinance eligible
        to GB Auto and caters to a diversified     •   It is Egypt’s premier vehicle fleet-          business-to-consumer (retail), with a        segment.                                      clients, predominately group lending
        client base, ranging from                      leasing company, serving a select             focus on the auto finance sector.        •   The company has an extensive                  to women.
        multinationals, local corporates, and          range of top-tier industrial, services    •   Operating under a robust credit              product base, extending credit to        •    It aims at helping low-income earners
        SMEs.                                          private sector companies,                     policy, it maintains a well-developed        finance the purchase of three-                generate higher incomes and improve
  •     Focuses on risk diversification by             multinationals, and financial                 portfolio, offers medium-term tenors,        wheelers, motorcycles, YTO tractors           their living standards; and in doing so,
        asset class, industry and clients; asset       institutions.                                 and focuses on risk diversification by       and minivans (all GB Auto products),          it also supports overall community
        base covers all asset classes, including   •   Average tenor of the portfolio is three       product type, client base, and brands        tricycles (non-GB Auto), and pre-             development and economic growth.
        real estate, automotive and                    years.                                        (where auto loans are concerned).            owned three-wheelers.                    •    It operates a nationwide network of
        production lines. Portfolio tenor is       •   Company’s service agreements entail       •   Operates out of 3 permanent              •   Credit policy is stringent; portfolio         188+ branches.
        mostly medium term.                            vehicle acquisition, registration,            locations, 2 in Cairo and 1 in               tenor is predominantly short term.
  •     Implements prudent risk-                       maintenance, and insurance that               Alexandria, and via GB Auto’s            •   It operates a nationwide network of
        management practices for provisions            extends to third-party damage and             showrooms and dealer network                 137+ branches and units.
        and risk recognition.                          passengers.                                   across Egypt.
                                                                                                 •   Operations are non-exclusive to GB
                                                                                                     Auto.

           LE 135.0 million*                             LE 22.9 million*                              LE 498.3 million*                            LE 382.6 million*                            LE 372.8 million*
               1Q20
*After intercompany     Revenue
                    eliminations.                              1Q20 Revenue                                 1Q20 Revenue                                  1Q20 Revenue                                  1Q20 Revenue
      *Before intercompany eliminations.

                               INVESTOR PRESENTATION | FIRST QUARTER 2020                                                                                                                                                       7
INVESTOR PRESENTATION - FIRST QUARTER 2020 - Amazon S3
The Group has an established regional footprint with a strong portfolio of top global brands.

                               EGYPT

Passenger Cars

Commercial Vehicles &
Construction Equipment

Motorcycles &
Three-Wheelers

Tires

Others

                            GB CAPITAL

                                IRAQ

 Passenger
 Cars

 Motorcycles &
 Three-Wheelers

                  INVESTOR PRESENTATION | FIRST QUARTER 2020                               8
INVESTOR PRESENTATION - FIRST QUARTER 2020 - Amazon S3
Both businesses have shown consistent growth in operational performance and profitability.

                                                      Progression of Key Indicators (all figures in LE million)

Revenues                                                                               Net Debt
                                        4,948.2                                                                                                            6,842.3
                                                                  4,744.1
         4,012.2                                                                                                                            5,236.5                                    5,389.0         5,258.8
                                                                                                                 4,794.7
                                                                                             3,933.9

                                                  1,140.9                    1,417.3
                       1,017.3

                  1Q18                       1Q19                         1Q20                           1Q18                                        1Q19                                        1Q20

                            GB Auto & Auto Related          GB Capital*                                                 GB Auto & Auto Related                              GB Capital*
 *Before elimination                                                                   * GB Capital’s debt figure represents total debt as net debt is not an appropriate indicator for the financing business

EBITDA                                                                                 EBIT
                                                                                                                                                                                                 245.3
                                                                          327.1
                                             275.2                                                                                                   177.4
                  250.6
                                                                                                         119.7

                  1Q18                       1Q19                         1Q20                           1Q18                                        1Q19                                        1Q20

                                     GB Auto & Auto Related                                                                                       GB Capital

                          INVESTOR PRESENTATION | FIRST QUARTER 2020                                                                                                                                             9
INVESTOR PRESENTATION - FIRST QUARTER 2020 - Amazon S3
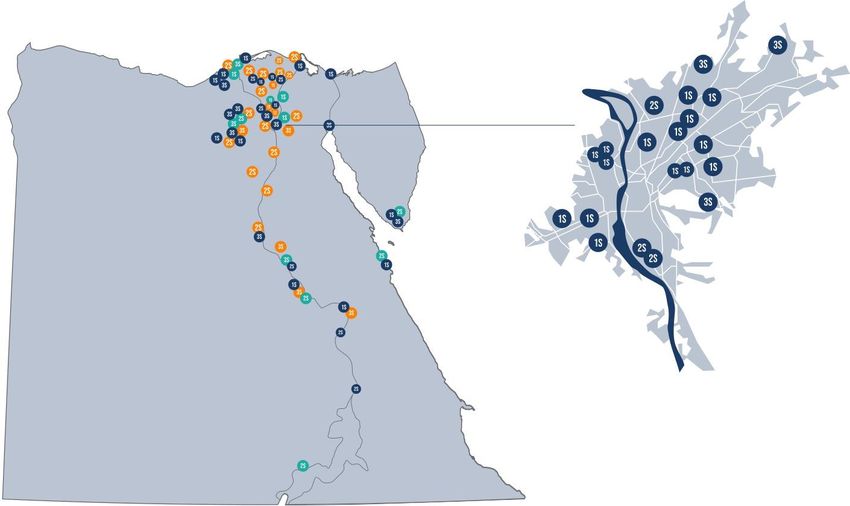
II. GB AUTO & AUTO
   RELATED
Egypt Passenger Cars

The passenger car segment continued its recovery path from 2019 and was up by 58.0% y-o-y
in 1Q20, with the impact of Covid-19 coming towards the end of the quarter.

 The Egyptian passenger car market is showing signs of strong recovery after                                                                    Management has focused CKD assembly on models
 significant turbulence                                                                                                                         in the largest market segment
 PC Market, Annual Sales                                                                                                                        PC Market Segmentation, 1Q20

                                                                                                                                                                                                                 ◼ 1.6L            23.9%
   FY10        FY11       FY12       FY13       FY14       FY15       FY16       FY17      FY18        FY19 1Q19 1Q20

 Management anticipates substantial future growth on the back of relatively low penetration rates per 1,000 people, as shown here:

               COUNTRY                                                                                                                                                                                            GDP PER CAPITA (USD)**
                 Libya                                                                                                       290                                                                                          7,235
                Jordan                                                                                                       165                                                                                          4,248
                Turkey                                                                                                       140                                                                                          9,311
                Algeria                                                                                                      114                                                                                          4,279
                  Iraq                                                                                                        77                                                                                          5,878
                 Egypt                                                                                                       45*                                                                                          2,549

Sources: Automotive Marketing Information Council (AMIC); International Monetary Fund, World Bank, Business Monitor International, CIA World Fact Book, GB Auto Research.
*Please note that this figure refers to passenger cars only, while the motorization figures of the other countries in this graphic refer to cars, buses, and freight vehicles but do not include two-wheelers.
**Figures are taken from World Bank.

                              INVESTOR PRESENTATION | FIRST QUARTER 2020                                                                                                                                                                   11
Egypt Passenger Cars

GB Auto’s market share in the PC segment dipped to 16.9% in 1Q20, however, this is in line
with management’s strategic shift to focus on profitability in light of price advantages enjoyed
by vehicles of Moroccan, Turkish, and European origins.

                                                             Market Share of Key Players*

                                                                                                                             21.8%
                                                                                                                                             1Q19

                                                                 17.9%
                                                                                                                                             1Q20

                                                                                                                                     16.9%
                                                                         10.9%

                                                                                        5.7%
                                                                                 2.5%

                                                                                                      2.0%
                                                                                               1.3%

                                                                                                                    0.03%
                                                                                                             0.1%
                                                                Hyundai          Chery         Geely         Mazda          GB Auto

                                                              • The PC market carried its strong momentum from 2019 into 1Q20 and witnessed
                                                                a y-o-y boost of 58.0%, however, GB Auto’s market share saw a reduction to 16.9%
                                                                in 1Q20 compared to 21.8% during the same period last year.
 Location of GB Auto Distribution
                                                              • The dip in market share aligns with management’s strategy to focus more on
 and After-Sales Facilities                                     profitability, considering the custom breaks and price advantage enjoyed by
                                                                vehicles of Moroccan, Turkish, and European origins.

                                                              • Until the impact of Covid-19, the market was on the path towards a strong
                                                                rebound, with PC units increasing from 23,402 in 1Q19 to 37,011 in 1Q20.

                INVESTOR PRESENTATION | FIRST QUARTER 2020                                                                                     12
Egypt Passenger Cars

    GB Auto’s PC volumes recorded an increase of 21.7% y-o-y in 1Q20, driven by improving market
    conditions and the strong sales volume of the Arizzo 5 that was launched in 3Q19. Moreover,
    management’s efforts to focus on profitability amidst an externally challenging environment saw
    GPM for the segment increase to 11.0%, which was supported by an improved price mix.

                                                                             1Q19      1Q20      % Change

       CBU Sales Volume                                         (Units)      3,244      2,767      -14.7%

       CKD Sales Volume                                         (Units)      1,913      3,507       83.3%

       Total Sales Volume                                       (Units)
                                                                              5,157     6,274        21.7%
       Sales Revenue                                          (LE million)
                                                                             1,564.9   1,651.1        5.5%
       Gross Profit                                           (LE million)
                                                                              151.7     180.8        19.2%
       Gross Profit Margin                                        (%)
                                                                               9.7%     11.0%          1.3

                 INVESTOR PRESENTATION | FIRST QUARTER 2020                                                  13
Egypt Motorcycles & Three-Wheelers

The LoB's total volumes declined 7.2% y-o-y in 1Q20 to 25,202 units sold. This is a slower rate
of decline compared to the 36.7% y-o-y decline in 4Q19. Revenues declined 8.4% y-o-y to LE
661.8 million in 1Q20. However, the LoB's profitability improved with a gross profit margin of
18.1%, up by 5.3 percentage y-o-y.

                                                                              1Q18     1Q19       % Change

       Three-Wheeler Sales Volume                                (Units)
                                                                              17,809   13,616        -23.5%
       Tricycles Sales Volume                                    (Units)
                                                                               1,765          -              -
       Motorcycle Sales Volume                                   (Units)
                                                                               7,594   11,586         52.6%
       Total Sales Volume                                        (Units)
                                                                              27,168   25,202         -7.2%
       Total Sales Revenue                                     (LE million)
                                                                               722.6    661.8         -8.4%
       Gross Profit                                            (LE million)
                                                                                92.4    119.7         29.6%
       Gross Profit Margin                                         (%)
                                                                              12.8%    18.1%            5.3

                  INVESTOR PRESENTATION | FIRST QUARTER 2020                                                     14
Egypt Commercial Vehicles & Construction Equipment

GB Auto’s CV&CE line of business offers a range of commercial vehicle and construction
equipment solutions in Egypt, including assembly, distribution, and manufacturing operations.

               BUSES                               TRUCKS                               TRAILERS                  CONSTRUCTION EQUIPMENT                       TRACTORS

 •   Buses revenues recorded a        •   Truck revenues witnessed a        •   Trailer revenues declined     •    Construction equipment           •   Forecasts see growth in the
     32.8% y-o-y decline in 1Q20          decline of 57.9% y-o-y in             43.2% y-o-y in 1Q20.               revenues witnessed an                long-term, fueled by an
     on the back of a dip volumes         1Q20. Management expects          •   Management anticipates             increase of 124.8% y-o-y in          ongoing drive for the
     that were driven by                  truck volumes to be impacted          trailer volumes to continue        1Q20.                                modernization of Egypt’s
     shortages in supply, which           on the back of austerity in the       being impacted until          •    The LoB represents Volvo             agricultural sector.
     began to resolve in April.           corporate sector, driven by           pressures on the corporate         construction equipment and       •   Management is anticipating
 •   Bus volumes declined by              the challenging external              environment ease and               SDLG in the construction             that tractor volumes will
     27.1% y-o-y. Management              environment.                          markets begin to settle.           equipment market, offering           improve going forward on the
     anticipates that bus volumes                                                                                  sales and after sales services       back of GB Capital’s capacity
     will see declines on the back                                                                                 for a variety of products.           to fund tractor sales.
     of the impacts that the Covid-
     19 outbreak has on the
     tourism sector on account of
     travel restrictions.

                     INVESTOR PRESENTATION | FIRST QUARTER 2020                                                                                                                 15
Egypt Commercial Vehicles & Construction Equipment

Management is expecting that the LoB will be impacted going forward due to travel
restrictions in the tourism sector as well as the austerity on the corporate sector and delays in
fleet renewals that came as result of the Covid-19 outbreak.

                                                                              1Q19       1Q20       % Change

       Bus Sales Volume                                          (Units)
                                                                                229        167         -27.1%
       Truck Sales Volume                                        (Units)
                                                                                264        131         -50.4%
       Tractor Sales Volume                                      (Units)
                                                                                     -          -              -
       Trailer Sales Volume                                      (Units)
                                                                                 86         85          -1.2%
       Construction Equipment Sales Volume                       (Units)
                                                                                 25         36          44.0%
       Total Sales Volume                                        (Units)
                                                                                604        419         -30.6%
       Sales Revenue                                           (LE million)
                                                                              384.7      263.9         -31.4%
       Gross Profit                                            (LE million)
                                                                               50.0       19.5         -61.1%
       Gross Profit Margin                                         (%)
                                                                              13.0%       7.4%            -5.6

                  INVESTOR PRESENTATION | FIRST QUARTER 2020                                                       16
Egypt After-Sales

GB Auto operates the largest and fastest-growing network of after-sales services in Egypt,
covering Passenger Cars, Motorcycles & Three-Wheelers, and Commercial Vehicles &
Construction Equipment.
                     •   Revenues from the                                          •    After sales for motorcycles and                           •   Revenues from the CV&CE after
                         passenger cars after sales                                      three-wheelers witnessed a solid                              sales declined by 21.7% y-o-y in
                         recorded a 0.9% y-o-y                                           56.6% y-o-y increase in                                       1Q20, settling in at LE 55.9
                         increase in 1Q20 to LE 182.6                                    revenues, settling in at LE 53.2                              million.
                         million, up from LE 181.0                                       million in 1Q20.
                         during the same period last
                         year.
Passenger                                                          Motorcycles                                               Commercial
Cars                                                               & Three-                                                  Vehicles &
                                                                   Wheelers                                                  Construction
                                                                                                                             Equipment

                                                                                                                             Egypt After-Sales
                                                                                                                             5-Year Revenues Progression
                                                                                                                             (all figures in LE million)
Total After-Sales Egypt                                                      1Q19                1Q20         % Change

Passenger Car AFS Revenue                           (LE million)
                                                                                 181.0             182.6             0.9%                                                     291.7
                                                                                                                                                                   286.3
                                                                                                                                                       260.5
2&3 Wheelers AFS Revenue                            (LE million)                                                                           239.1
                                                                                  33.9              53.2            56.6%
CV&CE AFS Revenue                                   (LE million)                                                                160.5
                                                                                  71.4              55.9           -21.7%
Total AFS Egypt Revenue                             (LE million)
                                                                                 286.3             291.7             1.9%
Total AFS Egypt Gross Profit                        (LE million)
                                                                                  64.8              53.0           -18.1%
                                                                                                                                1Q16       1Q17        1Q18        1Q19       1Q20
Total AFS Egypt Gross Profit Margin                     (%)
                                                                             22.6%                18.2%               -4.4

                  INVESTOR PRESENTATION | FIRST QUARTER 2020                                                                                                                      17
Location of GB Auto’s After-Sales Facilities.

                                                                                  SALES OR SERVICE OR
                                                       47   PASSENGER CARS
                                                                                  SPARE PARTS CENTER

                                                                                  SALES & SPARE
                                                       25   2 & 3 WHEELERS        PARTS CENTER

                                                                                  SALES, SERVICES &
                                                       13   Commercial Vehicles   SPARE PARTS CENTER

          INVESTOR PRESENTATION | FIRST QUARTER 2020                                              18
Egypt Tires

Despite a y-o-y decline of 17.1% in revenues in 1Q20, the LoB witnessed an increase in
profitability, with gross profit up by 31.4%. Management is fully aware of the reduction in
market size considering the Covid-19 situation but is also optimistic that the LoB can continue
to grow market share with the current portfolio.

                                               Tires in: Egypt
                                                                                                           •   Revenues declined by 17.1% y-o-y to LE 237.9 million in
                                                                                                               1Q20, compared to LE 287.0 million in 1Q19.
                                                                                                           •   The LoB witnessed a 31.4% y-o-y increase in gross
                                                                                                               profits, settling in at LE 57.8 million in 1Q20, with GPM
                                                                                                               rising by 9.0 percentage points to 24.3%.
                                                                                                           •   Management is consistently scouting for new tire
                                                                                                               representations, leveraging its growing distribution
                                                                                                               network for commercial tires.

 Passenger car tires              Light truck tires         Truck tires      Off-the-road (OTR) tires

                                                                                                          Egypt Tires 5-Year Revenues
                                                                                                          Progression
                                                                                                          (all figures in LE million)
 Egypt Tires
 Summary Performance                                                1Q19          1Q20       % Change

                                                                                                                                                  287.0
 Total Sales Revenues                      (LE million)                                                                                                       237.9
                                                                     287.0         237.9         -17.1%                               179.7

 Total Gross Profit                        (LE million)                                                        91.1       100.9

                                                                      44.0          57.8          31.4%

 Gross Margin                                  (%)                                                             1Q16        1Q17       1Q18        1Q19        1Q20
                                                                    15.3%          24.3%            9.0

                      INVESTOR PRESENTATION | FIRST QUARTER 2020                                                                                                   19
Regional Operations

On a regional level, GB Auto distributes CBU units of Hyundai passenger cars in Iraq; Bajaj
motorcycles & three-wheelers in Iraq; and operates after-sales service centers in Iraq.
However, GB Auto will discontinue its representation of Hyundai in Iraq in 2020.
                                                                                                                 Hyundai Passenger Cars in Iraq
   Regional Operations
   •   Regional operations witnessed a revenue decline of 5.7% y-o-y in 1Q20 to LE 1.494.6
       million on the back of a drop in PC volumes. The decline was largely due to the
       complete lockdown in Iraq which was enforced in early March and April, effectively
       bringing sales activities to a halt.
   •   After discontinuing its representation of Hyundai, GB Auto successfully secured new
       representation with MG, a reputable British brand under Chinese ownership.

  Iraq
  Passenger Cars
  •    Iraq PC Operations reported a 5.4% y-o-y decline in PC volumes in 1Q20, settling in at
       4,016 units.
  •    Management pressed on with the liquidation of the remaining Hyundai inventory with
       the anticipated rollout of the MG brand towards the end of the year.
  Two- and Three-Wheelers                                                                                        Two & Three-Wheelers in Iraq
  •    Volumes recorded a solid 30.9% y-o-y increase in 1Q20 to 30,661 units, with average
       sales per month increasing to 2,951 units/month in 1Q20 compared to 2,254.0
       units/month in 1Q19.

 Regional Performance                                   1Q19             1Q20        % Change

 Total Regions Revenues        (LE million)
                                                        1,585.3          1,494.6             -5.7%
 Total Regions
                               (LE million)
 Gross Profit
                                                          125.3            151.3           20.8%       Motorcycles
 Gross Margin                      (%)
                                                           7.9%           10.1%                 2.2   Three-Wheelers

                     INVESTOR PRESENTATION | FIRST QUARTER 2020                                                                                   20
GB Auto & Auto Related Income Statement
(LE million)                                                                                                                    1Q19                                             1Q20                                       % Change
Revenues                                                                                                                        4,746.9                                          4,497.7                                            -5.2%
Inter-Segment Revenues                                                                                                            201.3                                            246.4                                            22.4%
Total Revenues                                                                                                                  4,948.2                                          4,744.1                                            -4.1%
Cost of Sales                                                                                                                 (4,204.6)                                        (3,896.5)                                            -7.3%
Inter-Segment Cost of Sales                                                                                                     (201.3)                                          (246.4)                                            22.4%
Total Cost of Sales                                                                                                           (4,405.9)                                        (4,142.9)                                            -6.0%
Gross Profit                                                                                                                      542.3                                            601.2                                            10.9%
Gross Profit Margin                                                                                                              10.4%                                            12.7%                                                2.2
General, Selling & Administrative Expenses                                                                                      (350.0)                                          (353.7)                                             1.1%
Other Operating Income                                                                                                              28.8                                             21.5                                          -25.4%
Provisions (Net)                                                                                                                     2.5                                            (2.1)                                                -
Operating profit                                                                                                                  223.6                                            266.9                                            19.4%
Finance Cost / Income                                                                                                           (352.5)                                          (256.1)                                           -27.4%
FOREX                                                                                                                               36.5                                             19.5                                          -46.7%
Net Profit / (Loss) Before Tax                                                                                                    (92.4)                                             30.4                                                -
Income Tax                                                                                                                          22.1                                            (9.4)                                                -
Net Profit / (Loss) After Tax And Before NCI                                                                                      (70.4)                                             21.0                                                -
NCI                                                                                                                               (22.7)                                           (26.1)                                           14.9%
Net Profit / (Loss) After NCI                                                                                                     (93.1)                                            (5.2)                                          -94.5%

Depreciation                                                                                                                       51.6                                             60.1                                               16.5%
EBITDA                                                                                                                            275.2                                            327.1                                               18.9%
EBITDA Margin                                                                                                                      5.6%                                             6.9%                                                  1.3
The finance costs includes leasing expenses of LE (41.9) million for 1Q20

GB Auto & Auto Related Key Working Capital Components
(LE million)                                                                                        1Q19                         2Q19                          3Q19                         4Q19                          1Q20
Inventory                                                                                                   4,956.9                       4,530.2                      3,428.3                       3,719.5                      3,586.2
Receivables                                                                                                 2,372.4                       2,337.6                      2,071.2                       1,730.9                      1,675.6
Advances                                                                                                      582.9                         426.4                        357.1                         452.1                        545.8
Debtors & Other Debit Balances                                                                                749.5                         734.2                      1,105.4                         708.7                        567.1
Payables (Net)*                                                                                             3,273.3                       2,448.8                      2,549.2                       2,478.2                      2,723.3
Working Capital                                                                                             5,388.6                       5,579.6                      4,412.8                       4,133.0                      3,651.4
Payables are shown net of operating lease-related liabilities amounting to LE 990.6 million, which are now added to our Net Debt calculations. Due to a change in Egyptian Accounting Standards, the related leased assets have been
recorded on the balance sheet under PP&E, while the liabilities have been booked under Payables starting from 2Q19 onwards..

                         INVESTOR PRESENTATION | FIRST QUARTER 2020                                                                                                                                                                    21
GB Auto & Auto Related Key Ratios

(LE million)                                                                                                             1Q19                               2Q19                               3Q19                               4Q19                               1Q20

Net debt / equity*                                                                    Units                               1.43                               2.05                               1.89                               1.89                               1.77

Total liabilities less cash / equity                                                  Units                               2.73                               2.95                               2.92                               2.95                               2.96

Current ratio                                                                         Units                               0.99                               0.95                               0.91                               0.89                               0.89

Net debt / EBITDA                                                                     Units                               3.12                               4.89                               6.07                               7.37                               6.35

LTM EBITDA / finance cost                                                             Units                               1.29                               1.05                               0.71                               0.58                               0.66

Capital employed **                                                               LE million                           7,987.8                            8,287.9                            8,211.8                            8,522.7                            7,767.3

ROCE ***                                                                                 %                              18.7%                              14.4%                               9.6%                               6.6%                               7.8%

*Net Debt for segments = (short term debt + long term debt + due to related parties - inter-segment ) - Cash and cash equivalents including due from related parties - inter-segment
** Average capital employed for segments at the end of the period = (property, plant and equipment + intangible assets and goodwill + investment property + inventories + trade receivables + debtors and other debit balance) - (trade payables + other current liabilities)
*** ROCE for segments = Last twelve months operating profit / average capital employed at the end of the period

                              INVESTOR PRESENTATION | FIRST QUARTER 2020                                                                                                                                                                                                        22
III. GB CAPITAL
GB Capital’s strategy is to benchmark operations against the best in the field, building on strict
and robust credit, risk classification and provisioning policies developed for each industry.

GB Capital Portfolio Breakdown by Maturity – excluding provisions – 1Q20   GB Capital Portfolio Breakdown by Loan Size 1Q20

                                                                                                                                   ◼      < LE 100K                               48%
                                           ◼ < 1 year              51%
                                                                                                                                   ◼      > LE 100K < LE 500K                     13%
                                           ◼ > 1 year < 3 years    31%
                                                                                                                                   ◼      > LE 0.6MM < LE 10 MM                   4%

                                           ◼ > 3 years < 6 years   17%                                                             ◼      > LE 10MM < LE 100 MM                   14%

                                           ◼ > 6 years              2%                                                             ◼      > LE 100MM                              21%

GB Capital Portfolio Breakdown by Asset Type 1Q20                          Supplementary Financial Information – GB Capital                                     1Q19       FY19 1Q20
                                                                           Net Portfolio Assets                                                       (LE mn)
                                                                                                                                                                8,552.8   9,100.2 10,000.3
                                                                           Debt / Equity                                                                x
                                                                                                                                                                3.81x     3.38x    3.17x
                                   ◼    Automotive                   31%   Debt / Equity - Regulator Definition                                         x
                                                                                                                                                                3.11x     2.68x    2.66x
                                   ◼    Real Estate                  28%   Equity / Loan Portfolio                                                      %       21.0%     25.8%    25.4%
                                                                           Annualized Return on Avg. Equity (ROAE) - Excluding NCI*                     %
                                   ◼    Machinery & Equipment         3%                                                                                        30.8%     35.1%    27.4%
                                                                           Annualized ROAA [Annualized the period EBIT pre-funding costs after tax
                                                                                                                                                        %
                                   ◼    Agriculture Equipment        10%   / average assets of period]                                                          21.6%     22.3%    18.3%
                                                                           Annualized net interest margin (%) [(interest income - interest expense)
                                   ◼    SME Factoring                 2%   for the last quarter X 4 / average portfolio size for the quarter]
                                                                                                                                                        %
                                                                                                                                                                13.1%     15.9%    18.0%
                                                                           Provision for portfolio :
                                        Electrical Appliances         1%
                                                                           Provision (BS) / Loan portfolio %                                            %       2.55%     2.94%    2.99%
                                        Others                       25%   Provision (BS) / NPL % (Coverage ratio)                                      %       216%      204%     199%
                                                                           NPL / Loan portfolio %                                                       %       1.18%     1.45%    1.50%

                INVESTOR PRESENTATION | FIRST QUARTER 2020                                                                                                                        24
GB Capital Income Statement (Before Elimination)

                                                                                                                                                                           % Change      % Change
(LE million)                                                                    1Q19                            4Q19                            1Q20                          Q-o-Q          Y-o-Y
Revenue                                                                          564.3                           960.1                           725.4                         -24.4%         28.6%
Interest Income                                                                  576.6                           674.5                           691.9                           2.6%         20.0%
Total Revenues                                                                 1,140.9                         1,634.6                         1,417.3                         -13.3%         24.2%
Cost of Sales                                                                  (514.3)                         (764.0)                         (652.6)                         -14.6%         26.9%
Cost of Funds                                                                  (303.2)                         (304.8)                         (262.1)                         -14.0%        -13.6%
Total Cost of Revenues                                                         (817.5)                       (1,068.9)                         (914.7)                         -14.4%         11.9%
Gross Profit                                                                     323.4                           565.7                           502.7                         -11.1%         55.4%
SG&A                                                                           (142.7)                         (238.2)                         (236.0)                          -0.9%         65.4%
Provisions                                                                       (12.6)                          (18.1)                          (32.3)                         78.8%              -
Operating Profit                                                                 168.1                           309.5                           234.4                         -24.3%         39.4%
Other Income                                                                        9.2                            13.6                            11.0                        -19.4%         18.5%
EBIT                                                                             177.4                           323.1                           245.3                         -24.1%         38.3%
Other Interest & Similar Income                                                     3.2                           (4.8)                           (3.3)                        -31.5%              -
FOREX                                                                               9.0                             6.4                            13.1                              -        45.5%
EBT                                                                              189.6                           324.8                           255.1                         -21.4%         34.6%
Income Tax                                                                       (42.7)                        (103.7)                           (59.9)                        -42.4%         40.4%
Profit After Tax & Before NCI                                                    146.9                           221.1                           195.2                         -11.7%         32.9%
NCI                                                                                28.3                            40.2                            51.7                         28.6%         82.5%
Net Profit After Tax & NCI                                                       118.6                           180.9                           143.6                         -20.6%         21.0%

Breakdown of Revenue By Company
GB Capital                                                                            -                             6.2                            5.7                          -8.7%              -
GB Lease                                                                          191.3                           179.7                          135.0                         -24.9%        -29.5%
Drive                                                                             381.7                           733.7                          498.3                         -32.1%        30.6%
Mashroey                                                                          329.5                           362.9                          382.6                           5.5%        16.1%
Tasaheel                                                                          218.1                           330.9                          372.8                         12.7%         70.9%
Haram                                                                              20.3                            21.2                            22.9                          7.9%        12.8%
Total                                                                          1,140.9                         1,634.6                         1,417.3                         -13.3%        24.2%

*GB capital revenue appears in 2019 for the first-time making use of the new Venture Capital License obtained in 3Q19 allowing GB Capital to book finance leasing contracts.
**GB Lease revenue numbers have been restated for the new Egyptian Accounting Standards which no longer record depreciation of the financed assets in the revenues line.

                      INVESTOR PRESENTATION | FIRST QUARTER 2020                                                                                                                             25
IV. CONSOLIDATED
  FINANCIAL
  PERFORMANCE
GB Auto Segregated Income Statement

                                                                                                                                                                               1Q20
                                                                                                  GB Auto                                        GB Capital                                                                              GB Auto
(LE million)                                                                                                                                                                                      Elimination
                                                                                          (Auto and Auto Related)                           (Financing Business)                                                                       Consolidation
Revenues                                                                                                                4,497.7                                        1,391.0                                                   -                     5,888.7
Inter-segment revenues                                                                                                     246.4                                            26.3                                       (272.8)                                 -
Total revenues                                                                                                          4,744.1                                        1,417.3                                         (272.8)                         5,888.7
Cost of sales                                                                                                         (3,896.5)                                         (894.0)                                                  -                 (4,790.5)
Inter-segment cost of sales                                                                                              (246.4)                                          (20.6)                                         267.0                                 -
Cost of Sales                                                                                                         (4,142.9)                                         (914.7)                                          267.0                     (4,790.5)
Gross Profit                                                                                                               601.2                                          502.7                                            (5.7)                       1,098.2
General, selling and administrative expenses                                                                             (352.1)                                        (236.0)                                              0.7                       (587.4)
Other operating income                                                                                                       19.9                                           11.0                                           (0.7)                            30.1
Provisions (Net)                                                                                                             (2.1)                                        (32.3)                                                 -                      (34.4)
Operating profit                                                                                                           266.9                                          245.3                                            (5.7)                        506.5
Finance cost / income                                                                                                    (256.1)                                            (3.3)                                            5.7                       (253.6)
FOREX                                                                                                                        19.5                                           13.1                                                 -                          32.6
Net profit / (loss) before tax                                                                                               30.4                                         255.1                                                  -                      285.5
Income tax                                                                                                                   (9.4)                                        (59.9)                                                 -                      (69.3)
Net profit / (loss) after tax and before NCI                                                                                 21.0                                         195.2                                                  -                      216.2
NCI                                                                                                                        (26.1)                                         (51.7)                                                 -                      (77.8)
Net profit / (loss) after NCI                                                                                               (5.2)                                         143.6                                                  -                      138.4
Eliminations of inter-segment items compose of trading of Auto and Auto related, Leased items as well as reclassification between cost of sales and finance cost for consistent application of consolidation procedure of the group.

Historical data for GB Auto Group's segregated financials can be downloaded at ir.ghabbourauto.com/fundamentals

                            INVESTOR PRESENTATION | FIRST QUARTER 2020                                                                                                                                                                                 27
GB Auto Segregated Balance Sheet
                                                                                                                                                               As at 31 March 2020
                                                                                                       GB Auto (Auto and Auto
  (LE million)                                                                                                                         GB Capital (Financing Business)     Elimination               GB Auto Consolidation
                                                                                                       Related)
 Property Plant & Equipment                                                                                                3,822.6                                319.5                       15.1                            4,157.2
 Intangible Assets & Goodwill                                                                                                432.5                                  1.0                          -                              433.5
Investments in Subsidiaries (GB Capital)                                                                                     322.1                                 58.0                    (322.0)                               58.1
 Notes Receivable                                                                                                              4.2                              4,111.9                    (684.5)                            3,431.6
 Investments Property                                                                                                         90.9                                    -                          -                               90.9
 Deferred Tax Assets                                                                                                         617.2                                  2.9                          -                              620.1
 Non-Current Assets                                                                                                        5,289.5                              4,493.4                    (991.4)                            8,791.4
 Inventories                                                                                                               3,586.2                                111.4                          -                            3,697.7
 Trade Receivables                                                                                                         1,671.4                              5,419.3                    (150.3)                            6,940.4
 Advance Payments to Suppliers                                                                                               545.8                                 28.9                          -                              574.8
 Debtors & Other Debit Balance                                                                                               567.1                                441.6                          -                            1,008.6
 Due from Related Parties                                                                                                    143.3                                102.1                          -                              245.3
 Due from Related Parties - Inter-Segment                                                                                    249.1                                109.3                    (358.4)                                  -
 Cash and Cash Equivalents                                                                                                   991.5                                566.5                          -                            1,558.0
 Current Assets                                                                                                            7,754.3                              6,779.2                    (508.7)                           14,024.8
 Total Assets                                                                                                             13,043.8                             11,272.5                  (1,500.1)                           22,816.2

Share Capital                                                                                                               1,094.0                               318.0                    (318.0)                            1,094.0
Treasury Stock                                                                                                                (10.0)                                   -                         -                              (10.0)
Legal Reserves                                                                                                                307.5                                 89.9                       0.4                              397.7
Private Reserve                                                                                                             2,250.9                               (64.5)                     (2.5)                            2,183.8
Accumulated Profit (Losses)                                                                                               (1,652.6)                             1,683.3                       26.2                                56.9
Net Income / (Loss) for The Period                                                                                             (5.2)                              143.6                          -                              138.4
Total Shareholders' Equity Before NCI                                                                                       1,984.7                             2,170.2                    (294.0)                            3,860.9
Total NCI                                                                                                                   1,062.4                               364.8                     (12.9)                            1,414.3
Total Equity                                                                                                                3,047.1                             2,535.0                    (306.9)                            5,275.2
Trade Payables                                                                                                              2,919.5                               371.2                    (150.3)                            3,140.4
Loans & Overdraft                                                                                                           5,166.9                             4,806.6                          -                            9,973.5
Due to Related Parties                                                                                                          89.4                                 5.7                         -                                95.1
Due to Related Parties - Inter-Segment                                                                                        341.9                                 16.6                   (358.4)                                   -
Provision                                                                                                                     217.4                                    -                         -                              217.4
Other Current Liabilities                                                                                                       11.9                              288.4                          -                              300.3
Total Current Liabilities                                                                                                   8,747.0                             5,488.3                    (508.7)                           13,726.6
Loans                                                                                                                         130.2                             3,223.5                          -                            3,353.7
Provision                                                                                                                        4.2                                   -                         -                                 4.2
Trade and Notes Payable                                                                                                       794.3                                    -                   (684.5)                              109.8
Deferred Tax Liabilities                                                                                                      321.0                                 25.7                         -                              346.7
Total Non-Current Liabilities                                                                                               1,249.7                             3,249.2                    (684.5)                            3,814.5
Total Equity And Liabilities                                                                                              13,043.8                             11,272.5                  (1,500.1)                           22,816.2
Historical GB Auto Group segregated financials can be downloaded at ir.ghabbourauto.com/fundamentals

                             INVESTOR PRESENTATION | FIRST QUARTER 2020                                                                                                                                                      28
V. KEY CORPORATE &
  SHAREHOLDER
  INFORMATION
GB Auto is focused on the long-term sustainability of the business and its ability to deliver to
shareholders.

A closer look at our shareholding structure as of 31 March 2020

GB Auto’s Shareholding Structure (%)                                                            Geographic Distribution of the Free Float (%)

                                                                                                                                         ◼ Egypt                 30%

                                                                                                                                         ◼ Saudi Arabia          26%
                                                ◼ Ghabbour Family           62.9%                                                        ◼ Rest of Europe        11%

                                                ◼ Free Float                37.1%                                                        ◼ Rest of World         26%

                                                                                                                                         ◼ United Kingdom         4%

                                                                                                                                         ◼ United States          3%

GB Auto Stock 52-Week Performance                                                                                              DR Information

                                GB Volume          EGX (Rebased 100)         GB Auto Rebased (100)                             DR Symbol              : GBAXY
                                                                                                                               CUSIP                  : 368290102
 150                                                                                                           50,000,000
                                                                                                                               DR Exchange            : OTC
                                                                                                               40,000,000
 100
                                                                                                                               DR ISIN                : US3682901026
                                                                                                               30,000,000      Ratio                  : 01:50
 50
                                                                                                               20,000,000      Depositary             : BK (Sponsored)
                                                                                                               10,000,000      Effective Date         : 05/28/09
  0                                                                                                            0               Underlying ISIN        : EGS673T1C012
  May-19   Jun-19    Jul-19   Aug-19   Sep-19   Oct-19   Nov-19   Dec-19   Jan-20   Feb-20   Mar-20   Apr-20                   Underlying SEDOL       : B1Y9TD5

                    INVESTOR PRESENTATION | FIRST QUARTER 2020                                                                                                           30
Management Biographies (1/4)

1. Dr. Raouf Ghabbour, Chairman of the Board of Directors and Chief Executive Officer
   Dr. Raouf Ghabbour founded the Ghabbour Group of Companies, which he began incepting in 1985. Dr. Ghabbour began his career working in his family’s auto-related trading
   business, where he initially established himself in the tire division. Having quickly gained a commendable reputation in the market for his business savvy, Dr. Ghabbour went on to
   acquire agency agreements from global OEMs, which he transformed into successful businesses. Dr. Ghabbour has grown the Company to a leading automotive assembler and
   distributor in the Middle East and North Africa.

2. Mr. Nader Ghabbour, Deputy Chief Executive Officer
   Mr. Nader Ghabbour brings over 13 years of specialized experience in the automotive industry to his role, which he has cultivated through the managerial and operational positions
   he has held at GB Auto. Prior to his current role, Mr. Ghabbour served as Group Chief Operating Officer, where he was responsible for a multitude of vehicular operations in Egypt
   and the region. Beforehand, he had served as Passenger Car Chief Operating Officer and Project Management Officer Leader. Mr. Ghabbour trained in Mergers and Acquisitions at
   the London Business School in London. He holds a Bachelor of Arts in Business Administration from Boston University, and an MBA from IE Business School, Madrid.

3. Mr. George Sedky, Chief Human Resources Officer
   Mr. George Sedky has two decades of experience in personnel management, having held positions in the Human Resources divisions of several major corporations. He has a long
   track record of success in recruiting and gaining top talent, organizational transformation, and building cultures of engagement. He was successful in re-engineering GB Auto’s
   Human Resources department goals and practices, aligning them with the Group’s strategic business goals. He is specialized in strategic management and planning; directing all HR
   functions; introducing new methodologies that maximize performance through training and development; compensation and benefits; and organizational development. He holds a
   BSc. In Aerospace Engineering from Cairo University and an MBA with an HR Specialization from Arab Academy for Science, Technology and Maritime Transport.

                    INVESTOR PRESENTATION | FIRST QUARTER 2020                                                                                                                  31
Management Biographies (1/4)

4. Mr. Wissam Al-Adany, Chief Information Technology Officer
   Mr. Wissam Al-Adany joined GB Auto in 2014 bringing with him more than 19 years of experience in IT management, including four years of international experience in
   Brazil, France and Kazakhstan. Prior to joining GB Auto, Mr. Al-Adany served as Group Chief Information Technology Officer of the Americana Group — whose major
   shareholder is the multinational Al Kharafi Conglomerate — where he managed the Group’s IT Operations for 15 companies. He started his career with GlaxoSmithKline as a
   Senior Systems Engineer, and from there moved on to Lafarge as Country IT Director for four years. Mr. Al-Adany has deep techno-functional knowledge in all facets of IT
   and a robust track record in IT infrastructure management, service delivery, ERP implementation and techno-commercial support. He holds a BSc in Communications &
   Electronics Engineering from Ain Shams University in Cairo, and an MBA from the American University in Cairo.

5. Ms. Cherine Kallal, Senior Vice President Business Development & CEO Support
   Ms. Cherine Kallal joined GB Auto in November 2011 and currently spearheads the Group’s Business Development Division in her capacity as Senior Vice President Business
   Development. She is responsible for overseeing the successful execution of business development initiatives and strategic projects as part of the Group’s growth strategy.
   She also directs the Group’s China based unit. In January 2016, Ms.Kallal was appointed as CEO Support in addition to her Business Development role, where she directly
   supports the Group’s CEO in designated operational and organizational tasks. In her roles, she is a member of the Group’s Executive Committee and Management Steering
   Committees. A diligent and results-oriented strategist with strong experience in structured planning and cross-functional management; Ms. Kallal spent several years in the
   Telecom services sector where she served in several roles prior to joining GB Auto Group. Ms. Kallal holds a BSC in Mechanical Engineering from Loughborough University in
   UK.

6. Mrs. Odette Gamil, Senior Vice President, Internal Audit
   Mrs. Odette Gamil joined Ghabbour in September 2013 as Senior Vice President – CEO Assistant. Mrs. Gamil has 22 years of experience in finance and internal audit,
   including 14 years in multinational companies (Nestle & Heineken). Prior to joining GB Auto, Mrs. Odette was Head of Internal Audit for Heineken Egypt for 5 years. Before
   the 9 years spent in Nestle Egypt, she held positions in finance, budgeting and reporting, financial analysis, costing and cost analyst and ended her career in Nestle as cost
   controller. In May 2017, Mrs. Gamil was appointed as the Head of Internal Audit in GB Auto. She has graduated from the Faculty of Commerce at Ain Shams University.

                   INVESTOR PRESENTATION | FIRST QUARTER 2020                                                                                                              32
Management Biographies (2/4)
GB Auto & Auto-Related Management

7. Mr. Ramez Adeeb, Chief Manufacturing Officer
   Mr. Ramez Adeeb joined GB Auto in 1995, holding a number of positions and gaining experience in functions including planning, engineering, and quality control until he left
   the company in 2001 for a position as a project manager at RITEC Consultancy. Mr. Adeeb rejoined GB Auto in 2003, garnering additional experience in the segments of
   localization management, aggregate planning, sales technical support, industrial projects management and, finally, the group technical support directorship. Mr. Adeeb
   graduated with a Bachelor’s degree from Cairo University’s Mechanical Engineering Department in 1993. He served as a Research Assistant in Rotor Dynamics and Vibration at
   Cairo University from 1994-95. He earned an MBA in Marketing Management from the Netherlands’ Maastricht School of Management in 2005.

8. Mr. Abbas El Sayed, GB Auto & Auto Related Finance Director
   Mr. Abbas El Sayed joined GB Auto in 2014 as Group Vice President Finance. He has 14 years of experience gained from KPMG and Deloitte including 1.5 years in the UK at
   KPMG UK LLP. Mr. El Sayed has vast experience in corporate finance, restructuring, strategic planning, audit, internal controls, advisory and compliance. He holds a Bsc. in
   Accounting from Ain Shams University. He is a member of the Association of Chartered Certified Accountants (ACCA) in the UK and Certified Management Accountant (CMA)
   in the USA.

9. Mr. Ghassan Kabbani, Chief Operating Officer of Two- and Three-Wheelers
   Mr. Ghassan Kabbani brings more than 30 years experience to GB Auto. He first worked in the family textile business from 1980 through 1994, when he left to join T.E.S. sheet
   metal. In 1996, together with Dr. Ghabbour and other partners, he established CITI (a 2- and 3-Wheeler company). In 2007 CITI merged with GB Auto, at which time Mr.
   Kabbani joined the company. Mr. Kabbani graduated from AUC in 1979 with a BA in Economics and Business Administration.

10. Mr. Karim Gaddas, Group Chief Operating Officer
    Mr. Karim Gaddas joined GB Auto in 2015 as Chief Executive Officer of Tires, boasting 20 years of experience in general management, operations, and sales and marketing. In
    the last 16 years he occupied various positions at Pirelli that included headquarter-level roles in Milan and regional-level roles in Paris, Cairo, Alexandria, and Dubai. In
    addition to being the Global Sales Director for BU trucks, the CEO of the company’s Middle East and India operations, and the CEO of African and Egyptian operations, Mr.
    Gaddas also served as Pirelli’s Vice Chairman. He was also a member of the board at the Alexandria Tire Company for eight years. Mr. Gaddas began his career in 1996 at
    Gewiss, an electrical materials company based in Bergamo, Italy, where he was the Area Manager for Central America, the Middle East, and Africa. He holds a B.A. in Business
    Administration from the Sup de Co Montpellier in France and an MBA from SDA Bocconi in Milan, Italy.

                   INVESTOR PRESENTATION | FIRST QUARTER 2020                                                                                                           33
Management Biographies (3/4)

GB Auto & Auto-Related Management

11. Mr. Ahmed Fathy, Senior Vice President, Tires
    Mr. Ahmed Fathy brings over sixteen years of experience in the automotive and engineering fields to his role at GB Auto. Prior to his current role, he served across
    a plethora of positions at the Group, which include VP Commercial Vehicles in the Heavy Trucks, Trailers and Superstructure Department, as well as Division Head
    B2B, Trucks Sales Manager B2B and Trucks Senior Sales Engineer B2B for Volvo. Before joining GB Auto, Mr. Fathy held the position of Sales Engineer at Cairo
    Hydraulic Group. He has a BSc. in Engineering from the faculty of Engineering in Zagazig University, and a mini-MBA in management from the Knowledge Academy.

12. Mr. Ibrahim Naguib, Chief Operating Officer of Passenger Car Operations
    Mr. Ibrahim Naguib has accumulated over 15 years of experience in the automotive industry. Mr. Naguib currently serves as Chief Operating Officer of the
    Passenger Car Operations where he is responsible for both Sales and After Sales operations. Mr. Naguib first joined GB Auto in 2003 as the Tires Department
    General Manager where he managed to double the business turnover in a period of three years. In 2007, he took charge of the Commercial Vehicles business
    where he managed to grow sales volumes and expand market share. In 2009, he assumed the role of Sales and Marketing Director for the Hyundai and Mazda
    franchises. After briefly relocating abroad, Mr. Naguib returned to GB Auto in 2016 where he was appointed SVP of the Passenger Cars sales operations where
    under his leadership, market share surged to an unprecedented 36%. Mr. Naguib holds a BA from the American International University in London, UK and an MBA
    from the Maastricht School of Management, The Netherlands.

13. Eng. Sameh Ali, Chief Operating Officer for Commercial Vehicles and Construction Equipment
    Eng. Sameh Ali started his career with a British mining company for four years after which he joined GB Auto as a service manager for Commercial Vehicles where
    he worked his way up to After Sales Head. In 2014, he was tasked with managing Sales as well as After Sales operations. In addition to his responsibilities, Sameh
    was appointed in 2017 Managing Director of GB Polo bus manufacturing company, where he oversaw a successful company turn around by end of 2018. Sameh
    holds a degree in mechanical engineering, as well as an MBA degree from Faculty of Business and Innovation at Toledo University, USA.

                   INVESTOR PRESENTATION | FIRST QUARTER 2020                                                                                                              34
Management Biographies (4/4)

GB Capital Management

14. Mr. Sherif Tawadros, Senior Vice President Finance
    Mr. Tawadros is currently the Senior Vice President Finance for GB Capital. He has under his belt over 29 years of experience in the field of finance in Treasury & Cash
    Management, Banking, Leasing Company Portfolio Management, Financial & Strategic planning. He holds a BA in Business Administration and MBA from the American
    University in Cairo.

15. Mr. Ahmed Ossama, GB Capital Finance Director, Haram Tourism and Drive Chairman and MD
    Mr. Ahmed Ossama bolds the position of GB Capital Head of Finance and Chairman and MD of Haram Tourism. He has under his belt over two decades of experience in
    accounting and finance across a broad range of industries, including telecoms, petroleum, manufacturing, mining, and financial institutions. He holds a BA in Accounting.

16. Mr. Mounir Nakhla, Mashroey & Tasaheel Co-founder and MD
    Mr. Mounir Nakhla is the Co-founder and Managing Director of Tasaheel, leveraging his entrepreneurial drive, calculated management style and hands-on problem-solving
    to grow the company to the positioning it holds today. Prior to his establishment of Tasaheel, he founded Mashroey, Egypt’s fastest growing asset-based microfinance
    company, and assumed the role of Managing Director in 2009. He was part of EQI’s growth story, holding several positions with the company and bookending his career
    there as Managing Partner in 2008. Mr. Nakhla holds a BSc. in International Business Studies from the European Business School and an MSc in Environment &
    Development from the London School of Economics.

17. Mr. Sherif Sabry, GB Lease Chairman and MD
    Mr. Sherif Sabry is the Chairman and MD of GB Lease, having held the post since 2008 when he was appointed to manage the restructuring of the company upon GB Auto
    Group’s acquisition of the firm under its financing arm. He has been a member of the GB Auto family since 1995 in several capacities, including Group Treasury Division
    Head and Group Treasury Director. He holds a BA of Commerce from Cairo University and an MBA in Finance and Banking from Maastricht School of Management. He is
    also a graduate of the Chase Manhattan Bank Credit Program.

                  INVESTOR PRESENTATION | FIRST QUARTER 2020                                                                                                             35
Board of Directors Biographies (1/2)

1. Dr. Raouf Ghabbour, Chairman of the Board of Directors and Chief Executive Officer, founded the Ghabbour Group of Companies, which he began incepting in 1985. Dr.
   Ghabbour began his career working in his family’s auto-related trading business, where he initially established himself in the tire division. Having quickly gained a
   commendable reputation in the market for his business savvy, Dr. Ghabbour went on to acquire agency agreements from global OEMs, which he transformed into
   successful businesses. Dr. Ghabbour has grown the Company to a leading automotive assembler and distributor in the Middle East and North Africa. He has chaired the
   Board of Directors since 2007.

2. Ms. Lobna El Dessouky, Independant Board Member, Ms. El Dessouky leverages over two decades of professional experience in a wide range of sectors to fulfill her
   numerous advisory and board roles. She’s currently an independent member of the Advisory Board of Alexandria Business Association Small and Micro Enterprise Project,
   independent Board and Audit Committee member at Cleopatra Hospital Company, Advisor for the European Bank for Construction and Development’s Enterprise Growth
   Program and is an Advisor to the Audit Committee at Qalaa Holdings, having served as a member of the committee from December 2012 to 2014. Prior to this, she spent six
   years as Group Chief Financial Officer at Asec Holding and served on the Group’s board for eight years. Ms. El Dessouky spent most of her career with Coca Cola Egypt,
   starting as Head Office Financial Controller in 1997 and eventually working her way to Group Chief Financial Officer in 2001 and serving in that post till 2006. She began her
   career at PricewaterhouseCoopers as part of the audit staff in 1993, ending her stint at the company as Audit Senior in 1997. She has also been highly involved in teaching
   since 1997, she worked with Eslsca Business School, Edinburgh Business School, The American University in Cairo (AUC), and The Regional Information Technology Institute
   (RITI) in association with Maastricht School of Management (MSM). Ms. El Dessouky holds a Bachelor’s degree in Commerce from Helwan University and an MBA in
   Management Consultancy from Sheffield University, UK. She is a CPA, CFM, and CMA holder and is also a Member of the Association of Corporate Governance Practitioners
   and a Certified Director from the Egyptian Institute of Directors.

3. Mr. Mansour Kabbani, Non-Executive Director, brings more than 30 years of experience to GB Auto, where he joined as VP for project co-ordination in 2015 and currently
   overseas group investments as well as investor relations. Mr. Kabbani spent a decade working in textile spinning before becoming CFO at Technological and Electrical
   Systems (TES) for two years. With Dr. Ghabbour and partners, he helped establish CITI in 1997 which later merged with GB Auto. From 1997 to 2015, Mr. Kabbani has run
   his family investments and accumulated vast experience in capital markets. Mr. Kabbani graduated from AUC in 1981 with a BA in Economics. He has sat on the Board of
   Directors since 2015.

4. Mr. Nader Ghabbour, Deputy Chief Executive Officer, Mr. Nader Ghabbour brings over 13 years of specialized experience in the automotive industry to his role, which he
   has cultivated through the managerial and operational positions he has held at GB Auto. Prior to his current role, Mr. Ghabbour served as Group Chief Operating Officer,
   where he was responsible for a multitude of vehicular operations in Egypt and the region. Beforehand, he had served as Passenger Car Chief Operating Officer and Project
   Management Officer Leader. Mr. Ghabbour trained in Mergers and Acquisitions at the London Business School in London. He holds a Bachelor of Arts in Business
   Administration from Boston University, and an MBA from IE Business School, Madrid.

                     INVESTOR PRESENTATION | FIRST QUARTER 2020                                                                                                            36
Board of Directors Biographies (2/2)

5. Mr. Abbas El Sayed, Executive Director, joined GB Auto in 2014 as Group Vice President Finance. He has 14 years of experience gained from KPMG and
   Deloitte including 1.5 years in the UK at KPMG UK LLP. Mr. El Sayed has vast experience in corporate finance, restructuring, strategic planning, audit,
   internal controls, advisory and compliance. He holds a BA in Accounting from Ain Shams University. He is a member of the Association of Chartered
   Certified Accountants (ACCA) in the UK and is a Certified Management Accountant (CMA). He has sat on the Board of Directors since 2019.

6. Mr. Mounir Fakhry Abdelnour, Non-Executive Director, brings more than 40 years of economy-centric experience to GB Auto’s Board of Directors. Since
   1970, he has occupied various high-ranking positions at a number of reputable banking institutions and also served in different ministerial posts, including
   Minister of Tourism and Minister of Industry and Trade, among others. In 1976, he co-founded American Express Middle East (AMEX), where he served as
   Vice President and board member until 1980. He was also a founder and Chairman of the Egyptian-French Agro-foods Company between 1983-2014.
   Throughout his career, Mr. Abdelnour served as a board member at the EGX, the National Council for Human Rights, and the Federation of Egyptian
   Industries. He currently sits on the boards of Beltone Financial, Edita and Domty. As an active participant in Egyptian political life, Mr. Abdelnour headed
   the opposition bloc in parliament between 2000-2005 and was a member of the time-honored political party Al Wafd from 2005-2011. He has sat on the
   Board of Directors since 2016.

7. Mr. Mohamed Naguib, Non-Executive Director, has served at the boards of various prominent banks and corporations in Egypt and has accumulated
   nearly 40 years of experience in the fields of Banking, Leasing and Credit. Between 2011 and 2018, Mr. Naguib was Chairman and Managing Director of
   SAIB Bank and prior to that as Vice-Chairman and Head of the Credit and Investment Committee at Banque Misr. Mr. Naguib had also served at Misr
   International (MIBank) for over 20 years as General Manager of Credit and Marketing before joining Incolease as Member of the board from 2000 till
   2010. Furthermore, Mr. Naguib served as Non-Executive Chairman of Misr Bank-Europe in Germany for two years as well as his membership of the boards
   of the National Bank of Egypt, the Civil Aviation Finance Holding Company, and the Small and Medium Sized Projects Fund among many others. Mr. Naguib
   has attended various banking and credit seminars across the United States and the UK in addition to retaining a CPA certification in the state of Colorado
   for 12 years. Mr. Naguib holds a bachelor’s in Accounting from Cairo University and an MBA from the American University in Cairo. He has sat on the
   Board of Directors since 2019.

                   INVESTOR PRESENTATION | FIRST QUARTER 2020                                                                                                     37
Glossary of Commonly Used Terms

CKD   Completely Knocked Down. These are kits imported from the supplier
      and assembled in Egypt, using the locally-mandated percentage of
      domestic parts.

CBU   Completely Built Up. This refers to vehicles that are imported fully-
      assembled.

LOB   Line of Business.

LTR   Light Truck Radial.

OEM   Original Equipment Manufacturer. For instance, Hyundai is the OEM of
      the Hyundai Verna.

OTR   Off-the-road.

PCR   Passenger Car Radial.

TBR   Truck and Bus Radial.

               INVESTOR PRESENTATION | FIRST QUARTER 2020                     38
Thank you       INVESTOR RELATIONS
                      Mansour Kabbani
                      Board of Directors Member

ir.ghabbourauto.com   Andre Valavanis
                      Investor Relations AVP

                      Sarah Maged
                      Investor Relations
                      Communications Manager

                      Marina Kamal
                      Investor Relations Associate

                      Direct: +202 3910 0485
                      Fax: +202 3539 0139

                      E-mail: ir@ghabbour.com

                      Shareholder Information
                      Reuters Code: AUTO.CA
                      Bloomberg Code: AUTO.EY

                      Number of Shares Outstanding
                      1,094,009,733
You can also read