CENTRAL GARDEN & PET FEBRUARY 26, 2019 - AWS
←
→
Page content transcription
If your browser does not render page correctly, please read the page content below
CENTRAL GARDEN & PET
FEBRUARY 26, 2019
PRESENTERS

Niko Lahanas
 Chief Financial Officer

Steve Zenker
 Vice President,
 Investor Relations, FP&A & Communications

                                             2
SAFE HARBOR
"Safe Harbor" Statement under the Private Securities Litigation Reform Act of
1995: The statements contained in this presentation which are not historical facts,
including expectations for improved efficiency and profitability and FY19 guidance are
forward-looking statements that are subject to risks and uncertainties that could
cause actual results to differ materially from those set forth in or implied by forward-
looking statements. These risks are described in the Company's Securities and
Exchange Commission filings. Central undertakes no obligation to publicly update
these forward-looking statements to reflect new information, subsequent events or
otherwise.
This presentation contains certain non-GAAP financial measures. For a reconciliation
of GAAP to non-GAAP financial measures, please see the Reconciliation of GAAP to
non-GAAP in the Appendix of this presentation or in our most recent Form 10-K and
Form 10-Q.

                                                                                     3
CENTRAL GARDEN & PET (NASDAQ: CENT AND CENTA)
• Leading manufacturer and supplier of branded and private label lawn & garden and pet products
• Founded in 1980 as a distribution company. Approximately 21% of revenues today from distribution
• 10% - 15% of revenue from private label products
• In fiscal 2018, Company had $2.2 billion in net sales, approximately 95% of sales in the U.S.
Company Overview
• Acquired over 50 companies in the last 25 years
Sales by Segment (FY 2018) Nationwide Presence
Garden,
39%
Pet, 61%
⚫ Sales & Logistics ⚫ Manufacturing Headquarters
Central has a nationwide multi-category, multi-channel platform
The following cities have multiple facilities: Phoenix, AZ (2); Colorado Springs, CO (2); West Haven, CT (2); Lakeland, FL (2); Plant City, FL (2); Ruskin, FL (4); Atlanta, GA (3); Covington, GA (2); Eatonton, GA (2); Madison, GA (5);
Neptune City, NJ (2); Athens, TX (3), Dallas, TX (2); Greenfield, MO (3); Peebles, OH (2) and Franklin, WI (2)
Not on map: Guelph & Mississauga, Ontario, Canada; Guangzhou & Shanghai, China; Atilxco, Puebla, Mexico; Dorking, Surrey, UK; and Taunton, Somerset, UK
4 4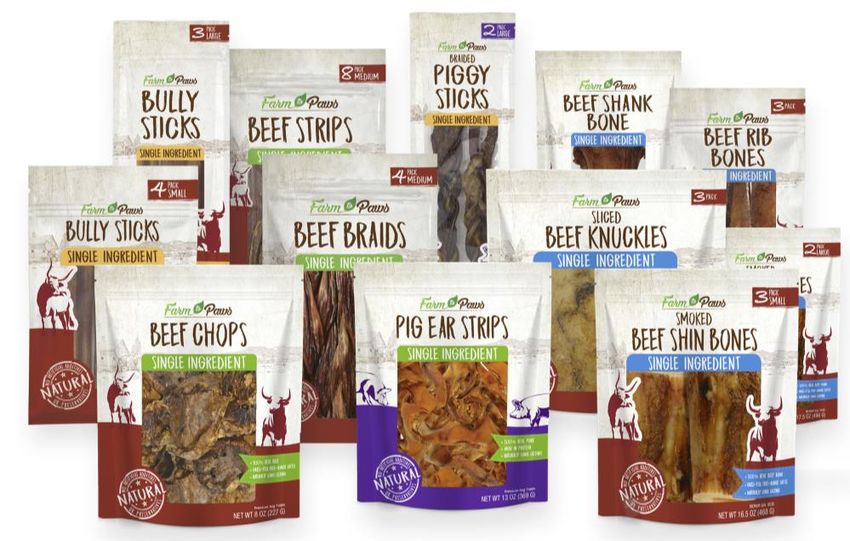
HISTORY OF GROWTH
                                                                                               ’13: John Ranelli named President and CEO
                                                                                               ‘14: Rejected unsolicited proposal from       ‘16: George Roeth named
                                                      ’04: Surpassed $1.5B in Net Sales             Harbinger Group                              President and CEO
                                                                                               ’13 -’15: Focused on “righting the ship”     ‘17: Surpassed $2.0B in Net Sales
                       Milestones

                                      ‘80: Founded                         ’07 -’11: Singular focus
                                                                                                      Transformation period
                                      ‘93: IPO on NASDAQ                   on profit improvement
Company Overview

                                      ‘98: Surpassed $1B in Net Sales

                                    Pre 2003                2003-2006                2007-2011               2011-2013               2013-2015              2016-2019
                       M&A

                   5                                                                                                                                                            5
PROVEN M&A CAPABILITY
                                 …Central Possesses Acquisition Momentum with Several Recent Deals…

                                                                                              2014 – 2018 Deals by Segment & Market Size
                       • Central is a preferred acquirer
                         • Track record of successful M&A - over 50 acquisitions in the                             Live Fish &
                           last 25 years                                                                            Small Animals
Company Overview

                                                                                                      Fertilizers
                         • Provides a national platform for smaller businesses to scale up                                           Live Plants
                         • Acquired businesses generally maintain degree of independence
                       • Few strategic buyers in Pet and Garden industries                   Pet Supplies
                                                                                                                                         Controls
                       • Disciplined buyers
                       • Also investing in joint ventures to drive growth
                       • Have grown recent acquisitions by an average of over 4%                                                    Pet Treats & Chews
                                                                                                       Pet Distribution
                         annually since joining our portfolio

                   6                                                                                                                               6
LATEST ACQUISITIONS

• The largest commercial grower of flowers &    • A leading supplier of pet      • Leading manufacturer & marketer of
  plants in the mid-Atlantic U.S.                 food & supplies in the           outdoor cushions and pillows sold at Home
                                                  Midwest                          Depot, Lowes & Walmart
• Live plants drive traffic to stores
                                                • Fills out company’s national   • Invested in March 2017, 45% position
• Category growing faster than overall Garden     footprint
  industry                                                                       • Purchased remaining 55% February 2, 2019
                                                • Expands Central’s food
• Dedicated on-site “Purple Shirted”              distribution business          • 4 manufacturing plants in the US
  merchandising team to manage deliveries, care
  for the plants and answer consumer            • Provides access to the         • 55 years in business
  questions                                       veterinary channel
                                                                                 • Annual revenues ranging $75M - $100M
•   Growth synergies with existing lawn &
    garden portfolio
•   A very fragmented segment; many
    opportunities for bolt-on acquisitions
•   Expected to be dilutive in FY 2019

                                                                                                                          7
BUSINESS MODEL DRIVES COMPETITIVE ADVANTAGES
                                 Our Broad Product Portfolio and Distribution Footprint Differentiate Central

                       • Broad product portfolio: premium brands through private label programs
                       • Superior knowledge of consumer and marketplace trends as a
Company Overview

                         manufacturer & an owner of distribution networks
                       • Strong customer capabilities and relationships
                       • Leading franchises in most categories or segments
                       • Low cost producer in many categories

                   8                                                                                            8
THE GARDEN INDUSTRY IS SEASONAL WITH A CONCENTRATED SUPPLIER BASE
                                                    The Garden Industry                                                       Central’s Garden Business
                          •     Central participates in $22B of a $40B industry                                    •   Net sales of $874M in 2018
                          •     Home centers & mass merchandisers represent                                        •   19% of segment sales from 3rd party distribution
                                approximately 65% of sales*
                                                                                                                   •   8% revenue growth FY 2018; (1%) organic*** due to
                          •     Seasonal business – 2/3 sales in fiscal Q2 & Q3
                                                                                                                       unfavorable weather
Company Overview

                          •     Industry annual growth rate 0% – 1%
                                                                                                                   •   77% revenue from Walmart, Lowes & Home Depot
                          •     E-commerce not much of a factor
                                                                                                                   •   Widespread market share gains driven by private
                          •     Concentrated supplier base                                                             label and branded products
                                       Garden Industry Retail Sales**
                                                                (in billions)
                                                                                                                        Leading brands in several categories including:
                                                                                           Grass &
                                                                    Packaged             Other Seed,
                                                                     Fertilizer,             $1.5                                                         Specialty Niche
                                                 Live Plants,
                                                    $13.6
                                                                       $5.1        Pesticides,                              Wild Bird Feed   Grass Seed      Controls
                                                                                     $4.3
                              Bird & Wild                                    Bulk Consumables,
                              Animal, $1.9                                          $4.6
                                                                    Outdoor
                                                                   Décor, $5.6
                                Mulch, $0.8                                               Other
                                     Growing                                           Consumables,
                                   Media, $1.7                                             $0.5

                   *2018 National Gardening Survey
                   **Packaged Facts Lawn & Garden Consumables in the U.S 2018, Freedonia Landscape Products 2017
                   *** Adjusted for 53rd week in FY2017
                      9                                                                                                                                                     9
THE PET SEGMENT IS FRAGMENTED WITH ATTRACTIVE GROWTH RATES
                                                             The Pet Industry                                                                                       Central’s Pet Business

                          •     Central participates in $27B of a $58B industry                                                            • Net sales of $1.3B in 2018

                          •     Fragmented customer base                                                                                   • Consumer and professional businesses
                                   •     Less than 20% sales through major pet specialty retailers                                         • 22% of segment sales from 3rd party distribution
                                   •     7,300 independent retail stores
                                                                                                                                           • 8% revenue growth FY 2018; 5%** organic growth
Company Overview

                                   •     Mass market, club, e-Commerce
                           •    Diverse supplier base of 1,400 global manufacturers                                                        • E-commerce growth superseding decline in pet specialty
                           •    Industry annual growth rate – 2 – 4%                                                                                  Leading brands in several categories including:
                           •    Dynamics are changing                                                                                                                Small Animal, Bird
                                                                                                                                      Aquatic Tanks &                                          Pet Beds
                                    •     E-commerce accounts for over 10% of sales and is growing                                       Supplies                     Feed & Supplies
                                          double digits
                                                      Pet Industry Retail Sales*
                                                                      (in billions)
                                        Dog & Cat Treats &
                                           Chews, $6.0             Natural Dog &
                                                                     Cat Food,
                                                                       $6.6
                                              Non-Food Supplies,                                                                                                                                Equine
                                                                                                                                                           Live Fish & Small Animals
                                                    $16.8             Other Pet Food,
                                                                          $26.5
                                                   Live Animals,
                                                       $2.4

                   * Packaged Facts Durable Dog & Cat Petcare Products in the U.S.2018, Fish, Reptile, Small Animal & Pet Bird in the U.S. 2018 and Treats & Chews 2017
                   ** Adjusted for 53rd week in FY2017
                        10                                                                                                                                                                              10
CENTRAL’S BROAD PRODUCT PORTFOLIO IS UNIQUE
Commentary Company Garden Products Pet Products
• Participant in a
Animal Health –
Food, Treats &
Animal Health
Bird & Small
Fertilizers
Grass Seed
Aquatics &
Professional
Dog & Cat
Dog & Cat
Wild Bird
Live Plants
Consumer
number of categories
Controls
Supplies
Reptile
Animal
Décor
Chews
Feed
across Garden & Pet
• Broad portfolio
provides multiple
Company Overview
levers for growth Central Garden &
Pet
• Wide range of Scotts Miracle-Gro
products allows for
economies of scale Spectrum Brands
and market
advantages Hartz Mountain
• Central has Fresh Pet
leadership and
Smucker’s
differentiated
expertise in major Pet IQ
participant categories
Major participant Meaningful participant Minor participant
11 11OUR MARKETS*
Market Opportunity
$6B Dog & Cat
Supplies
$5B
Company Overview
Garden
Live
Pet
$4B Plants Both
Dog & Cat
Treats &
= Size of circle is Central’s 2018 sales
Chews Source: Internal estimates – U.S. wholesale markets
Natural
$3B (Dog & Cat) Nutrition Fertilizer *Excludes third-party distribution sales
** Includes live fish or live animals
Controls
$2B
Animal Health/
Animal
Consumer
Health/
Prof’l Grass Wild
$1B Decor
Small
Aquatics** Animal/
Seed
Retail
Bird
Feed
Pet Bird** &
Equine Other
Low Medium High
Current Market Share
12 12RECENT ACQUISITIONS EXPAND ADDRESSABLE MARKET
Prior to 2015* 2019*
$30.5B $46.7B
Fertilizers Fertilizers
Live Plants Controls Aquatics &
Equine Controls Reptile
Décor
Equine Bird & Small Animal
Premium Pet
Nutrition Aquatics Premium Pet Dog & Cat
& Nutrition Treats/ Chews
Dog & Cat Reptile
Dog & Cat Dog & Cat
Treats/ Chews
Supplies Supplies
*Excludes businesses that were divested
Normalized for changes in Packaged Facts methodologies
Source – Packaged Facts & company estimates
13STRONG 2018 RESULTS
GAAP
$ in millions except EPS For the Fiscal Year Ended September Non-GAAP 1,2
2017 2018 Change Change
Net Sales/Organic Net Sales $2,054 $2,215 7.8% 2.6%
Performance Track Record
Gross Margin % 30.8% 30.5% (30 bps) -
Operating Income $156.1 $167.3 7.2% 8.6%
Operating Margin % 7.6% 7.6% - -
Net Income $ 78.8 $123.6 56.8% 31.7%
Diluted EPS1 $ 1.52 $2.32 52.6% 27.3%
12018 non-GAAP diluted EPS excludes the tax impact of the revaluation of the Company’s deferred tax accounts and presents organic sales information
22018 non-GAAP revenue comparison excludes an extra week in prior year
14 14METRICS ACCELERATING OVER THE LAST THREE YEARS
Net Sales Operating Margin
(in billions) 10%
$2.5 $2.2 9%
$2.1 7.6%
$2.0 8% 7.6%
$1.7 $1.8 7.1%
$1.7 $1.6 $1.7 7%
$1.5 6% 5.5%
5% 4.4%
$1.0
Performance Track Record
4% 3.5%
3% 2.4%
$0.5
2%
$- 1%
FY12 FY13 FY14 FY15 FY16 FY17 FY18 0%
FY12 FY13 FY14 FY15 FY16 FY17 FY18
EBITDA & EBITDA Margin* Diluted EPS*
(in millions)
$2.50 $2.32
$250 12.0%
$225 $215
$199 $2.00 $1.91
10.7% 10.0%
$200 $1.52
$169 $1.50
$175 9.7% $1.50
8.0% $1.26
9.2%
$150
$125
$125 $105 6.0% $1.00 $0.87
7.6% $0.74
$100 $92 $0.64
6.2%
$73 5.7% 4.0% $0.50
$0.44
$75 $0.18 $0.33
4.4% $0.20
$50 $(0.04)
2.0% $-
$25 2012 2013 2014 2015 2016 2017 FY18
$- 0.0%
FY12 FY13 FY14 FY15 FY16 FY17 FY18 $(0.50)
GAAP Non-GAAP*
*See non-GAAP reconciliations in the appendix
15 15STRONG CASH FLOW
EBITDA* Cash Provided by Operations
(in millions) (in millions)
$151
$160
$250
$215 $140 $126
$225 $199 $114 $114
$120
$200
$175 $169 $100 $89 $87
$150 $132 $80
$125 $114 $105 $60 $51
$104
$100 $92 $40
$75 $20
$50 $-
$25 -$20
$- $(28)
-$40
FY11 FY12 FY13 FY14 FY15 FY16 FY17 FY18
FY11 FY12 FY13 FY14 FY15 FY16 FY17 FY18
Long-Term Debt (year end) Leverage Ratio**
(in millions)
$692 6.0
$700
4.9
$600 5.0 4.4
4.0
$500 $449 $472 $450 4.0 3.6
$435 $400 $395 $395 3.2
$400 2.8
3.0
$300 2.2 1.9
2.0
$200
$100 1.0
$- 0.0
FY11 FY12 FY13 FY14 FY15 FY16 FY17 FY18 FY11 FY12 FY13 FY14 FY15 FY16 FY17 FY18
* See non-GAAP reconciliation in the appendix **As calculated per the terms of our 2017 Credit Agreement
16Q1’19 RESULTS
GAAP
$ in millions except EPS For the Fiscal Year Ended September Non-GAAP 1
Q1’18 Q1’19 Change Change
Net Sales/Organic Net Sales $442.0 $462.0 4.5% (1.7)%
Gross Margin % 29.8% 28.2% (160 bps) -
Performance Track Record
Operating Income $22.5 $10.2 (54.7)% -
Operating Margin % 5.1% 2.2% (290 bp) -
Net Income $ 26.2 $1.8 (93.1)% (81.8)%
Diluted EPS1 $ 0.50 $0.03 (94.0)% (84.2)%
EBITDA $33.7 $22.5 - (33.1)%
12018 non-GAAP diluted EPS excludes the tax impact of the revaluation of the Company’s deferred tax accounts and presents organic sales information
• 1Q’19 results impacted by numerous factors:
• Impact of recent acquisitions – will anniversary at end of 2Q. Bell Nursery is a seasonal business that generates a sizeable
loss in Q1.
• Added interest expense due to bond issuance
• Higher freight, labor, and raw material costs – price increases taken to mitigate impact going forward
• Timing of customer orders – expected benefit later in year. Without timing shift, organic growth would have been positive.
• Less favorable mix of sales – expected to be more favorable in second half of year
17 17HISTORIC TOTAL COMPANY ORGANIC GROWTH
10.0%
8.0% 7.6%
7.0%
6.1%
6.0%
5.0%
4.0% 3.6% *
*
2.6% 2.8%
1.7%
2.0% 1.1%
0.0%
-0.1%
-2.0% -1.7%
-4.0%
Q3 Q4 Q1 Q2 Q3 Q4 Q1 Q2 Q3 Q4 Q1
FY16 FY17 FY18 FY19
YOY Quarterly Growth Rate 4-Qtr Rolling Avg Growth Rate
*Adjusted for 53rd week in Q4 2017
3/6/2019 182019 GUIDANCE*
• Company expects overall revenue growth in mid-single digits
• Organic revenue growth consistent with LT annual target of 2% - 3%
Performance Track Record
• Company expects fully-diluted EPS of $1.80 or higher, a decrease from FY 2018 due to:
• Higher projected tax rate
• Increased shares outstanding from 8/18 equity offering
• Impact from Bell Nursery acquisition on results in first half of year
• First two quarters generate losses and were not in prior year’s results
* Excludes any impact from recent Arden acquisition
19FACTORS FAVORING BETTER SECOND HALF RESULTS
1) Lack of dilution from Bell Nursery and General Pet
Acquisitions will anniversary at end of Q2
2) An unfavorable weather season last year
Impacted consumer garden and professional purchases of fly and other pest control products
3) Continued share gains from new products and increased distribution
4) Margins should improve significantly
Price increases near beginning of Q2
Easier comparisons, especially Q3 & Q4, as inflationary pressures expected to lessen from a year ago
A more favorable mix of business - weather, growth in Pet D, and product issues all unfavorably impacted
mix last year
Continued cost savings benefits
5) Offsets to the above factors negatively impacting results
Higher shares outstanding
Higher tax rate
Purchase price accounting on Arden purchase
20CENTRAL GARDEN & PET STRATEGY
Accelerate the portfolio • Manage businesses differentially based on clearly articulated strategies.
growth momentum • Build out our portfolio in attractive broadly defined Pet & Garden markets.
• Ensure sufficient demand creation investment to drive organic growth & build share.
• Develop more differentiated & defensible new products with a 3-year pipeline of opportunities.
Keep the Core Healthy
• Build on our strong customer relationships by developing and executing winning category
growth strategies.
Strategy
• Free up businesses to compete in ecommerce by ensuring we have the right policies, products
Build digital capabilities for and programs to allow all channels to compete effectively.
competitive advantage and • Optimize the supply chain for high-demand ecommerce items to ensure customer and
compelling consumer consumer availability requirements are met at the optimal cost.
experiences • Expand data and analytics capability to accelerate business insights.
• Optimize our supply chain footprint.
Drive Cost Savings &
• Improve our operating efficiency with a continuous improvement mindset.
Productivity to Fuel Growth
• Improve coordination by sharing best practices and aligning for scale.
Attract, Retain and Develop Exceptional Employees
21 21DEVELOP MORE DIFFERENTIATED AND DEFENSIBLE NEW PRODUCTS
• New brand for the Pet Specialty Channel and Independent
Pet Retailers
Keep the Core Healthy
• Collection of single & limited ingredients
• Minimally processed treats & chews
Four Paws Wee Wee
• Stain & Odor and pads
• Wee-Wee Professional Strength
• Febreze license
22 2222DEVELOP MORE DIFFERENTIATED AND DEFENSIBLE NEW PRODUCTS
Pennington Lawn Booster
• Combination grass seed, fertilizer & soil enhancer
• For quicker, thicker, greener grass
• Feeds for up to 12 weeks
• Corrects the pH and loosens the soil
• Uses up to 30% less water year after year
Pennington Smart Blend
• Drought tolerant premium grass seed mix with fertilizer
• Protection from fungus
• Feeds for up to 8 weeks
• Ideal mixture for your region
• Available exclusively at Costco warehouses
23BUILD DIGITAL CAPABILITIES FOR COMPETITIVE ADVANTAGE
AND COMPELLING CONSUMER EXPERIENCE
• Free up businesses to compete in ecommerce by ensuring we have the right policies, products and
programs to allow all channels to compete effectively.
• Optimize the supply chain for high-demand ecommerce items to ensure customer and consumer
availability requirements are met at the optimal cost.
• Expand data and analytics capability to accelerate business insights.
• Increased investment in demand creation and customer facing digital resources.
24IMPROVE COORDINATION BY SHARING BEST PRACTICES
AND ALIGNING FOR SCALE
Drive Cost Savings & Productivity to Fuel Growth
AMDRO Quick Kill® Mosquito Controls
Only brand to offer full line of solutions aligned with CDC
recommendation
▪ Cross-company collaboration
▪ Larvicide & Adulticide – control products and inhibit breeding
▪ Works faster, longer than competitive products
25BUILD ON OUR STRONG CUSTOMER RELATIONSHIPS BY DEVELOPING AND
EXECUTING WINNING CATEGORY GROWTH STRATEGIES
• Provide direction, fueled by consumer insights and specific customer understanding,
on how our retail partners can grow their category sales and profits
• Merchandising
Keep the Core Healthy
• Assortment
• Pricing
• Shelving
Major food retailer’s 2,900+ locations – outsourced pet supply solution
26 26A DEDICATED STAFF OF NOW OVER 5,400 EMPLOYEES
Working in 92 Locations Throughout the United States, Canada, Mexico, China and UK
Attract, Retain & Develop Exceptional Employees
27 27INVESTMENT THESIS
1) Underlying trends in both garden and pet categories are favorable
2) The company is operating with a continuous improvement mindset – and has ample
opportunities to take 1% to 2% out of costs per year
3) Cost savings expected to fund growth levers, e.g. R&D, selling, marketing, trade
promotions, to fuel organic growth thus creating a virtuous cycle
4) Cash flow and balance sheet are strong, providing flexibility to make strategically
sound acquisitions
5) Competitive advantages driven by scale and distribution networks in Garden and Pet
6) The company is small relative to large global CPG players, so reasonably modest
changes can have a big impact on total performance
7) We have $8+ per share in cash on the balance sheet and a history of building value
through acquisitions
8) We have delivered four successive years of strong growth and financial performance
28 28QUESTIONS & ANSWERS
Arden Companies
29 29FERTILIZERS
Consumer fertilizer sales are approximately $2.8B
Home Centers are still the preferred shopping destination and maintain the largest retail share
L&G Retailer Share 2017*
Mail Order,
Internet, 5%
2%
Supermarket /
Drug Store, 9% Home Center,
26%
Other , 9%
Hardware Mass
Store, 14% Merchandise,
Garden
Center, 16% 18%
• We offer consumers differentiated value-add products for their lawn, landscape and garden.
• Our portfolio includes traditional, organic and hydroponic options.
Industry Market – Fertilizer • We specialize in soil solutions with specialty mineral supplements (Iron, Lime, Gypsum,
Sulfur etc.)
• In 2019 we’ve consolidated several regional brands into a full line of Pennington branded
lawn fertilizers.
Western U.S. Northern U.S.
Midwestern U.S.
23.0 %
23.0 % 20.0% • Leveraging consumer insights for packaging and product claims for differentiation.
Southern U.S.
34 %
*National Gardening Survey, 2018 Edition
30 30CONTROLS
Consumer pesticide sales are approximately $2.3B - Retail
U.S. household participation in Lawn & Garden is at an all-time high of 77%*
Industry Sales of Outdoor Controls**
Fire Slug &
Outdoor Ants 5% Snail 3% Lawn Fungicides
Insecticides 9% 2%
Surface
Insects 24%
Non
Selective
Herbicides
21% Selective Household
Herbicides 22%
12%
Rose &
Flower 2% • Our Portfolio includes well established and trusted brands.
• Sevin, Corry’s and AMDRO have been in market for decades.
• Newer strong brands like Over’n Out and Moss Out have been introduced.
Industry Market – Outdoor Controls***
• AMDRO® was originally an Ant Killing brand
• Successfully extended outside of this core
Western U.S.
Midwestern U.S. Northern U.S. • New solutions in multi insect, wood destroying insects, mosquito and
20.0 %
21.0 % 16.0% rodent control
Southern U.S.
43.0 %
*National Gardening Survey, 2018 Edition
**Packaged Facts Lawn & Garden Consumables in the U.S. by Market & Product, 9 th Edition 2018 31
***Source: Kline Report, Internal Market Research and Volume Estimates, IRI pesticide category dataGRASS SEED
A broad line of product with an emphasis on superior performance & technology
• Grass Seed Industry
• Estimated at $955 MM
• 61% of all grass seed sales in the Southeast & Northeast
• Central is the largest grass seed manufacturer
• Package & ship 160M pounds of turf grass annually
• Central is the largest seed producer
Appendix
• Over 40K acres contracted for seed production
• Over 100K acres production purchased annually
• Two facilities dedicated to turf grass research
Lawn Care Dollar Sales by Region*
24%
18%
21%
37%
*2018 National Gardening Survey
30% Less Water claim: NexGen Turf Research
32 32LIVE PLANTS
• Bell Nursery ranked #7 of Top 100 Growers
• No major players in this industry; many opportunities for bolt-on acquisitions
• Approximately 33K businesses
• Key drivers - Demand from nursery & garden stores, flower & nursery stock wholesalers
• In past 5 years, emphasis on quality has driven product improvement
Appendix
• Improved flower life for potted plants Industry Sales**
Cut
• Irrigation Potted Herbaceous
Perennials, 9%
Flowers, 1%
Follage
• Disease resistance Potted Flowering Plants, 7%
Plants, 10%
Nursery
• Barriers to entry are moderate due to levels of capital investment Annual Bedding
& Garden
Stock
Crops, 39%
including real estate, greenhouse construction, cooling rooms, Plants, 24%
equipment including irrigation and machinery Propogative
Floriculture
Materials,
6%
Short Rotation
Woody Trees, 4%
*Greenhouse Growers 2017
**Source IBIS World Industry Report 11142 Plant & Flower Growing in the U.S. – May 2017
33 33PENNINGTON DÉCOR
The Home and Garden Décor category is the focal point of every living space; from indoor design through to an outdoor oasis. Central’s
Pennington® Décor offers a wide array of products and families to inspire, simplify and educate the consumer in the beauty of decorating.
1. Scale: Central is the #1 planter company in the USA. Now extending into multiple Décor
categories. Known as the category leader in marketplace trends and consumer expertise.
2. Logistics: The only nationwide distributor of garden décor products. Directly
importing from 8 countries worldwide.
3. Category Management & Innovation: The art of merging trends with
Appendix
shopper insights drive Right Product * Right Outlet * Right Price.
34 34WILD BIRD FEED
Pennington® & Kaytee® together shipped over 450M pounds in 2018
Brand Segment Distribution Industry Sales
Predominantly sold in the mass channel with
Pennington Garden additional home improvement channel distribution
Sold primarily in small format hardware (Ace, True
Kaytee Pet Value), grocery stores, farm/agriculture and pet
Appendix
specialty stores
Over 35% of every dollar spent by U.S. Households on Wild Bird
is for Pennington or Kaytee branded products.
Driving category demand through
innovative programs and partnerships:
In Elementary Schools and Homeschools: Educator and
student links on POS for classroom lessons and activities
to create the next generation of bird watchers. Lesson
plans, feeders and coupons distributed via Cornell kits to
teachers and Facebook outreach.
* Industry data based on Nielsen and internal assumptions
35 35 35DISTRIBUTION
Garden Pet
• 19% of Garden segment revenue from 3rd party • 22% of Pet segment revenue from 3rd party products
products
• Distributes products, foods and provides service to over 7K
• Distribution services over 12K “ship to” locations in retailers and 3K vet clinics throughout the continental US,
all 50 states Alaska & Hawaii
• Stocks over 8K SKUs from over 325 vendors to • Stocks nearly 36K unique items from nearly 400
Appendix
ensure we meet the assortment needs of our manufacturers offering the largest assortment of pet
customer base products in the industry
Garden Distribution Sales Pet Distribution Sales
Key
Accounts Other
National
Commercial
Mass Accounts
National
Chains
Independents Independents
By distributing other manufacturers’ products, Central is better able to influence shelf space at retail.
Also, ensures regional assortment needs of customers are met beyond core Central portfolio.
36 36DOG & CAT SUPPLIES
Nylabone®, Four Paws® , DMCTM and
K&H™ Four Paws® provides high quality solutions for pet parents
in a wide array of product categories, including waste
Nylabone® makes high-quality chew toys to meet all management via Wee-Wee® branded products, dog & cat
the different chew types and chew styles of dogs and grooming solutions via Magic Coat™ grooming tools and
puppies because all dogs need to chew. cleansers, health & wellness remedies & containment gates
and outdoor pet restraints.
Appendix
Industry Sales by Category*
Cat litter &
accessories Collars/ Leashes/ DMCTM is the largest provider of quality dog and cat bedding in the U.S. This number
5% Harnesses Toys
21%
one share position is being leveraged in adjacent segments.
33%
Bowls/Feeders &
Waterers
Carriers/ Crates/ Beds
8%
Housing 14%
13%
Apparel/ Fashion Acc.
6% K&H Pet Products® produces premium pet supplies and is the largest marketer of
heated pet products in the U.S. Products in several categories including dog & cat,
* Based on Packaged Facts Durable Dog & Cat Petcare Products 2018 small animal and farm & ranch.
37 37
37DOG & CAT FOOD, TREATS AND EDIBLE CHEWS
Nylabone®, IMS™, Breeder’s Choice
Edible Dog & Cat Treats & Chews is a $6.0B category & projected to grow an average of over 5% annually*
Nylabone offers natural edible chews and treats that are IMS Pet is launching a new brand for the Pet Specialty
wholesome and tasty way to occupy, reward, train, and channel. Introducing Farm to Paws™ - A collection of single and
maintain a dog’s dental health. limited ingredients, minimally-processed dog treats and chews.
The Cadet® brand offers a full line of high quality rawhide
chews, natural chews and jerky treats for dogs.
Appendix
Dog & Cat Treats & Chews*
Sales by Category
Cat 15% Rawhide/ Long-
Lasting Edible Breeder’s Choice Brands
Functional Treats/ Chews 25%
Chews 10% Super premium, specialty channel brand providing holistic health with healthy skin & coat benefits
Dental Chews through avocados, an omega rich super food, and premium, natural ingredients.
Indulgent/ Soft & Treats 15%
Treats 35%
Super premium, independent channel brand providing holistic health from super premium, natural
ingredients.
* Based on Packaged Facts Pet Treats & Chews in the U.S., 2017
38 38 38SMALL ANIMAL & PET BIRD
Kaytee ®
Kaytee has the #1 share in the combined Pet Bird & Small Animal Category
Small ALSO 51%
Kaytee is the only brand to offer consumers a complete
Mammal OWN…
solution from food, treats, bedding, hay and habitats
Owners
68% CAT
28%
Appendix
DOG FISH
Most Small Mammal Owners also own other animals making
them important for the entire pet industry
Small Pet
Households
with 61%
Children
Small Animal ownership is influenced by children, making it an
important experience for a lifetime of pet companionship
39 39 39AQUATICS
Aqueon® and Zilla
Make getting into the hobby and keeping fish/reptiles easy.
• A leading aquatics manufacturer in U.S. • Single brand name across all consumer touch
• Complete line of aquatic products from one brand points improves shop-ability
Appendix
• Easy to find solutions for the entry level customer • Provides consumers with reassurance that all
the products will work together
• Developed for pet specialty
• Developed for pet specialty
• Follows proven success of Aqueon brand
roadmap – habitats to consumables to
promotion
40 40LIVE FISH, REPTILES, SMALL ANIMALS & PET BIRDS
Segrest Inc. is the leading wholesaler of quality pets, aquatic, small animals, birds and reptiles.
Small Animal, 5%
Bird, 11%
Saltwater
Growth and Leadership: Fish, 14%
Freshwater Fish, 70%
Appendix
• Growing the market through industry leadership
• Providing healthy companion animals & retailer education on Animal Husbandry
• Leading the industry in best practices for sustainability and eco-responsibility
Partnerships and Synergies:
• Supplying pet stores, public aquariums & research institutions
• Significant synergies with existing aquatics business
41ANIMAL HEALTH - PROFESSIONAL
• Over 45 years ago, invented insect growth regulator (IGR) technology which uses the insect’s natural
chemistry as a means to reduce disease-spreading and profit-reducing pest populations
• Pest control solutions with a proven record of efficacy, recommended by professionals, with products
used in sensitive areas including schools, hospitals and food handling, as well as in neighborhoods,
farms and grain handling facilities
Appendix
Livestock Insect Control Mosquito Control Home Pest Fire Ants Grain Protection
Industry Sales
in millions
Grain Insect
Control, $51 Farm Fly Control,
$118
Active Ingredient,
$275
Pest Control,
$322 Vector
Control, $880
42 42ANIMAL HEALTH & WELLNESS – CONSUMER PRODUCTS
Updated 1/7/19 Lazarczyk
Flea & Tick Control Behavior Management
Comfort Zone® is a leading brand in pet behavior management
bringing thoroughly tested, superior-performing products to market
that are safe, effective, and that drive Category growth.
Facts:
ADAMS™ offers a smarter approach to pet care ➢ 2/3 of cat & dog households report behavior problems
making protecting your pet, family, home, and yard ➢ Behavior problems are responsible for 30-40% of animals in shelters
from fleas & ticks easier and more effective.
➢ 6.5M dogs & cats enter shelters every year
Available at leading retailers nationally.
➢ Comfort Zone® products help solve cat and dog behavior problems!
New Premium F&T
Dog Collars, and
Foaming Shampoo New Comfort Zone™ Dog Vests launched
for 2019 in 2018 helping canines with noise phobias,
separation anxiety, travel and vet visit
Zodiac brand offers unique pet, home and yard
Voted 2019 ‘Product of the Year’!
products sold in Independent Pet, Pet Specialty
and at leading Farm Chain retailers
Central Garden & Pet is dedicated to improving the lives and well-being of pets through innovative solutions that meet the evolving needs of pets and their parents.
43 43
* Based on Braake, ARA Scan & Panel DataEQUINE
Central Garden & Pet’s Equine Brands
Comprehensive Horse Care:
• Complete range of horse care products to keep horses healthy inside and out, from
head to hoof
Fundamental Horse Care:
• Fundamental care and ingredient-focused products for the experienced horseman
Performance Horse Care:
Appendix
• Industry thought leadership by providing solutions for elite performance horses
For over 70 years, generations of horse owners have known and trusted our products as effective fly
control, dewormers, top quality feed supplements, grooming products and more.
Industry Equine Sales for 2017*
• The total population of ‘cared-for’ horses is about 2.5M
Deworming, Total Market • On average, each horse owner has 5 horses
Grooming, 16% • We estimate 500k horse owners drive category purchases
16%
Size
Supplements, • Total retail dollars spent industry-wide in 2017 on equine products: $1.9B
Fly Control, 57%
11% Improve the Lives of Horses by offering:
Consumer—Comprehensive horse care products and knowledge whenever and
Go-To-Market
wherever needed.
* Based on Brakke Equine Market Study
Strategy Customers—Exceptional horse care business expertise whether a Distributor
or Retailer.
44 44GAAP TO NON-GAAP RECONCILIATION
Use of Non-GAAP Financial Measures
We report our financial results in accordance with U.S. generally accepted accounting principles (GAAP). However, to
supplement the financial results prepared in accordance with GAAP, we use non-GAAP financial measures including organic net
sales on a consolidated and segment basis, non-GAAP selling, general and administrative (SG&A) expense, non-GAAP operating
income on a consolidated and segment basis, non-GAAP interest expense, non-GAAP other income (expense) and non-GAAP
net income and diluted net income per share. Management believes these non-GAAP financial measures that exclude the impact
of specific items (described below) may be useful to investors in their assessment of our ongoing operating performance and
provide additional meaningful comparisons between current results and results in prior operating periods.
Appendix
The reconciliations of these non-GAAP measures to the most directly comparable financial measures calculated and presented in
accordance with GAAP are shown in the tables below. We believe that the non-GAAP financial measures provide useful
information to investors and other users of our financial statements, by allowing for greater transparency in the review of our
financial and operating performance. Management also uses these non-GAAP financial measures in making financial, operating and
planning decisions and in evaluating our performance, and we believe these measures similarly may be useful to investors in
evaluating our financial and operating performance and the trends in our business from management's point of view. While our
management believes that non-GAAP measurements are useful supplemental information, such adjusted results are not intended
to replace our GAAP financial results and should be read in conjunction with those GAAP results.
We have not provided a reconciliation of forward-looking non-GAAP guidance measures to the corresponding GAAP measures,
because such reconciliation cannot be done without unreasonable efforts due to the potential significant variability and limited
visibility of the excluded items discussed below.
45 45GAAP TO NON-GAAP RECONCILIATION (CONTINUED)
Non-GAAP financial measures reflect adjustments based on the following items:
• Asset impairment charges: We have excluded the impact of asset impairments on intangible assets and equity method
investments as such non-cash amounts are inconsistent in amount and frequency. We believe that the adjustment of these charges
supplements the GAAP information with a measure that can be used to assess the sustainability of our operating performance.
• Tax Reform Act: The U.S. government enacted comprehensive tax legislation commonly referred to as the Tax Cuts and Job Act
in December 2017. We have excluded the transitional impact of the Tax Reform Act as the remeasurement of our deferred tax
assets and liabilities does not reflect the ongoing impact of the lower U.S. statutory rate on our current year earnings.
• Gains on disposals of significant plant assets: We have excluded the impact of gains on the disposal of significant plant
assets as these represent infrequent transactions that impact the comparability between operating periods. We believe the
Appendix
adjustment of these gains supplements the GAAP information with a measure that may be used to assess the sustainability of our
operating performance.
• Loss on early extinguishment of debt: We have excluded the charges associated with the refinancing of our 2018 Notes as
the amount and frequency of such charges is not consistent and is significantly impacted by the timing and size of debt financing
transactions.
• Tax impact: adjustment represents the impact of the tax effect of the pre-tax non-GAAP adjustments excluded from non-GAAP
net income. The tax impact of the non-GAAP adjustments is calculated based on the consolidated effective tax rate on a GAAP
basis, applied to the non-GAAP adjustments, unless the underlying item has a materially different tax treatment.
• Organic net sales: a non-GAAP measure that excludes the impact of businesses purchased or exited in the prior 12 months,
because we believe it permits investors to better understand the performance of our historical business without the impact of
recent acquisitions or dispositions. For fiscal 2017, we have also adjusted our organic net sales for our estimate of the impact of
the extra week on our 2017 fiscal year net sales.
46 46GAAP TO NON-GAAP RECONCILIATION (CONTINUED)
Non-GAAP Adjustments
GAAP to Non-GAAP Reconciliation
(in thousands)
For the Fiscal Year Ended September,
2018 2017
Appendix
(Gain)/loss on disposal of plant assets $ $ (2,050)
-
Total non-GAAP adjustments $ - $ (2,050)
Tax effects of non-GAAP adjustments 757
Tax effect of revaluation of deferred tax amounts (21,485) -
Total net income impact from non-GAAP adjustments $ (21,485) $ (1,293)
47 47GAAP TO NON-GAAP RECONCILIATION (CONTINUED)
Non-GAAP Adjustments
GAAP to Non-GAAP Reconciliation
(in thousands)
For the Quarter Ended December,
Q1’19 Q1’18
Appendix
GAAP net income attributable to Central Garden & Pet $1,803 $ 26,247
Tax effect of revaluation of deferred tax amounts - 16,343
Non-GAAP net income attributable to Central Garden & Pet $1,803 $ 9,904
GAAP diluted net income per share $0.03 $0.50
Non-GAAP diluted net income per share $0.03 $0.19
Shares used in GAAP and non-GAAP diluted net earnings per share 58,001 52,695
calculation
48 48GAAP TO NON-GAAP RECONCILIATION (CONTINUED)
Organic Net Sales Reconciliation
We have provided organic net sales, a non-GAAP measure that excludes the impact of recent acquisitions and dispositions, because we believe it permits investors to
better understand the performance of our historical business. We define organic net sales as net sales from our historical business derived by excluding the net sales from
businesses acquired or exited in the preceding 12 months. After an acquired business has been part of our consolidated results for 12 months, the change in net sales
thereafter is considered part of the increase or decrease in organic net sales.
Organic Reconciliation
GAAP to Non-GAAP Reconciliation
(in thousands)
For the Fiscal Year Ended September 29, 2018
Appendix
Consolidated Pet Segment Garden Segment
Percent Percent Percent
Change Change Change
Reported net sales FY18 – GAAP $2,215.4 $1,340.9 $847.5
Reported net sales FY17 – GAAP 2,054.5 1,246.4 808.1
Increase in net sales 160.9 7.8% 94.5 7.6% 66.4 8.2%
Effect of acquisition and divestitures on increase
in net sales 140.3 56.2 84.1
Increase (decease) in organic net sales 20.6 1.0% 38.3 3.1% (17.7) (2.2)%
Estimated impact of extra week in Fiscal 2017
on organic sales 32.8 21.4 11.4
Organic net sales adj. for extra week $ 53.4 2.6% $ 59.7 4.8% $ (6.3) (0.8)%
49 49GAAP TO NON-GAAP RECONCILIATION (CONTINUED)
Organic Net Sales Reconciliation
We have provided organic net sales, a non-GAAP measure that excludes the impact of recent acquisitions and dispositions, because we believe it permits investors to
better understand the performance of our historical business. We define organic net sales as net sales from our historical business derived by excluding the net sales from
businesses acquired or exited in the preceding 12 months. After an acquired business has been part of our consolidated results for 12 months, the change in net sales
thereafter is considered part of the increase or decrease in organic net sales.
Organic Reconciliation
GAAP to Non-GAAP Reconciliation
(in thousands)
For the Quarter Ended December 29, 2018
Appendix
Consolidated Pet Segment Garden Segment
Percent Percent Percent
Change Change Change
Reported net sales Q1’ FY19 – GAAP $462.0 $340.4 $121.6
Reported net sales Q1’ FY18 – GAAP 442.0 325.1 116.9
Increase in net sales 20.0 4.5% 15,3 4.7% 4.7 4.0%
Effect of acquisition and divestitures on increase
in net sales 27.3 17.2 10.1
Decrease in organic net sales – Q1 2019 $ (7.3) (1.7)% $ (1.9) (0.6)% $ (5.4) (4.6)%
50 50GAAP TO NON-GAAP RECONCILIATION (CONTINUED)
Consolidated Operating Income
Reconciliation
GAAP to Non-GAAP Reconciliation
(in thousands)
For the Fiscal Year Ended September,
2018 2017 2016 2015 2014 2013 2012
GAAP operating income $167,336 $156,112 $129,358 $91,435 $56,213 $40,155 $74,421
Total operating income impact from non-
Appendix
GAAP adjustments - (2,050) (535) 7,272 12,033 18,870 -
Non-GAAP operating income $167,336 $154,062 $128,823 $98,707 $68,246 $59,025 $74,421
GAAP operating margin 7.6% 7.6% 7.1% 5.5% 3.5% 2.4% 4.4%
Non-GAAP operating margin 7.6% 7.5% 7.0% 6.0% 4.2% 3.6% 4.4%
51 51GAAP TO NON-GAAP RECONCILIATION (CONTINUED)
EBITDA Reconciliation
GAAP to Non-GAAP Reconciliation
(in thousands)
For the Fiscal Year Ended September,
2018 2017 2016 2015 2014 2013 2012
Net income (loss)attributable to Central
Garden & Pet $123,594 $78,828 $44,514 $31,971 $8,804 $(1,929) $21,173
Appendix
Interest expense, net 36,051 28,062 42,707 39,898 42,750 42,970 40,170
Other expense (income) 3,860 1,621 17,013 (13) (403) 677 (678)
Income tax expense (benefit) 3,305 46,699 24,053 18,535 4,045 (2,592) 12,816
Net income attributable to noncontrolling
interest 526 902 1,071 1,044 1,017 1,029 940
Sum of items below operating income 43,742 77,284 84,844 59,464 47,409 42,084 53,258
Income from Operations 167,336 156,112 129,358 91,435 56,213 40,155 74,421
Depreciation & Amortization
47,199 42,719 40,001 33,703 35,781 32,968 30,425
EBITDA $214,535 $198,831 $169,359 $125,138 $91,994 $73,123 $104,846
52 52GAAP TO NON-GAAP RECONCILIATION (CONTINUED)
EBITDA Reconciliation
GAAP to Non-GAAP Reconciliation (in thousands)
For the Quarter Ended December 29, 2018
Garden Pet Corp Total
Net income (loss)attributable to Central Garden & Pet - - - $1,803
Interest expense, net - - - 8,077
Other income - - - 192
Income tax expense - - - 273
Net income attributable to noncontrolling interest - - - (164)
Sum of items below operating income - - - 8,378
Income from Operations $(4,637) $29,755 $(14,937) $10,181
Appendix
Depreciation & Amortization 2,826 8,056 1,470 12,352
EBITDA $(1,811) $37,811 $(13,467) $22,533
GAAP to Non-GAAP Reconciliation (in thousands)
For the Quarter Ended December 30, 2017
Garden Pet Corp Total
Net income (loss)attributable to Central Garden & Pet - - - $26,247
Interest expense, net - - - 7,218
Other income - - - 3,089
Income tax benefit - - - (14,236)
Net income attributable to noncontrolling interest - - - 203
Sum of items below operating income - - - (3,726)
Income (loss) from Operations $2,300 $36,176 $(15,955) $22,521
Depreciation & Amortization 1,569 7,145 2,449 11,163
EBITDA $3,869 $43,321 $(13,506) $33,684
53 53GAAP TO NON-GAAP RECONCILIATION (CONTINUED)
Net Income & Diluted Net Income Per Share Reconciliation
GAAP to Non-GAAP Reconciliation
(in thousands, except per share amounts)
For the Fiscal Year Ended September,
2018 2017 2016 2015 2014 2013 2012
GAAP net income attributable to Central Garden & Pet $123,594 $78,828 $44,514 $31,971 $8,804 $(1,929) $21,173
Total non-GAAP adjustments (2,050) 30,376 7,272 12,033 18,870 -
Tax effects of non-GAAP adjustments 757 (10,492) (2,618) (4,452) (6,982) -
Appendix
Tax effect of revaluation of deferred tax amounts (21,485)
Total adjustments (21,485) (1,293) 19,884 4,654 7,581 11,888 -
Non-GAAP net income attributable to
$102,109 $77,535 $64,398 $36,625 $16,385 $9,959 $21,173
Central Garden & Pet
GAAP diluted net income per share $2.32 $1.52 $0.87 $0.64 $0.18 $(0.04) $0.44
Non-GAAP diluted net income per share $1.91 $1.50 $1.26 $0.74 $0.33 $0.20 N/A
Shares used in GAAP diluted net earnings per share 48,374
53,341 51,820 51,075 49,638 49,397 48,094
calculation
Shares used in non-GAAP diluted net earnings per share
53,341 51,820 51,075 49,638 49,397 48,781 N/A
calculation
54 54You can also read