REGIONS 2020 An Assessment of Future Challenges for EU Regions - EN - europa.eu
←
→
Page content transcription
If your browser does not render page correctly, please read the page content below

EN

      REGIONS 2020
      An Assessment of Future Challenges
      for EU Regions

Commission Staff Working Document          November 2008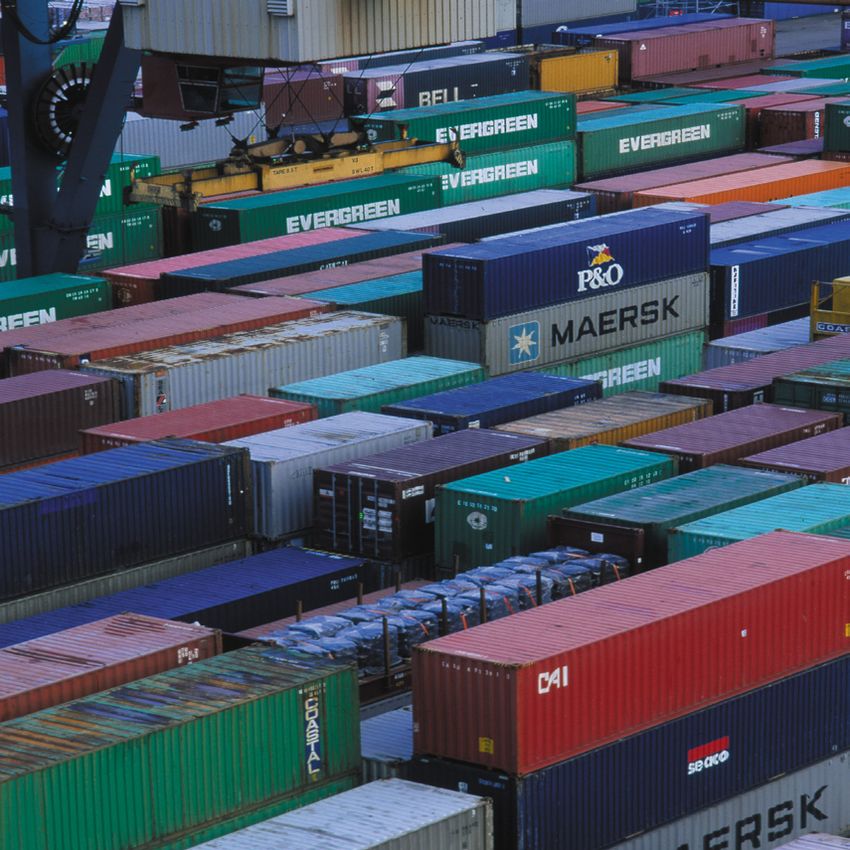
COMMISSION OF THE EUROPEAN COMMUNITIES

                                 Brussels, 2008
                                 SEC(2008)

           COMMISSION STAFF WORKING DOCUMENT

                       REGIONS 2020

     AN ASSESSMENT OF FUTURE CHALLENGES FOR EU REGIONS

EN                                                       EN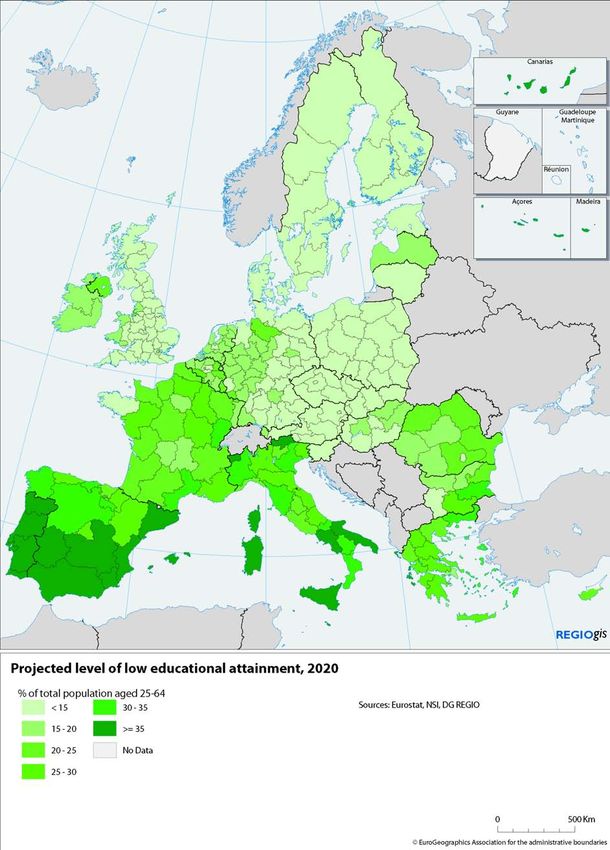
COMMISSION STAFF WORKING DOCUMENT

                                                            REGIONS 2020

                  AN ASSESSMENT OF FUTURE CHALLENGES FOR EU REGIONS

                                                 TABLE OF CONTENTS

     1.          Introduction.............................................................................................................. 3
     2.          Key challenges for European regions........................................................................ 5
     2.1.        Globalisation: Southern and South East Europe particularly exposed........................ 5
     2.2.        Demographic change: Great diversity across the EU................................................. 8
     2.3.        Climate change: Southern Europe most at risk........................................................ 11
     2.4.        Energy challenge: A weak core-periphery pattern................................................... 14
     3.          Conclusions............................................................................................................ 17

     ANNEX............................................................................................................................... 21

EN                                                                     2                                                                        EN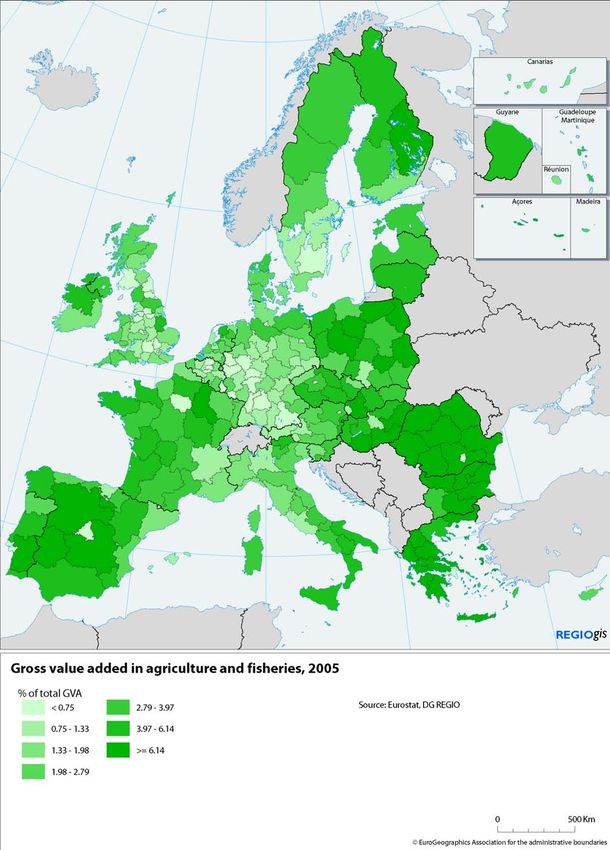
1.    INTRODUCTION

           Today's global financial and economic turbulence adds a high degree of
           unpredictability about the future of the world economy. In this context, it is even
           more important to examine the extent to which Community policies are adapted to
           future challenges that European regions will face in the coming years and what the
           role of Community Policies should be in responding to these challenges.

           The reflection process on the future of cohesion policy takes place in the context of
           the budget review, following the mandate received in 2005/2006 "to undertake a full,
           wide-ranging review covering all aspects of EU spending, including the Common
           Agricultural Policy, and of resources, including the United Kingdom rebate, and to
           report in 2008/2009"1. In this context, the Commission launched a public
           consultation based on its Communication "Reforming the Budget, Changing Europe"
           adopted on 12 September 20072. This consultation paper presented the Commission's
           approach to the budget review. It sketched out the new policy challenges which
           could have a significant impact on where the Union directs its efforts in the future
           and, at the same time, made an assessment of the added value of EU spending, a
           condition for choices on future spending priorities. Among the challenges identified,
           the following four may be of particular relevance for European regions:

           •      Globalisation is driving scientific and technological progress, making the
                  European dimension ever more important in boosting knowledge, mobility,
                  competitiveness and innovation. The opening up of huge new markets creates
                  vast new opportunities for Europeans, but it will at the same time test Europe's
                  capacity to further adjust to structural change and manage the social
                  consequences of that change. The transformation to a knowledge and service
                  economy is as profound as the earlier changeover from agriculture to industry.

           •      Demographic change will transform the age and employment structure of our
                  societies, raising important issues of both economic efficiency and inter-
                  generational equity. Migratory pressure will have a particularly strong effect on
                  Europe, due to its proximity to some of the world's poorest regions and those
                  likely to be worst affected by climate change and natural resource constraints.

           •      The impact of climate change on Europe's environment and its society has
                  become central to the European agenda, challenging policymakers to reflect on
                  how best to respond with the policy instruments at the EU's disposal. This
                  applies both to efforts to mitigate climate change by tackling the growth in
                  greenhouse gas emissions and the need for measures to adapt to the
                  consequences of climate change.

     1
          Declaration No 3 attached to the Interinstitutional Agreement between the European Parliament, the
          Council and the Commission on budgetary discipline and sound financial management, OJ C 139,
          14.6.2006, p. 15.
     2
          http://ec.europa.eu/budget/reform/library/issue_paper/consultation_paper_en.pdf, SEC(2007) 1188
          final.

EN                                                    3                                                        EN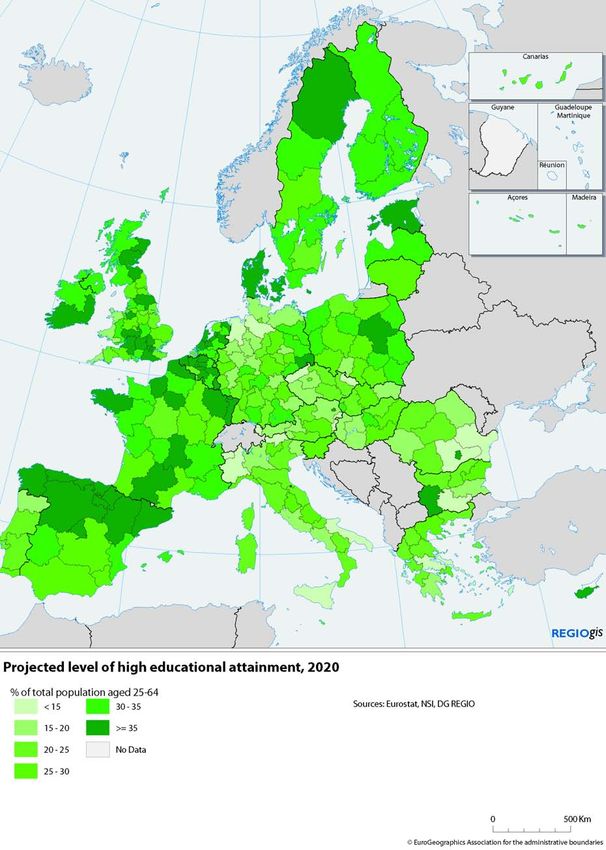
•      Secure, sustainable and competitive energy represents one of society's main
                 challenges. Limited supply, increased global demand and the imperative to cut
                 emissions have led to a new realisation of the need to move towards a low-
                 carbon economy in Europe.

          Together these challenges will impact on the development of Europe's economies
          and societies over the coming years.3 This document seeks to explore the regional
          effects of these challenges in the medium-term perspective of 2020. It seeks to
          illustrate which regions are most vulnerable to these challenges, as a step towards a
          better understanding of the potential pattern of regional disparities that these
          challenges will generate.

          Regional disparities in economic output and income in the European Union are far
          more extreme than in similar economies such as the US or Japan, particularly
          following recent enlargements. The richest regions are eight times richer than the
          poorest regions. The key cohesion challenge will therefore continue to be the
          integration and convergence of the new Member States, in spite of impressive GDP
          growth rates in recent years. Growth in the countries which have been the largest
          beneficiaries of the policy in the period 1994-2006 – Greece, Spain, Ireland and
          Portugal – has been marked, although development needs persist in some Southern
          European regions, Eastern Germany and peripheral areas. In short, the primary
          dimension of regional income disparities in the EU remains East-West, with a
          weaker North-South dynamic and core-periphery pattern at both EU and national
          levels. One question that this document seeks to address is whether the new
          challenges will further consolidate this pattern or generate new territorial disparities.

          Such an exercise is, by its very nature, limited; it simplifies a complex reality and
          focuses on a single regional level.4 It cannot substitute for a detailed analysis of
          specific national and regional contexts, nor take into consideration the capacity of
          Member States and regions to respond. As with all prospective work, this exercise is
          based on assumptions which appear reasonable today, but which may or may not
          correspond to future reality. 5

     3
         These four key challenges represent broad categories and are not exhaustive. Other challenges such as
         access to the information society and transport interconnectivity will also play an important role.
     4
         NUTS II in those Member States where these exist, national level for other Member States. Given the
         methodological limitations of the indicators used in the analysis, they should be considered as purely
         analytical, and not suitable for determining geographical eligibility.
     5
         In order to further deepen this analysis, the Commission intends to undertake a more wide-ranging
         study of the regional impact of the four challenges.

EN                                                    4                                                           EN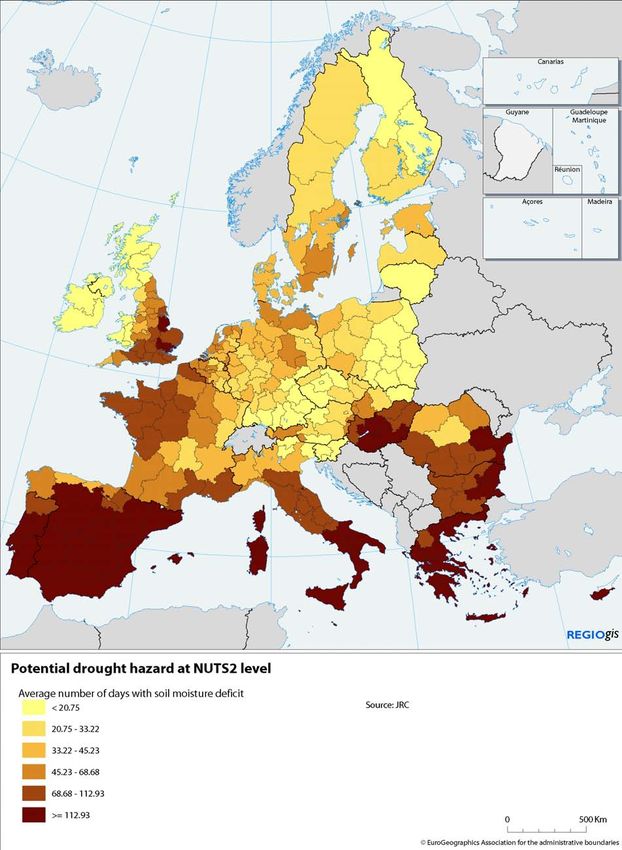
2.      KEY CHALLENGES FOR EUROPEAN REGIONS

     2.1.    Globalisation: Southern and South Eastern Europe particularly exposed

             "Globalisation is increasingly shaping our lives by fostering the exchange of peoples,
             goods, services and ideas and by offering new opportunities to citizens and business.
             Greater trade flows and economic growth have increased prosperity, transforming the
             lifestyles of Europe's citizens and lifting millions worldwide out of poverty. But
             globalisation also confronts us with new economic, social, environmental, energy
             and security challenges."6

             Globalisation will create more opportunities for producers and entrepreneurs, who
             are in a position of enjoying larger markets and higher competition. Consumers will
             benefit from higher living standards through lower prices and a wider choice of
             goods. A general increase in economic activity and trade will enhance labour demand
             and real wages for skilled labour, create employment and increase economic growth.
             The dissemination of innovation and know-how will also increase productivity.

             However, globalisation may also bring structural adjustment. Increasing competition
             can put additional pressure on local firms and, indirectly, on wages, especially for
             low-skilled labour. Many regions throughout the EU will therefore have to
             restructure their economy and promote continuous innovation – in products,
             management and processes, as well as human and social capital – to face the
             challenge of globalisation.

             The persistent labour productivity gap between the EU and the United States is
             projected to remain, due to rapid technological progress in the US. Labour
             productivity growth will continue to accelerate in the emerging economies of China,
             India and Brazil. (The annual average productivity growth in emerging economies -
             although they are starting from a low base - is expected to be five or six times higher
             than that in the EU).

             In order to turn the challenge of globalisation into an opportunity, the Lisbon Agenda
             requires European economies to increase productivity growth (both labour and
             resources), employment levels and the level of education of the workforce. General
             trends in the EU in recent years show a moderate labour productivity growth of
             around 1%, a fairly divergent trend in levels of education of the workforce and a
             gradually increasing employment rate as well as in the average age of retirement.
             This mixed picture is amplified at a regional level.

             The regional challenges of globalisation

             Levels of future labour productivity growth, employment and education have been
             combined in a globalisation vulnerability index (see figure 2).

             The index ranks European regions with reference to each other. It does not provide
             any information on their position relative to international competitors.

     6
            EU Declaration on Globalisation, European Council Presidency Conclusions, Brussels, 14 December
            2007.

EN                                                    5                                                       EN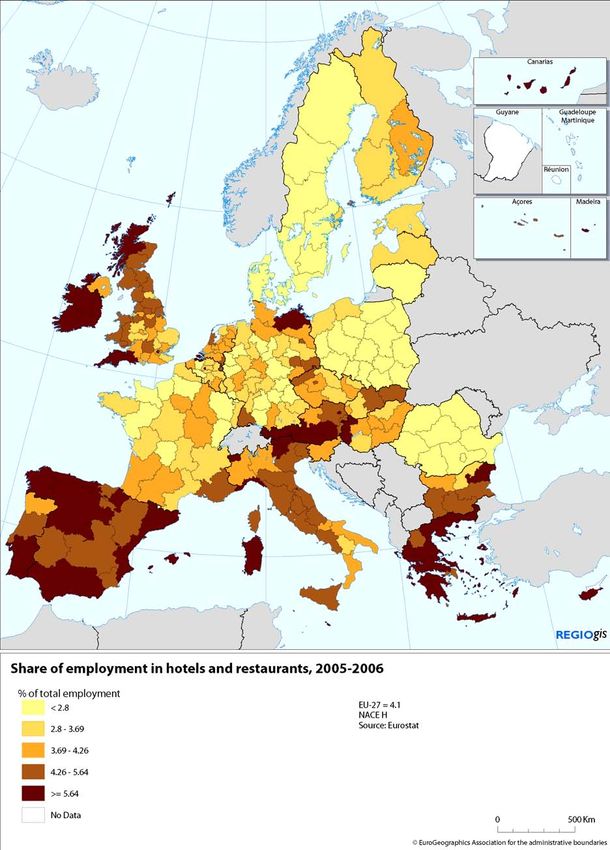
–      Many regions located in the North-West periphery of the European Union
                 appear to be in a rather favourable position. These regions are largely in
                 Finland, Sweden, Denmark, the UK and Ireland. They are expected to benefit
                 from a workforce with a high level of educational attainment, a high level of
                 employment, a high share of employment in advanced sectors and a high level
                 of labour productivity.

          –      Most regions located in the Southern and Eastern parts of the Union, stretching
                 from Latvia, Eastern Slovakia, Hungary, Bulgaria and Romania to Greece,
                 Italy, Spain and Portugal, appear to be much more exposed to the challenge of
                 globalisation. This vulnerability is predominantly due to the relatively large
                 share of low value added activities in these regions and weaknesses in
                 workforce qualifications, which may lead to difficulties in attracting
                 investment and creating or maintaining jobs.

          –      No clear pattern emerges in Western and Central Europe, where there are often
                 strong sub-national variations. Some areas are expected to perform less well
                 than the EU average (e.g. some regions in the North of Germany) and others
                 are projected to achieve higher-than-average levels of productivity,
                 employment and educational attainment (e.g. parts of Austria, Germany,
                 France).

          –      At the sub-national level, the analysis reveals that, in many Member States,
                 regions with major urban centres and metropolitan areas7 should be relatively
                 well placed to respond to the challenges linked to globalisation.8 These areas
                 tend to benefit from a large share of highly educated residents, highly dynamic
                 sectors and leading-edge economic activities. Yet, the concentration of
                 economic activities in agglomerations may also create negative externalities
                 (such as congestion, urban sprawl, drain on natural resources and ecosystem
                 services) and may also lead to underutilised economic potential elsewhere.

          A number of other factors will also strongly influence the extent of regional exposure
          and adaptive capacity to globalisation, such as R&D and innovation performance.
          However, due to data limitations (projected values at a regional scale) these variables
          have not been included in the index.

     7
         Metropolitan areas are defined as large agglomeration zones consisting of several urban centres or a
         very large city. In a number of Member States these are the capital region (e.g. Ile de France, Greater
         London, Madrid, Warsaw). In a number of other Member States these are more dispersed (e.g.
         Antwerp-Rotterdam, the Rhein-Main area, Munich).
     8
         There are however a number of rural and remote regions, which will fare well in response to
         globalisation. These regions are characterised by a high employment rate and an equally high
         educational attainment of the workforce.

EN                                                     6                                                           EN
Figure 1: Regional exposure to globalisation over the medium term

     Note: Index based on estimated productivity, employment rate, high education rate
     and low education rate in 2020.
     Source: Eurostat

     Potential regional effects

     Globalisation brings ever faster change to which people and firms need to respond.
     There is a risk that globalisation will encourage further consolidation of path
     dependency at regional level. The high productivity growth rates seen in a number of
     regions will help consolidate their economies in a more favourable competitive
     situation. In contrast, as the comparative advantages of low-cost, low-wage
     production methods continue to shift to emerging economies, regions lacking the
     capacity to develop a knowledge-based economy are likely to become more exposed.
     A well educated workforce provides the necessary flexibility and mobility to actively

EN                                        7                                                  EN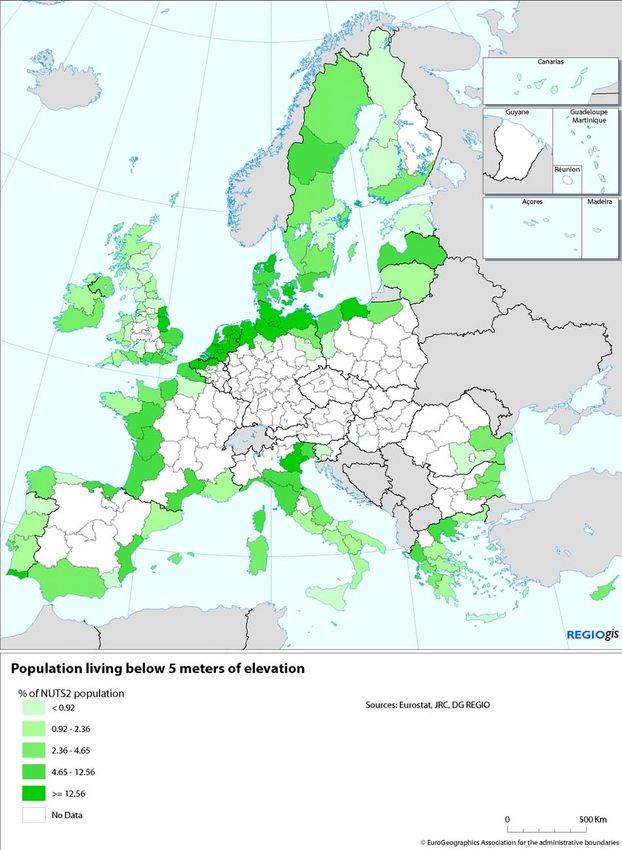
counter negative effects of globalisation. Low employment rates and educational
             levels may increase the risk of growing social polarisation within regions.

             Yet, there are many regions in the Union which are competitive and innovative, and
             which benefit from globalisation. This has been achieved by investing in advanced
             sectors with high productivity, by building up new skills and/or attracting new
             reservoirs of talent, and by promoting innovation potential through clusters,
             networks and through the strategic use of ICT. It is by better analysing and building
             on these development strategies that regions will be able to mobilise their potential
             and place their economy on a high-growth, sustainable development path.

     2.2.    Demographic change: Great diversity across the EU

             Demographic ageing, i.e. the increase in the proportion of elderly people, is the result
             of significant economic, social and medical progress as well as public health policies.
             These have given Europeans the opportunity to live a longer life in relative comfort
             and security without precedent in our history. However, as was stressed by the Heads
             of State and Government at their informal Summit at Hampton Court in October
             2005, it is also one of the main challenges that the European Union will have to face
             in the years to come.

             The EU-27 population is projected to become both smaller and older, mainly as a
             consequence of declining fertility rates and increasing life expectancy. By 2050,
             there may be 48 million fewer 15-64 year olds and 58 million more people over 65.
             From 2017 a shrinking workforce will also reduce overall employment and act as a
             brake on potential growth in the Union9.

             Population growth in the EU will slow down considerably compared to key
             competitors, in particular the United States, China and India, by 2020. The EU will
             face one of the largest increases in old-age dependency ratios in the world after
             Japan. At the same time, in Europe's immediate neighbourhood, the Middle East and
             North Africa region will be home to the world's second fastest growing population,
             after sub-Saharan Africa.

             Over the past decades, there has been considerable growth in worldwide migration
             flows. Economic differences between - and demographic changes within - developed
             and developing countries, against a background of trade, political problems and
             instability in countries of origin, have all contributed to a steady increase in
             international workforce mobility. 10 Economic migrants respond to expectations and
             opportunities in target regions. European and national regulations determine
             admission and eventual integration into the labour market.

     9
            The document draws from the 2004-based national and regional population projections produced by
            Eurostat, which were the latest available on a regional scale during its preparation. The 2008 national
            population projections differ considerably, in view of the application of a Convergence scenario (in
            contrast to the trend scenario applied for EUROPOP2004).
     10
            Communication from the Commission. Policy plan for legal migration SEC(2005)1680.

EN                                                        8                                                           EN
The ageing and shrinking of the population has fundamental repercussions for health
and social security systems, for the economy and the labour market, and for public
finance. Ageing leads to increased demand for health and long-term care and rising
health care expenditure. Demographic change is therefore of far-reaching importance
for the economy and society, since demographic decline strongly influences almost
all relevant areas of policy action.
The regional challenges of demographic change
Three important processes – namely a shrinking working age population, an ageing
society and population decline – will have a marked effect on many regions. These
factors have been combined to create a demographic vulnerability index (figure 2). A
number of conclusions can be drawn from this analysis:
– There is great diversity in terms of demographic dynamics and patterns across
the EU, with regions that are particularly exposed to demographic decline
located throughout the entire Union. Only a few Member States (such as
Ireland, Malta, Cyprus) appear to be in a relatively favourable position with
regard to demographic challenges.
– Around one third of European regions are projected to experience population
decline in the period 2005-2020. Most of them will be located in Central
Europe, Eastern Germany, Southern Italy and Northern Spain. Around 20 of
these regions will face a population decline of more than 10%.
– The highest shares of old age population are likely to be found in Eastern
Germany, North-West of Spain, Italy and some parts of Finland. In Central and
Eastern Europe the impacts of ageing will be delayed owing to their younger
population and lower life expectancy. However, significant increases in the old
age population are expected in the longer term in these regions.
– The share of working age population is expected to be particularly low in
several of the Finnish, Swedish and German regions. It is noteworthy that the
magnitude of decline in the working age population shows significant
variations. Around 40 regions will experience a decline of more than 10 % by
2020. Some regions in Bulgaria, Eastern Germany and Poland will be
particularly hard hit, with a decline exceeding 25 % by 2020. These regions
suffer from a combined effect of low fertility and high out-migration.
Other factors will also influence the demographic composition of regions, such as
health status, disability and ethnicity. These variables are however not included in
the index, in view of data limitations.
EN 9 ENFigure 2: Regional exposure to demographic change over the medium term
Note: Index based on the estimated share of people aged 65 and over in total
population, share of working age in total population and population decline in 2020
Source: Eurostat
Potential regional effects
In terms of socio-economic characteristics, regions in demographic decline are often
characterised by relatively low income levels, high unemployment and a large
proportion of the workforce employed in declining economic sectors. Moreover, they
tend to have a relatively small proportion of young people, reflecting their migration
to other areas as well as low fertility rates, and low population density, reflecting the
rural nature of many of these regions. As a consequence, regions in demographic
EN 10 ENdecline often have a low growth potential due to the shrinking labour force. This may
intensify existing economic disparities in income.
The outmigration of young people will reinforce the natural aging process. Regions
in demographic decline may face difficulties in financing essential public goods and
services, such as health care, long-term care, housing and transport infrastructure as
well as ICT infrastructure, in a sustainable manner in order to avoid increasing social
polarisation and poverty.
Other regions, on the other hand, in particular metropolitan and some coastal areas,
will gain population. Metropolitan regions are projected to face high inward
migration of a working age population, as well as remaining primary destinations for
international migration. A resulting challenge for these areas will be the integration
of migrants into the labour force and society as a whole, as well as the adaptation of
infrastructure in the case of high population growth. Social disparities tend to be high
in metropolitan areas, reflecting high living costs. Rapid sub-urbanisation could
increase pressures on ecosystem services in surrounding areas. Demographic change
is therefore likely to reinforce regional disparities in economic growth potential, as
well as increasing social polarisation and pressure on the environment in certain
areas.
2.3. Climate change: Southern Europe most at risk
Tackling climate change is of vital importance for the well-being of future
generations. In the long run, climate change will lead to an increase in average
annual temperatures, alter rainfall quantities and patterns, and raise the sea level and
the risk of coastal erosion. In the short and medium term, climate change will
increase the occurrence of extreme weather events (storms, heavy rainfall, droughts,
peak summer temperatures) which will lead to temporary situations resembling those
conditions, which we can expect later this century.
Most European regions are anticipated to be negatively affected by future impacts of
climate change, posing challenges to a number of economic sectors. In Southern
Europe, climate change is projected to worsen existing conditions through declining
precipitation and drought.
Therefore, the impact of climate change on Europe's environment, economy and
society has become central to the European policy agenda. This applies both to
efforts to mitigate climate change by tackling the growth in greenhouse gas (GHG)
emissions, and to the need for measures to adapt to the consequences of climate
change. 2007 marked an important year in the fight against climate change, when EU
leaders committed themselves to cut EU emissions by 20 per cent by 2020, a target
rising to 30 per cent if an international agreement committing other developed and
advanced developing countries is reached. They have also committed to 20 per cent
share of renewable energy in energy consumption and a 20 per cent increase in
energy efficiency by 2020. The EU is committed to maintaining international
leadership on the fight against climate change, including increase of clean energy
production, and to keeping up the momentum of negotiations on the United Nations
Framework Convention on Climate Change and its Kyoto Protocol. The objective is
to secure an ambitious, global and comprehensive post-2012 agreement addressing
EN 11 ENclimate change at Copenhagen in 2009 consistent with the EU's objective to limit
global warming to 2 °C.
The regional challenges of climate change
Climate change will strain economic, social and environmental systems. The
development of economic sectors which rely on ecosystem services and natural
resources might become constrained. Tourism, large scale energy production,
agriculture and fishery are examples of exposed sectors. Regions under threat of
flooding, coastal erosion, land degradation and desertification and potential drought
hazard are already seeing their economy, and their social and environmental
situation, affected. To study the extent to which regions will be affected by the
consequences of climate change, a climate change vulnerability index (see figure
3) was developed which combines the physical and economic effects of these
underlying processes:
– More than one third of the EU population - a total of 170 million people - live
in the regions most affected by climate change. Regions subject to the highest
pressure are generally located in the South and East of Europe, the whole of
Spain, Italy, Greece, Bulgaria, Cyprus, Malta and Hungary, as well as most of
Romania and southern parts of France. This situation is mostly due to changes
in precipitation and an increase in temperature, which have an impact on
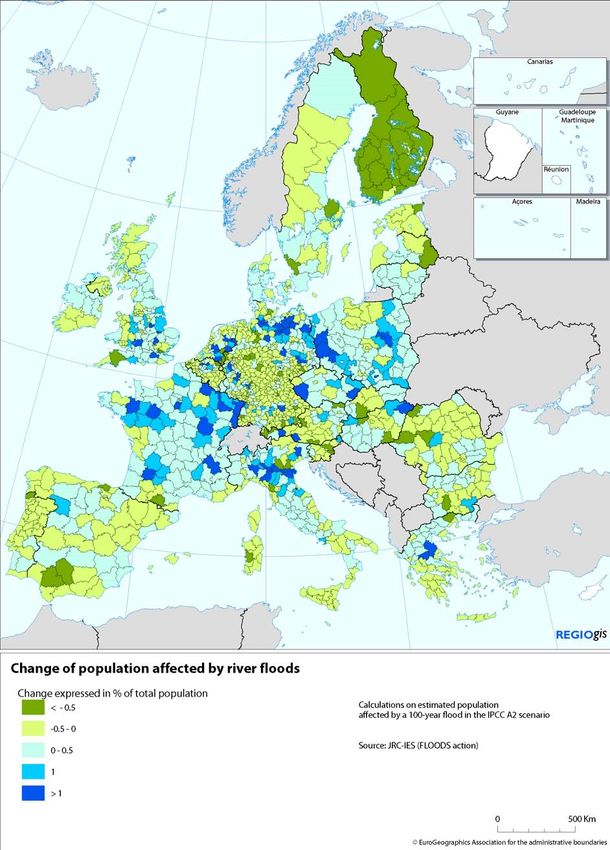
vulnerable economic sectors. River floods also contribute to the overall effect
in Hungary and Romania.
– More limited pressures are expected in Northern and Western Europe, apart
from lowland costal regions around the North Sea and the Baltic Sea with a
high exposure to costal erosion through extreme weather events as well as sea
level rise.
– The pressures from climate change are therefore not evenly distributed, and in
some cases will be felt in regions with low GDP per capita, which thus have a
lower capacity for adaptation to climate change.
EN 12 ENFigure 3: Regional exposure climate change over the medium term
Note: Index based on change in population affected by river floods, population in
costal areas below 5m, potential drought hazard, vulnerability of agriculture,
fisheries and tourism, taking into account temperature and precipitation changes.
Source: Eurostat, JRC, DG REGIO
Potential regional effects
Many European regions will be increasingly exposed to the asymmetric impact of
climate change. This will pose serious challenges to agriculture, forestry, fisheries,
large scale energy production and the tourism industry as well as health care in
certain areas and will require significant investment to combat and prevent drought,
fires, coastal erosion and flooding and peak temperatures.
EN 13 ENAdaptation to climate change is of vital importance. The severity of the impacts will
vary across European territories, depending on the physical vulnerability, the level of
economic development, natural and human adaptive capacity, health services and
disaster surveillance mechanisms.
In agriculture, changes in temperature and precipitation will lead to changing
agricultural yields and production methods with distinct patterns throughout Europe.
In fisheries, climate change will place an even greater strain on marine ecosystems
subject to overfishing. In tourism, the number of Alpine areas with reliable snowfall
will decrease and the industry will have to shift its focus to summer holidays,
whereas Mediterranean regions might suffer from temperatures above the heat
comfort zone and loss of biodiversity. In the energy sector, climate change will lead
to changing patterns of energy demand and to greater fluctuations in energy
production and demand, particularly in regions with a high share of renewable
energy and varying availability of water for cooling of large-scale heating power
plants. These effects will impact on regional growth potential in affected regions and
create disparities with those regions that are less affected by climate change.
Changing weather conditions will have a negative impact on human health and well-
being in several areas (the number of heat-related deaths may increase availability
and quality of drinking water will decrease, etc). In this respect, the Mediterranean
regions will suffer the most from worsening conditions, while Northern, Western and
Eastern European regions will see a less serious deterioration or even a temporary
improvement in conditions. This is likely to create social and environmental
disparities between regions.
Similarly, the impact on access to environmental amenities and ecosystem resources
will be asymmetric. In the competition for ecosystem services, rural and urban
regions with a high risk of droughts will see more potential conflicts over the
appropriate use of limited water resources, as well as potential damage to regional
ecosystems that run short of water. In the large flood plains created to shield urban
centres, the reverse may be true.
2.4. Energy challenge: A weak core-periphery pattern
Energy is essential for Europe to function. Energy prices appear to have become ever
more volatile with extreme price peaks reached in recent months. All EU members
are facing the challenges of climate change, increasing import dependence and higher
energy prices. An Energy Policy for Europe is aimed at delivering sustainable, secure
and competitive energy. 11
Europe is becoming increasingly dependent on imported fossil fuels. Under the
"business as usual" scenario, the EU's energy import dependence will increase from
53% of total EU energy consumption in 2005 to 67% in 2030. Reliance on imports of
gas is expected to increase from 58% to 84% by 2030, and on imports of oil from
82% to 95%. The EU is becoming increasingly exposed to the effects of price
volatility and price rises on international energy markets, and the consequences of
the gradual geopolitical concentration of fossil fuel reserves.
11
An Energy Policy for Europe, Communication, {SEC(2007) 12}.
EN 14 ENRising and fluctuating energy prices, which are related to internal and external
energy security, affect some European regions more than others. Currently, energy
prices differ significantly across the EU, indicating the lack of a properly functioning
EU market and potentially affecting the competitiveness of energy intensive sectors.
The challenge for the EU will be how to achieve an Integrated Energy Market in
order to share risks and pool advantages.
Another dimension of the energy challenge will be to move towards a low carbon
economy by reducing greenhouse gas emissions through higher energy efficiency
and a more pronounced role for renewable energies and the development of low-
carbon technologies, such as carbon capture and storage (CCS). A number of sectors
contribute to greenhouse gas emissions among them transport, energy, households,
agriculture. High energy prices and growing carbon prices will affect regions in
different ways depending on i) the structure of the regional economy and its energy
efficiency, ii) the energy mix and low carbon potential (renewables, nuclear), iii) the
prevailing transport modes and iv) the innovation potential. Energy accounts for 80%
of all greenhouse gas emissions in the EU; it is at the root of climate change and of
most air pollution.
The regional challenges of energy
The regional dimension of the energy challenge is strongly determined by national
choices regarding energy mix as well as energy policy, and depends on three main
structural factors: i) internal and external security of supply will determine how
much regions are exposed to additional fluctuations of prices and supply; ii) energy
use and efficiency determines consumption by households and industry and their
vulnerability to high price levels and, finally, iii) carbon emissions are an indicator of
sustainability. An energy vulnerability index (figure 4), which combines these three
elements, seems to indicate that the core in Western and Northern Europe appears to
be better prepared for the energy challenges of the coming years than the periphery.
– Peripheral regions located mainly in Eastern and Southern Member States
appear particularly vulnerable, for reasons of internal and external security of
supply, energy efficiency of the economy and environmental sustainability.
About one third of the EU population live in such areas. There are some
variations within this group. Polish regions have a lower security of supply
risk, but the coal base leaves a negative ecological footprint. Irish regions
combine a pattern of higher risks of security of supply with a low level of
environmental sustainability and high household consumption.
– Centrally located regions in Belgium and Germany, for instance, are in the
middle ground owing to high energy efficiency, but with high household
consumption and relatively low environmental sustainability. A further one
third of the EU population falls into this category.
– A third of the EU population lives in the least challenged regions. These are
generally located in Northern and Western Europe and show a greater capacity
to adapt, which is due either to higher own energy resources (United Kingdom,
Netherlands) or to energy mixes allowing lower greenhouse gas emissions and
lower dependency on fossil energy providers for electricity (Finland, France,
Sweden).
EN 15 EN– At sub-regional level, metropolitan areas with compact settlements generally
seem less vulnerable to the energy challenge than remote areas, owing to the
higher energy efficiency of the economy and lower household consumption.
Figure 4: Regional exposure to the energy challenge over the medium term
Note: Index based on regional energy consumption by households (incl. private
transport), estimated energy consumption by freight transport, industry, services and
agriculture, national carbon intensity, national energy import dependency.
Source: DG TREN, DG REGIO.
EN 16 ENPotential regional effects
Regions reliant on energy intensive sectors, such as transport, and heavy
manufacturing and regions that depend on distant markets could be more exposed to
changing energy conditions. On the other hand, energy efficient regions can benefit
from the strong role which innovation, technology and ICT will play in the adaption
and mitigation process. This can create "win-win" situations, both economically and
environmentally, in energy efficient regions.
Some regions will potentially benefit from the production of renewable energies,
including some rural and remote regions (e.g. geothermal, biomass) and coastal areas
(e.g. offshore, wind, wave, tidal or solar energy). Substantial disparities among
regions are also observed as regards modal splits in the transport sector, and energy
intensity, where the highest figures are recorded in countries with low GDP per
capita. High energy prices also have significant welfare effects, in particular for
lower income households, for which energy related expenditure takes a
comparatively high share of their income. High energy prices might therefore reduce
the purchasing power of the poorest households and regions with a low average
income.
3. CONCLUSIONS
Europe will face a number of key challenges in the years to come, including among
others: adapting to globalisation, demographic change, climate change and the
energy challenge. All European regions will be affected. However each of the
challenges exhibits a distinct pattern. With the exception of energy12, all challenges
display strong sub-national variations:
– For globalisation, South and South Eastern regions appear to be highly
vulnerable, but considerable variations can be observed in both Germany and
the new Member States.
– For demographic change, there is significant variation across European
regions, once again with slightly greater vulnerability in South and South
Eastern regions. However, it should be stressed that there is a lag in the
demographic transition of the new Member States and that the effects will be
very similar in the next generation to those already seen in the old Member
States.
– For climate change, there is a relatively strong core-periphery pattern, with
Southern regions faring worse.
– The pattern for energy is largely country specific, with a weak core-periphery
pattern at a European level.
12
The energy challenge is largely determined by national choices on the energy mix as well as national
policies choices determining internal and external security of supply. These factors are strongly path
dependent with a long term influence far beyond the time horizon of 2020. Distinct socio-economic
factors determine thus regional disparities.
EN 17 ENExamining the combination of these challenges provides interesting results:
– As regards socio-economic challenges, some regions appear to be favourably
placed to benefit from globalisation, but face the risk of demographic decline.
These regions are located in Central France, Eastern Germany, parts of Sweden
and Finland, as well as in some new Member States. A number of regions -
mainly located in Southern Europe - appear to be vulnerable to both
challenges. At sub-national level, metropolitan areas seem to be better
equipped than remote rural areas to face both types of challenges. It is thus
difficult to predict how these challenges will interact and what conclusions can
be drawn in terms of future developments.
– Climate change and the energy challenge will affect all regions. Regions in the
Mediterranean part of Europe seem to be more exposed to these challenges,
whereas Northern and Western European regions appear to be less at risk.
However, the impact depends on climate change scenarios which may vary
considerably over time. Energy dependence clearly follows national patterns,
without showing a clear East-West or North-South divide. Developments will
depend on the European Union's capacity to develop, a common policy on
energy ensuring the functioning of the internal market and security of energy
supply.
The outermost regions will be in the front line for many of these challenges. Their
experience will be important for their geographical surroundings and for the rest of
the territory of the Union.13
A synthetic index has been developed to further illustrate the geography of these
multiple challenges. The index classifies in very broad terms how many challenges
will affect each European region. It provides an overview of the top 50% of regions
most affected by each individual challenge, indicating risk intensity.
13
Communication COM (2008)642: the outermost regions, an asset for Europe
EN 18 ENFigure 5: Intensity of multiple risks for European Regions
The map above summarises the geographical pattern of intensively challenged
regions. Most regions expected to be intensively affected by three or more challenges
at the same time are located in Southern Europe and on the coasts of Western and
Central Europe. Regions with a lower number of simultaneous challenges are
relatively close to the geographical core of the EU, but are also located in Southern
Spain, the UK, Ireland, Denmark, Sweden, Finland and Lithuania.
EN 19 ENMost of the impacts of the four challenges will be expressed in different ways
according to the particular region and are likely to create regional disparities. Some
of the challenges tend to be more closely interlinked than others. Globalisation,
demographic change and aspects of energy and climate change have distinct impacts
on the economy and regional growth potential, as well as on social polarisation. For
example, overly volatile energy prices could adversely affect the competitiveness and
regional growth potential of regions with inefficient energy use and high reliance on
transport. As a consequence, households might be adversely affected by higher
unemployment as well as by temporarily higher spending on energy. Growing social
polarisation could be the result. Certain challenges, therefore, might reinforce each
other. Other combinations of challenges might have a lower impact. Demographic
change and globalisation may have a more limited impact on environmental
sustainability than energy and climate change.
The interaction of various challenges is, thus, extremely complex. Moreover, as
noted above, the projections made in the present document do not take into account a
number of factors which may be decisive, such as the capacity of the regions, the
Member States, and the European Union to respond, notably on the basis of further
technological development. Through their cohesion programmes in 2007-2013 for
example, some Member States and regions, in partnership with the Commission,
endeavour to contribute towards tackling these challenges. The question how EU
policies, including cohesion policy, can best contribute to addressing those
challenges in the next decade and beyond, whilst fully taking solidarity and
sustainability aspects into account, will be a key issue of the ongoing review of the
EU budget.
EN 20 ENANNEX
TABLE OF CONTENTS
1. Annex I: maps ...................................................................................................... 22
1.1. GDP disparity map ................................................................................................ 23
1.2. Globalisation indicators:........................................................................................ 24
Regional labour productivity in 2020 (EU-27=100) ........................................... 24
Regional employment rate in 2020..................................................................... 25
Regional unemployment rate in 2020................................................................. 26
High educational level in 2020........................................................................... 27
Low educational level in 2020 ........................................................................... 28
1.3. Demography indicators:......................................................................................... 29
Regional share of people aged 65 and above in 2020 (% of total population) ..... 29
Population decline between 2004-2020 (annual average % change) ................... 30
Regional share of working age population in 2020 (% of total population)......... 31
1.4. Climate change indicators:..................................................................................... 32
Climate Zones.................................................................................................... 32
Change in regional population affected by river floods (% of total population),
2001-2100 ......................................................................................................... 33
Regional population in areas below 5m sea level (% of regional population), 2001
.......................................................................................................................... 34
Potential regional drought hazard, 1958-2001 (average number of days with soil
moisture deficit)................................................................................................. 35
Regional share of agriculture and fisheries in GVA, 2005.................................. 36
Regional share of employment in hotels and Restaurants (% of total employment),
2005-2006 ......................................................................................................... 37
1.5. Energy challenge indicators:.................................................................................. 38
Regional energy consumption of Households, 2006 estimates (including private
transport) (toe per inhabitant)............................................................................. 38
Regional energy consumption of Industry, agriculture, services and freight
Transport, 2006 estimates (toe per 1000 euro of GDP)....................................... 39
Energy import dependency (% of national gross inland consumption), 2006 ...... 40
Carbon content of gross inland energy consumption (CO2/TJ), 2006................. 41
2. Annex II: Impact matrices ................................................................................... 42
3. Annex III: Methodological notes ......................................................................... 44
EN 21 EN1. ANNEX I: MAPS
Each index of the individual challenges indices is built on several indicators. The annex
provides maps of each. Some of these indicators are relevant across challenges, i.e. they
determine or attenuate regional exposure. However, each indicator is only counted once. High
educational attainment, for example, is part of the globalisation index, but it is also an
important characteristic to attenuate the impact of aging in demography. Carbon emissions are
accounted for in the energy challenge, but are of course an important indicator of
sustainability in climate change as well.
EN 22 EN1.1. GDP disparity map EN 23 EN
1.2.   Globalisation indicators:

                    REGIONAL LABOUR PRODUCTIVITY IN 2020 (EU-27=100)

EN                                        24                           EN
REGIONAL EMPLOYMENT RATE IN 2020 EN 25 EN
REGIONAL UNEMPLOYMENT RATE IN 2020

EN                   26                   EN
HIGH EDUCATIONAL LEVEL IN 2020

EN                27                  EN
LOW EDUCATIONAL LEVEL IN 2020

EN                28                 EN
1.3.   Demography indicators:

       REGIONAL SHARE OF PEOPLE AGED 65 AND ABOVE IN 2020 (% OF TOTAL POPULATION)

EN                                        29                                        EN
POPULATION DECLINE BETWEEN 2004-2020 (ANNUAL AVERAGE % CHANGE) EN 30 EN
REGIONAL SHARE OF WORKING AGE POPULATION IN 2020 (% OF TOTAL POPULATION)

EN                                      31                                      EN
1.4.   Climate change indicators:

                                         CLIMATE ZONES

EN                                            32         EN
CHANGE IN REGIONAL POPULATION AFFECTED BY RIVER FLOODS
(% OF TOTAL POPULATION), 2001-2100
EN 33 ENREGIONAL POPULATION IN AREAS BELOW 5M SEA LEVEL
(% OF REGIONAL POPULATION), 2001
EN 34 ENPOTENTIAL REGIONAL DROUGHT HAZARD, 1958-2001
(AVERAGE NUMBER OF DAYS WITH SOIL MOISTURE DEFICIT)
EN 35 ENREGIONAL SHARE OF AGRICULTURE AND FISHERIES IN GVA, 2005 EN 36 EN
REGIONAL SHARE OF EMPLOYMENT IN HOTELS AND RESTAURANTS
               (% OF TOTAL EMPLOYMENT), 2005-2006

EN                             37                             EN
1.5. Energy challenge indicators:
REGIONAL ENERGY CONSUMPTION OF HOUSEHOLDS, 2006 ESTIMATES
(INCLUDING PRIVATE TRANSPORT) (TOE PER INHABITANT)
EN 38 ENREGIONAL ENERGY CONSUMPTION OF
INDUSTRY, AGRICULTURE, SERVICES AND FREIGHT TRANSPORT, 2006 ESTIMATES
(TOE PER 1000 EURO OF GDP)
EN 39 ENENERGY IMPORT DEPENDENCY (% OF NATIONAL GROSS INLAND CONSUMPTION), 2006 EN 40 EN
CARBON CONTENT OF GROSS INLAND ENERGY CONSUMPTION (CO2/TJ), 2006

EN                                  41                                  EN
2.      ANNEX II: IMPACT MATRICES

     The analysis of the impact of future challenges, i.e. globalisation, demographic change,
     climate change and energy, on regional disparities follows a logic which is laid down in the
     impact matrices. The variables for regional impact are: interregional disparities in growth
     potential, environmental sustainability and interregional social disparities. The logic is
     formulated in a qualitative way, but could equally - with the right methodological tools - be
     translated into a quantitative form, such as socioeconomic models and environmental
     assessment tools. The matrix also gives a qualitative assessment of the correlation for each
     variable selected, i.e. whether or not the variable is strongly linked to e.g. interregional
     disparities in growth potentials. The range is from "no clear link" to "+", and "++" as a strong
     impact. The signs do not show the direction of change, i.e. whether or not it is increasing, but
     merely the level of influence on the impacted regional variable.

     Some of the impact variables overlap. High educational attainment of the workforce, for
     example, is just as important in terms of creating opportunities from the globalisation
     challenge as is minimizing the impacts of aging and a declining work force.

EN                                                 42                                                   EN
…and their
Intraregional
Impacts on Interregional Environmental
Social disparities
The drivers Disparities in Growth Potentials Sustainability
of Challenges…
++ +
Productivity of one of the key prerequisite to A fast growing economy
Productivity
afford a high level competition in an open may create phenomenon of No clear link
EU/World market agglomeration
Globalisation
++
++
Education No clear link Education has a notable impact of
Education is key to growth potential
social disparities
+
+ The link between employment and
The link between employment and growth social disparities may exist or not (e.g.
Employment No clear link
potentials may exist or not (e.g. there may be employment concentrated in few
the case of a jobless growth) sectors may be irrelevant to social
disparities).
+ +
Population ageing may affect key drivers of No clear link. Poverty risks for persons aged 65 and
regional growth such as productivity, above are high. Elderly people with
investment and consumption. low socio-economic status in deprived
Ageing
Increasing age related infrastructural needs and urban or peripheral rural areas are
access to them (health and long term care, increasingly exposed at the risk of
housing…) constitute a challenge. poverty and social exclusion.
Demographic change
++
Working-age
Shrinking labour force can constitute a drag on No clear link No clear link
population
regional growth, dependent on the productivity
of the labour force and participation rates.
+ +
Migration Migrants' contribution to growth? – skills No clear link The impact will depend on the extent
composition to which immigrants are integrated in
the regional economy and society.
++ + +
Rapidity of Very rapid population changes challenge Rapid population changes Poverty risk might increase for those
population existing infrastructure might challenge ecosystem remaining in areas of rapid decreases
decrease and for those not well integrated in
areas with rapid increases
Vulnerable ++
sectors ++ Regions with a high +
(tourism, Regions with a high concentration of sectors concentration of sectors Regions with high dependency on
energy, relying on natural resources and ecosystem relying on natural vulnerable sectors have to face social
Climate Change
agriculture services will be affected resources and ecosystem costs of structural change or adaptation
and fisheries) services will be affected
Coastal ++ +++ +
erosion and Affected areas might see assets and Ecosystems are negatively Population at risk of poverty face
flooding infrastructure destroyed affected additional costs
Potential ++ +
++
drought Ecosystems are negatively High water costs weigh more heavily
Water dependent sectors will suffer
hazard affected on low income households
++ ++ +
Energy
Vulnerability towards price shocks decreases Growing efficiency Social costs of restructuring energy
efficiency
with energy efficiency reduces GHG emissions inefficient industries
Energy ++ Households with higher levels of
Energy challenge
consumption No clear link GHG emissions correlated consumption and lower income more
by households with levels of consumption exposed to energy price changes
Internal and ++ +
external Vulnerability towards price shocks increases Low income households more
No clear link
security of with vulnerable to energy price shocks
supply import dependency
+
++ +++
Carbon Higher carbon prices might reduce
Competitiveness of carbon intensive regions carbon intensive regions
intensity purchasing power of low income
with carbon pricing emit more GHG
households
EN 43 EN3. ANNEX III: METHODOLOGICAL NOTES
The exercise represents a first attempt to analyse the pattern, characteristics, pressures and
risks of challenges in their regional dimension, in order to identify potential regional
disparities. The analysis identifies patterns and characteristics in an illustrative manner and
ranks regions in terms of their exposure to the challenges across the EU. The scope of the
analysis is limited by data availability and by methodological choices.
The projections of this analysis are not a forecast of what the situation will be, but of what it
might be under a given set of assumptions. Of the many possible futures, the one which was
judged the most plausible from a current point of view is selected.
The indices are based on different variables, which correspond to the key drivers of the
challenges and reflect data availability. The variables seek to capture vulnerability according
to exposure and adaptive capacity. Some indices are based on projected values (globalisation,
demography, climate change); others use 2005 values for 2020 (energy). The latter is due to
the structural or long-term nature of the driver concerned (for instance energy dependency).
The indices summarise how regions score on the different variables (the values range from 0
to 100; the higher the value, the more the region is likely to be exposed to the given
challenge).
The globalisation index is based on four variables, notably labour productivity in 2020,
employment rate in 2020 and low and high educational attainment in 2020. Regional
productivity and employment projections are based on DG ECFIN's long-term economic
projections produced in 2005, the 2004-based Eurostat's regional population projection and on
data regionalisation carried out in DG REGIO on the basis of regional trend projections using
the current regional sectoral structure of GVA and employment and the changes over the past
five to ten years at the national level. Educational level projections have been created using a
cohort analysis of current regional education levels by five year age groups and changes over
the past five years combined with Eurostat's regional population projections.
The demography index is based on three variables, notably the share of people aged 65 and
above in 2020, population decline between 2005 and 2020 and the share of working-age
population in 2020. All three indicators are derived from the 2004-based regional population
projections produced by Eurostat. Regional data for France and the United Kingdom were
calculated on the basis of data provided by national statistical institutes.
The climate change index is based on change in regional population affected by river floods
between 2001 and 2100, regional population in areas below 5m in 2001, potential regional
drought hazard (average number of days with soil moisture deficit based on the past 40 years),
regional share of agriculture and fisheries in GVA in 2005, regional share of employment in
hotels and restaurants (% of total employment) in 2005 taking into account the impact of
climate change by climate zone.
The index draws from work from the IPCC, European Environmental Agency and the Joint
Research Centre and includes long-term projections until 2100. However, these projections
were used to describe the risks from the expected higher frequency of extreme weather events
which will already start impacting on regional conditions in the short to medium run.
EN 44 ENThe energy index is based on four variables, notably regional energy consumption of
households (including private transport) in 2004, regional energy consumption of industry,
agriculture, services and freight transport in 2004, national energy import dependency in
2006, national carbon content of gross inland energy consumption in 2006. All four variables
are based on current data. Since this index describes long-run behavioural conditions, which
are strongly path dependent, (such as the energy mix of an economy and the consumption
patterns and the development of energy efficiency) the index is unlikely to change
dramatically between today and 2020.
The use of different data sources and projection methods, however, may create some
consistency problems, despite efforts undertaken to minimize this effect. The analysis does
not take into account dynamic aspects which occur, such as structural changes in regions
which could substantially alter a region's position and risk status. Those dynamic changes are
also the result of investments in the framework of Regional Policy. Therefore, the analysis
does not prejudge the effects of Regional Policy in any way.
The prime data sources are Eurostat and the DG REGIO database. The decision to focus on
NUTS 2 regions limits the analysis of certain geographical patterns of challenges, particularly
in climate change, and also when focusing on social disparities. However, it is considered that
it is the NUTS II level, where applicable, which represents an appropriate balance between
detail and data availability.
Multiple Challenges
In order to illustrate the intensity of multiple challenges in more detail, a synthetic index has
been developed. The index identifies how many challenges will affect each European region.
It selects 50% of the regions most affected by each individual challenge. This step of the
analysis gives some measure of the intensity of risk.
Each individual challenge index ranks regions according to their individual risk structure in
relation to that challenge. This methodological choice means that the distributions of the
indices remain relatively smooth and continuous, and thus sensitive to the selection of a cut-
off point.
Region ranked among the "first 100" for…. n° of avg GDP %pop avg of the
Region index (EU=100) EU 27 4 index (1-
s 100)
none of the 4 challenges 28 131 11 21
1 of the 4 challenges 70 110 25 30
2 of the 4 challenges 78 89 29 41
3 of the 4 challenges 54 86 19 53
All 4 challenges 37 84 16 66
EN 45 ENYou can also read