Optimal Combinations of AT(N) Biomarkers to Determine Longitudinal Cognition in the Alzheimer's Disease - Frontiers
←
→
Page content transcription
If your browser does not render page correctly, please read the page content below
ORIGINAL RESEARCH
                                                                                                                                           published: 06 August 2021
                                                                                                                                     doi: 10.3389/fnagi.2021.718959

                                             Optimal Combinations of AT(N)
                                             Biomarkers to Determine
                                             Longitudinal Cognition in the
                                             Alzheimer’s Disease
                                             Rong-Rong Lin, Yan-Yan Xue, Xiao-Yan Li, Yi-He Chen, Qing-Qing Tao* and Zhi-Ying Wu*
                                             for Alzheimer’s Disease Neuroimaging Initiative†
                                             Department of Neurology and Research Center of Neurology in Second Affiliated Hospital, and Key Laboratory of Medical
                                             Neurobiology of Zhejiang Province, Zhejiang University School of Medicine, Hangzhou, China
                             Edited by:
                            Jiehui Jiang,
               Shanghai University, China    Background: National Institute on Aging—Alzheimer’s Association (NIA-AA) proposed
                       Reviewed by:          the AT(N) system based on β-amyloid deposition, pathologic tau, and neurodegeneration,
                             Nilo Riva,
                                             which considered the definition of Alzheimer’s disease (AD) as a biological construct.
   San Raffaele Hospital (IRCCS), Italy
                   Nobuyuki Kimura,          However, the associations between different AT(N) combinations and cognitive
    National Center for Geriatrics and       progression have been poorly explored systematically. The aim of this study is to compare
         Gerontology (NCGG), Japan
                                             different AT(N) combinations using recognized biomarkers within the Alzheimer’s Disease
                     *Correspondence:
                            Zhi-Ying Wu
                                             Neuroimaging Initiative (ADNI) cohort.
                   zhiyingwu@zju.edu.cn
                                             Methods: A total of 341 participants were classified into cognitively unimpaired
                          Qing-Qing Tao
                 qingqingtao@zju.edu.cn      (CU; n = 200) and cognitively impaired (CI; n = 141) groups according to the
      † Data
                                             clinical manifestations and neuropsychological tests. Cerebrospinal fluid (CSF) Aβ42 and
              used in preparation of this
         article were obtained from the      amyloid-PET ([18F]flutemetamol) were used as biomarkers for A; CSF phosphorylated tau
    Alzheimer’s Disease Neuroimaging         (p-tau) and tau-PET ([18F]flortaucipir) were used as biomarkers for T; CSF total tau (t-tau),
               Initiative (ADNI) database
       (adni.loni.usc.edu). As such, the
                                             hippocampal volume, temporal cortical thickness, [18F]fluorodeoxyglucose (FDG) PET,
          investigators within the ADNI      and plasma neurofilament light (NfL) were used as biomarkers for (N). Binary biomarkers
         contributed to the design and
                                             were obtained from the Youden index and publicly available cutoffs. Prevalence of AT(N)
        implementation of ADNI and/or
 provided data, but did not participate      categories was compared between different biomarkers within the group using related
  in analysis or writing of this report. A   independent sample non-parametric test. The relationship between AT(N) combinations
 complete listing of ADNI investigators
 can be found at: http://adni.loni.usc.e
                                             and 12-year longitudinal cognition was assessed using linear mixed-effects modeling.
du/wp-content/uploads/how_to_apply           Results: Among the CU participants, A–T–(N)– was most common. More T+ were
    /ADNI_Acknowledgement_List.pdf
                                             detected using p-tau than tau PET (p < 0.05), and more (N)+ were observed using
            Received: 01 June 2021           fluid biomarkers (p < 0.001). A+T+(N)+ was more common in the CI group. Tau PET
            Accepted: 05 July 2021           combined with cortical thickness best predicted cognitive changes in the CI group and
          Published: 06 August 2021
                                             MRI predicted changes in the CU group.
                              Citation:
   Lin R-R, Xue Y-Y, Li X-Y, Chen Y-H,       Conclusions: These findings suggest that optimal AT(N) combinations to determine
 Tao Q-Q and Wu Z-Y (2021) Optimal
                                             longitudinal cognition differ by cognitive status. Different biomarkers within a specific
 Combinations of AT(N) Biomarkers to
  Determine Longitudinal Cognition in        component for defining AT(N) cannot be used identically. Furthermore, different strategies
              the Alzheimer’s Disease.       for discontinuous biomarkers will be an important area for future studies.
   Front. Aging Neurosci. 13:718959.
     doi: 10.3389/fnagi.2021.718959          Keywords: Alzheimer’s disease, biomarkers, AT(N) system, longitudinal cognition, linear mixed-effects model

Frontiers in Aging Neuroscience | www.frontiersin.org                             1                                         August 2021 | Volume 13 | Article 718959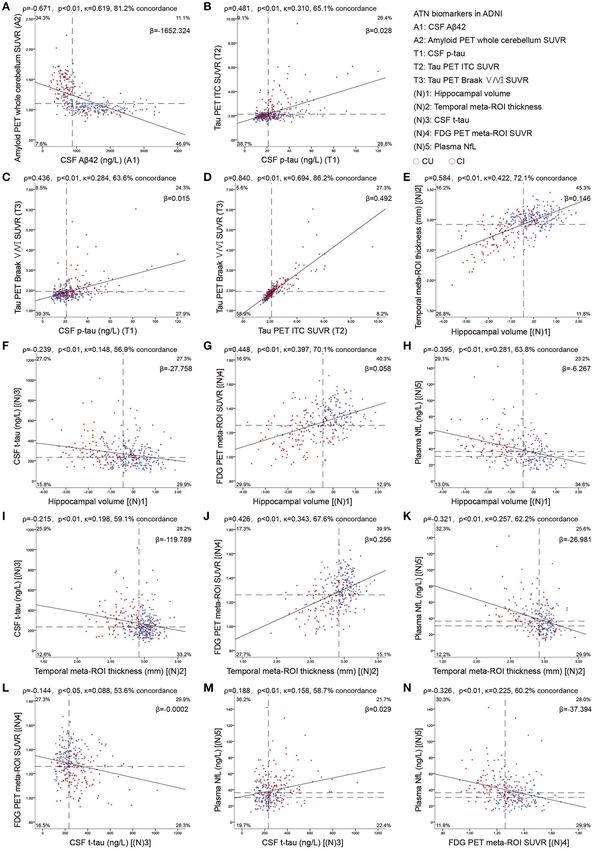
Lin et al.                                                                                           AT(N) Combinations and Longitudinal Cognition

INTRODUCTION                                                             on Wechsler memory scale logical memory II, a CDR of 0.5,
                                                                         absence of significant levels of impairment in other cognitive
Alzheimer’s disease (AD) is the most common cause of                     domains, essentially preserved activities of daily living, and
dementia, and one of the main causes of complications                    an absence of dementia. The AD dementia participants met
and death in the aging population. A series of complex                   NINCDS/ADRDA criteria for probable AD (McKhann et al.,
pathobiological processes is involved in the pathogenesis of             1984), with MMSE scores between 20 and 26 (inclusive) and
AD, including the deposition of extracellular amyloid plaques,           a CDR of 0.5 or 1.0. Demographic and clinical information,
tau-related intracellular neurofibrillary tangles (NFTs), neuronal       neuroimaging, and biomarker data were downloaded from the
loss and atrophy (Long and Holtzman, 2019). Recently, the                ADNI data repository (adni.loni.usc.edu).
National Institute on Aging—Alzheimer’s Association (NIA-
AA) proposed a research framework based on the pathological
characteristics mentioned above (Jack et al., 2018). The
                                                                         CSF and Plasma Biomarker Analysis
                                                                         Cerebrospinal fluid β-amyloid (1-42), phospho-tau (181P), and
framework establishes a classification system consisting of
                                                                         total tau were analyzed using the electrochemiluminescence
biomarkers of Aβ (A), tau (T), and neurodegeneration (N), and
                                                                         immunoassays (ECLIA) Elecsys following a Roche Study
lists a classic AD biomarker grouping including cerebrospinal
                                                                         Protocol (Hansson et al., 2018). Plasma neurofilament light (NfL)
fluid (CSF), MRI, and PET. However, it is not perfectly
                                                                         was obtained using the single molecule array (Simoa) technique.
concordant among biomarkers within a specific component (A,
T, or N) (Jack et al., 2018; Knopman et al., 2018), and all
examinations are usually difficult to perform on patients, which         Neuroimaging Acquisition and Processing
may limit its clinical application. Many studies have compared           The 3T MRI scans were processed before being downloaded as
different biomarkers in a certain component (Mattsson et al.,            previously described (Jack et al., 2008, 2010). FreeSurfer (ADNI
2015; Hansson et al., 2018; La Joie et al., 2018), and have              phase 1, grand opportunity, and phase 2 data were run with
manifested that these biomarkers partially play different roles          FreeSurfer version 5.1, while phase 3 with version 6.0) was used
in the diagnosis, staging, and the progression of Alzheimer’s            for further analysis. Two MRI measures were used, including
pathology. For example, CSF is suitable for early diagnosis              hippocampal volume and cortical thickness. The volume of
(Mattsson et al., 2015), and tau PET is related to cross-sectional       bilateral hippocampal was extracted as the regions of interest
cognition of AD patients (La Joie et al., 2018). This means that         (ROI), and was adjusted for the intracranial volume (ICV) by
different biomarkers need to be selected according to different          calculating the residual term (ε) from a linear regression of
clinical needs. But only one study assessed different combinations       hippocampal volume (y) vs. ICV (x) within 128 ApoE-negative
of AT(N) biomarkers using BioFINDER participants (Mattsson-              CU participants (Jack et al., 2014). The adjusted hippocampal
Carlgren et al., 2020). Here, we used a more comprehensive               volume can be interpreted as a deviation from the expected
biomarker group and focused on the relationship between                  hippocampal volume calculated from the given ICV. An AD
different AT(N) combinations and longitudinal cognition                  signature cortical thickness was composed of mean thickness in
decline. We postulated that the prevalence of AT(N) categories           the entorhinal, inferior temporal, middle temporal, and fusiform
and prediction of longitudinal cognition would vary by different         cortices (Dickerson et al., 2009).
combinations of biomarkers in cognitively unimpaired (CU) and                Amyloid, tau, and metabolic imaging were performed using
cognitively impaired (CI) participants.                                  [18F]florbetapir, [18F]flortaucipir and [18F]fluorodeoxyglucose
                                                                         (FDG) PET, respectively. The [18F]florbetapir standardized
                                                                         uptake value ratios (SUVRs) were calculated by averaging
MATERIALS AND METHODS                                                    the four cortical regions, frontal, which are anterior/posterior
Participants                                                             cingulate, lateral parietal, and lateral temporal cortices (Klunk
All participants in this study were from the Alzheimer’s Disease         et al., 2004; Xue et al., 2020), and dividing the ROIs by the whole
Neuroimaging Initiative (ADNI), a longitudinal multicenter               cerebellum reference region. For tau PET, the inferior temporal
study designed to develop clinical, imaging, genetic, and                cortex (ITC) and the Braak V/VI region (specific regions were
biospecimen biomarkers for tracking the progression of AD.               shown in Supplementary Table 1) were selected as target ROIs.
Regional ethics committees of all institutions approved the              ITC and Braak V/VI indicated early and late stages of tangle
ADNI study. Written informed consent was obtained from                   pathology, respectively (Braak et al., 2006; Johnson et al., 2016).
all participants. The key eligibility criteria were based on the         The [18F]flortaucipir data were corrected for partial volume
ADNI protocol. Cognitively unimpaired (CU) participants must             effects using the geometric transfer matrix approach and divided
be free of memory complaints and cognitively normal, with                by the inferior cerebellar GM reference region (Baker et al., 2017).
MMSE scores between 24 and 30 (inclusive) and a CDR of 0.                The predefined meta-ROIs in FDG PET of AD were composed of
Cognitively impaired (CI) participants must have a subjective            the angular gyrus, posterior cingulate, and ITC normalized to the
memory concern and were divided into two subgroups, namely:              pons and vermis (Herholz et al., 2002).
mild cognitively impaired (MCI) participants and AD dementia
participants. The MCI participants reported MMSE scores                  Cognition Assessment
between 24 and 30 (inclusive), a memory complaint, have                  Cognition was assessed using the longitudinal Mini-Mental State
objective memory loss measured by education-adjusted scores              Examination (MMSE) and Clinical Dementia Rating Sum of

Frontiers in Aging Neuroscience | www.frontiersin.org                2                                    August 2021 | Volume 13 | Article 718959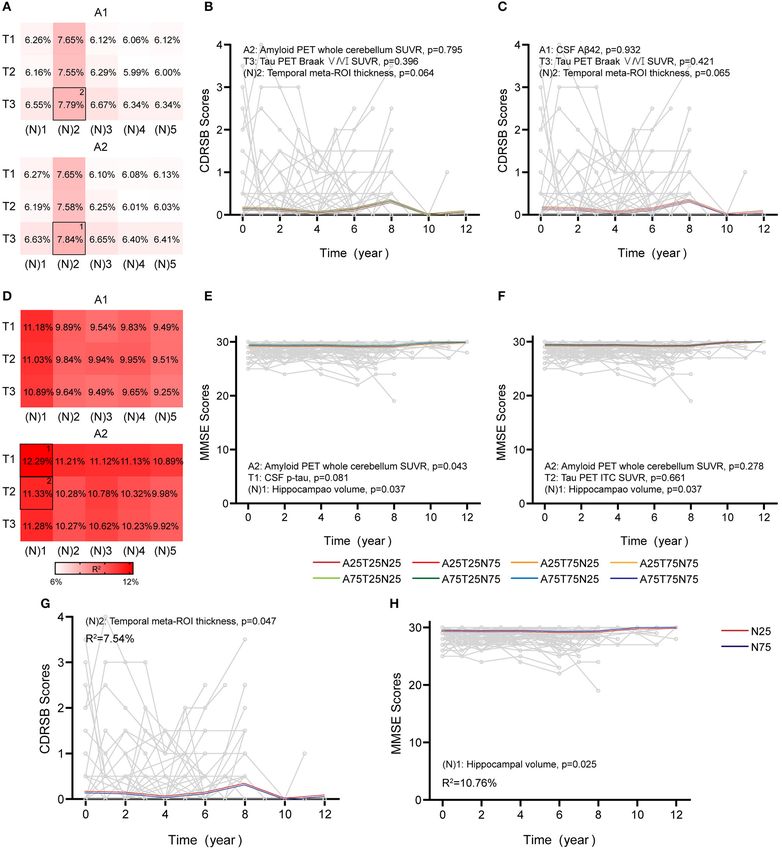
Lin et al.                                                                                                                          AT(N) Combinations and Longitudinal Cognition

TABLE 1 | Characteristics of ADNI participants.

                                                       CU                          CI                    P                    MCI                       AD                      P

No.                                                    200                        141                CU vs. CI                101                        40               MCI vs. AD
Age at baseline, ya                               70.95 ± 6.27               72.25 ± 7.08            0.074417            72.47 ± 6.69              71.72 ± 8.06             0.57102
Female                                             115 (57.5%)                60 (42.6%)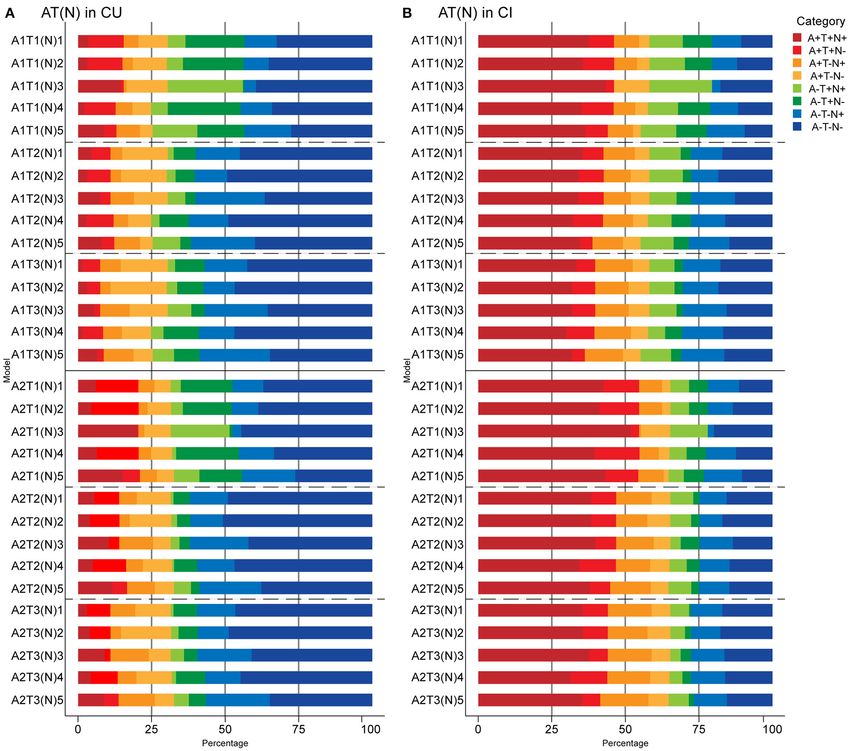
Lin et al.                                                                                           AT(N) Combinations and Longitudinal Cognition

between AT(N) combinations and cognitive trajectories (12-               vs. NfL (ρ = 0.188; all p < 0.001, except as specifically indicated;
year longitudinal MMSE and CDRSB scores) were examined                   Figures 1E–N).
using a linear mixed-effects (LME) model (including age, sex,                Using binary data, there was a substantial agreement
and education as covariates, and time as a categorical variable)         between amyloid biomarkers (Figure 1A), between the
with subject-specific intercepts and slopes. The goodness of             two tau PET measures (Figures 1B–D), and a moderate
LME models with different AT(N) combinations was assessed by             agreement between the two MRI imaging measures (Figure 1E).
marginal R2 , which represented the fixed effect of LME models.          Fair agreement was identified between p-tau and tau PET
All analyses were performed using IBM SPSS Statistics 20, with           (Figures 1B,C), between MRI imaging measures, FDG PET,
significance of the two-tailed test set to p < 0.05.                     and NfL (Figures 1G,H,J,K,N), whereas slight agreement
                                                                         between CSF t-tau and other neurodegeneration biomarkers
                                                                         (Figures 1F,I,L,M).
RESULTS
Study Participants                                                       Prevalence Measures in CU Participants
                                                                         The prevalence of AT(N) categories in CU and CI participants
Demographics are presented in Table 1, and more detailed
                                                                         is summarized in Figures 2, 3 and Supplementary Tables 4, 5.
information is shown in Supplementary Table 2. A significant
                                                                         When only considering A and T in the CU group, A-T- was
difference in age was not observed between CU and CI
                                                                         the most common category (range 43.5% [A1T1; 95% confidence
participants, while more females, higher education level, and a
                                                                         interval, 36.6–50.5%] to 62.0% [A2T2; 95% confidence interval,
lower prevalence of APOE e4 were observed in the CU group.
                                                                         55.0–68.8%]). When comparing A biomarkers, slightly more
No significant differences were observed in age, sex, education,
                                                                         were negative when using CSF Aβ42 instead of amyloid PET (p
or APOE e4 between participants with MCI and AD (subgroups
                                                                         > 0.05). The highest positivity for T was observed when CSF p-
of CI). MMSE scores, Aβ42, hippocampal volume, temporal
                                                                         tau were used for both A+ or A– (p < 0.001) (Figure 2A). Based
cortical thickness, and FDG PET decreased sequentially, while
                                                                         on these results, the use of CSF p-tau may substantially increase
CDRSB scores, amyloid and tau PET, and CSF tau and NfL
                                                                         the positive rate of the T component compared to tau PET in
increased sequentially among the CU, MCI, CI, and AD groups.
                                                                         CU participants.
As plasma NfL levels were reported to be positively associated
                                                                             When adding (N) biomarkers, the most prevalent category
with age (ρ = 0.471, p < 0.01) (Mattsson et al., 2017a, 2019),
                                                                         was A-T-(N)- (range 26.1% [A2T1(N)5; 95% confidence interval,
we divided participants into younger and older groups based on
                                                                         18.7–33.3%] to 50.8% [A2T2(N)2; 95% confidence interval,
the median value (age = 72.25 y) and identified a significant
                                                                         44.1–58.0%]). Although eight possible categories were identified
difference in NfL levels between these groups (p < 0.001).
                                                                         for each AT(N) variants, A+T+(N)+, A+T-(N)+, and A-
Therefore, the prevalence of (N)+ using NfL was likely to vary
                                                                         T+(N)+ had very low frequencies when using MRI imaging and
by age in the present cohort, so we calculated the cutoff based on
                                                                         FDG PET. A+T+(N)-, A+T-(N)+, and A-T+(N)- were almost
age stratification.
                                                                         lacking in the combination of CSF p-tau and t-tau since a strong
                                                                         correlation (ρ = 0.980, p < 0.001) and almost perfect agreement
Biomarker Relationships                                                  (κ =0.876; concordance = 93.8%) was observed between them,
Cutoffs were defined as CSF Aβ42 1.1 SUVR (A2), p-tau > 21.11 ng/L (T1), ITC tau PET >2.122              different biomarkers for (N), CSF t-tau and plasma NfL were the
SUVR (T2), Braak V/VI tau PET >1.938 SUVR (T3), adjusted                 most prevalent biomarkers resulting in (N)+ cases (p < 0.001)
hippocampal volume 36.45 ng/L in older             A+T+ was the main category when only A and T biomarkers
participants. Similar cutoffs were obtained using 90% sensitivity        were used for CI participants (range 39.7% [A1T3; 95%
for AD, while mean ± 2 SD from Aβ-negative CU controls                   confidence interval, 31.8–48.4%] to 54.6% [A2T1; 95%
resulted in more conservative cutoffs (Supplementary Table 3).           confidence interval, 45.7–63.5%]). A and T categories of different
    Continuous biomarkers within each component were                     AT(N) variants in the CI group showed similar trends to the CU
correlated: CSF Aβ42 vs. amyloid PET (ρ = −0.671; Figure 1A),            [i.e., higher prevalence of A+ using amyloid PET (p < 0.05) and
p-tau vs. ITC tau PET (ρ = 0.379) and Braak V/VI (ρ =                    lower prevalence of T+ using tau PET (p < 0.005)] (Figure 2B).
0.380), as well as between the 2 tau PET measures (ρ = 0.851;            There were significant differences in A and T categories between
Figures 1B–D); hippocampal volume vs. temporal cortical                  the two subgroups of CI (Fisher exact test, all p < 0.001). In
thickness (ρ = 0.584), vs. FDG PET (ρ = 0.448), and vs. NfL              participants with MCI, A-T- were the most common categories
(ρ = −0.395); temporal cortical thickness vs. FDG PET (ρ =               when using tau PET in Braak V/VI (Figure 2C). In the AD
0.426), and vs. NfL (ρ = −0.321); and FDG PET vs. NfL (ρ                 group, A+T+ accounted for approximately 75% (range 70%
= −0.326). Weak correlations were observed between CSF                   [A1T3; 95% confidence interval, 55.8–85.3%] to 82.5% [A2T1;
t-tau and other neurodegeneration biomarkers: CSF t-tau                  95% confidence interval, 69.8–93.3%]); the difference from other
vs. hippocampal volume (ρ = −0.239), vs. temporal cortical               groups was the lower prevalence of T+ obtained using CSF p-tau
thickness (ρ = −0.215), vs. FDG PET (ρ = −0.145, p < 0.05) and           than tau PET in the case of A- (p > 0.05) (Figure 2D).

Frontiers in Aging Neuroscience | www.frontiersin.org                4                                    August 2021 | Volume 13 | Article 718959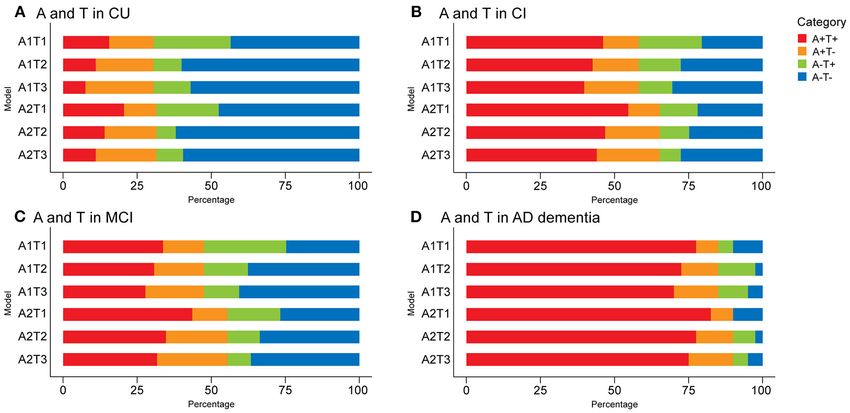
Lin et al.                                                                                                                AT(N) Combinations and Longitudinal Cognition

  FIGURE 1 | Scatterplots show the association between continuous measures for amyloid (A), tau (B–D), and neurodegeneration (E–N) biomarkers. Dashed lines
  indicate cutoff points. Spearman’s correlations (ρ) with p-values, Cohen’s kappa statistic (κ), concordance (percentage showing both biomarkers positive or negative),
                                                                                                                                                            (Continued)

Frontiers in Aging Neuroscience | www.frontiersin.org                               5                                          August 2021 | Volume 13 | Article 718959
Lin et al. AT(N) Combinations and Longitudinal Cognition
FIGURE 1 | and the slope (β) of regression curve are shown at the top of each panel. For A comparisons, the upper left and the lower right quadrants indicate
concordance positive (+/+) and negative (–/–). For T comparisons, lower left and upper right quadrants indicate concordance positive and negative, respectively. For
the comparisons of (N)3 with (N)5, the upper right and lower left quadrants indicate concordance positive and negative, respectively. For the four remaining (N)
comparisons, concordant positives are shown in the upper left quadrant, whereas concordant negatives are shown in the lower right quadrant. Percentage figures
across quadrants indicate distribution (percentagewise) of participants. Aβ, β-amyloid; AT(N), β-amyloid, tau, and neurodegeneration classification system; CI,
cognitively impaired; CU, cognitively unimpaired; ITC, inferior temporal cortex; NfL, neurofilament light; p-tau, tau phosphorylated at Thr181; ROI, region of interest;
SUVR, standardized uptake value ratio; t-tau, total tau.
FIGURE 2 | Prevalence of different AT(N) categories in different AT variants among cognitively unimpaired (CU) (A) and cognitively impaired (CI) (B) participants in the
ADNI. Mild cognitively impaired (MCI) (C) and Alzheimer’s disease (AD dementia) (D) are two subgroups of the CI group. CSF Aβ42 (A1); amyloid PET whole
cerebellum standardized uptake value ratio (SUVR) (A2); CSF tau phosphorylated at Thr181 (T1); tau PET inferior temporal cortex SUVR (T2); tau PET Braak V/VI
SUVR (T3). AT(N), β-amyloid, tau, and neurodegeneration classification system.
When adding (N) biomarkers, the most prevalent category education, p = 0.048 in CDRSB; age, p = 0.025 and education, p
was A+T+(N)+ (range 29.9% [A1T3(N)4; 95% confidence < 0.001 in MMSE), consistent with previous findings (Compton
interval, 23.3–38.6%] to 51.8% [A2T1(N)3; 95% confidence et al., 2000; Ardila and Moreno, 2001). When using a single
interval, 43.2–60.3%]), and the frequencies of T+(N)- and AT(N) biomarker to predict cognitive changes, just the MRI
T-(N)+ in the combination of CSF p-tau and t-tau were imaging contributed significantly (temporal cortical thickness,
relatively low (Figure 3B). As mentioned above, A-T-N- was [N]2, p = 0.047, R2 = 7.54% in CDRSB; hippocampal volume,
the main category when using tau PET in Braak V/VI [N]1, p = 0.025, R2 = 10.76% in MMSE) (Figures 4G,H).
combined with some N biomarkers in the MCI group The best AT(N) variants capturing changes in cognition in
(Supplementary Figure 1A). The AD group had the most CDRSB and MMSE were A2T3(N)2 (amyloid PET, tau PET
A+T+(N)+ (range 60.6% [A1T3(N)5; 95% confidence interval, in Braak V/VI regions, and temporal cortical thickness) and
44.1–76%] to 80% [A2T1(N)3; 95% confidence interval, 67.6– A2T1(N)1 (amyloid PET, CSF p-tau, and hippocampal volume),
92.1%]) among the three groups. Again, several categories were respectively, but not all included biomarkers contributed
lacking or had low frequencies (A-T+N- and A-T-N+ when significantly (A2, p = 0.795, T3, p = 0.396, and [N]2, p = 0.064,
using tau PET) (Supplementary Figure 1B). The prevalence of R2 = 7.84% in CDRSB; A2, p = 0.043, T1, p = 0.081, and [N]1, p
all the (N) biomarkers resulting in (N)+ cases was approximative, = 0.037, R2 = 12.29% in MMSE) (Figures 4B,E). We considered
except it was relatively low when using FDG PET in CI whether random effects accounted for a greater proportion of
individuals (p > 0.05) (Figure 3B). the variance because the marginal R2 for CU participants was
relatively low. Then, we calculated conditional R2 using MRI
Longitudinal Cognition imaging biomarkers (temporal cortical thickness for CDRSB
The overall findings for longitudinal cognition using and hippocampal volume for MMSE). After considering the
continuous predictors are summarized in Figures 4, 5 and random effect, the conditional R2 increased to 19.32% and
Supplementary Tables 6–9. In CU participants, age and 33.55% for the CDRSB and MMSE scores, respectively. These
education significantly affected cognition (age, p = 0.027 and results indicated that longitudinal cognition in CU participants
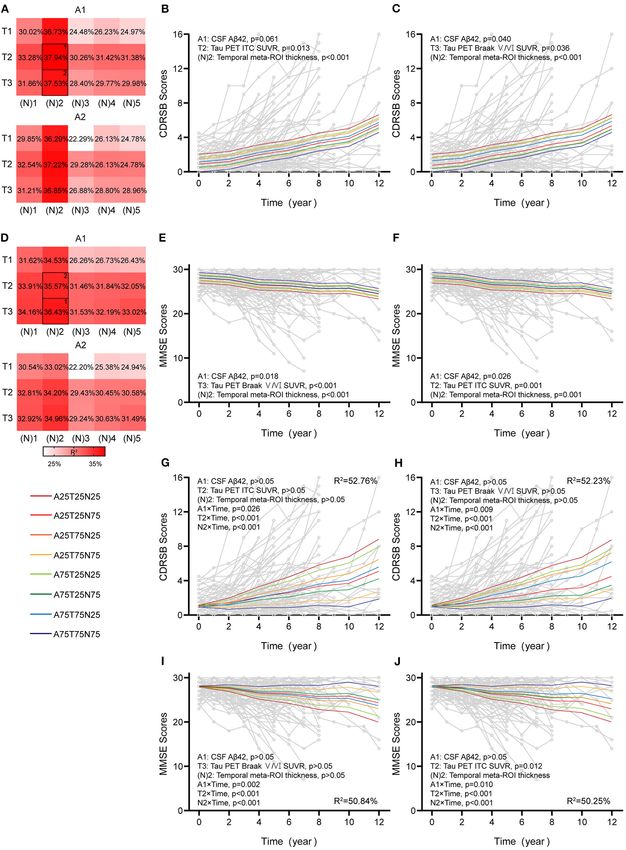
Frontiers in Aging Neuroscience | www.frontiersin.org 6 August 2021 | Volume 13 | Article 718959Lin et al. AT(N) Combinations and Longitudinal Cognition FIGURE 3 | Prevalence of different AT(N) categories in different AT(N) variants among cognitively unimpaired (CU) (A) and cognitively impaired (CI) (B) participants in the ADNI. CSF Aβ42 (A1); amyloid PET whole cerebellum standardized uptake value ratio (SUVR) (A2); CSF tau phosphorylated at Thr181 (T1); tau PET inferior temporal cortex SUVR (T2); tau PET Braak V/VI SUVR (T3); hippocampal volume [(N)1]; temporal meta-ROI thickness [(N)2]; CSF total tau [(N)3]; FDG PET meta-ROI SUVR [(N)4]; plasma neurofilament light [(N)5]. AT(N), β-amyloid, tau, and neurodegeneration classification system. was mainly associated with individual characteristics, and significantly (CDRSB: A1T2[N]2, A1, p = 0.061, T2, p = 0.013, MRI measurements were the best biomarkers to predict [N]2, p < 0.001, R2 = 37.94%; A1T3[N]2, A1, p = 0.040, T3, p = cognitive changes. 0.036, [N]2, p < 0.001, R2 = 37.53%; MMSE: A1T3[N]2, A1, p = In CI participants, individual characteristics were not 0.018, T3, p < 0.001, [N]2, p < 0.001, R2 = 36.43%; A1T2[N]2, significantly associated with cognitive decline. Almost all single A1, p = 0.026, T2, p = 0.001, [N]2, p = 0.001, R2 = 35.57%) AT(N) biomarkers could predict longitudinal cognition, except (Figures 5B,C,E,F). Then, we found that the interaction between CSF p-tau (p = 0.061) and t-tau (p = 0.051) in CDRSB, time and AT(N) variants significantly improved the goodness of and the marginal R2 using MRI imaging and tau PET was fit (AIC and BIC) using a paired t-test (p < 0.001 for CDRSB relatively higher than others (Supplementary Table 6). The and MMSE), and interactions dominated the main effects. Again, AT(N) variants combining CSF Aβ42, tau PET, and temporal CSF Aβ42, tau PET, and temporal cortical thickness were the best cortical thickness were the best predictors in both CDRSB combinations in both scales, and all interactions were significant and MMSE, and almost all included variables contributed (CDRSB: A1T2[N]2, A1, p > 0.05, T2, p > 0.05, [N]2, p > 0.05, Frontiers in Aging Neuroscience | www.frontiersin.org 7 August 2021 | Volume 13 | Article 718959
Lin et al.                                                                                                                AT(N) Combinations and Longitudinal Cognition

  FIGURE 4 | Associations between different AT(N) combinations and longitudinal cognition in the CU group. Marginal R2 for different AT(N) variants to predict
  longitudinal clinical dementia rating sum of boxes (CDRSB) and mini-mental state examination (MMSE) for cognitively unimpaired (CU), respectively (divided by A
  biomarkers) (A,D). The selected models in (B,C) and (E,F) are the top two best models for different cognitive scales. The LME models with significant AT(N)
  biomarkers to predict longitudinal are CDRSB and MMSE, respectively (G,H); AT(N) variants chosen in the model, p-values, and marginal R2 are shown at the top
  (CDRSB) or bottom (MMSE) of each panel; 25 and 75 refer to 25th and 75th quartiles, where a lower value indicates a more abnormal biomarker. Aβ, β-amyloid;
  AT(N), β-amyloid, tau, and neurodegeneration classification system; ITC, inferior temporal cortex; p-tau, tau phosphorylated at Thr181; ROI, region of interest; SUVR,
  standardized uptake value ratio.

Frontiers in Aging Neuroscience | www.frontiersin.org                               8                                           August 2021 | Volume 13 | Article 718959
Lin et al.                                                                                                                  AT(N) Combinations and Longitudinal Cognition

  FIGURE 5 | Associations between different AT(N) combinations and longitudinal cognition in the CI group. Marginal R2 for different AT(N) variants to predict longitudinal
  clinical dementia rating sum of boxes (CDRSB) and mini-mental state examination (MMSE) for cognitively impaired (CI), respectively (divided by A biomarkers) (A,D).
                                                                                                                                                               (Continued)

Frontiers in Aging Neuroscience | www.frontiersin.org                                9                                            August 2021 | Volume 13 | Article 718959
Lin et al. AT(N) Combinations and Longitudinal Cognition
FIGURE 5 | The selected models in (B,C) and (E,F) are the top two best models for the different cognitive scales. The top two best models with an interaction
between time and AT(N) variants to predict longitudinal CDRSB and MMSE, respectively (G–J); AT(N) variants chosen in the model and p-values, and marginal R2 are
shown at the top (CDRSB) or bottom (MMSE) of each panel; 25 and 75 refer to 25th and 75th quartiles, where a lower value indicates a more abnormal biomarker.
Aβ, β-amyloid; AT(N), β-amyloid, tau, and neurodegeneration classification system; ITC, inferior temporal cortex; ROI, region of interest; SUVR, standardized uptake
value ratio.
A1×Time, p = 0.026, T2×Time, p < 0.001, [N]2×Time, p < of the neuropathological load or damage accumulated over time,
0.001, R2 = 52.76%; A1T3[N]2, A1, p > 0.05, T3, p > 0.05, [N]2, p especially tau PET, may greatly assist with the accurate clinical
> 0.05, A1×Time, p = 0.009, T3×Time, p < 0.001, [N]2×Time, staging and determination of the prognosis of patients with
p < 0.001, R2 = 52.23%; MMSE: A1T3[N]2, A1, p > 0.05, T3, p > cognitive impairment.
0.05, [N]2, p > 0.05, A1×Time, p = 0.002, T3×Time, p < 0.001, Biomarkers of AD mainly include fluids and imaging. Here,
[N]2×Time, p < 0.001, R2 = 50.84%; A1T2[N]2, A1, p > 0.05, we chose seven classic biomarkers mentioned in the NIA-AA
T2, p > 0.05, [N]2, p > 0.05, A1×Time, p = 0.010, T2×Time, p Research Framework 2018 (Jack et al., 2016, 2018) and plasma
< 0.001, [N]2×Time, p < 0.001, R2 = 50.25%) (Figures 5G–J). NfL, a candidate neurodegeneration marker identified recently
Finally, similar findings were observed when using the LME (Mattsson et al., 2017a, 2019). However, different biomarkers in
model with time as a covariate to verify the results using the specific AT(N) component may be discordant (Vos et al.,
continuous predictors (Supplementary Table 9). 2016; Jack et al., 2018). In our study, the continuous relationship
between CSF Ab42 and amyloid PET was “L-shaped” rather
Sensitivity Analyses than linear (Figure 1A) (Landau et al., 2013; Palmqvist et al.,
We repeated the AT(N) prevalence analyses using alternative 2015). This may be due to a temporal offset between them
cutoffs (Supplementary Table 10). Using cutoffs from 90% (Mattsson et al., 2015; Palmqvist et al., 2016; Vlassenko et al.,
sensitivity for AD, except for more amyloid positivity using CSF 2016). In addition, the correlation between CSF p-tau and tau
Aβ42 in CU participants, other results were consistent with the PET was imperfect because p-tau seems to plateau later in the
data obtained from the main cutoffs. However, cutoffs defined disease (Fagan et al., 2014) whereas the tau PET signal continues
by the mean ± 2 SD from Aβ-negative CU controls were more to increase (Mattsson et al., 2017b). Among biomarkers in
conservative. The lowest prevalence of T+ was obtained when the (N) component, MRI imaging tends to reflect cumulative
using CSF rather than PET, and temporal cortical thickness in all neuronal loss and shrinkage of the neuropil (Bobinski et al.,
the participants was negative. 2000; Zarow et al., 2005; Barkhof et al., 2007), CSF t-tau, and
plasma NfL manifest the intensity of neuronal injury dynamically
DISCUSSION (van Rossum et al., 2012; Zetterberg, 2016), and FDG PET
likely indicates both processes (Alexopoulos et al., 2014). These
In this study, we found that different combinations of AT(N) differences may explain the discordance among (N) biomarkers.
biomarkers exerted different effects on the category prevalence Regarding the AT(N) prevalence, we noted that both AT(N)
and predictions of cognitive decline. First, the difference in the categories and variants differed between CU and CI participants.
composition of AT(N) categories between CU and CI individuals Normal AD biomarkers (A-T-[N]-) and non-AD pathological
is not surprising. Categories representing the AD continuum change (A-T+[N]-, A-T+[N]+, and A-T-[N]+) account for
were the most common in CI participants, while more subjects most CU individuals, whereas the Alzheimer’s continuum
with non-AD pathological changes were observed in the CU (A+T+[N]-, A+T+[N]+, A+T-[N]-, and A+T-[N]+) accounts
group (Rami et al., 2011; Jack et al., 2018; Knopman et al., for CI individuals, especially AD (A+T+[N]-, A+T+[N]+)
2018; Carandini et al., 2019). Moreover, different AT(N) variants (Jack et al., 2018). Nevertheless, approximately 1/4 of CU
resulted in considerable differences in prevalence, such as a lower individuals are classified as AD continuum without cognitive
prevalence of T+ when using tau PET in all groups and a symptoms. Cognition is also a continuum and the definition
higher prevalence of N+ when using fluid biomarkers in the of CU is independent of biomarker findings according to
CU group. Finally, different AT(N) combinations have different the NIA-AA research framework (Jack et al., 2018). In our
associations with cognitive changes, with differences observed study, the overall prevalence of A+ in CU participants was
between CU and CI groups (MRI was more influential in CU similar, consistent with a metaanalysis (Jansen et al., 2015).
participants and tau PET in CI participants). Taken together, However, greater increases in amyloid positivity were observed
these results indicate that different combinations lead to different between the two groups when using amyloid PET. This may
AT(N) classifications of individuals and different predictions of be because the CSF analysis detects cerebral Aβ accumulation
longitudinal cognition. Our results have important implications earlier than PET (Mattsson et al., 2015; Palmqvist et al., 2016;
for choosing AT(N) combinations according to different needs Vlassenko et al., 2016). The same findings were obtained for tau
of research or clinical applications. For instance, we tend to use positivity when comparing CSF and PET due to a temporal lag
dynamic fluid examinations for early screening and prevention, (Mattsson et al., 2017b; McDade and Bateman, 2018). Among
and cognition may be predicted by non-invasive MRI imaging in the neurodegeneration biomarkers, CSF t-tau and plasma NfL
the CU group. Imaging measures that represent the magnitude were more common in CU participants, whereas no evident
Frontiers in Aging Neuroscience | www.frontiersin.org 10 August 2021 | Volume 13 | Article 718959Lin et al. AT(N) Combinations and Longitudinal Cognition
differences were observed in CI participants. These results are considering interactions in CI participants, but the interactions
consistent with several studies showing that CSF t-tau and blood dominated the main effects. Although AT(N) variants were able
NfL levels are increased before symptom onset (Mattsson et al., to predict cognitive changes, their marginal effects relied on the
2017a; Preische et al., 2019). time level. Overall, we obtained relatively robust results for this
We repeated prevalence calculations using different cutoffs to cohort (MRI for CU participants and the combination of tau
verify the prevalence across AT(N) categories and found that the PET and cortical thickness for CI participants). Compared to a
results were not completely consistent. This finding highlights recent study recruiting participants from Swedish BioFINDER
that the optimization of categorization strategies is important for (Mattsson-Carlgren et al., 2020), we confirmed the importance
future studies. of tau PET in the AD diagnosis and staging, and highlighted that
Here, we analyzed the predictive effect of different AT(N) cortical thickness may have a highly significant contribution to
variants on longitudinal cognition evaluated using both the cognitive decline.
CDRSB and MMSE. CDRSB may enable a more detailed This study has several limitations. First, the sample size in our
analysis of subtle changes with different stages of dementia study was moderate, which may affect the study power. Especially
severity (O’Bryant et al., 2008). First, optimal variants differ by in the prediction of longitudinal cognition, the sample size of
clinical stage. Only MRI measures were significantly associated the AD group was too small, which may lead to deviations. So,
with cognitive changes in CU participants, whereas the best it limited more refined analysis of subgroups. Secondly, we did
model for predicting cognition in CI participants included CSF not consider the Aβ42/Aβ40 ratio because the Aβ40 of many
Aβ42, tau PET, and cortical thickness. When using a single participants was missing in the database (detailed information
AT(N) biomarker for the prediction, no obvious difference was was shown in Supplementary Table 2). Additionally, though our
identified between CSF and PET amyloid plaques. This finding research has obtained relatively robust results, it still warrants
may indicate that CSF Aβ42 and amyloid PET can be used independent validation in other larger cohorts covering all
interchangeably as several studies have reported (Blennow and biomarkers in this study. Furthermore, the greater individual
Zetterberg, 2018; Hansson et al., 2018). When considering the heterogeneity of CU participants may explain the low marginal
AT(N) combinations, we found that the amyloid pathology R2 . Then, differences were observed among different cutoff
contributed the least to longitudinal cognition in the CI group. strategies, and the cutoffs using in the study were sample
This implies that cognitive impairment is weakly related to specific, which may be biased to the sample. Therefore, more
extracellular Aβ burden and is presumably driven by other factors approaches for selecting cutoffs or alternatives to binarization
(Villemagne et al., 2011, 2013; de Wilde et al., 2019), consistent (semicontinuous scale; Jack et al., 2016) must be tested. Finally,
with the characteristics of “A” as state biomarkers (Knopman we only analyzed typical AD biomarkers in this study. With the
et al., 2018). However, CSF p-tau is increased earlier in the disease emergence of an increasing number of biomarkers, they may also
course than tau PET (Blennow and Zetterberg, 2018; La Joie et al., need to be included.
2018; Mattsson-Carlgren et al., 2020). Therefore, between the two Collectively, the proposed AT(N) framework provides a
subgroups of CI, the difference in tau PET was more significant more precise division of the Alzheimer’s continuum based
than that in CSF p-tau. These results might explain why tau PET on the pathology (Jack et al., 2018), but different biomarkers
far exceeded CSF p-tau levels in the longitudinal prediction of for defining AT(N) cannot be used interchangeably. Each
cognition in the CI group. The early tangle pathology identified component of biomarkers included in the AT(N) system
using tau PET was a better predictor of CDRSB than MMSE, classification plays different roles in the stating and staging
consistent with the characteristics of the scales. Compared to of AD, and the optimal combinations for predicting cognition
other N biomarkers, MRI measures, especially cortical thickness, may differ by cognitive status. Furthermore, different strategies
were the best. Since hippocampal volume is strongly related for discontinuous biomarkers will be an important area for
to ICV (Jack et al., 2015), different methods for adjusting the future studies.
volume by ICV associated with sex, age, and study populations
may affect study power (Schwarz et al., 2016). A study proposed
using thickness measurements, rather than volumes, to assess
neurodegeneration in AD cohorts with a large age range (Schwarz DATA AVAILABILITY STATEMENT
et al., 2016). Our results also suggested that cortical thickness
The original contributions presented in the study are included
may predict cognition more precisely. Among all N biomarkers,
in the article/Supplementary Material, further inquiries can be
the lowest marginal R2 was obtained when using CSF t-tau to
directed to the corresponding author/s.
predict longitudinal cognition in CI participants. Firstly, CSF t-
tau was reported to be related to multiple variables (age, sex, or
education), which may attenuate the association with cognition
under adjustment for such covariables (Mielke et al., 2019). ETHICS STATEMENT
Furthermore, recent findings showed that t-tau may be less
specific to AD pathology (Buckley et al., 2019; Mielke et al., 2021), The studies involving human participants were reviewed and
and its longitudinal trajectory along the AD continuum is still approved by the Alzheimer’s Disease Neuroimaging Initiative
controversial (Vemuri et al., 2010; Kester et al., 2012; Toledo (ADNI) study. The patients/participants provided their written
et al., 2013; Lleo et al., 2019). Similar findings were obtained when informed consent to participate in this study.
Frontiers in Aging Neuroscience | www.frontiersin.org 11 August 2021 | Volume 13 | Article 718959Lin et al. AT(N) Combinations and Longitudinal Cognition
AUTHOR CONTRIBUTIONS and through generous contributions from the following:
AbbVie, Alzheimer’s Association; Alzheimer’s Drug Discovery
R-RL: analysis and interpretation of the data and drafting Foundation; Araclon Biotech; BioClinica, Inc.; Biogen; Bristol-
the manuscript. Y-YX, X-YL, and Y-HC: data acquisition, Myers Squibb Company; CereSpir, Inc.; Cogstate; Eisai Inc.; Elan
analysis, and interpretation of the data. Q-QT: funding, design Pharmaceuticals, Inc.; Eli Lilly and Company; EuroImmun; F.
of the study, and critical revision of the manuscript. Z-YW: Hoffmann-La Roche Ltd and its affiliated company Genentech,
funding, conceptualization and design of the study and critical Inc.; Fujirebio; GE Healthcare; IXICO Ltd.; Janssen Alzheimer
revision of the manuscript. All authors reviewed the manuscript, Immunotherapy Research & Development, LLC.; Johnson
contributed to the manuscript revising and editing critically for & Johnson Pharmaceutical Research & Development LLC.;
important intellectual content, given final approval of the version, Lumosity; Lundbeck; Merck & Co., Inc.; Meso Scale Diagnostics,
agreed to be accountable for all aspects of the work presented LLC.; NeuroRx Research; Neurotrack Technologies; Novartis
here, and read and approved the final manuscript. Pharmaceuticals Corporation; Pfizer Inc.; Piramal Imaging;
Servier; Takeda Pharmaceutical Company; and Transition
FUNDING Therapeutics. The Canadian Institutes of Health Research is
providing funds to support ADNI clinical sites in Canada.
This study was supported by grants from the Key Research and Private sector contributions are facilitated by the Foundation for
Development project of Zhejiang Province (2019C03039), the National Institutes of Health (www.fnih.org). The grantee
the National Natural Science Foundation of China organization is the Northern California Institute for Research
(81970998), and the Natural Science Foundation of Zhejiang and Education, and the study is coordinated by the Alzheimer’s
province (LBY21H090003). Therapeutic Research Institute at the University of Southern
California. ADNI data are disseminated by the Laboratory for
ACKNOWLEDGMENTS Neuro Imaging at the University of Southern California.
Data collection and sharing for this project was funded by the
Alzheimer’s Disease Neuroimaging Initiative (ADNI) (National SUPPLEMENTARY MATERIAL
Institutes of Health Grant U01 AG024904) and DOD ADNI
(Department of Defense award number W81XWH-12-2-0012). The Supplementary Material for this article can be found
ADNI was funded by the National Institute on Aging, the online at: https://www.frontiersin.org/articles/10.3389/fnagi.
National Institute of Biomedical Imaging and Bioengineering, 2021.718959/full#supplementary-material
REFERENCES paraffin sections and immunocytochemistry. Acta Neuropathol. 112, 389–404.
doi: 10.1007/s00401-006-0127-z
Alexopoulos, P., Kriett, L., Haller, B., Klupp, E., Gray, K., Grimmer, T., Buckley, R. F., Mormino, E. C., Chhatwal, J., Schultz, A. P., Rabin, J. S., Rentz,
et al. (2014). Limited agreement between biomarkers of neuronal injury D. M., et al. (2019). Associations between baseline amyloid, sex, and APOE
at different stages of Alzheimer’s disease. Alzheimers Dement. 10, 684–689. on subsequent tau accumulation in cerebrospinal fluid. Neurobiol. Aging 78,
doi: 10.1016/j.jalz.2014.03.006 178–185. doi: 10.1016/j.neurobiolaging.2019.02.019
Ardila, A., and Moreno, S. (2001). Neuropsychological test performance in Carandini, T., Arighi, A., Sacchi, L., Fumagalli, G. G., Pietroboni, A. M.,
Aruaco Indians: an exploratory study. J. Int. Neuropsychol. Soc. 7, 510–515. Ghezzi, L., et al. (2019). Testing the 2018 NIA-AA research framework in
doi: 10.1017/s1355617701004076 a retrospective large cohort of patients with cognitive impairment: from
Baker, S. L., Maass, A., and Jagust, W. J. (2017). Considerations and code for partial biological biomarkers to clinical syndromes. Alzheimers Res. Ther. 11:84.
volume correcting [(18)F]-AV-1451 tau PET data. Data Brief 15, 648–657. doi: 10.1186/s13195-019-0543-7
doi: 10.1016/j.dib.2017.10.024 Compton, D. M., Bachman, L. D., Brand, D., and Avet, T. L. (2000). Age-
Barkhof, F., Polvikoski, T. M., van Straaten, E. C., Kalaria, R. N., associated changes in cognitive function in highly educated adults: emerging
Sulkava, R., Aronen, H. J., et al. (2007). The significance of medial myths and realities. Int. J. Geriatr. Psychiatry 15, 75–85. doi: 10.1002/(sici)1099-
temporal lobe atrophy: a postmortem MRI study in the very 1166(200001)15:13.0.co;2-m
old. Neurology 69, 1521–1527. doi: 10.1212/01.wnl.0000277459.83 de Wilde, A., Reimand, J., Teunissen, C. E., Zwan, M., Windhorst, A.
543.99 D., Boellaard, R., et al. (2019). Discordant amyloid-beta PET and CSF
Blennow, K., Wallin, A., Agren, H., Spenger, C., Siegfried, J., and Vanmechelen, biomarkers and its clinical consequences. Alzheimers Res. Ther. 11:78.
E. (1995). Tau protein in cerebrospinal fluid: a biochemical marker for axonal doi: 10.1186/s13195-019-0532-x
degeneration in Alzheimer disease? Mol. Chem. Neuropathol. 26, 231–245. Dickerson, B. C., Bakkour, A., Salat, D. H., Feczko, E., Pacheco, J., Greve, D. N.,
doi: 10.1007/BF02815140 et al. (2009). The cortical signature of Alzheimer’s disease: regionally specific
Blennow, K., and Zetterberg, H. (2018). Biomarkers for Alzheimer’s disease: cortical thinning relates to symptom severity in very mild to mild AD dementia
current status and prospects for the future. J. Intern. Med. 284, 643–663. and is detectable in asymptomatic amyloid-positive individuals. Cereb. Cortex
doi: 10.1111/joim.12816 19, 497–510. doi: 10.1093/cercor/bhn113
Bobinski, M., de Leon, M. J., Wegiel, J., Desanti, S., Convit, A., Saint, L. L., Fagan, A. M., Xiong, C., Jasielec, M. S., Bateman, R. J., Goate, A. M.,
et al. (2000). The histological validation of post mortem magnetic resonance Benzinger, T. L., et al. (2014). Longitudinal change in CSF biomarkers
imaging-determined hippocampal volume in Alzheimer’s disease. Neuroscience in autosomal-dominant Alzheimer’s disease. Sci. Transl. Med. 6:226ra30.
95, 721–725. doi: 10.1016/s0306-4522(99)00476-5 doi: 10.1126/scitranslmed.3007901
Braak, H., Alafuzoff, I., Arzberger, T., Kretzschmar, H., and Del, T. K. Hansson, O., Seibyl, J., Stomrud, E., Zetterberg, H., Trojanowski, J. Q., Bittner, T.,
(2006). Staging of Alzheimer disease-associated neurofibrillary pathology using et al. (2018). CSF biomarkers of Alzheimer’s disease concord with amyloid-beta
Frontiers in Aging Neuroscience | www.frontiersin.org 12 August 2021 | Volume 13 | Article 718959Lin et al. AT(N) Combinations and Longitudinal Cognition PET and predict clinical progression: a study of fully automated immunoassays Mattsson, N., Andreasson, U., Zetterberg, H., and Blennow, K. (2017a). in BioFINDER and ADNI cohorts. Alzheimers Dement. 14, 1470–1481. Association of plasma neurofilament light with neurodegeneration doi: 10.1016/j.jalz.2018.01.010 in patients with Alzheimer disease. JAMA Neurol. 74, 557–566. Herholz, K., Salmon, E., Perani, D., Baron, J. C., Holthoff, V., Frolich, L., doi: 10.1001/jamaneurol.2016.6117 et al. (2002). Discrimination between Alzheimer dementia and controls Mattsson, N., Cullen, N. C., Andreasson, U., Zetterberg, H., and Blennow, K. by automated analysis of multicenter FDG PET. Neuroimage 17, 302–316. (2019). Association between longitudinal plasma neurofilament light and doi: 10.1006/nimg.2002.1208 neurodegeneration in patients with Alzheimer disease. JAMA Neurol. 76, 791. Jack, C. J., Bennett, D. A., Blennow, K., Carrillo, M. C., Feldman, H. H., doi: 10.1001/jamaneurol.2019.0765 Frisoni, G. B., et al. (2016). A/T/N: an unbiased descriptive classification Mattsson, N., Insel, P. S., Donohue, M., Landau, S., Jagust, W. J., Shaw, L. scheme for Alzheimer disease biomarkers. Neurology 87, 539–547. M., et al. (2015). Independent information from cerebrospinal fluid amyloid- doi: 10.1212/WNL.0000000000002923 beta and florbetapir imaging in Alzheimer’s disease. Brain 138, 772–783. Jack, C. J., Bernstein, M. A., Borowski, B. J., Gunter, J. L., Fox, N. C., Thompson, doi: 10.1093/brain/awu367 P. M., et al. (2010). Update on the magnetic resonance imaging core of the Mattsson, N., Scholl, M., Strandberg, O., Smith, R., Palmqvist, S., Insel, P. S., et al. Alzheimer’s disease neuroimaging initiative. Alzheimers Dement. 6, 212–220. (2017b). (18)F-AV-1451 and CSF T-tau and P-tau as biomarkers in Alzheimer’s doi: 10.1016/j.jalz.2010.03.004 disease. EMBO Mol. Med. 9, 1212–1223. doi: 10.15252/emmm.201707809 Jack, C. J., Wiste, H. J., Knopman, D. S., Vemuri, P., Mielke, M. M., Mattsson-Carlgren, N., Leuzy, A., Janelidze, S., Palmqvist, S., Stomrud, E., Weigand, S. D., et al. (2014). Rates of beta-amyloid accumulation are Strandberg, O., et al. (2020). The implications of different approaches independent of hippocampal neurodegeneration. Neurology 82, 1605–1612. to define AT(N) in Alzheimer disease. Neurology 94, e2233–e2244. doi: 10.1212/WNL.0000000000000386 doi: 10.1212/WNL.0000000000009485 Jack, C. R., Bennett, D. A., Blennow, K., Carrillo, M. C., Dunn, B., McDade, E., and Bateman, R. J. (2018). Tau positron emission tomography in Haeberlein, S. B., et al. (2018). NIA-AA research framework: toward a autosomal dominant Alzheimer disease: small windows, big picture. JAMA biological definition of Alzheimer’s disease. Alzheimers Dement. 14, 535–562. Neurol. 75, 536–538. doi: 10.1001/jamaneurol.2017.4026 doi: 10.1016/j.jalz.2018.02.018 McKhann, G., Drachman, D., Folstein, M., Katzman, R., Price, D., and Stadlan, E. Jack, C. R., Bernstein, M. A., Fox, N. C., Thompson, P., Alexander, G., Harvey, M. (1984). Clinical diagnosis of Alzheimer’s disease: report of the NINCDS- D., et al. (2008). The Alzheimer’s disease neuroimaging initiative (ADNI): MRI ADRDA Work Group under the auspices of Department of Health and methods. J. Magn. Reson. Imaging 27, 685–691. doi: 10.1002/jmri.21049 Human Services Task Force on Alzheimer’s Disease. Neurology 34, 939–944. Jack, C. R., Wiste, H. J., Weigand, S. D., Knopman, D. S., Mielke, M. M., Vemuri, doi: 10.1212/wnl.34.7.939 P., et al. (2015). Different definitions of neurodegeneration produce similar Mielke, M. M., Przybelski, S. A., Lesnick, T. G., Kern, S., Zetterberg, H., amyloid/neurodegeneration biomarker group findings. Brain 138, 3747–3759. Blennow, K., et al. (2021). Comparison of CSF neurofilament light chain, doi: 10.1093/brain/awv283 neurogranin, and tau to MRI markers. Alzheimers Dement. 17, 801–812. Jansen, W. J., Ossenkoppele, R., Knol, D. L., Tijms, B. M., Scheltens, P., Verhey, F. doi: 10.1002/alz.12239 R., et al. (2015). Prevalence of cerebral amyloid pathology in persons without Mielke, M. M., Syrjanen, J. A., Blennow, K., Zetterberg, H., Skoog, I., Vemuri, dementia: a meta-analysis. JAMA 313, 1924–1938. doi: 10.1001/jama.2015.4668 P., et al. (2019). Comparison of variables associated with cerebrospinal fluid Johnson, K. A., Schultz, A., Betensky, R. A., Becker, J. A., Sepulcre, J., Rentz, neurofilament, total-tau, and neurogranin. Alzheimers Dement. 15, 1437–1447. D., et al. (2016). Tau positron emission tomographic imaging in aging doi: 10.1016/j.jalz.2019.07.009 and early Alzheimer disease. Ann. Neurol. 79, 110–119. doi: 10.1002/ana. O’Bryant, S. E., Waring, S. C., Cullum, C. M., Hall, J., Lacritz, L., Massman, P. J., 24546 et al. (2008). Staging dementia using Clinical Dementia Rating Scale Sum of Joshi, A. D., Pontecorvo, M. J., Clark, C. M., Carpenter, A. P., Jennings, D. L., Boxes scores: a Texas Alzheimer’s research consortium study. Arch. Neurol. 65, Sadowsky, C. H., et al. (2012). Performance characteristics of amyloid PET with 1091–1095. doi: 10.1001/archneur.65.8.1091 florbetapir F 18 in patients with Alzheimer’s disease and cognitively normal Palmqvist, S., Mattsson, N., and Hansson, O. (2016). Cerebrospinal fluid analysis subjects. J. Nucleic Med. 53, 378–384. doi: 10.2967/jnumed.111.090340 detects cerebral amyloid-beta accumulation earlier than positron emission Kester, M. I., Scheffer, P. G., Koel-Simmelink, M. J., Twaalfhoven, H., Verwey, tomography. Brain 139, 1226–1236. doi: 10.1093/brain/aww015 N. A., Veerhuis, R., et al. (2012). Serial CSF sampling in Alzheimer’s Palmqvist, S., Zetterberg, H., Mattsson, N., Johansson, P., Minthon, L., disease: specific versus non-specific markers. Neurobiol. Aging 33, 1591–1598. Blennow, K., et al. (2015). Detailed comparison of amyloid PET and CSF doi: 10.1016/j.neurobiolaging.2011.05.013 biomarkers for identifying early Alzheimer disease. Neurology 85, 1240–1249. Klunk, W. E., Engler, H., Nordberg, A., Wang, Y., Blomqvist, G., Holt, D. P., doi: 10.1212/WNL.0000000000001991 et al. (2004). Imaging brain amyloid in Alzheimer’s disease with Pittsburgh Preische, O., Schultz, S. A., Apel, A., Kuhle, J., Kaeser, S. A., Barro, C., et al. Compound-B. Ann. Neurol. 55, 306–319. doi: 10.1002/ana.20009 (2019). Serum neurofilament dynamics predicts neurodegeneration and clinical Knopman, D. S., Haeberlein, S. B., Carrillo, M. C., Hendrix, J. A., Kerchner, progression in presymptomatic Alzheimer’s disease. Nat. Med. 25, 277–283. G., Margolin, R., et al. (2018). The National Institute on Aging and doi: 10.1038/s41591-018-0304-3 the Alzheimer’s Association Research Framework for Alzheimer’s disease: Rami, L., Fortea, J., Bosch, B., Sole-Padulles, C., Llado, A., Iranzo, A., et al. (2011). perspectives from the Research Roundtable. Alzheimers Dement. 14, 563–575. Cerebrospinal fluid biomarkers and memory present distinct associations along doi: 10.1016/j.jalz.2018.03.002 the continuum from healthy subjects to AD patients. J. Alzheimers Dis. 23, La Joie, R., Bejanin, A., Fagan, A. M., Ayakta, N., Baker, S. L., Bourakova, 319–326. doi: 10.3233/JAD-2010-101422 V., et al. (2018). Associations between [(18)F]AV1451 tau PET and CSF Schwarz, C. G., Gunter, J. L., Wiste, H. J., Przybelski, S. A., Weigand, S. D., measures of tau pathology in a clinical sample. Neurology 90, e282–e290. Ward, C. P., et al. (2016). A large-scale comparison of cortical thickness and doi: 10.1212/WNL.0000000000004860 volume methods for measuring Alzheimer’s disease severity. Neuroimage Clin. Landau, S. M., Lu, M., Joshi, A. D., Pontecorvo, M., Mintun, M. A., Trojanowski, 11, 802–812. doi: 10.1016/j.nicl.2016.05.017 J. Q., et al. (2013). Comparing positron emission tomography imaging and Toledo, J. B., Xie, S. X., Trojanowski, J. Q., and Shaw, L. M. (2013). Longitudinal cerebrospinal fluid measurements of beta-amyloid. Ann. Neurol. 74, 826–836. change in CSF tau and abeta biomarkers for up to 48 months in ADNI. Acta doi: 10.1002/ana.23908 Neuropathol. 126, 659–670. doi: 10.1007/s00401-013-1151-4 Lleo, A., Alcolea, D., Martinez-Lage, P., Scheltens, P., Parnetti, L., Poirier, J., van Rossum, I. A., Vos, S. J., Burns, L., Knol, D. L., Scheltens, P., et al. (2019). Longitudinal cerebrospinal fluid biomarker trajectories along Soininen, H., et al. (2012). Injury markers predict time to dementia the Alzheimer’s disease continuum in the BIOMARKAPD study. Alzheimers in subjects with MCI and amyloid pathology. Neurology 79, 1809–1816. Dement. 15, 742–753. doi: 10.1016/j.jalz.2019.01.015 doi: 10.1212/WNL.0b013e3182704056 Long, J. M., and Holtzman, D. M. (2019). Alzheimer disease: an Vemuri, P., Wiste, H. J., Weigand, S. D., Knopman, D. S., Trojanowski, J. Q., Shaw, update on pathobiology and treatment strategies. Cell 179, 312–339. L. M., et al. (2010). Serial MRI and CSF biomarkers in normal aging, MCI, and doi: 10.1016/j.cell.2019.09.001 AD. Neurology 75, 143–151. doi: 10.1212/WNL.0b013e3181e7ca82 Frontiers in Aging Neuroscience | www.frontiersin.org 13 August 2021 | Volume 13 | Article 718959
Lin et al.                                                                                                                        AT(N) Combinations and Longitudinal Cognition

Villemagne, V. L., Burnham, S., Bourgeat, P., Brown, B., Ellis, K. A., Salvado,               Zetterberg, H. (2016). Neurofilament light: a dynamic cross-
    O., et al. (2013). Amyloid beta deposition, neurodegeneration, and cognitive                 disease fluid biomarker for neurodegeneration. Neuron 91, 1–3.
    decline in sporadic Alzheimer’s disease: a prospective cohort study. Lancet                  doi: 10.1016/j.neuron.2016.06.030
    Neurol. 12, 357–367. doi: 10.1016/S1474-4422(13)70044-9
Villemagne, V. L., Pike, K. E., Chetelat, G., Ellis, K. A., Mulligan, R. S., Bourgeat,        Conflict of Interest: The authors declare that the research was conducted in the
    P., et al. (2011). Longitudinal assessment of Abeta and cognition in aging and            absence of any commercial or financial relationships that could be construed as a
    Alzheimer disease. Ann. Neurol. 69, 181–192. doi: 10.1002/ana.22248                       potential conflict of interest.
Vlassenko, A. G., McCue, L., Jasielec, M. S., Su, Y., Gordon, B. A., Xiong,
    C., et al. (2016). Imaging and cerebrospinal fluid biomarkers in early                    Publisher’s Note: All claims expressed in this article are solely those of the authors
    preclinical alzheimer disease. Ann. Neurol. 80, 379–387. doi: 10.1002/ana.                and do not necessarily represent those of their affiliated organizations, or those of
    24719
                                                                                              the publisher, the editors and the reviewers. Any product that may be evaluated in
Vos, S., Gordon, B. A., Su, Y., Visser, P. J., Holtzman, D. M., Morris, J. C.,
                                                                                              this article, or claim that may be made by its manufacturer, is not guaranteed or
    et al. (2016). NIA-AA staging of preclinical Alzheimer disease: discordance
    and concordance of CSF and imaging biomarkers. Neurobiol. Aging 44, 1–8.                  endorsed by the publisher.
    doi: 10.1016/j.neurobiolaging.2016.03.025
Xue, M., Sun, F., Ou, Y., Shen, X., Li, H., Huang, Y., et al. (2020). Association of          Copyright © 2021 Lin, Xue, Li, Chen, Tao and Wu. This is an open-access article
    cerebrospinal fluid neurogranin levels with cognition and neurodegeneration               distributed under the terms of the Creative Commons Attribution License (CC BY).
    in Alzheimer’s disease. Aging 12, 9365–9379. doi: 10.18632/aging.103211                   The use, distribution or reproduction in other forums is permitted, provided the
Zarow, C., Vinters, H. V., Ellis, W. G., Weiner, M. W., Mungas, D., White, L.,                original author(s) and the copyright owner(s) are credited and that the original
    et al. (2005). Correlates of hippocampal neuron number in Alzheimer’s disease             publication in this journal is cited, in accordance with accepted academic practice.
    and ischemic vascular dementia. Ann. Neurol. 57, 896–903. doi: 10.1002/ana.               No use, distribution or reproduction is permitted which does not comply with these
    20503                                                                                     terms.

Frontiers in Aging Neuroscience | www.frontiersin.org                                    14                                             August 2021 | Volume 13 | Article 718959
You can also read