Chromosome-scale genome assembly of the sea louse Caligus rogercresseyi by SMRt sequencing and Hi-C analysis - Nature
←
→
Page content transcription
If your browser does not render page correctly, please read the page content below
www.nature.com/scientificdata

               OPEN           Chromosome-scale genome
Data Descriptor               assembly of the sea louse Caligus
                              rogercresseyi by SMRT sequencing
                              and Hi-C analysis
                              Cristian Gallardo-Escárate 1,2 ✉, Valentina Valenzuela-Muñoz1,2, Gustavo Nuñez-Acuña1,2,
                              Diego Valenzuela-Miranda1,2, Ana Teresa Gonçalves 1,2, Hugo Escobar-Sepulveda1,2,
                              Ivan Liachko3, Bradley Nelson3, Steven Roberts 4 & Wesley Warren5

                              Caligus rogercresseyi, commonly known as sea louse, is an ectoparasite copepod that impacts the
                              salmon aquaculture in Chile, causing losses of hundreds of million dollars per year. In this study, we
                              report a chromosome-scale assembly of the sea louse (C. rogercresseyi) genome based on single-
                              molecule real-time sequencing (SMRT) and proximity ligation (Hi-C) analysis. Coding RNAs and
                              non-coding RNAs, and specifically long non-coding RNAs (lncRNAs) and microRNAs (miRNAs) were
                              identified through whole transcriptome sequencing from different life stages. A total of 23,686
                              protein-coding genes and 12,558 non-coding RNAs were annotated. In addition, 6,308 lncRNAs and
                              5,774 miRNAs were found to be transcriptionally active from larvae to adult stages. Taken together,
                              this genomic resource for C. rogercresseyi represents a valuable tool to develop sustainable control
                              strategies in the salmon aquaculture industry.

                              Background & Summary
                              Sea lice are marine copepods that negatively impact the salmon aquaculture worldwide. Two of the most studied
                              sea lice species are Caligus rogercresseyi and Lepeophtheirus salmonis1,2. Annually the salmon farming industry
                              accounts $480 million in losses associated with sea lice, representing 10% of production costs3–5. The parasitism
                              on farmed fish causes skin damage, immunosuppression, and co-infection of opportunistic pathogenic bacte-
                              ria6–8. Like all ectoparasites, lice spend a large part of their life cycle on a fish host, displaying specific mechanisms
                              for evading the host’s immune response9–11.
                                  The life cycle of lice species is complex and consists of several instars divided by moults. For instance, C.
                              rogercresseyi comprises two larval stages (nauplius I, nauplius II and copepodite), four juvenile stages (chalimus
                              I - IV) and one adult stage (female or male)12. During the copepodite stage, the process of host identification
                              occurs, preparing the lice for infestation and settlement8. The successful infestation process on the host allows
                              the parasite access to nutrients for reproduction and adult development13,14. Previous studies have shown that lice
                              have developed physical mechanisms of host recognition. Among these, lice can identify the temperature of the
                              water, salinity changes, and detect the swimming of fish15. Host identification via detection of semiochemicals has
                              also been reported16. In C. rogercresseyi, the presence of advanced chemoreceptors that are capable of identifying
                              specific molecules of different host species has recently been described17–19. Herein, the gene family of ionotropic
                              receptors (IRs) are pivotal molecular components for the salmon-louse interaction20,21.
                                  Molecular understanding of C. rogercresseyi is pivotal to develop sustainable salmon aquaculture. However,
                              genomic resources in this species are limited and poorly characterized at functional levels. In 2012, Yasuike et al.
                              (2012) reported a compilation of genomic information on different sea lice genera, including C. rogercresseyi. It
                              was not until 2014 that Gallardo-Escárate et al.22 reported the transcriptome of different life stages during the
                              ontogenetic development as well as differences between male and female adults. This transcriptomic resource

                              1
                               Interdisciplinary Center for Aquaculture Research, University of Concepción, Concepción, Chile. 2Laboratory of
                              Biotechnology and Aquatic Genomics, Center of Biotechnology, University of Concepción, Concepción, Chile. 3Phase
                              Genomics, Inc., Seattle, USA. 4School of Aquatic and Fishery Sciences (SAFS), University of Washington, Seattle,
                              USA. 5Bond Life Sciences Center, University of Missouri, Columbia, USA. ✉e-mail: crisgallardo@udec.cl

  Scientific Data |   (2021) 8:60 | https://doi.org/10.1038/s41597-021-00842-w                                                                        1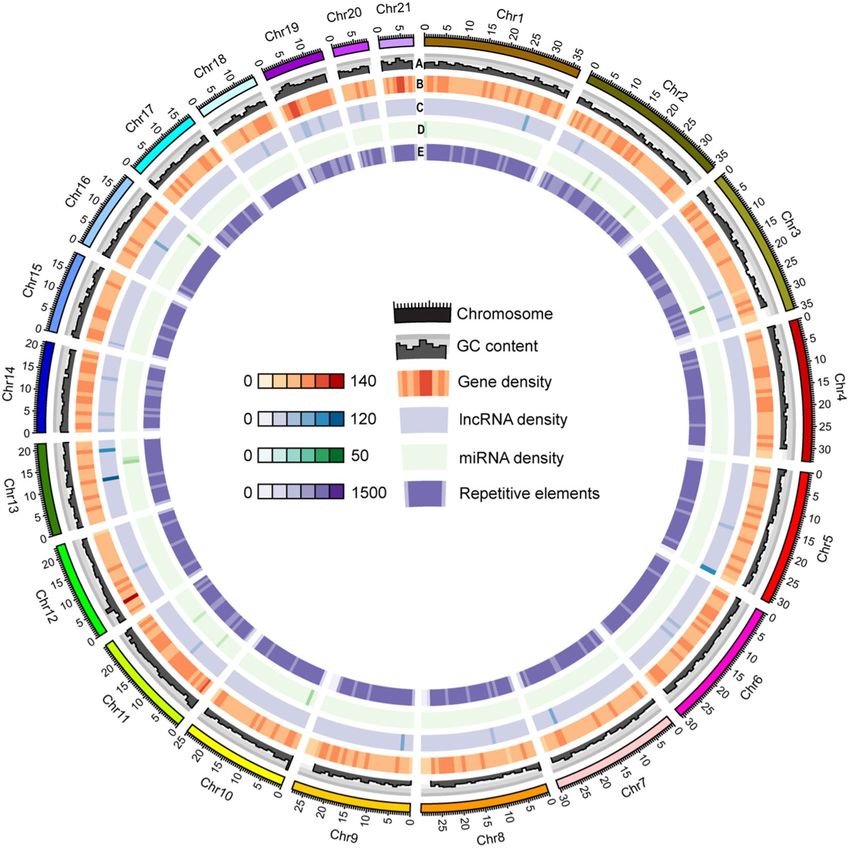
www.nature.com/scientificdata/                                                                              www.nature.com/scientificdata

                            Fig. 1 The sea louse Caligus rogercresseyi. Adult female (right) and adult male (left). Magnification 10x.

                             Library types   Sample                 Platform      Molecule   Library size    Data size (Gb) Application
                             Long reads      Adult females          PacBio SMRT   DNA        20 kb            38.32         Genome assembly
                             Hi-C            Adult females          Hiseq4000     DNA        150 bp           35.79         Chromosome construction
                             Short reads     Developmental stages   MiSeq         RNA        300 bp           52.01         Transcriptome characterization
                             Short reads     Developmental stages   MiSeq         RNA        150 bp           28.18         miRNome characterization

                            Table 1. Sequencing data generated for sea louse C. rogercresseyi genome assembly and annotation.

                            served as a basis to identify genes involved in molting, cuticle formation, myogenesis, metabolism, immune
                            response, nervous system development and reproduction. Notably, this gene set has served as a basis for the
                            design of new vaccines2.
                                The increasing availability of transcriptome data has revealed the importance of non-coding RNAs as key reg-
                            ulators of the mRNA transcription23. To date, microRNAs (miRNAs) and long non-coding RNAs (lncRNAs) have
                            been studied in several arthropod species with special emphasis on parasitic vectors24. Long non-coding RNAs
                            are sequences greater than 200 nucleotides, transcribed in a similar way as coding RNAs25. It has been suggested
                            that the number of lncRNAs has increased during evolution, where organisms with more complex mechanisms
                            have acquired more lncRNAs to control diversifying biological processes. MicroRNAs are transcripts around
                            22 base pairs in length that play an important role in post-transcriptional gene regulation26. There are studies
                            that show that miRNAs are not only regulators of biological processes, but can also participate in parasite-host
                            interaction processes9,27. In insects affected by viruses, it has been observed that viruses are capable of releasing
                            miRNAs that can regulate the expression of their host genes in order to successfully establish the infection28.
                            For C. rogercresseyi, several miRNAs expressed during the different stages of development have been charac-
                            terized29,30. Within the profile of miRNAs characterized in C. rogercresseyi, the miRNA annotated as Bantam is
                            highly expressed in the infective stage of copepodid. This suggests that Bantam has a key role in the success of the
                            infection. Taken together, these resources reported for the sea louse C. rogercresseyi represent a valuable tool to
                            develop sustainable control strategies in the salmon industry. What is lacking is an annotated genome that will
                            facilitate an integrated examination of molecular interactions and provide insight in evolutionary and epigenetics
                            processes that underlie critical life history characteristics. In this study, we report the chromosome-scale whole
                            genome sequence of C. rogercresseyi through application of Pacific Biosciences’ single molecule sequencing tech-
                            nique (SMRT) and Phase Genomics’ proximity ligation (Hi-C) based genome scaffolding.

Scientific Data |   (2021) 8:60 | https://doi.org/10.1038/s41597-021-00842-w                                                                                 2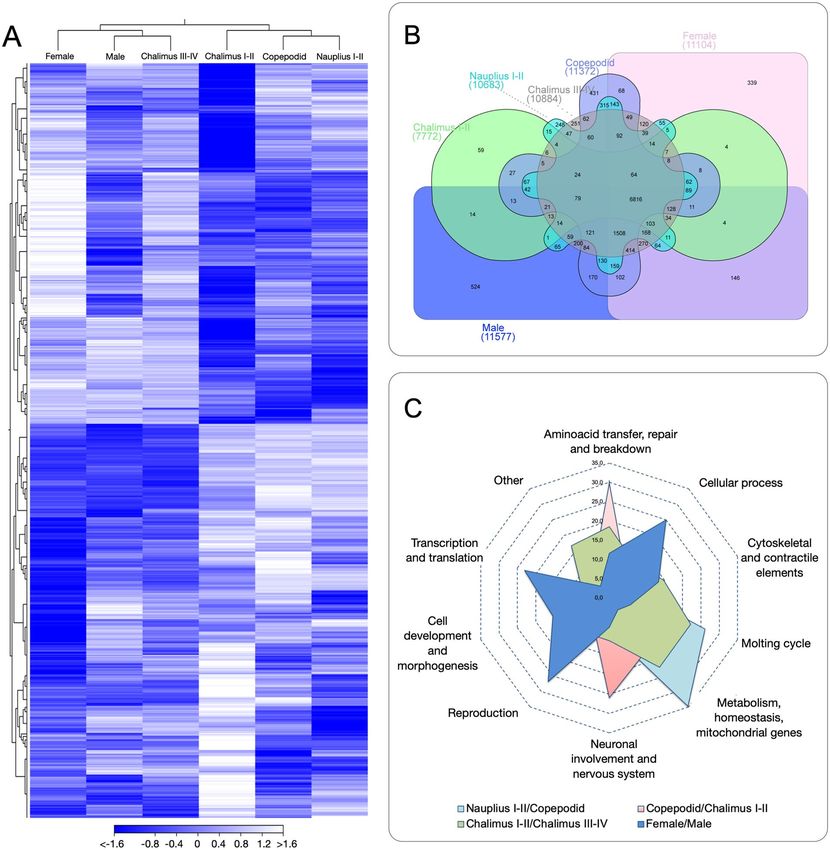
www.nature.com/scientificdata/                                                                     www.nature.com/scientificdata

                             Label                               Assembly statistics
                             Number of contigs (> = 0 bp)        25,608
                             Number of contigs (> = 1000 bp)     25,608
                             Number of contigs (> = 5000 bp)     22,577
                             Number of contigs (> = 10000 bp)    18,391
                             Number of contigs (> = 25000 bp)    9,054
                             Number of contigs (> = 50000 bp)    3,063
                             Total length (> = 0 bp)             727,321,577
                             Total length (> = 1000 bp)          727,321,577
                             Total length (> = 5000 bp)          717,854,023
                             Total length (> = 10000 bp)         686,707,002
                             Total length (> = 25000 bp)         529,822,257
                             Total length (> = 50000 bp)         321,900,412
                             Number of contigs                   25,608
                             Largest contig                      6,415,100
                             Total length                        727,321,577
                             GC (%)                              35.55
                             N50                                 43,366
                             N75                                 23,550
                             L50                                 3,963
                             L75                                 9,700
                             Number of N’s per 100 kbp           0.00

                            Table 2. Genome assembling using PacBio SMRT sequencing in C. rogercresseyi. *All statistics are based on
                            contigs of size > = 500 bp, unless otherwise noted (e.g., “# contigs (> = 0 bp)” and “Total length (> = 0 bp)”
                            include all contigs).

                             Transcriptome de novo assembly              Statistics
                             N75                                         526
                             N50                                         1,156
                             N25                                         2,548
                             Minimum (bp)                                260
                             Maximum (bp)                                19,659
                             Average (bp)                                1,020
                             Number of contigs                           63,444

                            Table 3. Statistics of transcriptome de novo assembly for the sea louse C. rogercresseyi.

                             Label                                  Statistics
                             PacBio assembly
                             Assembly size                          519,118,635
                             Contig (CTG) N50                       38,179
                             CTGs                                   17,711
                             CTGs > 10KB                            15,186
                             CTGs > 5KB                             17,318
                             Hi-C mapping
                             Total read pairs (RPs) analyzed        238,645,537
                             High quality (HQ)* RPs                 9,24%
                             HQ RPs > 10KB apart (CTGs > 10KB)      5.32%
                             Intercontig HQ RPs (CTGs > 10KB)       46.70%
                             Same strand HQ RPs                     7.80%
                             Split reads                            12.55%

                            Table 4. Statistics of genome assembly and Hi-C analysis for the sea louse C. rogercresseyi.

Scientific Data |   (2021) 8:60 | https://doi.org/10.1038/s41597-021-00842-w                                                                 3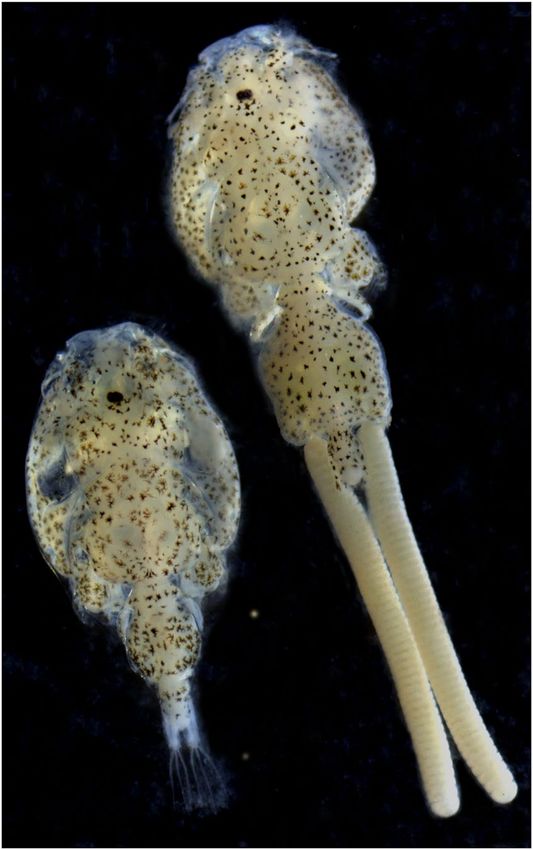
www.nature.com/scientificdata/ www.nature.com/scientificdata
Scaffold number Number of contigs Length (bp)
1 1235 36,773,507
2 1097 35,015,117
3 821 33,056,366
4 879 31,368,135
5 947 30,517,993
6 847 30,174,979
7 909 29,781,277
8 941 27,708,916
9 856 25,041,035
10 852 24,730,313
11 1045 35,690,048
12 867 22,871,160
13 775 21,425,356
14 753 21,073,284
15 698 19,021,882
16 708 18,455,137
17 638 17,498,262
18 626 14,617,582
19 629 14,227,552
20 412 8,245,778
21 396 7,983,448
Total 16931 505,277,127
N50 29,781,277
Table 5. De novo assembly of C. rogercresseyi genome using chromatin interaction mapping. *Number of
scaffolds: 21 (100% of all contigs in chromosome clusters, 95.6% of all contigs).
550
500
400
Position (Mb)
300
200
100
0
0 100 200 300 400 500 550
Position (Mb)
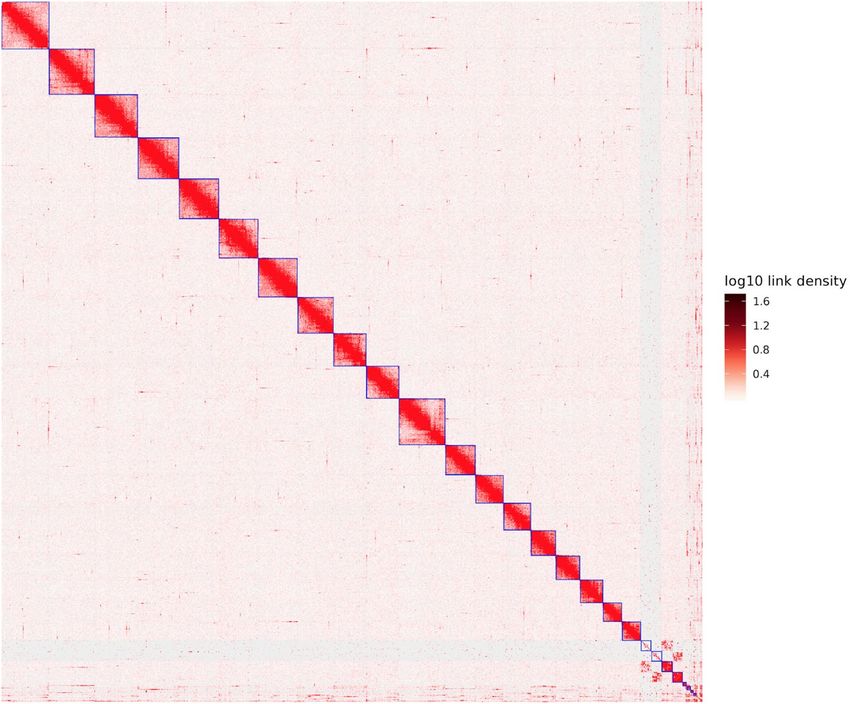
Fig. 2 The sea louse Caligus rogercresseyi genome contig contact matrix using Hi-C data. The blue squares
represent the draft scaffold. The color bar illuminates the Hi-C contact density in the plot.
Scientific Data | (2021) 8:60 | https://doi.org/10.1038/s41597-021-00842-w 4www.nature.com/scientificdata/ www.nature.com/scientificdata
Fig. 3 The sea louse Caligus rogercresseyi genome. The circos plot shows the genomic features for the 21
pseudo-chromosomes. A) GC content, B) Gene density, C) lncRNA density, D) miRNA density and E)
Repetitive elements. The chromosome size is shown in Mb scale.
Methods
Sample collection, NGS libraries, and sequencing. Adult female specimens of Caligus rogercresseyi
were collected from Atlantic salmon (Salmo salar) at the Caligus Reference Laboratory (CRL), University of
Concepción, Chile (Fig. 1). With the aims to reduce the heterozygosity or the number of individuals per pool,
female lice were selected for whole-genome sequencing. The samples were frozen in liquid nitrogen to preserve
DNA quality, and ten females were used for genomic DNA isolation. High quality DNA was isolated using the
Qiagen DNA purification kit (QIAGEN, Germantown, MD, USA) following the manufacturer’s instructions. It
is important to note that sea lice are marine copepods exposed to marine environmental conditions and conse-
quently to commensal microorganisms. To reduce bacterial DNA contamination, lice were treated with 20 mg/
ml ampicillin (Sigma-Aldrich, USA), 20 mg/ml Kanamycin (US biological, USA), 1x Penicillin-Streptomycin
(GIBCO, USA), 100 ug/ml Primocin (Invivogen, USA) for 72 hr prior to the DNA extraction protocol31.
Furthermore, lice from different developmental stages were separately collected, fixed in RNA Later solution
(Ambion, USA), and stored at −80 °C until RNA extractions.
Genomic DNA libraries were constructed according to the manufacturer’s protocols for genome assembly
(Table 1). SMRT sequencing yielded 38.32 Gb long reads from 8 SMRT cells (Table 1S). The subreads N50 and
average lengths were 11,093 and 6,824 bp, respectively. Hi-C libraries were constructed from whole animals using
Phase Genomics’ Animal Hi-C kit and sequenced on an Illumina’s Hiseq4000 platform to yield 238 million of
reads. Short-read sequencing libraries were prepared using an insert size of 150 bp obtained from 1 μg of genomic
DNA, after fragmentation, end-paired, and ligation to adaptors, respectively. The ligated fragments were fraction-
ated on agarose gels and purified by PCR amplification to produce sequencing libraries.
For transcriptome sequencing, RNA libraries were constructed from nauplius I, nauplius II, copepodid,
Chalimus I-II, Chalimus III-IV, males and females, and sequenced by Illumina technology according to the
Scientific Data | (2021) 8:60 | https://doi.org/10.1038/s41597-021-00842-w 5www.nature.com/scientificdata/ www.nature.com/scientificdata
Type Family Copy Numbers
DNA 1,065
DNA/Academ 792
DNA/CMC-Chapaev-3 7,607
DNA/CMC-Transib 262
DNA/Ginger 357
DNA/Merlin 1,907
DNA/MuLE-MuDR 1,764
DNA/P 5,656
DNA/PiggyBac 5,731
DNA/RC 1,073
DNA/Sola 482
DNA/TcMar-Fot1 178
DNA/TcMar-Mariner 12,717
DNA Transposon
DNA/TcMar-Tc1 35,361
DNA/TcMar-Tc2 121
DNA/hAT 5,689
DNA/hAT-Ac 369
DNA/hAT-Blackjack 108
DNA/hAT-Charlie 7,186
DNA/hAT-Tag1 188
DNA/hAT-Tip100 6,023
DNA/hAT-Tol2 1,199
DNA/hAT-hATm 10,502
DNA/hAT-hATw 365
DNA/hAT-hATx 2,052
Total DNA transposons 108,754
LINE 3,942
LINE/Jockey 237
LINE/L1 39,977
LINE/L1-Tx1 9,089
LINE/L2 6,853
LINE/LOA 18,678
LINE
LINE/Penelope 104
LINE/R1 421
LINE/R2 1,407
LINE/RTE-BovB 1,012
LINE/RTE-X 206
Total LINE 81,926
SINE 0
LTR/Copia 196
LTR/DIRS 333
LTR LTR/Gypsy 5,787
LTR/Pao 932
Total LTR 7,248
Total Transposable elements 197,928
Simple repeats 39,847
Unknown 585,381
Table 6. Classification and distribution of repeats based on RepeatModeler from C. rogercresseyi genome.
manufacturer’s protocols (Table 1). Briefly, total RNA was extracted from 10 parasites from each stage using
the Trizol reagent method (Invitrogen, USA). The quality and integrity of extracted RNAs was measured in a
TapeStation 2200 instrument (Agilent, USA), using the R6K Reagent Kit based on manufacturer’s instructions.
RNA samples >9 in RIN numbers were selected for library preparation. For whole transcriptome sequencing, 2
μg of total RNA was used for dscDNA libraries with TruSeq Total RNA kit (Illumina, USA). RNA libraries quan-
tification was conducted by qPCR using the NEBNext Library Quant Kit for Illumina (New England Biolabs,
USA). The sequencing was performed using the MiSeq platform (Illumina, USA) using a 2 × 250 bp paired-end
reads scheme (single flow cell per developmental stage). In addition to generating conventional RNA-seq for 6
Scientific Data | (2021) 8:60 | https://doi.org/10.1038/s41597-021-00842-w 6www.nature.com/scientificdata/ www.nature.com/scientificdata
SSR type Number of SSR Size (bp) Genome coverage* (%)
Dinucleotide 290,331 5,107,439 1.0108
Trinucleotide 61,621 739,346 0.1463
Tetranucleotide 81,696 1,077,404 0.2132
Pentanucleotide 6,677 94,058 0.0186
Hexanuleotide 1,169 24,385 0.0048
Total 441,494 7,042,632 1.3938
Table 7. Simple Sequence Repeats (SSR) of C. rogercresseyi genome using SSR Finder analysis. *Coverage
estimated by the genome size of 505,277,127 bp.
Gene Average gene Ave. CDS % of
Gene set number length (bp) length (bp) genome
Caenorhabditis elegans 16,827 19,740 758 0.66
Homologous comparison Drosophila melanogaster 21,767 18,970 934 0.86
Daphnia pulex 32,143 28,760 1,475 1.69
Augustus 26,970 16,870 887 4.72
Braker 71,522 20,380 695 9.91
Ab initio GeneMarkES 82,621 28,890 1,177 19.26
SNAP 35,139 14,740 612 10.25
GlimmerM 32,588 22,960 172 1.91
EvidenceModeler 25,663 26,210 1,572 2.91
Official gene set (PASA refinement) 23,686 25,510 1,518 2.43
Table 8. Prediction of protein-coding genes in the sea louse Caligus rogercresseyi genome.
developmental stages, small-RNA libraries were also constructed using TruSeq Small RNA Kit (Illumina, USA)
for each stage, with libraries run in 41 single-end cycles. Small-RNA libraries were simultaneously sequenced
using barcodes according to the manufacturer’s protocols. In total 3 flow cells were used to sequence the 6 devel-
opmental stages. A total of 52.01 and 28.18 Gb was yielded for transcriptome and miRNome characterization,
respectively (Table 1).
De novo assembly of C. rogercresseyi genome. With eight single-molecular real-time cells in the
PacBio Sequel platform, we generated 38.32 Gb of high-quality DNA genome information. These long subreads
were assembled with the Canu V1.5 package32 using default parameters, yielding a draft genome for the sea louse
equivalent to 727 Mb with contig N50 of 43,366 bp and 35.55 GC%. The draft genome was assembled with CANU
in 25,608 contigs (Table 2). The size genome assembly made by CANU was comparable with previous genome
size reported for closely related species33,34. However, the manual curation of a subset of contigs revealed bacterial
DNA contamination. As we previously mentioned, antibiotic treatment was applied to reduce the natural lice
microbiota. However, it appeared that some fraction of the bacterial burden still remained despite the antimi-
crobial compound used. To reduce the bacterial DNA contamination, all contigs assembled by Canu were firstly
filtered against NCBI prokaryotic reference sequence database and then against the reference C. rogercresseyi
transcriptome (Table 3). For the first filter, BLASTx was applied with an expectation value of 10.0, word size = 3,
filter low complexity, protein matrix and gap costs = BLOSUM62, Existence, 11-1, meanwhile that for the second
filter a mapping approach was implemented with the following settings using CLC Genomics Workbench V12
(Qiagen, USA): match score = 1, mismatch cost = 2, cost of insertions and deletions = Linear gap cost, insertion
cost = 3, deletion cost = 3, length fraction = 0.5, similarity fraction = 0.8, global alignment = No, non-specific
match handling = map randomly. Taking advantage of the two filters, we removed all the contigs with a significant
match to bacterial DNA, reducing the number of contigs produced by the draft genome for C. rogercresseyi made
by Canu from 25,608 to 17,711 contigs. Here, the new dataset yielded a draft genome assembly of 519.19 Mb with
an N50 of 38,179 bp (Table 4). Notably, the DNA contamination produced by the natural microbiota found in
C. rogercresseyi was ∼30%. This fact shows the importance of the microbiota in louse biology, revealing putative
associations with the pathogenesis of this ectoparasite.
Chromosome assembly of C. rogercresseyi using chromatin interaction mapping analysis. In
vivo Hi-C is a technique that maps physical DNA-DNA proximity across the entire genome35,36. The method was
introduced as a genome-wide version of its predecessor, 3 C (Chromosome Conformation Capture)37, and has
been used as a powerful tool in chromosome-scale genome assembly of many animals in recent years. In this
study, Hi-C experiments and data analysis on adult females were used for the chromosome assembly of the sea
louse C. rogercresseyi. Here, two Hi-C libraries were prepared and sequenced by Phase Genomics (Seattle, WA,
USA), resulting in ∼100x coverage and ∼238 million 150-bp paired-end reads (Table 4). The Hi-C analysis evi-
denced that 46.70% of high-quality reads analysed showed intercontig signals or Cis-close position (10Kbp on the
Scientific Data | (2021) 8:60 | https://doi.org/10.1038/s41597-021-00842-w 7www.nature.com/scientificdata/ www.nature.com/scientificdata
Fig. 4 Stage-specific transcriptome analysis in the sea louse Caligus rogercresseyi. (A) Transcriptome patterns
of coding genes during the lifecycle. The heatmap was based on Transcripts Per Million (TPM) calculation and
hierarchical clustering on Manhattan distances with average linkage. White colors mean upregulated coding
genes, blue colors downregulated genes. (B) Venn diagram showing shared and unique genes expressed among
the six developmental stages. (C) GO enrichment of stage-specific genes (P-value ≤ 10–16;|fold-change| > 5)
annotated for key biological processes differentially expressed. The radar plot represents the comparison
between two developmental stages according the C. rogercresseyi lifecycle.
same contig). To order and orient the 17,711 contigs Hi-C reads were aligned using Bowtie238 and scaffolding
performed using Proximo (Phase Genomics, Seattle, WA, USA). We then applied Juicebox39 for visual inspection
and manual correction. We also manually removed 7,897 scaffolds that were microbe-sized and disconnected
from the rest of the assembly. We obtained the first chromosome-level high-quality C. rogercresseyi assembly
with an N50 scaffold of 29.78 Mb, providing a useful genomic resource for research in sea louse biology and
also, to develop novel control strategies applied to the salmon aquaculture (Table 5). In order to visualize the
scaffold’s length construction, the in vivo Hi-C data were used to generate 21 pseudo-chromosomes assembled
with PacBio consensus long DNA reads (Fig. 2). The largest scaffold was assembled from 1,235 contigs, a size of
36.77 Mb. Meanwhile, the smallest scaffold was 7.98 Mb of length and consisted of 396 original contigs (Fig. 3).
Notably, the number of contigs in scaffolds were 16,931 (100% of all contigs in chromosome clusters, 95.6% of all
contigs) and 505.27 Mb of genome size (100% of all length in chromosome cluster, 97.33% of all sequence length).
Scientific Data | (2021) 8:60 | https://doi.org/10.1038/s41597-021-00842-w 8www.nature.com/scientificdata/ www.nature.com/scientificdata
Type Number Average length (bp) Total length (bp) % of genome
miRNA 5,774 21,97 126.831 0.0251
lncRNA 6,308 520.38 3.282.545 0.6474
tRNA 437 74.20 29,230 0.0069
rRNA (28-
39 639.51 24,941 0.0049
18 s; 5 s)
Table 9. Summary of non-coding RNA annotation in the sea louse Caligus rogercresseyi.
Database Number Percent
InterPro 20,856 88.05
GO 16,308 68.85
KEGG KO 15,165 64.02
Swissprot 21,676 91.51
NR 22,814 96.31
Total 23,686
Table 10. Statistics for genome annotation of the sea louse Caligus rogercresseyi. *e-value threshold of the 1e-5
was applied during the homolog searching for the functional annotation.
Tool Website
BUSCO https://busco.ezlab.org/
RepeatMasker http://www.repeatmasker.org/
RepeatModeler http://www.repeatmasker.org/
AUGUSTUS http://bioinf.uni-greifswald.de/augustus/
BRAKER2 http://exon.gatech.edu/GeneMark/braker1.html
GeneMark-ES http://exon.gatech.edu/GeneMark/
Genscan http://genes.mit.edu/GENSCAN.html
GlimmerM http://www.cbcb.umd.edu/software/glimmerm/
SNAP https://github.com/KorfLab/SNAP
BLAST+ http://blast.ncbi.nlm.nih.gov/Blast.cgi?PAGE_TYPE=BlastDocs&DOC_TYPE=Download
BLAT https://genome.ucsc.edu/FAQ/FAQblat.html; https://github.com/icebert/pblat
Diamond https://github.com/bbuchfink/diamond
PASA http://pasapipeline.github.io/
getorf http://emboss.sourceforge.net/apps/release/6.3/emboss/apps/getorf.html
RNAmmer http://www.cbs.dtu.dk/services/RNAmmer/
SSR Finder GenSAS custom tool, MainLab Bioinformatics
tRNAScan-SE http://lowelab.ucsc.edu/tRNAscan-SE/
EVidenceModeler http://evidencemodeler.github.io/
InterProScan http://www.ebi.ac.uk/Tools/pfa/iprscan5/
Table 11. Software and URLs.
The completeness of genome assembly was assessed by the single-copy ortholog set (BUSCO, V3.0.2) against
Eukaryota, Metazoa, and Arthropoda40. The results indicated a complete BUSCO of 78.9% [S:75.3%, D:3.6%] and
a fragmented BUSCO of 13.5% [M:13.6%, n:303].
Repetitive element and non-coding gene annotation in the C. rogercresseyi genome. Repetitive
elements and non-coding genes in the sea louse genome were annotated by homologous comparison and ab initio
prediction. RepeatMasker41 was used for homologous comparison by searching against the Repbase database
and RepeatModeler42. According to these analyses, about 269.83 Mb Mb of repeat sequences were annotated,
which accounted for 51.9% of the whole genome. Herein, DNA transposons, LINE, and LTR transposable ele-
ments were identified (Table 6). Useful genome information for population genetic studies is the identification of
simple sequence repeats (SSRs) or microsatellites. The mining of SSRs revealed that the C. rogercresseyi genome
has 441,494 SSR sequences, where 65.76% represent dinucleotide motifs (Table 7). The total of SSR sequences
accounted for 1.39% of the whole genome, and the genome distribution was correlated with the chromosome
size (Fig. 1S). Furthermore, SSRs type dinucleotides, and specifically, the motifs AC/GT were the most abundant,
representing the 65.76% of the total microsatellite sequences (Fig. 2S). Trinucleotides and tetranucleotides were
found in 32.46% of the SSRs sequences (Fig. 3 and Table 7).
Scientific Data | (2021) 8:60 | https://doi.org/10.1038/s41597-021-00842-w 9www.nature.com/scientificdata/ www.nature.com/scientificdata
Protein-coding genes prediction and functional annotation in the C. rogercresseyi
genome. For the identification of protein-coding genes, two approaches were employed for the sea louse
genome, including homologous comparison and ab initio prediction. For homologous comparison, the protein
sequences from Caenorhabditis elegans (GCA_000002985.3), Drosophila melanogaster (GCA_000001215.4), and
Daphnia pulex (GL732539.1) genomes were extracted using the respectively published genomes. and aligned
against the sea louse genome using TBLASTN (e-value < 1e-5). Gene sequence structure of each candidate genes
was predicted using GeneWise43. For ad initio prediction, five tools were used to predict protein-coding genes
using the Genome Sequence Annotation Server “GenSAS” (https://www.gensas.org)44. Specifically, Augustus,
Braker, GeneMarkES, SNAP, and GlimmerM were used with default parameters. Finally, a non-redundant
reference gene set was generated using EvidenceModeler (EVM) and PASA2 tools45. Taken together 25,510
protein-coding genes were identified. (Fig. 3 and Table 8). Additionally, 437 tRNAs were predicted using
tRNAscan-SE, and 39 rRNA genes were annotated using RNAmmer via GenSAS. For non-coding RNAs with
putative regulatory roles, 5,774 miRNAs and 6,308 long-ncRNAs were identified and annotated within the C.
rogercresseyi genome using transcriptome sequencing data (Fig. 4 and Table 9). For functional annotation, the
predicted proteins within the sea louse genome were searched by homology against four databases of InterPro46,
GO47, KEGG KO48, and Swissprot49. Overall, 88.05%, 68.85%, 64.02%, and 91.02% of genes matched entries in
these databases, respectively. A total of 23,686 genes (93%) were successfully annotated by gene function and
conserved protein motifs (Table 10).
Technical Validation
RNA integrity. Before constructing RNA-seq libraries, the concentration and quality of total RNA were eval-
uated using Agilent 2100 Bioanalyser (Agilent, USA). Three metrics, including total amount, RNA integrity, and
rRNA ratio, were used to estimate the content, quality, and degradation level of RNA samples. In this study, only
total RNAs with a total amount of ≥10 μg, RNA integrity number ≥8, and rRNA ratio ≥1.5 were finally subjected
to construct the sequencing library.
Quality filtering of Illumina sequencing raw reads. The initial raw sequencing reads were evaluated
in terms of the average quality score at each position, GC content distribution, quality distribution, base com-
position, and other metrics. Furthermore, the sequencing reads with low quality were also filtered out before the
genome assembly and annotation of gene structure.
Data Records
DNA and RNA sequencing runs were deposited to NCBI Sequence Read Archive (SRA)50–52. The assembled
genome has been deposited at NCBI assembly with the accession number ASM1338718v153. Additional files con-
taining repeated sequences, gene structure, and functional prediction were deposited in the Figshare database54.
Code availability
The sequence data were generates using the Genome Sequence Annotation Server “GenSAS” (https://www.
gensas.org)44. No custom computer codes were generated in this work (Table 11).
Received: 10 January 2020; Accepted: 25 January 2021;
Published: xx xx xxxx
References
1. Costelloe, M., Costelloe, J., O’Donohoe, G., Coghlan, N. & O’Connor, B. A review of field studies on the sea louse, Lepeophtheirus
salmonis Kroyer on the west coast of Ireland. Bull Eur Assn Fish P 19, 260–264 (1999).
2. Gallardo-Escarate, C. et al. The race between host and sea lice in the Chilean salmon farming: a genomic approach. Rev Aquacult 11,
325–339, https://doi.org/10.1111/raq.12334 (2019).
3. Dresdner, J. et al. Impact of Caligus treatments on unit costs of heterogeneous salmon farms in Chile. Aquacult Econ Manag 23,
1–27, https://doi.org/10.1080/13657305.2018.1449271 (2019).
4. Costello, M. J. How sea lice from salmon farms may cause wild salmonid declines in Europe and North America and be a threat to
fishes elsewhere. Proc. R. Soc. B-Biol. Sci. 276, 3385–3394, https://doi.org/10.1098/rspb.2009.0771 (2009).
5. Abolofia, J., Wilen, J. E. & Asche, F. The Cost of Lice: Quantifying the Impacts of Parasitic Sea Lice on Farmed Salmon. Mar Resour
Econ 32, 329–349, https://doi.org/10.1086/691981 (2017).
6. Gallardo-Escarate, C. et al. Catching the complexity of salmon-louse interactions. Fish Shellfish Immunol 90, 199–209, https://doi.
org/10.1016/j.fsi.2019.04.065 (2019).
7. Arriagada, G. et al. Caligus rogercresseyi infestation is associated with Piscirickettsia salmonis-attributed mortalities in farmed
salmonids in Chile. Prev Vet Med 171, 104771, https://doi.org/10.1016/j.prevetmed.2019.104771 (2019).
8. Fast, M. D. Fish immune responses to parasitic copepod (namely sea lice) infection. Dev. Comp. Immunol. 43, 300–312, https://doi.
org/10.1016/j.dci.2013.08.019 (2014).
9. Valenzuela-Munoz, V., Novoa, B., Figueras, A. & Gallardo-Escarate, C. Modulation of Atlantic salmon miRNome response to sea
louse infestation. Dev Comp Immunol 76, 380–391, https://doi.org/10.1016/j.dci.2017.07.009 (2017).
10. Valenzuela-Munoz, V. & Gallardo-Escarate, C. Iron metabolism modulation in Atlantic salmon infested with the sea lice
Lepeophtheirus salmonis and Caligus rogercresseyi: A matter of nutritional immunity? Fish Shellfish Immunol. 60, 97–102, https://
doi.org/10.1016/j.fsi.2016.11.045 (2017).
11. Valenzuela-Munoz, V., Boltana, S. & Gallardo-Escarate, C. Uncovering iron regulation with species-specific transcriptome patterns
in Atlantic and coho salmon during a Caligus rogercresseyi infestation. J Fish Dis 40, 1169–1184, https://doi.org/10.1111/jfd.12592
(2017).
12. Gonzalez, L. & Carvajal, J. Life cycle of Caligus rogercresseyi, (Copepoda: Caligidae) parasite of Chilean reared salmonids.
Aquaculture 220, 101–117, https://doi.org/10.1016/S0044-8486(02)00512-4 (2003).
13. Goncalves, A. T., Farlora, R. & Gallardo-Escarate, C. Transcriptome survey of the lipid metabolic pathways involved in energy
production and ecdysteroid synthesis in the salmon louse Caligus rogercresseyi (Crustacea: Copepoda). Comp Biochem Phys B 176,
9–17, https://doi.org/10.1016/j.cbpb.2014.07.002 (2014).
Scientific Data | (2021) 8:60 | https://doi.org/10.1038/s41597-021-00842-w 10www.nature.com/scientificdata/ www.nature.com/scientificdata
14. Farlora, R., Araya-Garay, J. & Gallardo-Escarate, C. Discovery of sex-related genes through high-throughput transcriptome
sequencing from the salmon louse Caligus rogercresseyi. Mar Genomics 15, 85–93, https://doi.org/10.1016/j.margen.2014.02.005
(2014).
15. Mordue, A. J. & Birkett, M. A. A review of host finding behaviour in the parasitic sea louse, Lepeophtheirus salmonis (Caligidae:
Copepoda). J. Fish Dis. 32, 3–13, https://doi.org/10.1111/j.1365-2761.2008.01004.x (2009).
16. Fields, D. M., Weissburg, M. J. & Browman, H. Chemoreception in the salmon louse Lepeophtheirus salmonis: an electrophysiology
approach. Diseases of Aquatic Organisms 78, 161–168, https://doi.org/10.3354/dao01870 (2007).
17. Nunez-Acuna, G. et al. The Atlantic salmon (Salmo salar) antimicrobial peptide cathelicidin-2 is a molecular host-associated cue for
the salmon louse (Lepeophtheirus salmonis). Sci Rep 8, 13738, https://doi.org/10.1038/s41598-018-31885-6 (2018).
18. Nunez-Acuna, G., Gallardo-Escarate, C., Skiftesvik, A. B., Fields, D. M. & Browman, H. I. Silencing of ionotropic receptor 25a
decreases chemosensory activity in the salmon louse Lepeophtheirus salmonis during the infective stage. Gene 697, 35–39, https://
doi.org/10.1016/j.gene.2019.02.012 (2019).
19. Ingvarsdottir, A. et al. Semiochemical strategies for sea louse control: host location cues. Pest Manag Sci 58, 537–545, https://doi.
org/10.1002/ps.510 (2002).
20. Nunez-Acuna, G., Valenzuela-Munoz, V., Marambio, J. P., Wadsworth, S. & Gallardo-Escarate, C. Insights into the olfactory system
of the ectoparasite Caligus rogercresseyi: Molecular characterization and gene transcription analysis of novel ionotropic receptors.
Exp Parasitol 145, 99–109, https://doi.org/10.1016/j.exppara.2014.08.003 (2014).
21. Komisarczuk, A. Z., Grotmol, S. & Nilsen, F. Ionotropic receptors signal host recognition in the salmon louse (Lepeophtheirus
salmonis, Copepoda). Plos One 12, https://doi.org/10.1371/journal.pone.0178812 (2017).
22. Gallardo-Escarate, C., Valenzuela-Munoz, V. & Nunez-Acuna, G. RNA-Seq Analysis Using De Novo Transcriptome Assembly as a
Reference for the Salmon Louse Caligus rogercresseyi. Plos One 9, https://doi.org/10.1371/journal.pone.0092239 (2014).
23. Patil, V. S., Zhou, R. & Rana, T. M. Gene regulation by non-coding RNAs. Crit Rev Biochem Mol 49, 16–32, https://doi.org/10.3109/
10409238.2013.844092 (2014).
24. Bensaoud, C., Hackenberg, M. & Kotsyfakis, M. Noncoding RNAs in Parasite-Vector-Host Interactions. Trends Parasitol 35,
715–724, https://doi.org/10.1016/j.pt.2019.06.012 (2019).
25. Mattick, J. S. & Rinn, J. L. Discovery and annotation of long noncoding RNAs. Nat Struct Mol Biol 22, 5–7 (2015).
26. O’Brien, J., Hayder, H., Zayed, Y. & Peng, C. Overview of MicroRNA Biogenesis, Mechanisms of Actions, and Circulation. Front
Endocrinol 9, https://doi.org/10.3389/fendo.2018.00402 (2018).
27. LaMonte, G. et al. Translocation of Sickle Cell Erythrocyte MicroRNAs into Plasmodium falciparum Inhibits Parasite Translation
and Contributes to Malaria Resistance. Cell Host Microbe 12, 187–199, https://doi.org/10.1016/j.chom.2012.06.007 (2012).
28. Monsanto-Hearne, V. & Johnson, K. N. miRNA Modulation of Insect Virus Replication. Curr Issues Mol Biol 34, 61–82, https://doi.
org/10.21775/cimb.034.061 (2019).
29. Valenzuela-Miranda, D., Nunez-Acuna, G., Valenzuela-Munoz, V., Asgari, S. & Gallardo-Escarate, C. MicroRNA biogenesis
pathway from the salmon louse (Caligus rogercresseyi): emerging role in delousing drug response. Gene 555, 231–241, https://doi.
org/10.1016/j.gene.2014.11.008 (2015).
30. Gallardo-Escárate, C. et al. The Caligus rogercresseyi miRNome: Discovery and transcriptome profiling during the sea lice ontogeny.
Agri Gene 4, 8–22, https://doi.org/10.1016/j.aggene.2017.03.002 (2017).
31. Kao, D. M. et al. The genome of the crustacean Parhyale hawaiensis, a model for animal development, regeneration, immunity and
lignocellulose digestion. Elife 5, https://doi.org/10.7554/eLife.20062 (2016).
32. Koren, S. et al. Canu: scalable and accurate long-read assembly via adaptive k-mer weighting and repeat separation. Genome Res 27,
722–736, https://doi.org/10.1101/gr.215087.116 (2017).
33. Gregory, T. R. http://www.genomesize.com (2019).
34. Jeong, C.-B. et al. The genome of the harpacticoid copepod Tigriopus japonicus: Potential for its use in marine molecular
ecotoxicology. Aquat Toxicol 222, https://doi.org/10.1016/j.aquatox.2020.105462 (2020).
35. Ghurye, J. et al. Integrating Hi-C links with assembly graphs for chromosome-scale assembly. Plos Comput Biol 15, https://doi.
org/10.1371/journal.pcbi.1007273 (2019).
36. Pal, K., Forcato, M. & Ferrari, F. Hi-C analysis: from data generation to integration. Biophys Rev 11, 67–78, https://doi.org/10.1007/
s12551-018-0489-1 (2019).
37. Dekker, J., Rippe, K., Dekker, M. & Kleckner, N. Capturing chromosome conformation. Science 295, 1306–1311, https://doi.
org/10.1126/science.1067799 (2002).
38. Langmead, B. & Salzberg, S. L. Fast gapped-read alignment with Bowtie 2. Nat Methods 9, 357–U354, https://doi.org/10.1038/
Nmeth.1923 (2012).
39. Durand, N. C. et al. Juicebox Provides a Visualization System for Hi-C Contact Maps with Unlimited Zoom. Cell Syst 3, 99–101,
https://doi.org/10.1016/j.cels.2015.07.012 (2016).
40. Seppey, M., Manni, M. & Zdobnov, E. M. BUSCO: Assessing Genome Assembly and Annotation Completeness. Gene Prediction:
Methods and Protocols 1962, 227–245, https://doi.org/10.1007/978-1-4939-9173-0_14 (2019).
41. Bedell, J. A., Korf, I. & Gish, W. MaskerAid: a performance enhancement to RepeatMasker. Bioinformatics 16, 1040–1041, https://
doi.org/10.1093/bioinformatics/16.11.1040 (2000).
42. Bao, W. D., Kojima, K. K. & Kohany, O. Repbase Update, a database of repetitive elements in eukaryotic genomes. Mobile DNA-Uk
6, https://doi.org/10.1186/s13100-015-0041-9 (2015).
43. Birney, E., Clamp, M. & Durbin, R. GeneWise and genomewise. Genome Res 14, 988–995, https://doi.org/10.1101/gr.1865504
(2004).
44. Humann, J. L., Lee, T., Ficklin, S. & Main, D. Structural and Functional Annotation of Eukaryotic Genomes with GenSAS. Gene
Prediction: Methods and Protocols 1962, 29–51, https://doi.org/10.1007/978-1-4939-9173-0_3 (2019).
45. Haas, B. J. et al. Automated eukaryotic gene structure annotation using EVidenceModeler and the program to assemble spliced
alignments. Genome Biol 9, https://doi.org/10.1186/gb-2008-9-1-r7 (2008).
46. Finn, R. D. et al. InterPro in 2017-beyond protein family and domain annotations. Nucleic Acids Res 45, D190–D199, https://doi.
org/10.1093/nar/gkw1107 (2017).
47. Harris, M. A. et al. The Gene Ontology (GO) database and informatics resource. Nucleic Acids Res 32, D258–261, https://doi.
org/10.1093/nar/gkh036 (2004).
48. Kanehisa, M. et al. Data, information, knowledge and principle: back to metabolism in KEGG. Nucleic Acids Res 42, D199–205,
https://doi.org/10.1093/nar/gkt1076 (2014).
49. UniProt, C. UniProt: a worldwide hub of protein knowledge. Nucleic Acids Res 47, D506–D515, https://doi.org/10.1093/nar/gky1049
(2019).
50. NCBI Sequence Read Archive https://identifiers.org/ncbi/insdc.sra:SRP229458 (2019).
51. NCBI Sequence Read Archive https://identifiers.org/ncbi/insdc.sra:SRP212140 (2019).
52. NCBI Sequence Read Archive https://identifiers.org/ncbi/insdc.sra:SRP067375 (2015).
53. NCBI Assembly https://identifiers.org/insdc.gca:GCA_013387185.1 (2020).
54. Gallardo-Escárate, C. Additional annotation files_GenSAS. figshare https://doi.org/10.6084/m9.figshare.12847493 (2020).
Scientific Data | (2021) 8:60 | https://doi.org/10.1038/s41597-021-00842-w 11www.nature.com/scientificdata/ www.nature.com/scientificdata
Acknowledgements
This study was funded by the Program for Health Management of Aquaculture, FIE‐2015‐V014, FONDECYT
grant #1180867, and FONDAP grant #15110027, CONICYT-Chile.
Author contributions
C.G.-E., W.W. and S.R. designed and supervised the study. V.V., G.N.A., D.V.M. and A.T.G. prepared the samples.
C.G.E., W.W., S.R., I.L., D.V.M. and B.N. analysed all sequencing data. C.G.E., W.W. and S.R. wrote the manuscript
with the other authors’ helps. All authors revised the draft and approved the final manuscript.
Competing interests
IL and BN are employees and shareholders of Phase Genomics, Inc, a company commercializing Hi-C
technology.
Additional information
Supplementary information The online version contains supplementary material available at https://doi.
org/10.1038/s41597-021-00842-w.
Correspondence and requests for materials should be addressed to C.G.-E.
Reprints and permissions information is available at www.nature.com/reprints.
Publisher’s note Springer Nature remains neutral with regard to jurisdictional claims in published maps and
institutional affiliations.
Open Access This article is licensed under a Creative Commons Attribution 4.0 International
License, which permits use, sharing, adaptation, distribution and reproduction in any medium or
format, as long as you give appropriate credit to the original author(s) and the source, provide a link to the Cre-
ative Commons license, and indicate if changes were made. The images or other third party material in this
article are included in the article’s Creative Commons license, unless indicated otherwise in a credit line to the
material. If material is not included in the article’s Creative Commons license and your intended use is not per-
mitted by statutory regulation or exceeds the permitted use, you will need to obtain permission directly from the
copyright holder. To view a copy of this license, visit http://creativecommons.org/licenses/by/4.0/.
The Creative Commons Public Domain Dedication waiver http://creativecommons.org/publicdomain/zero/1.0/
applies to the metadata files associated with this article.
© The Author(s) 2021
Scientific Data | (2021) 8:60 | https://doi.org/10.1038/s41597-021-00842-w 12You can also read


