Polystyrene microplastic contamination versus microplankton abundances in two lagoons of the Florida Keys
←
→
Page content transcription
If your browser does not render page correctly, please read the page content below
www.nature.com/scientificreports
OPEN Polystyrene microplastic
contamination
versus microplankton abundances
in two lagoons of the Florida Keys
Susan Badylak1, Edward Phlips1*, Christopher Batich2, Miranda Jackson1 & Anna Wachnicka3
A microscopic study of microplankton in two coastal lagoons in the Florida Keys coincidently, and
unexpectedly, revealed the widespread presence of high concentrations of polystyrene microplastic
particles. The polystyrene particles were first observed in the second year of a 2-year study of
phytoplankton communities, with peak densities in the spring/summer of 2019 at all ten sampling
sites in the two lagoons. Polystyrene particle densities reached levels up to 76,000 L−1. The particles
ranged in size from 33 to 190 µm, similar to the size range of microplanktonic algae (20–200 µm). Over
the period of peak polystyrene densities, average particle densities were similar to average densities
of microplanktonic algae cells. The latter observation highlights the potential significance of the
microplastic particles for the ecology of the pristine waters of the Florida Keys, if they persist.
Since the development of synthetic polymer production in the early twentieth century the disposal of plastic
materials into the environment has grown exponentially throughout the g lobe1–3. Plastic materials are carbon-
based polymers made mostly from petroleum. Unfortunately, plastics have very slow rates of degradation, which
can result in persistent presence in the environment for decades to millennia2,4,5. The United Nations Environ-
ment Programme considers plastic contamination a critically important environmental issue facing the global
community6. Regionally, population size and waste management practices influence the output of plastic debris
into the marine environment and without infrastructure improvements the quantity released into the oceans is
expected to continue its i ncrease7.
Plastic waste in the environment comes in many visibly obvious forms, known as macroplastics, such as plastic
bags, drinking straws, milk jugs, rope, netting, food utensils and containers, floats, plastic bottles and cigarette
filters8–11. The scope of macroplastic accumulation is evidenced by littered shorelines around the world. While
macroplastics are the most visible components of plastic contamination very small particles, known as micro-
plastics, may be just as important3,12. One of the initial observations of microplastics was in the early 1970s when
small plastic particles were observed in water samples collected with a plankton n et13. At the first international
microplastic workshop plastic particles less than 5 mm in diameter were defined as microplastics14. In 2012,
Hidalgo-Ruz et al.15 suggested two size classes of microplastics, 1µ–500 µm and 500 µm–5 mm, for the purpose
of reporting. Since their discovery it has become obvious that microscopic plastic particles are widespread in
the ocean and have accumulated in pelagic and sedimentary habitats5.
Here, we report on an observation of high concentrations of polystyrene microplastics in two coastal lagoons
of the Florida Keys, widely viewed as among the most pristine marine waters along the eastern seaboard of the
United States. The observation coincided with a study of the impact of coastal freshwater discharges on the ecol-
ogy of phytoplankton communities in the two lagoons. The size of the polystyrene microplastic particles observed
in the water samples fell within the range associated with microplanktonic algae, 20µ–200 µm16. The peak numeri-
cal abundances of the polystyrene microplastic particles were in the same abundance range as microplanktonic
algae. While not visually obvious, the presence of such high concentrations of microplastics, if persistent, may
have environmental consequences, such as disruption of food webs3,17–19 and alteration of microbial processes20.
1
Fisheries and Aquatic Sciences Program, S.F.R.C., University of Florida, 7922 NW 71st, Gainesville, FL 32653,
USA. 2Materials Science and Engineering, University of Florida, PO Box 116400, Gainesville, FL 32611, USA. 3South
Florida Water Management District, 3301 Gun Club Road, West Palm Beach, FL 33406, USA. *email: phlips@
ufl.edu
Scientific Reports | (2021) 11:6029 | https://doi.org/10.1038/s41598-021-85388-y 1
Vol.:(0123456789)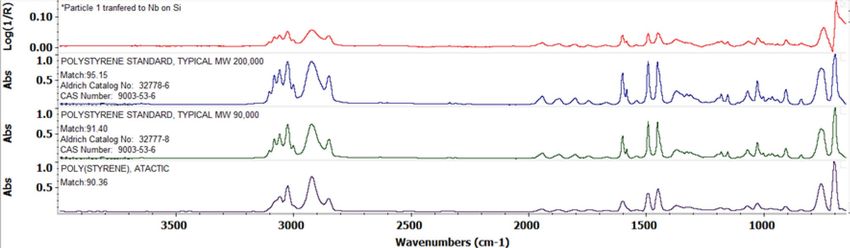
www.nature.com/scientificreports/
Figure 1. Map of sample regions and study sites (map was based on ArcMap Version 10.7 base image).
Methods
Site description. Two coastal lagoons in the Florida Keys were included in this study, northeast Florida Bay,
and Barnes Sound (including Manatee Bay) in the southern-most region of the broader Biscayne Bay ecosystem.
Both regions are shallow, with depths less than 2–3 m and are characterized by extensive seagrass beds and fring-
ing mangrove communities21,22. The study region is located in the sub-tropical environment of south Florida,
which is characterized by modest seasonal temperature differences, and a dry season (November to May) and
wet season (June–October), which coincides with the tropical storm season. The lagoons are part of a biodiverse
marine ecosystem which provides food, shelter and nursery grounds for numerous fish and invertebrate species,
including sponges, shrimp, spiny lobster, stone crab, as well as wading bird and marine mammal populations23,24.
Northeast Florida Bay is directly influenced by watershed discharges from the Florida Everglades wetlands and
experiences water exchange with the southeast regions of the bay, which is bordered by the upper Florida Keys.
Barnes Sound is connected to Biscayne Bay via the Intercoastal Waterway, a navigational feature that extends
over the east coast of Florida. Barnes Sound (including Manatee Bay) receives freshwater inflows from the C111
Canal that drains freshwater from Everglades coastal wetlands, which are adjacent to agricultural, industrial and
urban lands of southern Miami Dade County.
The sampling regime was originally designed to investigate the effects of water discharges from the land on
downstream water quality and phytoplankton biomass and composition. Ten sampling sites were selected, five
in northeast Florida Bay and five in Barnes Sound (including Manatee Bay) (Fig. 1).
Sample collection. Twenty sampling events were carried out from May 2018 to April 2020 at ten sampling
sites. Water samples were collected with an integrating sample pole (PVC) that captured water from the surface
ottom25. Three pole samples at each site were mixed in a mixing vessel (HDPE) and ali-
to within 0.3 m of the b
quots were withdrawn and preserved with Lugol’s solution. The aliquots were kept in 125 mL amber glass bottles
until microscopic analysis.
Microscopic analysis. Prior to microscopic analysis, aliquots of the Lugol’s preserved samples were con-
centrated by pouring 100 mL of sample water into a graduated cylinder (HDPE) and allowed to settle for a
week. Concentrated samples were drawn down to 20 mL, yielding a five-fold increase in concentration. The
concentrated bottom 20 mL were kept in glass scintillation vials for plankton and plastic particle enumeration.
To ensure all plastic particles had settled to the bottom of the graduated cylinder the 80 mL supernatant of a
Scientific Reports | (2021) 11:6029 | https://doi.org/10.1038/s41598-021-85388-y 2
Vol:.(1234567890)www.nature.com/scientificreports/
Figure 2. Microscopic image (×400 magnification) of a Pyrodinium bahamense cell and polystyrene particle
in water sample (a—top panel), and microscopic image (×100 magnification) of a broader view of multiple
polystyrene particles including the dinoflagellate Tripos hircus. Arrows indicate the location of polystyrene
particles (b—bottom panel).
sample was examined for the presence of microplastic particles and no particles were observed microscopi-
cally. Microplanktonic algae (i.e. phytoplankton 20–200 µm) cells and microplastic particles were identified and
counted in samples from at all ten sites and all twenty sampling events (May 2018 thru April 2020) with a phase
contrast Leica inverted microscope using the Utermöhl method, a sedimentation procedure using a glass settling
chamber26,27. 10 mL aliquots of the concentrated Lugol’s preserved samples were settled for a minimum of 24 h
in a 19 mm inner diameter cylindrical glass chamber. Microplanktonic algae cells and microplastic particles less
than 30 µm were counted at 400× magnification. Microplanktonic algae cells and microplastic particles greater
than or equal to 30 µm were counted at 100× magnification. Microplanktonic algae cells and microplastic parti-
cles less than 30 µm were counted at 400× magnification. Only polystyrene microplastic particles were identified
in the samples, as confirmed using Fourier-Transform Infra-Red microscopy (FTIR) analysis (see below). The
polystyrene particles were easily identified as they all had similar structural morphology, color and thickness
(Fig. 2).
For compositional analysis of the microplastic particles, two aliquots from the May 15, 2019 sampling event
were analyzed. The microplastic particles in the samples were characterized with FTIR in reflectance mode. FTIR
scans were performed using a Nicolet Continuum FTIR microscope employing an MCT-A detector, attached to
either an iS50 FTIR optical bench or a Magna 760 optical bench. Spot size was approximately 100 × 100 microns
except when limited for more linear samples. Samples were collected on Anodisc filters (0.2 µm pore size) and
Scientific Reports | (2021) 11:6029 | https://doi.org/10.1038/s41598-021-85388-y 3
Vol.:(0123456789)www.nature.com/scientificreports/
Figure 3. Baseline-corrected FT-IR spectrum of microplastic particle in water samples (top panel) particle and
comparison reference spectra for standard forms of polystyrenes (the most common commercial forms). The
percentage match for the three reference forms were: (1) 95.15% for Polystyrene Standard, typical MW 200.000
(HR Aldrich FT-IR Collection 1, (2) 91.40% for Polystyrene Standard, typical MW 50.000 (HR Aldrich FT-IR
Collection 1, and (3) 90.36% for Polystyrene Atactic (Hummel Polymer Sample Library).
40
Number of Particles
35
30
25
20
15
10
5
0
30 - 60 61 - 90 91 - 120 121 - 151 - 180 -
150 180 210
Frequency Distribution (µ) of size lengths
Figure 4. Frequency of observation of different size classes of polystyrene microplastics observed from 100
randomly selected particles over the study period.
then brushed off that filter using a fresh camel hair bush onto a metal coated silicon wafer. This was used for
reflectivity and flatness properties and was then placed on the stage of the microscope. The spectra obtained were
baseline corrected and compared to authentic reference spectra in the spectral library. The particles showed a
good match to polystyrene and not to other common polymers, such as polyethylene.
Results
Morphologically similar microplastics were first observed in water samples collected in March 2019. The poly-
styrene particles were transparent, bluish in color, curved in appearance, with uneven and straight fragmented
edges (Fig. 2). FTIR compositional analysis of the particles showed that they were polystyrene (Fig. 3). The lengths
of randomly selected polystyrene particles (n = 101) ranged from 33 to 190 µm, with a mean of 89.3 µm. The
frequency distribution of lengths indicates that most polystyrene particles (n-101) had a length between 30 and
120 µm (Fig. 4). The size range of the polystyrene particles places them in a size range similar to microplanktonic
algae, as defined by Sieburth et al.16, i.e. 20–200 µm. This is illustrated by the presence of the bioluminescent
dinoflagellate Pyrodinium bahamense28 in Fig. 2a, next to the polystyrene particle. P. bahamense is a common
feature of microplankton communities in the Florida Keys and other ecosystems in Florida29,30. Another image
captured at lower magnification shows multiple polystyrene particles in the presence of another microplanktonic
dinoflagellate species Tripos hircus (Fig. 2b).
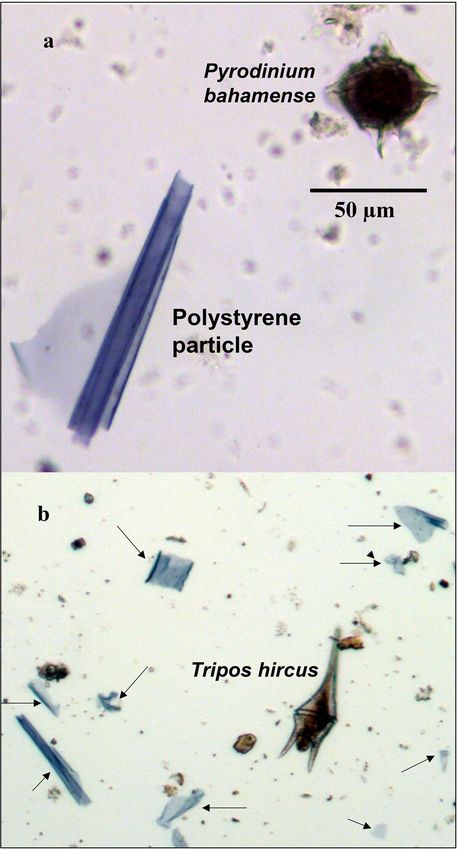
Polystyrene microplastic particles were not observed during the first nine of twenty sampling events during
the 2-year study period, i.e. May 31, June 27, July 26, August 16, September 6, September 19, October 4, and
November 16 in 2018, and January 30 in 2019. The polystyrene particles were first observed on March 18, 2019
at six of the ten sampling sites, i.e. Sites 3 and 4 in Barnes Sound, and Sites 6, 8, 9, and 10 in northeast Florida
Bay. Particle densities in the March samples ranged from 40 to 3,180 particles L −1, with the highest value at the
eastern-most site (Site 8) in northeast Florida Bay (Fig. 5). In the May 15, 2019 sampling event polystyrene par-
ticles were observed at all ten sites and densities increased, reaching 76,000 particles L −1 at Site 1 in Manatee Bay
−1
(i.e. in northwest Barnes Sound) and 32,820 particles L at Site 8 in northeast Florida Bay. During the following
Scientific Reports | (2021) 11:6029 | https://doi.org/10.1038/s41598-021-85388-y 4
Vol:.(1234567890)www.nature.com/scientificreports/
50
Barnes Sound
40 76
1
30 2
3
Polystyrene Particles, 103 L-1
20
4
10
5
0
Sep-19
Dec-19
Feb-20
Feb-19
Mar-20
Mar-19
Jun-19
Jan-20
Apr-20
Jan-19
Apr-19
Oct-19
Aug-19
May-19
Jul-19
Nov-19
50
N.E. Florida Bay
40
6
30 7
20 8
9
10
10
0
Sep-19
Dec-19
Feb-19
Feb-20
Mar-19
Jun-19
Mar-20
Jan-19
Apr-19
Jan-20
Apr-20
Oct-19
May-19
Jul-19
Aug-19
Nov-19
Figure 5. Concentrations of polystyrene microplastic particles at five sampling sites in Barnes Sound (1–5) and
five sites in northeast Florida Bay (6–10) from January 2019 to March 2020.
Mean microplastic # Mean microplankton #
Site 103 Particles L
−1 Range 103 Cells L
−1 Range
1 20 (37) 0.4–76 28 (10) 13–36
2 10 (6) 0.3–17 17 (8) 9–29
3 11 (7) 2.7–19 21 (19) 7–50
4 9 (8) 1.5–20 10 (6) 4–18
5 8 (7) 0.9–19 11 (4) 6–15
6 14 (8) 4–18 14 (3) 11–17
7 13 (10) 5–27 13 (7) 5–23
8 24 (15) 10–40 11 (5) 5–20
9 8 (5) 1.2–14 43 (26) 18–44
10 9 (8) 0.3–17 29 (11) 13–37
Table 1. Mean values for densities of polystyrene microplastic particles and microplanktonic algae cells
over the peak period for microplastic densities, i.e. May–August 2019. Range of values for the period are also
shown. Standard deviations are shown in parentheses.
3 months (June–August), polystyrene particles reached densities above 10,000 particles L−1 at all ten sites in at
least one of the sampling events (Fig. 5). After August, particle densities were below 4000 particles L −1 at nine of
ten sites, except for one high value at Site 4 in October.
Peak polystyrene particle densities were observed between May 2019 and August 2019 at all ten sites, and fell
into a similar range of average cell densities as microplanktonic algae (i.e. cell size from 20 to 200 µm) during the
same time period (Table 1). Mean polystyrene particle densities for the May–August period ranged from 8000
to 24,000 L−1 and mean microplanktonic algae cell densities ranged from 10,000 to 43,000 L−1 for the same time
period. The period of peak microplastic polystyrene and microplanktonic algae densities coincided with the
wet season in south Florida (i.e. May–October), during which salinities declined in both study regions (Fig. 6),
due to rainfall and freshwater runoff from coastal watersheds and canals (e.g. C-111). Microplanktonic algae in
the study regions include a diverse array of species, often numerically dominated by two functionally important
groups of phytoplankton groups, i.e. diatoms and d inoflagellates31 (Fig. 7).
Scientific Reports | (2021) 11:6029 | https://doi.org/10.1038/s41598-021-85388-y 5
Vol.:(0123456789)www.nature.com/scientificreports/
40
30
Salinity, psu
Site 1
20
Site 9
10
0
Sep-19
Mar-19
Mar-20
Jan-19
Jan-20
May-19
Jul-19
May-20
Nov-19
Figure 6. Salinities at Site 1 in Barnes Sound and Site 9 in N.E. Florida Bay from January 2019 through March
2020.
50
Microplanktonic Phytoplankton Cells, 103 L-1
Site 3
40
Barnes Sound
30
20
Other Taxa
10
0 Cyanobacteria
Sep-19
Nov-19
Jan-19
Jan-20
Mar-19
May-19
Mar-20
May-20
Jul-19
50
Site 8 Diatom
40
NE Florida Bay
30 Dinoflagellate
20
10
0
Sep-19
Nov-19
Jan-19
Jan-20
Mar-19
Mar-20
Jul-19
May-19
May-20
Figure 7. Examples of composition of microplanktonic phytoplankton (i.e. 20–200 µm) in Barnes Sound and
NE Florida Bay in terms of cell density over the period when polystyrene microplastic particles were observed,
i.e. January 2019 to March 2020.
Discussion
This is the first report of widespread distribution and prolonged presence of small (< 200 µ) polystyrene micro-
plastic particles in coastal lagoons of the Florida Keys. Polystyrene is widely used in construction materials, pack-
aging foam, food containers, clerical supplies, medical equipment, fishing gear and many other a pplications32,33.
Polystyrene has specific density (1.06 g cm−3) comparable to seawater (⁓ 1.02 g cm−3), and along with more
buoyant polyolefin polymers, such as polyethylene and polypropylene, are common features of contamination
in water columns of marine e cosystems34,35. Carpenter et al.13 found widespread distribution of polystyrene
spherules in coastal waters of southern New England. Similarly, Dai et al.36 observed microplastic polystyrene
particles in Bohai Sea along the coast of China. The uneven shapes and variable dimensions of the polystyrene
microplastic particles observed in this study suggest that they are the result of degradation and/or fragmenta-
tion of larger debris, often referred to as secondary microplastics. The presence of secondary plastics is related
to a range of degradation processes, including physical fragmentation or abrasion, photooxidation, chemical
disruption or even biological processes3,37,38.
High concentrations of polystyrene microplastic particles were observed at all sites in both regions of the
study, i.e. Barnes Sound and northeastern Florida Bay. The two regions are physically separated by land barriers
with one connection via a navigational channel used for small vessels. The sudden and widespread appearance of
high peak densities of the polystyrene particles raise questions about potential point and nonpoint sources of the
material, and the basis for the high concentrations. While there is currently little information on potential point
Scientific Reports | (2021) 11:6029 | https://doi.org/10.1038/s41598-021-85388-y 6
Vol:.(1234567890)www.nature.com/scientificreports/
sources of the polystyrene particles in the study regions, it is possible that such sources exist. For example, Site
1 in the Manatee Bay region of Barnes Sound is located near the mouth of the C-111 Canal which drains coastal
wetlands adjacent to urban, industrial and agricultural areas. In May 2019, Site 1 had the highest single density
of polystyrene particles observed during the study period (76,000 L −1). May is the beginning of the wet season
in Florida, when freshwater influences from the land are enhanced. Effluent discharges from regional industries
and other commercial activities in the northern Florida Keys or adjacent mainland could explain the sudden
appearance of high concentrations of the polystyrene microplastics. Southward flow of water from Biscayne Bay
is also a potential source of microplastic contamination. However, there is insufficient information to define how
the polystyrene microplastics spread to both Barnes Sound and northeastern Florida Bay, where high densities
of the particles were observed in the same month.
Alternatively, the widespread distribution of high densities of polystyrene microplastic particles in both study
regions at about the same time suggests the possibility of non-point-sources. The observation that the particles
appear to be a product of degradation processes indicate that they may be a result of fragmentation of larger
plastic debris. One potential source may be atmospheric transport from regional sources and aerial deposition
(e.g., rainfall) into the study lagoons. This process has been previously reported involving microplastics in the size
range observed in this study in several other regions of the w orld39–41. The process can result in the appearance
of microplastics in remote and otherwise pristine areas of the world through long-distance aerial t ransport42.
Another possible non-point-source of the polystyrene may be related to Hurricane Irma, which caused
widespread devastation in the Florida Keys and southern tip of the Florida peninsula in the fall of 2017. High
winds of the Category 4 hurricane, along with flooding rainfall and storm surge, transported materials from
residential, urban, industrial and agricultural land areas into northeast Florida Bay and southern Biscayne Bay,
including Barnes S ound43–45. It is well-known that catastrophic events, such as hurricanes and tsunamis, con-
tribute to the transport and deposition of plastic into the marine environment11,46. It is possible that polystyrene
materials flushed into the study regions were entrained in shorelines, which are characterized by seagrass and
mangrove communities. Plastic debris is frequently encountered in mangroves, where it becomes trapped and is
subject to fragmentation47,48. Similarly, it has been suggested the sea grass beds act as traps for smaller plastics in
coastal environments49. Polystyrene material trapped in these coastal communities are subject to fragmentation,
ultimately producing smaller secondary microplastic particles of a size easily re-suspended and distributed by
hydrologic processes into the water column. The timescale for fragmentation is variable depending on environ-
mental conditions2,11,50. It is possible that fragmented polystyrene microplastics contained along shorelines of the
study region after Hurricane Irma were flushed into the sampling regions by spring–summer rainfall events in
the 2019 wet season in south Florida. Declines in salinity levels in coastal waters of Barnes Sound and northeast
Florida Bay during the wet season reflect the influences of freshwater runoff.
The peak microplastic densities observed in this study were high compared to peak levels reported for some
other marine ecosystems, such as the comparatively open waters of Liaodong Bay in C hina36, where observed
peak microplastic abundance was 23 particles L −1. The high densities of polystyrene microplastics observed in
northeast Florida Bay and Barnes Sound are in part related to the morphological and hydrologic characteristics of
the study regions. The very shallow water depths (< 2–3 m) characteristic of these lagoons can enhance the density
of particles, in part by increasing the potential for resuspension of the polystyrene particles. Small microplastic
particles have low rise velocities and are susceptible to vertical transport51. Microplastics can spend extended
periods of time in the water column and can be transported over long distances15. The abundance of small micro-
plastic particles can also increase with decreasing depth and volume of the water column2,52. Analogous processes
take place in microplankton communities. For example, diatoms, many of which fall into a similar size range and
specific density as the polystyrene microplastics, rely on vertical mixing energy to maintain position in the water
column53. Microplanktonic algae are important features of phytoplankton communities in Florida Bay24,54,55 and
many other shallow estuaries in Florida56–58 and around the world53. Another feature contributing to the high
densities of polystyrene particles is the restricted tidal flushing rates in the study regions. Shallow mudbanks and
the land barriers represented by the islands that make up the Florida Keys limit water exchange between Barnes
Sound and northeast Florida Bay and the Atlantic Ocean and Gulf of Mexico. Long water residence times in
these regions can enhance the potential for accumulation and persistence of the polystyrene particles. Similar
observations have been made for microplastics in other e cosystems59. Analogous observations have been made
for microplanktonic algae abundances in coastal marine ecosystems with long residence t imes25,30,60,61.
The ubiquitous presence of polystyrene microplastic particles in Barnes Sound and northeast Florida Bay
is a cause for concern because of potential impacts on aquatic organisms in the Florida Keys. Lusher et al.18
identified over 200 marine species, spanning a wide range of trophic levels, that ingested microplastics. The
consumption of microplastic polystyrene spheres by zooplankton, important consumers of phytoplankton, has
been shown to negatively impact their function and health, including altered feeding capacity, and a decrease
in fecundity and survival rates17,62,63. In another study of zooplankton, including mysid shrimp, copepods, cla-
docerans, rotifers, polychaete larvae and ciliates from the Baltic Sea, there was transfer of microplastic particles
from mesozooplankton ingesting polystyrene spheres to m acrozooplankton64. The potential for bioaccumulation
of microplastics in commercially important filter-feeding bivalves, such as oysters and clams, and other marine
food chain components, represents a potential for human exposures to microplastics12. The small polystyrene
microplastic particles (i.e. 33–190 µm) observed in our study fall into the same size range and abundance as
microplanktonic algae (20–200 µm), highlighting the potential for consumption of polystyrene particles by the
zooplankton community and other larger marine grazers, such as bivalves and sponges. An assortment of larger
marine organisms, including fish, bivalves, and sea birds, have also been observed ingesting m icroplastics65–67.
19,68
The ingestion of microplastic debris can introduce toxic substances to the food c hain . In addition, the sharp
rigid edges of microplastic particles may cause physical damage to external structures of marine organisms, such
Scientific Reports | (2021) 11:6029 | https://doi.org/10.1038/s41598-021-85388-y 7
Vol.:(0123456789)www.nature.com/scientificreports/
as gill tissues of fish. The latter threat is similar to the potential physical damage associated with the presence of
high densities of certain diatom species with rigid s pines69.
Currently, the global extent of small microplastic particles of the size range observed in this study is likely
under-reported, in part because some of the most common ways used to collect plastics, such as net tows, are
not well adapted for capturing particles of that size range. Quantitative comparisons between the polystyrene
microplastic particles and microplanktonic algae in this study reveal that abundances can reach similar levels
that may potentially impact ecosystem structure and function. The high abundances and spatial distribution of
small polystyrene microplastic particles observed in the Florida Keys highlight the potential for contamination
of shallow restricted coastal ecosystems in ecosystems often considered to be relatively pristine, which may
impact food web interactions17,18,63,65,70,71 and other microbial p rocesses20. The potential breadth of impacts of
microplastics certainly warrants further attention.
Data availability
The data used in this paper are part of project data reported to the South Florida Water Management District
(W. Palm Beach, Florida) and should be accessible from the corresponding author, Edward Phlips, or the South
Florida Water Management District (W. Palm Beach, Florida).
Received: 17 July 2020; Accepted: 1 March 2021
References
1. Andrady, A. L. & Neal, M. A. Applications and societal benefits of plastic. Philos. Trans. R. Soc. B 364, 1977–1984. https://doi.
org/10.1098/rstb.2008.0304 (2009).
2. Barnes, D. K. A., Galgani, F., Thompson, R. C. & Barlaz, M. Accumulation and fragmentation of plastic debris in global environ-
ments. Philos. Trans. R. Soc. B 364, 1985–1998. https://doi.org/10.1098/rstb.2008.0205 (2009).
3. Cole, M., Lindeque, P., Halsband, C. & Galloway, T. S. Microplastics as contaminants in the marine environment: a review. Mar.
Poll. Bull. 62, 2588–2597. https://doi.org/10.1016/j.marbulpol.2011.09.025 (2011).
4. Geyer, R., Jambeck, J. R. & Law, K. A. Production, use, and fate of all plastics ever made. Sci. Adv. 3, e1700782. https://doi.
org/10.1126/sciadv.1700782 (2017).
5. Thompson, R. C. et al. Lost at sea: where is all the plastic?. Science 304, 838. https://doi.org/10.1126/science.1094559 (2004).
6. UNEP. Marine Plastic Debris and Microplastic—Global Lessons and Research to Inspire Action and Guide Policy Change a Technical
Report (United Nations Environmental Programme, 2016).
7. Jambeck, J. R. et al. Plastic waste inputs from land into the Ocean. Science 347, 768–771. https://doi.org/10.1126/science.1260352
(2015).
8. Andrady, A. L. Microplastics in the marine environment. Mar. Pollut. Bull. 62, 1596–1605. https://doi.org/10.1016/jmarpolbul
.2011.05.030 (2011).
9. Carpenter, E. J. & Smith, K. L. Jr. Plastic on the Sargasso Sea surface. Science 175, 1240–1241. https://doi.org/10.1126/scien
ce.175.4027.1240 (1972).
10. Derraik, J. G. B. The pollution of the marine environment by plastic debris: a review. Mar. Pollut. Bull. 44(9), 842–852. https://doi.
org/10.1016/S0025-326X(02)00220-5 (2002).
11. Law, K. L. Plastics in the marine environment. Annu. Rev. Mar. Sci. 9, 205–229. https://doi.org/10.1146/annurevmarine-01081
6-060409 (2017).
12. Mercogliano, R. et al. Occurrence of microplastics in commercial seafood under the perspective of the human food chain. A review.
J. Agric. Food Chem. 68, 5296–5301. https://doi.org/10.1021/acs.jafc.0c01209 (2020).
13. Carpenter, E. J., Anderson, S. J., Harvey, G. R., Miklas, H. P. & Peek, B. Polystyrene spherules in coastal waters. Science 178, 749–750.
https://doi.org/10.1126/science.178.4062.749 (1972).
14. Arthur, C., Baker, J. & Bamford, H. Proceedings of the International Research Workshop on the Occurrence, Effects and Fate of Micro-
plastic Marine Debris. NOAA Technical Memorandum NOS-OR & R-30. NOAA, Silver Spring, September 9–11, 2008 (2009).
15. Hildalgo-Ruz, V., Gutow, L., Thompson, R. C. & Thiel, M. Microplastics in the marine environment: a review of the methods used
for identification and quantification. Environ. Sci. Technol. 46, 3060–3075. https://doi.org/10.1021/es2031505 (2012).
16. Sieburth, J. M. N., Smetacek, V. & Lenz, J. Pelagic ecosystem structure: heterotrophic components of the plankton and their rela-
tionship to plankton size fractions. Limnol. Oceanogr. 23(6), 1256–1263. https://doi.org/10.4319/lo.1978.23.6.1256 (1978).
17. Lee, K. W., Shim, W. J., Kwon, O. Y. & Kang, J. H. Size dependent effects of micro polystyrene particles in the marine copepod
Tigripus japonicus. Environ. Sci. Technol. 47, 11278–11283. https://doi.org/10.1021/es401932b (2013).
18. Lusher, A. L., Weldon, N. A., Sobral, P. & Cole, M. Sampling isolating and identifying microplastic ingested by fish and invertebrates.
Anal. Methods 9, 1346–1360. https://doi.org/10.1039/C6AY02415G (2017).
19. Alimba, C. G. & Faggio, C. Microplastics in the marine environment: current trends in environmental pollution and mechanisms
of toxicological profile. Environ. Toxicol. Pharmacol. 68, 61–74. https://doi.org/10.1016/j.etap.2019.03.001 (2019).
20. Galgani, L., Engel, A., Rossi, C., Donati, A. & Loiselle, S. A. Polystyrene microplastics increase microbial release of marine chromo-
phoric dissolved organic matter in microcosm experiments. Sci. Rep. 8, 14635. https: //doi.org/10.1038/s41598 -018-32805- 4 (2018).
21. Frankovich, T. A. & Wachnicka, A. Epiphytic diatoms along phosphorus and salinity gradients in Florida Bay (Florida USA), an
illustrated guide and annotated checklist. In Microbiology of the Everglades Ecosystem (eds Entry, J. A. et al.) 239–285 (CRC Press,
2015).
22. Fourqurean, J. W. & Robblee, M. B. Florida Bay: a history of recent ecological changes. Estuaries 22, 345–357 (1999).
23. Browder, J. A., Restrepo, V. R., Rice, J. K., Robblee, M. B. & Zein-Eldin, Z. Environmental influences on potential recruitment of
pink shrimp Panaeus duorarum from Florida Bay nursery grounds. Estuaries 22, 484–494 (1999).
24. Hall, M. O., Madley, K., Durako, M. J., Zieman, J. C. & Robblee, M. B. Seagrass status and trends in the Northern Gulf of Mexico
1940–2002. In U.S. Geological Survey Scientific Investigation Report 2006-5287 (eds Handley, L., Altsman, D. & DeMay, R.). US
Environmental Protection Agency 855-R-04-003 (2007).
25. Phlips, E. J., Badylak, S., Christman, M. & Lasi, M. Climatic trends and temporal patterns of phytoplankton composition, abundance
and succession in the Indian River Lagoon, Florida, USA. Estuar. Coasts 33, 498–513. https://doi.org/10.1007/s12237-009-9166-8
(2010).
26. Lund, J. W. G., Kipling, C. & Le Cren, E. D. The inverted microscope method of estimating algal numbers and the statistical bias
of estimating by counting. Hydrobiologia 11, 143–170. https://doi.org/10.1007/BF00007865 (1958).
27. von Utermöhl, H. Neve wege in der quantitaven erfassung des planktons. (Mit besondere Beriicksichtigung des Ultraplanktons).
Verh. Int. Ver. Limnol. 5, 567–595 (1931).
Scientific Reports | (2021) 11:6029 | https://doi.org/10.1038/s41598-021-85388-y 8
Vol:.(1234567890)www.nature.com/scientificreports/
28. Badylak, S., Kelly, K. & Phlips, E. J. A description of Pyrodinium bahamense (Dinophyceae) from the Indian River Lagoon, Florida
USA. Phycologia 43, 653–657. https://doi.org/10.2216/i0031-8884-43-6-653 (2004).
29. Phlips, E. J., Badylak, S., Bledsoe, E. L. & Cichra, M. Factors affecting the distribution and abundance of Pyrodinium bahamense
in coastal waters of Florida. Mar. Ecol. Prog. Ser. 322, 99–115. https://doi.org/10.3354/meps322099 (2006).
30. Phlips, E. J. et al. From red tides to green and brown tides: bloom dynamics in a restricted subtropical lagoon under shifting climatic
conditions. Estuar. Coasts 38, 886–904. https://doi.org/10.1007/s12237-014-9874-6 (2015).
31. Phlips, E. J. & Badylak, S. Analysis of phytoplankton community composition and biovolumes in Manatee Bay, Barnes Sound and
NE Florida Bay. Final Report to the South Florida Water Management District (W. Palm Beach, 2020).
32. Ho, B. T., Roberts, T. K. & Lucas, S. An overview on biodegradation of polystyrene and modified polystyrene: the microbial
approach. Crit. Rev. Biotechnol. 38, 308–320. https://doi.org/10.1080/07388551.2017.1355293 (2018).
33. Link, J., Segal, B. & Casarini, L. M. Abandoned lost or otherwise discarded fishing gear in Brazil, a review. Perspect. Ecol. Conserv.
17, 1–8. https://doi.org/10.1016/j.pecon.2018.12.003 (2019).
34. Song, Y. K. et al. Large accumulation of micro-sized synthetic polymer particles in the sea surface microlayer. Environ. Sci. Technol.
48, 9014–9021. https://doi.org/10.1021/es501757s (2014).
35. Song, Y. K., Hong, S. E., Jang, M., Han, G. M. & Shim, W. J. Occurrence and distribution of microplastics in the sea surface micro-
layer in Jinhae Bay, South Korea. Arch. Environ. Contam. Toxicol. 69(3), 279–287. https://doi.org/10.1007/s00244-015-0209-9
(2015).
36. Dai, Z. et al. Occurrence of microplastics in the water column and sediment in an inland sea affected by intensive anthropogenic
activities. Environ. Pollut. 242, 1557–1565. https://doi.org/10.1016/j.envpol.2018.07.131 (2018).
37. GESAMP. Sources, fate and effects of microplastics in the marine environment: part two of a global assessment (eds Kershaw, P. J.
& Rochman, C. M.). (IMO/FAO/UNESCO-IOC/UNIDO/WMO/IAEA/UN/UNEP/UNDP Joint Group of Experts on the Scientific
Aspects of Marine Environmental Protection). Rep Stud. GESAMP No. 93 (2016).
38. Cincinelli, A. et al. A potpourri of microplastic in the sea surface and water column of the Mediterranean Sea. Trends Anal. Chem.
110, 321–326. https://doi.org/10.1016/j.trac.2018.10.026 (2019).
39. Allen, S. et al. Atmospheric transport and deposition of microplastics in a remote mountain catchment. Nat. Geosci. 12, 339–344
(2019).
40. Klein, M. & Fischer, E. Microplastic abundance in atmospheric deposition within the metropolitan area of Hamburg, Germany.
Sci. Total Environ. 685, 96–103 (2019).
41. Wright, S., Ulke, J., Pont, A., Chan, K. & Kelly, F. Atmospheric microplastic deposition in an urban environment and an evaluation
of transport. Environ. Int. 136, 105411. https://doi.org/10.1016/j.envint.2019.105411 (2020).
42. Bahney, J., Hallerud, M., Helm, E., Hahnenberger, M. & Sukumaran, S. Plastic rain in protected areas of the United States. Science
368, 1257–1260 (2020).
43. Wingard, G. L. et al. Impacts of Hurricane Irma on Florida Bay Islands, Everglades National Park, USA. Spec. Online Issue Estuar.
Coast. https://doi.org/10.1007/s12237-019-00638-7 (2019).
44. Wachnicka, A. et al. Hurricane Irma’s impact on water quality and phytoplankton communities in Biscayne Bay (Florida, USA).
Estuar. Coasts 43, 1217–1234 (2020).
45. Wachnicka, A., Armitage, A. R., Zink, I., Browder, J. & Fourqurean, J. W. Major 2017 Hurricanes and their cumulative impacts on
coastal waters of the USA and the Caribbean. Estuar. Coasts 43, 941–942 (2020).
46. Lebreton, L. C. M. & Borrero, J. C. Modeling the transport and accumulation of floating debris generated by the 11 March 2011,
Tohoku Tsunami. Mar. Pollut. Bull. 66, 53–58 (2013).
47. Martin, C., Almahasheer, H. & Duarte, C. M. Mangrove forests as traps for marine litter. Environ. Pollut. 247, 499–550. https://
doi.org/10.1016/j.envpol.2019.01.067 (2019).
48. Nor, N. H. M. & Obbard, J. P. Microplastics in Singapore’s coastal mangrove ecosystems. Mar. Pollut. Bull. 79, 278–283. https://
doi.org/10.1016/j.marpolbul.2013.11.025 (2014).
49. Huang, Y. et al. Seagrass beds acting as a trap of microplastics—emerging hotspot in the coastal region?. Environ. Pollut. 257, 1–9.
https://doi.org/10.1016/j.envpol.2019.113450 (2020).
50. Andrady, A. L. Plastics and the Environment (Wiley, 2003).
51. Reisser, J., Popescu, S. C., Huang, S. C., Chang, P. T. & Wen, H. L. The vertical distribution of buoyant plastics at sea: an observa-
tional study in the North Atlantic Gyre. Biogeosciences 12, 1249–1256. https://doi.org/10.5194/bg-12-49-2015 (2015).
52. Doyle, M. J., Watson, W., Bowlin, N. M. & Sheavly, S. B. Plastic particles in coastal pelagic ecosystems of the Northeast Pacific
Ocean. Mar. Environ. Res. 71, 41–52. https://doi.org/10.1016/j.marenvres.2010.10.001 (2011).
53. Reynolds, C. S. Ecology of Phytoplankton (Cambridge University Press, 2006).
54. Phlips, E. J. & Badylak, S. Spatial variability in phytoplankton standing crop and composition in a shallow inner shelf lagoon Florida
Bay. Bull. Mar. Sci. 58, 203–216 (1996).
55. Wachnicka, A., Gaiser, E., Collins, L., Frankovich, T. & Boyer, J. Distribution of diatoms and development of diatom-based mod-
els for inferring salinity and nutrient concentrations in Florida Bay and adjacent coastal wetlands (U.S.A.). Estuar. Coasts 33(5),
1080–1098. https://doi.org/10.1007/s12237-010-9283-4 (2015).
56. Badylak, S., Phlips, E. J., Baker, P., Fajans, J. & Boler, R. Distributions of phytoplankton in Tampa Bay, USA. Bull. Mar. Sci. 80,
295–317 (2007).
57. Hart, J. A. et al. Phytoplankton biomass and composition in a well-flushed sub-tropical estuary: the contrasting effects of hydrol-
ogy, nutrient loads and allochthonous influences. Mar. Environ. Res. 112, 9–20 (2015).
58. Quinlan, E. L. & Phlips, E. J. Phytoplankton assemblages across the marine to low-salinity zone in a blackwater dominated estuary.
J. Plankton Res. 29, 410–416 (2007).
59. McEachern, K. et al. Microplastics in Tampa Bay, Florida: abundance and variability in estuarine waters and sediments. Mar. Pollut.
Bull. 148, 97–106. https://doi.org/10.1016/j.marpolbul.2019.07.068 (2019).
60. Phlips, E. J., Badylak, S., Nelson, N. & Havens, K. Hurricanes, El Niño and harmful algal blooms in two sub-tropical Florida estuar-
ies: direct and indirect impacts. Sci. Rep. 2020, 10. https://doi.org/10.1038/s41598-020-58771-4 (1910).
61. Badylak, S. et al. Phytoplankton dynamics in a subtropical tidal creek: Influences of rainfall and water residence time on composi-
tion and biomass. Mar. Freshw. Res. 67, 466–482. https://doi.org/10.1071/MF14325 (2016).
62. Cole, M. et al. Microplastic ingestion by zooplankton. Environ. Sci. Technol. 47, 6646–6655. https://doi.org/10.1021/es400663f
(2013).
63. Cole, M., Lindeque, P., Filman, E., Halsband, C. & Galloway, T. S. The impact of polystyrene microplastics on feeding, function,
and fecundity in the marine copepod Calanus helgolandicus. Environ. Sci. Technol. 49, 1130–1137. https://doi.org/10.1021/es504
525u (2015).
64. Setälä, O., Fleming-Lehtinen, V. & Lehtiniemi, M. Ingestion and transfer of microplastics in the planktonic food web. Environ.
Pollut. 185, 77–83. https://doi.org/10.1016/j.envpol.2013.10.013 (2014).
65. Amélineu, F. et al. Microplastic pollution in the Greenland Sea: background levels and selective contamination of planktivorous
diving seabirds. Environ. Pollut. 219, 1131–1139. https://doi.org/10.1016/j.envpol.2016.09.017 (2016).
66. Boerger, C. M., Lattin, G. L., Moore, S. L. & Moore, C. J. Plastic ingestion by planktivorous fishes in the North Pacific Central Gyre.
Mar. Pollut. Bull. 60, 2275–2278. https://doi.org/10.1016/j.marpdbul.2010.08.007 (2010).
Scientific Reports | (2021) 11:6029 | https://doi.org/10.1038/s41598-021-85388-y 9
Vol.:(0123456789)www.nature.com/scientificreports/
67. Phuong, N. N., Poirier, L., Pham, Q. T., Lagarde, F. & Zalouk-Vergnoux, A. Factors influencing the microplastic contamination
of bivalves from the French Atlantic Coast: location, season or mode of life?. Mar Pollut. Bull. 129(2), 664–674. https://doi.
org/10.1016/j.marpolbul.2017.10.054 (2018).
68. Teuten, E. L. et al. Transport and release of chemicals from plastics to the environment and to wildlife. Philos. Trans. R. Soc. B 364,
2027–2045. https://doi.org/10.1098/rstb.2008.0284 (2009).
69. Fryxell, G. A. & Hasle, G. R. Taxonomy of harmful diatoms. In Manuel on Harmful Marine Algae (eds Hallegraeff, G. M. et al.)
465–509 (UNESCO, 2003).
70. Moore, C. J. Synthetic polymers in the marine environment: a rapidly increasing long term threat. Environ. Res. 108, 131–139.
https://doi.org/10.1016/j.envres.2008.07.025 (2008).
71. Critchell, K. & Hoogenboom, M. O. Effects of microplastic exposure on the body condition and behavior of planktivorous reef
fish (Acanthochromis polycanthus). PLoS ONE 13(3), 0193308. https://doi.org/10.1371/journal.pone.0193308 (2018).
Acknowledgements
The research presented in this paper was in part funded by a grant from the South Florida Water Management
District (Grant No. 4500105992) (W. Palm Beach, Florida). We thank the University of Florida Research Service
Center and their staff for the FT-IR measurements. Edward Phlips and Susan Badylak are supported by the USDA
National Institute of Food and Agriculture, Hatch Project 1017098.
Author contributions
S.B. is the senior author of the paper, with contributions from the other four co-authors. E.P. was the lead PI on
the research project and worked directly with S.B. on the development and content of the manuscript. C.B. led
the analysis of composition of the microplastic particles observed in the samples. M.J. played an integral part
in the microscopic analyses. A.W. led the South Florida Water Management District team in the collection of
samples for the project and provided insights into the ecology of the study regions. All five authors collaborated
in the interpretation of data.
Competing interests
The authors declare no competing interests.
Additional information
Correspondence and requests for materials should be addressed to E.P.
Reprints and permissions information is available at www.nature.com/reprints.
Publisher’s note Springer Nature remains neutral with regard to jurisdictional claims in published maps and
institutional affiliations.
Open Access This article is licensed under a Creative Commons Attribution 4.0 International
License, which permits use, sharing, adaptation, distribution and reproduction in any medium or
format, as long as you give appropriate credit to the original author(s) and the source, provide a link to the
Creative Commons licence, and indicate if changes were made. The images or other third party material in this
article are included in the article’s Creative Commons licence, unless indicated otherwise in a credit line to the
material. If material is not included in the article’s Creative Commons licence and your intended use is not
permitted by statutory regulation or exceeds the permitted use, you will need to obtain permission directly from
the copyright holder. To view a copy of this licence, visit http://creativecommons.org/licenses/by/4.0/.
© The Author(s) 2021
Scientific Reports | (2021) 11:6029 | https://doi.org/10.1038/s41598-021-85388-y 10
Vol:.(1234567890)You can also read