Inherited variations in human pigmentation related genes modulate cutaneous melanoma risk and clinicopathological features in Brazilian population ...
←
→
Page content transcription
If your browser does not render page correctly, please read the page content below
www.nature.com/scientificreports
OPEN Inherited variations in human
pigmentation‑related genes
modulate cutaneous melanoma
risk and clinicopathological
features in Brazilian population
Gustavo Jacob Lourenço1,7, Cristiane Oliveira1,7, Benilton Sá Carvalho2, Caroline Torricelli1,
Janet Keller Silva1, Gabriela Vilas Bôas Gomez1, José Augusto Rinck‑Junior3,4,
Wesley Lima Oliveira1, Vinicius Lima Vazquez5, Sergio Vicente Serrano6,
Aparecida Machado Moraes3 & Carmen Silvia Passos Lima1,3*
Ultraviolet light exposure and cutaneous pigmentation are important host risk factors for cutaneous
melanoma (CM), and it is well known that inherited ability to produce melanin varies in humans.
The study aimed to identify single-nucleotide variants (SNVs) on pigmentation-related genes with
importance in risk and clinicopathological aspects of CM. The study was conducted in two stages. In
stage 1, 103 CM patients and 103 controls were analyzed using Genome-Wide Human SNV Arrays in
order to identify SNVs in pigmentation-related genes, and the most important SNVs were selected
for data validation in stage 2 by real-time polymerase-chain reaction in 247 CM patients and 280
controls. ADCY3 c.675+9196T>G, CREB1 c.303+373G>A, and MITF c.938-325G>A were selected for
data validation among 74 SNVs. Individuals with CREB1 GA or AA genotype and allele “A” were under
1.79 and 1.47-fold increased risks of CM than others, respectively. Excesses of CREB1 AA and MITF AA
genotype were seen in patients with tumors at Clark levels III to V (27.8% versus 13.7%) and at III or
IV stages (46.1% versus 24.9%) compared to others, respectively. When compared to others, patients
with ADCY3 TT had 1.89 more chances of presenting CM progression, and those with MITF GA or AA
had 2.20 more chances of evolving to death by CM. Our data provide, for the first time, preliminary
evidence that inherited abnormalities in ADCY3, CREB1, and MITF pigmentation-related genes, not
only can increase the risk to CM, but also influence CM patients’ clinicopathological features.
Cutaneous melanoma (CM) is the most deadly form of skin c ancers1. Ultraviolet (UV) light exposure and
individual pigmentation features are well-established host risk factors for CM1, and tumor depth and stage are
the most important hallmarks of CM prognosis2. Moreover, previous studies have shown that inherited genetic
variants modulate CM risk3 and outcome4.
Melanocytes absorb UV radiation and survive to considerable genotoxic stress, and the main genetic mecha-
nism involved in CM development alters the control of skin p igmentation1,5,6. Sunlight exposure induces the
post-inflammatory hyperpigmentation system by the melanocortin-1 receptor (MC1R), and melanocytes express
MC1R that regulates the quality and quantity of their melanin p roduction7. The α-melanocyte stimulating
1
Laboratory of Cancer Genetics, Faculty of Medical Sciences, University of Campinas, Campinas, São Paulo,
Brazil. 2Department of Statistics, Institute of Mathematics, Statistic, and Computer Science, University of
Campinas, Campinas, São Paulo, Brazil. 3Clinical Oncology Service, Department of Internal Medicine, Faculty of
Medical Sciences, University of Campinas, Rua Alexander Fleming, 181, Cidade Universitária “Zeferino Vaz”, Barão
Geraldo, Campinas, São Paulo, Brazil. 4A.C. Camargo Cancer Center, São Paulo, São Paulo, Brazil. 5Melanoma and
Sarcoma Surgery Department, Barretos Cancer Hospital, Barretos, São Paulo, Brazil. 6Department of Medical
Oncology, Barretos Cancer Hospital, Barretos, São Paulo, Brazil. 7These authors contributed equally: Gustavo
Jacob Lourenço and Cristiane Oliveira. *email: carmenl@fcm.unicamp.br
Scientific Reports | (2020) 10:12129 | https://doi.org/10.1038/s41598-020-68945-9 1
Vol.:(0123456789)www.nature.com/scientificreports/
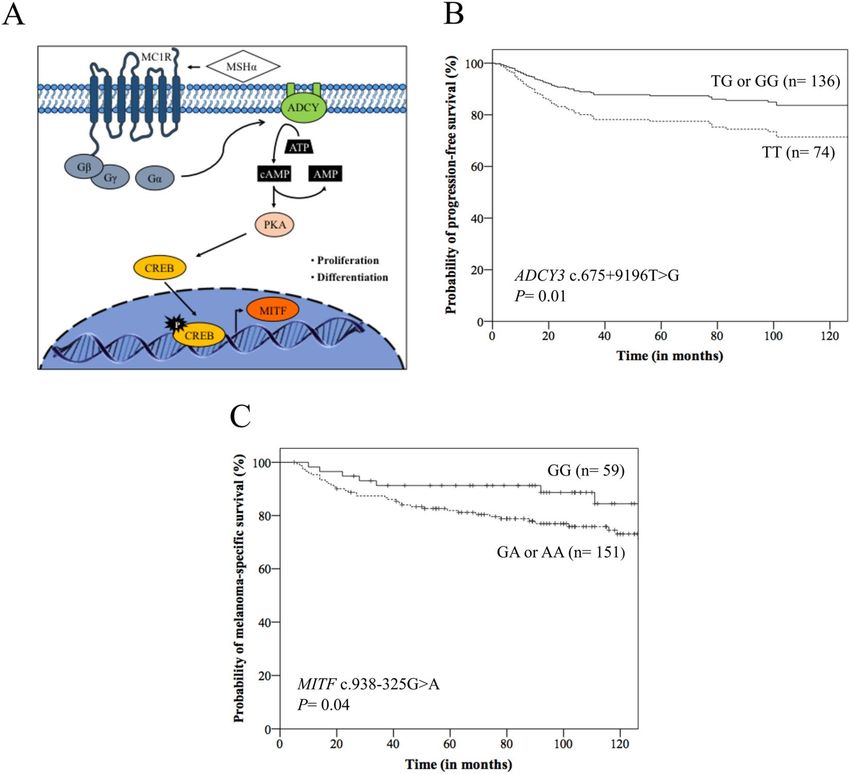
Figure 1. (A) Pigmentation regulation by alpha-melanocyte stimulating hormone (MSHα) and G-proteins
from melanocortin receptor 1 (MC1R): MSHα/MCR1 can trigger the activation of the adenylate cyclase
(ADCY) and 3′–5′-cyclic adenosine monophosphate AMP (cAMP). The cAMP signals activate the
protein kinase A (PKA) that phosphorylates and activates cAMP responsive element binding protein
(CREB) transcription factor, which induces the expression of melanocyte inducing transcription factor
(MITF) and induction of proliferation and differentiation of melanocytes. G-proteins: β, γ, and α; ATP:
adenosine triphosphate. (B) Kaplan–Meier (K-M) curves for progression-free survival according to ADCY3
c.675+9196T>G genotypes, where patients with TT genotype presented lower survival than those with TG or
GG genotype. (C) K-M curves for melanoma-specific survival according to MITF c.938-325G>A genotypes,
where patients with GA or AA genotype presented lower survival than those with GG genotype.
hormone (MSHα) activates the membrane associated enzyme adenylate cyclase (ADCY), increasing 3′-5′-cyclic
adenosine monophosphate (cAMP) levels; the increased cAMP signals activate protein kinase A (PKA) that
activates cAMP responsive element binding protein (CREB)5,6,8. CREB is a transcription factor that regulates the
expression of melanocyte inducing transcription factor (MITF) and consequently, proliferation and differentia-
tion of melanocytes and melanin s ynthesis5,6,8 (Fig. 1A).
On the other hand, melanogenesis generates mutagenic intermediates (quinones and semiquinones), neu-
tralizes reactive oxygen species, eliminates free radicals, and modifies cell metabolism through the stimulation
of aerobic glycolysis generating a hypoxic e nvironment9,10, making melanoma cells resistant to chemo-, radio-,
photo- and immunotherapy9,11. Brożyna et al. showed that nonpigmented cells were significantly more sensitive
to gamma rays than pigmented c ells12. Melanogenesis induction is also related to significant up-regulation of
hypoxia-inducible factors (HIF) and these factors are key master regulators of cellular metabolism and therapeu-
tic resistance11,13, contributing to the increased aggressiveness of melanoma and shorter survival time of patients
with pigmented metastatic melanoma than the ones with amelanotic lesion11.
Genome-wide association studies (GWAS), conducted particularly in Caucasians, have identified single nucle-
otide variants (SNVs) associated with CM risk, many of which in human pigmentation genes, such as MC1R,
solute carrier family 45 member 2 (SLC45A2) and tyrosinase (TYR)14–17. The most GWAS have identified SNVs
located in non-coding regions of the genome which can affect gene regulatory sequences, and consequently the
gene expression18. SNVs located in introns can also alter the precursor RNA messenger (pre-mRNA) splicing
process19 or the binding sites for regulatory proteins splicing20, influencing the efficiency of splicing or inducing
Scientific Reports | (2020) 10:12129 | https://doi.org/10.1038/s41598-020-68945-9 2
Vol:.(1234567890)www.nature.com/scientificreports/
alternative splicing, and an intronic variant of poly(ADP-ribose) polymerase number 1 (PARP1) was associated
with increased CM risk in Caucasians21.
The Brazilian population is highly heterogeneous, consisting of indigenous Amerindians and immigrants from
Europe, Africa, and Asia22. Since other SNVs in genes with equal or even greater importance in melanogenesis
may not have been selected in the previous analyzed populations, we conducted an association study in patients
with CM and healthy controls from Brazil, and identified three SNVs of MC1R pathway, ADCY3 c.675+9196T>G,
CREB1 c.303+373G>A and MITF c.938-325G>A in association with tumor risk and clinicopathological features.
Material and methods
Study population. This association study was conducted in two stages. In stage 1, 103 CM patients and 103
controls were analyzed with the purpose of identifying SNVs on pigmentation-related genes with importance
in CM risk, and in stage 2 the most important SNVs were selected for data validation in 247 CM patients and
280 controls.
All CM patients were diagnosed at the Clinical Oncology and Dermatology Services of University of Campi-
nas, A.C. Camargo Cancer Center, and Barretos Cancer Hospital between April 2000 and May 2018. Patients
diagnosed with the unknown primary site tumors and those with tumors located in mucous were excluded from
the study. The control group was compound by blood donors seen at the Hematology and Hemotherapy Center
of University of Campinas in the same period. The study was approved by the local Ethical Committees of both
Institutions (numbers: 424/20016 and 1.438.601). All procedures were carried out according to the Helsinki
Declaration, and appropriate informed consent was obtained.
Data and specimen collection. Clinical information of individuals (age at diagnosis, gender, skin color,
skin phototype, sun exposure, type of sun exposure, and number of nevi) was obtained by specific question-
naires. Skin phototype was defined using reported c riteria23. Individuals exposed to the sun for more than 2 h
per day and for more ten years were considered positive for sun exposure23. Sun exposure was classified as inter-
mittent in cases of recreational activities performed less than 50% of the week or holidays, or chronic, activities
at home or work under sunlight exposure during more than 50% of the time24.
The diagnosis of CM was established by histopathological evaluation of tumor fragments embedded in paraf-
fin and stained with hematoxylin and eosin. Pathological aspects of the tumor (tumor location, histological type,
Breslow thickness, Clark level, and tumor stage) were obtained from medical records of patients25. Tumor stage
was identified using the TNM classification of the American Joint Committee on Cancer, where T describes the
size of tumor, N describes spread of tumor to nearby lymph nodes, and M describes distant metastasis2. Patients
with desmoplastic, acro-lentiginous and amelanotic melanomas were excluded from the study.
Surgical excision (n = 217) was the primary treatment for patients with localized tumor26. Sentinel lymph
node biopsy (n = 41) was recommended in patients with tumor measuring more than 1 mm (mm) and lym-
phadenectomy (n = 24) was performed in patients with clinically positive lymph nodes or lymph nodes with
tumor infiltration on histopathological evaluation. Patients with operable single metastasis or relapse (n = 30)
underwent surgical r esection27. Those patients with inoperable relapse or multiple metastases (n = 30) received
chemotherapy with d acarbazine28. Radiotherapy was also used in the local treatment of patients with surgical
etastases29.
impossibility (n = 4), particularly in bleeding lesions, bone or brain m
Stage 1: screening of SNVs, candidate genes choice and SNVs selection. DNA from leukocytes
of peripheral blood of CM patients and controls were genotyped for a total of 906,660 SNVs using the Affymetrix
Genome-Wide Human SNV Arrays 6.0 (AFFYMETRIX, USA), according to the manufacturer’s recommended
protocols. The intensities resulting from the arrays scanning process were made available via CEL files, one per
DNA sample with total quality control higher than 90% (AFFYMETRIX, USA). Tools from the Bioconductor
(https://www.bioconductor.org) were used to process the CEL files. The genotyping was performed applying the
corrected robust linear mixture model (crlmm) algorithm30.
The genes previously reported as involved in the pigmentation pathway were selected for study. The pathway
analysis was performed using the Database for Annotation, Visualization and Integrated Discovery (https: //david
.ncifcrf.gov31 and Kyoto Encyclopedia of Genes and Genomes pathway maps (https://www.kegg.jp)32.
Each pigmentation related-gene was analyzed using the in silico method by the Human Splicing Finder algo-
rithm (version 3.1) (https://www.umd.be/HSF3/index.html33 in order of identifying SNVs in splicing regulatory
sequences. For analysis, wild-type (ancestral) allele was taken as reference. SNVs showing deviation from the
HWE and those with the minor allele frequency less than 10% were excluded from the s election34. SNVs that
potentially alter expression or function of the encoding p roteins13,14 were selected for further validation.
Stage 2: validation of selected SNVs in risk and characteristics of melanoma. DNA from
leukocytes of peripheral blood of CM patients and controls was analyzed by real-time polymerase chain
reaction with TaqMan SNV genotyping assays (APPLIED BIOSYSTEMS, USA) for ADCY3 (rs11900505,
assay ID: C_7868411_20), CREB1 (rs10932201, assay ID: C_2859093_20) and MITF (rs7623610, assay ID:
C_29012190_10) SNVs, following manufacturer instructions. Twenty percent of genotype determinations were
carried out twice in independent experiments with 100% of concordance.
Frequencies of ADCY3 c.675+9196T>G, CREB1 c.303+373G>A and MITF c.938-325G>A genotypes, isolated
and in combination, were analyzed in patients and controls, and in patients stratified by clinicopathological
features.
Scientific Reports | (2020) 10:12129 | https://doi.org/10.1038/s41598-020-68945-9 3
Vol.:(0123456789)www.nature.com/scientificreports/
Gene expression by quantitative PCR. Total RNA was obtained from leukocytes of peripheral blood of
CM patients and controls with distinct genotypes of ADCY3 (16 and 18 with TT genotype, 16 and 19 with TG,
and seven and 19 with GG, respectively), CREB1 (14 and 10 with GG genotype, 16 and 25 with GA, 9 and 18 with
AA, respectively) and MITF (15 and 28 with GG genotype, 16 and 23 with GA, 6 and 23 with AA, respectively)
with TRIzol reagent (LIFE TECHNOLOGIES, USA).
cDNA was generated using Maxima First Strand cDNA Synthesis kit reagents (LIFE TECHNOLOGIES,
USA) following manufacturer’s instructions. The experiments were performed using SYBR Green PCR Master
Mix reagents (APPLIED BIOSYSTEMS, USA) and specific primers for ADCY3 (forward: 5′-TCATCTCCGTGG
TCTCCTG-3′ and reverse: 5′-CACAGGTAGAGGAA-GACGTTG-3′), CREB1 (forward 5′-CTAGTACAGCTG
CCCA-ATGG-3′ and reverse: 5′-AGTTG-AAATCTGTGT TCCGG-3′), and MITF (forward: 5′-AGTCTGAAG
CAAGAGCACTG-3′ and reverse: 5′-GCGCATGTCTGGATCATTTG-3′) genes, in triplicate per sample, and a
control without template were included in each plate. The relative expression level of genes was normalized to
that of reference housekeeping gene actin beta (forward: 5′-AGGC CAA CCG CGA
GAAG-3′ and reverse: 5′-ACA
GCCT GGA TAG
CAA
CGT ACA-3′) using 2−DDCt cycle threshold m
ethod35. Twenty percent of samples had evalua-
tion repeated in separate experiments with 100% agreement. The results were expressed in arbitrary units (AUs).
Statistical analysis. Association between disease statuses, CM patients versus controls, and genotypes for
study’s stage 1 was performed using logistic regression model, and analyses were adjusted by age at diagnosis,
skin color, and sun exposure. SNVs that presented raw p-values below the 0.001 thresholds were selected for
further inspection. These analyses were implemented in R software (version 3.3.0) (https://www.r-project.org).
The Hardy–Weinberg equilibrium (HWE) was tested using chi-square (χ2) statistics for the goodness-to-fit
test, and logistic regression model served to obtain age, skin color, sun exposure, and number of nevi status-
adjusted crude odds ratios (ORs) with 95% confidence intervals (CI) in comparisons evolving patients and
controls for study’s stage 2. To evaluate the robustness of risk estimates, the false discovery rate (FDR) was
computed, which reflects the expected ratio of false-positive findings to the total number of significant findings;
the differences revealed were considered statistically significant at FDR values < 0.0525. χ2 and Fisher’s exact
tests were used to evaluate associations between clinicopathological features and genotypes of selected SNVs.
Bonferroni method was used to adjust values of multiple comparisons in patients stratified by tumor a spects36.
For ADCY3, CREB1 and MITF expression analysis, data sets were probed for normality using Shapiro–Wilk’s
test. Because data sets assume normal distribution, analysis of variance performed comparisons of groups36.
For survival analysis, the progression-free survival (PFS) was calculated from the date of surgery until the
date of first recurrence, or the date of progression of disease, or the date of death by any cause, or the date of last
follow-up. The melanoma-specific survival (MSS) was calculated from the date of diagnosis until the date of death
by the disease or last follow-up. PFS and MSS were calculated using Kaplan–Meier estimates, and differences
between survival curves were analyzed by log-rank t est25. The impact of age at diagnosis, gender, tumor location,
Breslow thickness37, Clark level, TNM stage and genotypes of each analyzed SNV in survival of patients were
evaluated using univariate Cox proportional hazards ratio (HR) regression. At a second time, all variables with
p < 0.20 were included in the multivariate Cox regression. The significant results of Cox analysis were internally
validated using a bootstrap resampling study to investigate the stability of risk estimates (1,000 replications)25.
All tests were done using the SPSS 21.0 software (SPSS INCORPORATION, USA). Significance was two sided
and achieved when p values were ≤ 0.05.
Results
Study population. The clinicopathological features of patients and the clinical features of controls included
in stage 1 and stage 2 of the study are presented in Table 1. Controls were younger than patients, and CM patients
presented more white skin color, referred more sun exposure and presented more nevi than controls, and all
differences were corrected in comparisons involving patients and controls by appropriate statistical analysis.
Similar clinicopathological features were observed in patients and controls analyzed in both stages of the study.
Screening of SNVs, candidate genes choice and SNVs selection. We found 12,495 new SNVs asso-
ciated with CM risk; 6,497 (52.0%) of them were in introns, 5,928 (47.4%) in gene regulatory regions, and 70
(0.6%) in coding regions. The genome association data were deposited at Gene Expression Omnibus (GEO)
database (https://www.ncbi.nlm.nih.gov/geo) with accession number GSE129890.
The most significant melanoma associated SNVs identified in stage 1 (p < 0.0001) are presented in Table S1
Supplement. Seventy-four SNVs in 28 human pigmentation-related genes were found to be involved with CM
risk (Table S2 Supplement).
In accord with results of the in silico analysis, the variant allele “G” of ADCY3 c.675+9196T>G may abolish a
potential branch point site and an exonic splicing enhancer (ESE), and this variation may create a site of ligation
for SRp55 and 9G8 splicing proteins. Besides, new sites for an exon-identity element (EIE) and an intron-identity
element (IIE) may be created. The variant allele “A” of CREB1 c.303+373G>A may abolish a splice donor site
(5′ end of the intron), an exonic splicing silencer (ESS), an IIE site, and a binding site for the hnRNP A1, and
this variation may create a new branch point, an EIE site, and a putative exonic splicing enhancer. The variant
allele “A” of MITF c.938-325G>A may create a splice donor site, an ESS, and a binding site for the hnRNP A1,
and this variation may break a potential branch point site, an EIE, and silencer motifs and an IIE site (Table S3
Supplement). ADCY3 c.675+9196T>G, CREB1 c.303+373G>A, and MITF c.938-325G>A SNVs were selected
for analysis in stage 2 of the study due to their potential effects on encoding p roteins13,14.
Scientific Reports | (2020) 10:12129 | https://doi.org/10.1038/s41598-020-68945-9 4
Vol:.(1234567890)www.nature.com/scientificreports/
Stage 1 Stage 2
Patients Controls Patients Controls
Characteristics n (%) n (%) p value n (%) n (%) p value
Age (years)
≤ 55 55 (53.4) 93 (90.3) 125 (50.6) 229 (81.8)
< 0.0001 < 0.0001
> 55 48 (46.6) 10 (9.7) 122 (49.4) 51 (18.2)
Gender
Male 61 (59.2) 55 (53.4) 130 (52.6) 145 (51.8)
0.48 0.84
Female 42 (40.8) 48 (46.6) 117 (47.4) 135 (48.2)
Skin color
White 97 (94.2) 80 (77.7) 231 (93.5) 231 (82.5)
0.001 < 0.0001
Non-white 6 (5.8) 23 (22.3) 16 (6.5) 49 (17.5)
Phototype*
I or II 58 (68.2) 53 (53.0) 154 (66.7) 164 (60.1)
0.05 0.12
III to VI 27 (31.8) 47 (47.0) 77 (33.3) 109 (39.9)
Sun exposure*
Yes 70 (82.4) 52 (52.0) 196 (83.1) 126 (45.0)
< 0.0001 < 0.0001
No 15 (17.6) 48 (48.0) 40 (16.9) 154 (55.0)
Type of sun exposure*
None or intermittent 32 (34.4) 76 (73.8) 96 (44.2) 210 (75.0)
< 0.0001 < 0.0001
Chronic 61 (65.6) 27 (26.2) 121 (55.8) 70 (25.0)
Number of nevi*
≤ 50 68 (80.0) 91 (97.8) 183 (75.9) 260 (98.1)
0.0001 < 0.0001
> 50 17 (20.0) 2 (2.2) 58 (24.1) 5 (1.9)
Tumor location
Head 16 (18.4) NA NC 46 (18.6) NC NC
Trunk 41 (47.1) NA NC 118 (47.8) NC NC
Upper limb 13 (14.9) NA NC 40 (16.2) NC NC
Lower limb 17 (19.6) NA NC 43 (17.4) NC NC
Histological type*
Superficial spreading 37 (50.7) NA NC 119 (57.2) NC NC
Lentigo malign 9 (12.3) NA NC 26 (12.5) NC NC
Nodular 27 (37.0) NA NC 63 (30.3) NC NC
Breslow thickness (mm)*
≤ 1.5 44 (46.8) NA NC 123 (52.8) NC NC
> 1.5 50 (53.2) NA NC 110 (47.2) NC NC
Clark level*
I 14 (16.5) NA NC 31 (13.2) NC NC
II 12 (14.1) NA NC 42 (17.9) NC NC
III 27 (31.8) NA NC 60 (25.5) NC NC
IV 30 (35.3) NA NC 94 (40.0) NC NC
V 2 (2.3) NA NC 8 (3.4) NC NC
TNM stage*
0 12 (13.8) NA NC 30 (12.3) NC NC
I 23 (26.4) NA NC 92 (37.7) NC NC
II 27 (31.0) NA NC 83 (34.0) NC NC
III 22 (25.3) NA NC 27 (11.1) NC NC
IV 3 (3.5) NA NC 12 (4.9) NC NC
Table 1. Clinicopathological aspects of patients with cutaneous melanoma and clinical features of controls
used in screening (stage 1) and validation (stage 2) of single nucleotide variants in human pigmentation-
related genes. *The numbers of individuals were not the same included in the study because no consistent
information could be obtained from some individuals. NC: values were not computed. P values describe
differences between patients and controls and values < 0.05 are presented in bold letters.
Selected SNVs in risk and clinicopathological features of melanoma. Patient and control samples
included in the stage 2 were in HWE at ADCY3 c.675+9196T>G (χ2 = 0.58, p = 0.44; χ2 = 0.70, p = 0.40), and
Scientific Reports | (2020) 10:12129 | https://doi.org/10.1038/s41598-020-68945-9 5
Vol.:(0123456789)www.nature.com/scientificreports/
Patients Controls
Genotype or allele N (%) N (%) P value (pc value) OR (95% CI)
ADCY3 c.675+9196T>G
TT 84 (34.0) 86 (30.7) 1.04 (0.66–1.64)
0.84 (0.84)
TG or GG 163 (66.0) 194 (69.3) Reference
TT or TG 209 (84.6) 218 (77.9) 1.67 (0.95–2.93)
0.07 (0.12)
GG 38 (15.4) 62 (22.1) Reference
Allele T 294 (59.5) 304 (54.3) 1.15 (0.85–1.56)
0.35 (0.35)
Allele G 200 (40.5) 256 (45.7) Reference
CREB1 c.303+373G>A
GG 68 (27.5) 110 (39.3) Reference
0.01 (0.04)
GA or AA 179 (72.5) 170 (60.7) 1.79 (1.14–2.82)
GG or GA 189 (76.5) 233 (83.2) Reference
0.19 (0.28)
AA 58 (23.5) 47 (16.8) 1.43 (0.83–2.46)
Allele G 257 (52.0) 344 (61.4) Reference
0.01 (0.04)
Allele A 237 (48.0) 216 (38.6) 1.47 (1.08–2.00)
MITF c.938-325G>A
GG 71 (28.7) 92 (32.9) Reference
0.49 (0.55)
GA or AA 176 (71.3) 188 (67.1) 1.17 (0.74–1.85)
GG or GA 178 (72.1) 222 (79.3) Reference
0.02 (0.06)
AA 69 (27.9) 58 (20.7) 1.76 (1.07–2.89)
Allele G 249 (52.0) 344 (61.4) Reference
0.06 (0.12)
Allele A 237 (48.0) 216 (38.6) 1.28 (0.84–1.94)
Table 2. ADCY3 c.675+9196T>G, CREB1 c.303+373G>A, and MITF c.938-325G>A genotypes and alleles
in 247 patients with cutaneous melanoma and 280 controls. OR: odds ratio adjusted by age, skin color, sun
exposure, and number of nevi by multiple regression analysis; CI confidence interval; Pc values are p values
corrected for multiple testing by the false discovery rate test. P and pc values < 0.05 are presented in bold letters.
CREB1 c.303+373G>A (χ2 = 0.08, p = 0.77; χ2 = 1.55, P = 0.21) loci, respectively. Controls’ samples (χ2 = 0.92,
p = 0.33) but not patients’ samples (χ2 = 4.40, p = 0.03) confirmed the HWE at MITF rs7623610 locus.
CREB1 GA or AA genotype and allele “A” were more common in patients than in controls; carriers of the
above genotypes and allele were under 1.79 and 1.47-fold increased risks for CM than those with the GG geno-
type and allele “G”, respectively (Table 2). No associations between ADCY3, CREB1 and MITF SNVs combined
genotypes were seen in CM patients and controls (Table S4 Supplement).
No associations of studied SNVs genotypes were seen in CM patients stratified by age, gender, and skin color
(Table S5), phototype, sun exposure, type of sun exposure, and number of nevi (Table S6). However, CREB1
AA genotype was more common in patients with tumors located in limbs than in head or trunk (31.7% versus
15.9%, p = 0.009) and tumors with Clark levels III to V than in those with tumors of I or II Clark levels (27.8%
versus 13.7%, p = 0.012), and MITF AA genotype was more common in patients with III or IV tumor stage than
in those with tumors at 0 to II stages (46.1% versus 24.9%, p = 0.007). These results were significant even after
Bonferroni correction (corrected p value: 0.0125) (Table 3).
ADCY3, CREB1 and MITF expression. Similar mRNA expressions (in arbitrary units ± standard devi-
ation) were seen in CM patients with distinct genotypes of ADCY3 (TT: 1.13 ± 0.55, TG: 0.90 ± 0.66, GG:
1.16 ± 0.85; p = 0.52) (Figure S1A Supplement), CREB1 (GG: 1.21 ± 0.76, GA: 1.19 ± 0.79, AA: 1.14 ± 0.63;
p = 0.98) (Figure S1B Supplement), and MITF (GG: 1.08 ± 0.47, GA: 0.98 ± 0.74, AA: 1.03 ± 0.61; p = 0.91) (Fig-
ure S1C Supplement). Expressions of mRNA were also similar in controls with distinct genotypes of ADCY3
(TT: 1.06 ± 0.34, TG: 1.06 ± 0.44, GG: 1.08 ± 0.74; p = 0.98) (Figure S1D Supplement), CREB1 (GG: 1.06 ± 0.42,
GA: 1.24 ± 0.78, AA: 1.48 ± 0.70; p = 0.29) (Figure S1E Supplement), and MITF (GG: 1.15 ± 0.69, GA: 1.24 ± 0.45,
AA: 0.99 ± 0.46; p = 0.29) (Figure S1F Supplement).
Association of clinicopathological aspects and genotypes with patients’ survival. We obtained
consisted survival data from 210 CM patients. The median follow-up time of patients enrolled in the survival
analysis was 97 months (range 5–228 months). The patient’s final status was established on January 2020, when
136 patients were alive (132 without disease, 4 with disease) and 74 patients had died (46 due to disease, 28 of
unrelated causes).
At 60 months of follow-up, the PFS was lower in males (68.5% versus 81.3%, p = 0.02), patients with tumors
located in head or trunk (70.9% versus 82.0%, p = 0.03), patients with tumor with Breslow index higher 1.5 mm
(54.9% versus 94.4%, p < 0.0001), Clark levels III to V (66.3% versus 94.1%, p < 0.0001) and III or IV stage (32.3%
versus 82.2%, p < 0.0001) (Kaplan–Meier estimates). Differences among groups remained the same in univariate
analysis. In multivariate analysis, CM located in head or trunk (HR: 2.38), thicker tumors (HR: 4.93), stage III or
Scientific Reports | (2020) 10:12129 | https://doi.org/10.1038/s41598-020-68945-9 6
Vol:.(1234567890)www.nature.com/scientificreports/
Breslow thickness
Histological type* (mm)* Clark level* TNM stage*
Genotypes Head/trunk Upper/lower limb ≤ 1.5 > 1.5 I or II III to V 0 to II III or IV
ADCY3
TT 53 (32.3) 31 (37.4) 42 (34.1) 37 (33.6) 23 (31.5) 57 (35.2) 71 (34.6) 12 (30.8)
TG or GG 111 (67.7) 52 (62.6) 81 (65.9) 73 (66.4) 50 (68.5) 105 (64.8) 134 (65.4) 27 (69.2)
P value 0.18 0.93 0.58 0.64
TT or TG 121 (83.4) 55 (87.3) 104 (84.5) 95 (86.4) 65 (89.0) 134 (82.7) 173 (84.4) 34 (87.2)
GG 24 (16.6) 8 (12.7) 19 (15.5) 15 (13.6) 8 (11.0) 28 (17.3) 32 (15.6) 5 (12.8)
P value 0.53 0.69 0.24 0.39
CREB1
GG 48 (33.1) 13 (20.6) 36 (29.3) 28 (25.4) 23 (31.5) 41 (25.3) 57 (27.8) 11 (28.2)
GA or AA 97 (66.9) 50 (79.4) 87 (70.7) 82 (74.6) 50 (68.5) 121 (74.7) 148 (72.2) 28 (71.8)
P value 0.07 0.51 0.32 0.95
GG or GA 122 (84.1) 43 (68.3) 100 (81.3) 79 (71.8) 63 (86.3) 117 (72.2) 156 (76.1) 32 (82.0)
AA 23 (15.9) 20 (31.7) 23 (18.7) 31 (28.2) 10 (13.7) 45 (27.8) 49 (23.9) 7 (18.0)
P value 0.009** 0.08 0.012** 0.53
MITF
GG 43 (29.6) 14 (32.6) 36 (29.3) 30 (22.7) 25 (34.7) 41 (25.3) 62 (30.2) 6 (15.4)
GA or AA 102 (70.4) 49 (67.4) 87 (70.7) 80 (77.3) 48 (65.3) 121 (74.7) 143 (69.8) 33 (84.6)
P value 0.26 0.15 0.73 0.07
GG or GA 106 (73.1) 42 (66.7) 93 (75.6) 76 (69.1) 52 (71.2) 119 (73.5) 154 (75.1) 21 (53.9)
AA 39 (26.9) 21 (33.3) 30 (24.4) 34 (30.9) 21 (28.8) 43 (26.5) 51 (24.9) 18 (46.1)
P value 0.34 0.72 0.26 0.007**
Table 3. ADCY3 c.675 + 9196 T > G, CREB1 c.303 + 373G > A, and MITF c.938-325A > G genotypes in
247 patients with cutaneous melanoma stratified by tumor features. Values are expressed as number and
percentage. *The numbers of patients were not the same included in the study (n = 247) because no consistent
information could be obtained from some individuals. P values < 0.05 are presented in bold letters. **Significant
even after Bonferroni correction for multiple comparisons (corrected p value = 0.0125).
IV tumors (HR: 3.30), and ADCY3 TT genotype (HR: 1.89) (Fig. 1B) were predictors of poor PFS. At 60 months
of follow-up, the MSS was lower in males (76.4% versus 93.7%, p < 0.0001), patients with tumors with Breslow
index higher 1.5 mm (72.8% versus 97.1%, p < 0.0001), Clark levels III to V (79.1% versus 98.5%, p < 0.0001) and
stage III or IV (45.2% versus 91.3%, p < 0.0001), and MITF GA or AA genotype (81.9% versus 91.3%, p = 0.04)
(Fig. 1C) (Kaplan–Meier estimates). Differences among groups remained the same in univariate analysis; patients
with MITF GA or AA genotype had 2.20 more chances of evolving to death by CM than others. In multivariate
analysis, males (HR: 3.12), thicker tumors (HR: 4.86) and III or IV tumor stage (HR: 4.01) were predictors of
poor MMS (Table 4).
Discussion
In this study, we investigated and identified intronic SNVs ADCY3 c.675+9196T>G, CREB1 c.303+373G>A, and
MITF c.938-325G>A in pigmentation-related genes in association with CM risk and clinicopathological features.
After screening SNVs (stage 1), we found more than 6,000 SNVs associated with CM risk in introns of genes,
according to previous s tudies14–18, and we selected three SNVs involved in the splicing regulatory sequences
of pigmentation-related genes for data validation, due to their potential roles in determining abnormalities in
production and/or function of the respective encoded proteins13,14.
In fact, previous GWAS have shown that the majority of disease-associated variants reside in the non-coding
regions of the genome, suggesting that gene regulatory changes contribute to disease risk18. On the other hand,
splicing comprises a two-step reaction of intron removal and exon ligation and is essential for gene expression:
pre-mRNA splicing is catalyzed by the spliceosome, a large complex of ribonucleoproteins (RNPs), and this
complex recognizes the target sequences and assembles on pre-mRNA20.
After SNVs validation (stage 2), we observed that CREB1 GA or AA genotype and allele “A” were more com-
mon in CM patients than in controls, and that individuals with referred genotypes and allele were under 1.79
and 1.47-fold increased risks of CM than others, respectively.
CREB1 was highly expressed in tumor cells, such as human gastric cell lines and knockdown of CREB1 inhib-
ited human gastric cancer cells g rowth38. CREB1 has also been seen as an important gene in CM d evelopment8,
and analysis of common network from cancer type-specific RNA-Seq co-expression data showed CREB1 as a
melanoma-associated gene39. To the best of our knowledge, there are no previous studies focusing the roles of
ADCY3 c.675+9196T>G, CREB1 c.303+373G>A, and MITF c.938-325G>A SNVs in risk of CM, and therefore
the association of CREB1 GA or AA genotype and allele “A” with CM risk seen in the present study is a new
finding. The search for potential splicing regulatory elements using in silico algorithm in this study indicated
Scientific Reports | (2020) 10:12129 | https://doi.org/10.1038/s41598-020-68945-9 7
Vol.:(0123456789)www.nature.com/scientificreports/
Progression-free survival Melanoma-specific survival
Univariate Cox analysis Multivariate Cox analysis Univariate Cox analysis Multivariate Cox analysis
N total/
Variable N total/N events HR (95% CI) p HR (95% CI) p N events HR (95% CI) P HR (95% CI) p
Median age
≤ 55 years 102/31 Reference Reference 102/21 Reference
0.50 0.17 0.50 NA NA
> 55 years 108/36 1.18 (0.72–1.91) 1.40 (0.86–2.29) 108/25 1.22 (0.68–2.18)
Gender
Male 113/43 1.78 (1.07–2.94) 1.09 (0.63–1.88) 113/36 3.61 (1.79–7.29) 3.12 (1.52–6.41)
0.02 0.74 < 0.001 0.002e
Female 97/24 Reference Reference 97/10 Reference Reference
Tumor location
Head or trunk 143/52 1.83 (1.03–3.26) 2.38 (1.22–4.62) 143/35 1.54 (0.78–3.03)
0.03 0.01a 0.21 NA NA
Upper/lower limb 67/15 Reference Reference 67/11 Reference
Breslow thickness*
≤ 1.5 mm 109/12 Reference Reference 109/7 Reference Reference
< 0.001 < 0.001b < 0.001 < 0.001f
> 1.5 mm 90/47 6.51 (3.44–12.29) 4.93 (2.53–9.57) 90/33 6.64 (2.93–15.04) 4.86 (2.09–11.31)
Clark level*
I or II 69/6 Reference Reference 69/3 Reference Reference
< 0.001 0.20 0.001 0.29
III-V 132/55 5.71 (2.45–13.29) 1.89 (0.70–5.05) 132/38 7.39 (2.28–23.96) 2.08 (0.53–8.12)
TNM stage*
0-II 177/43 Reference Reference 177/26 Reference Reference
< 0.001 < 0.001c < 0.001 < 0.001 g
III or IV 31/23 5.18 (3.08–8.71) 3.30 (1.85–5.89) 31/20 7.51 (4.17–13.56) 4.01 (2.07–7.74)
ADCY3
TT 74/29 1.41 (0.87–2.29) 1.89 (1.11–3.21) 74/21 1.58 (0.88–2.83) 1.49 (0.79–2.82)
0.16 0.01d 0.12 0.21
TG or GG 136/38 Reference Reference 136/25 Reference Reference
TT or TG 180/58 1.04 (0.51–2.12) 180/40 1.06 (0.42–2.37)
0.89 NC NC 0.99 NC NA
GG 30/9 Reference 30/6 Reference
CREB1
GG 60/15 Reference Reference 60/10 Reference
0.19 0.23 0.32 NC NA
GA or AA 150/52 1.51 (0.87–2.63) 1.45 (0.78–2.70) 150/36 1.42 (0.70–2.87)
GG or GA 164/49 Reference Reference 164/34 Reference
0.19 0.28 0.50 NC NA
AA 46/18 1.43 (0.83–2.46) 1.37 (0.76–2.47) 46/12 1.24 (0.64–2.41)
MITF
GG 59/14 Reference 59/7 Reference Reference
0.22 NC NC 0.05 0.19
GA or AA 151/53 1.44 (0.80–2.60) 151/39 2.20 (1.00–4.93) 1.79 (0.74–4.34)
GG or GA 150/45 Reference 150/30 Reference
0.25 NC NC 0.22 NC NC
AA 60/22 1.34 (0.80–2.23) 60/16 1.45 (0.79–2.66)
Table 4. Clinicopathological aspects and genotypes in survival of 210 cutaneous melanoma patients. HR,
hazard ratio; CI, confidence interval; NC, characteristic not computed in multivariate analysis. *The total
numbers of individuals differed from the total quoted because it was not possible to obtain consistent
information about characteristics in some individuals. aPbootstrap = 0.01; bPbootstrap = 0.001. cPbootstrap = 0.001.
d
Pbootstrap = 0.02; ePbootstrap = 0.002. fPbootstrap = 0.006. gPbootstrap < 0.0001 in multivariate analysis. Significant
differences between groups are presented in bold letters.
that gene variants induce the creation or abrogation of binding sites33. The allele “A” of CREB1 c.303+373G>A
may alter binding sites for splicing elements, such as the hnRNP A1, and possibly increases CREB1 activity due
to altered efficiency of s plicing19,20,33. Since CREB1 is a transcription factor that stimulates the MITF activity, the
increase of its activity may in turn increase MITF activity, having proliferation of abnormal melanocytes and
increased risk for CM as consequence8.
When genotypes were analyzed in patients stratified by clinicopathological aspects, we noted that CREB1
AA variant genotype was more common in patients with tumors located in limbs than in patients with tumors
located in head or trunk and with tumors at Clark level III to IV than in patients with tumors at I or II level.
In addition, an excess of MITF AA genotype was found in patients with tumors at stage III or IV than in those
with stage I or II tumors.
It was already described that acquisition of metastatic phenotype in CM involved the gain in expression
of CREB/activating transcription factor-1 (CREB/ATF-1)40 and MITF amplification41. However, how far our
knowledge reaches, this study is the first to describe the influence of CREB1 c.303+373G>A and MITF c.938-
325G>A SNVs on clinicopathological features of CM. Indeed, CREB1 promotes tumorigenesis by increasing cell
migration, proliferation, and invasiveness, through its effects on the MITF pathway8. The in silico analysis showed
that the variant allele “A” of MITF c.938-325G>A may create a site of ligation for splicing factors, including the
Scientific Reports | (2020) 10:12129 | https://doi.org/10.1038/s41598-020-68945-9 8
Vol:.(1234567890)www.nature.com/scientificreports/
hnRNP A1, possibly determining increase in gene expression33. Thus, we postulate that CREB1 AA and MITF AA
genotypes may increase abnormal melanocytes proliferation and consequently improve aggressiveness of CM.
We also noted that ADCY3 c.675+9196 TT genotype was associated with shorter PFS while MITF GA or AA
genotype was associated with shorter MSS in CM patients, when compared to the remaining genotypes.
Up-regulation of ADCY3 increased the tumorigenic potential of gastric c ells42 and predicted shorter overall
survival in patients with pancreatic cancer43. Overexpression of ADCY2 was previously associated with aggres-
sive behavior of CM44, and MITF amplification predicted worst survival of CM p atients41. The in silico analysis
showed that the ADCY3 c.675+9196T>G variant may alter sites of ligation for splicing factors, including the
SRp55 and 9G8, with a possible increase in the efficiency of splicing and gene e xpression19,20,33. Since ADCYs
participate in CREB activation, and CREB regulates the expression of MITF8, the increase in ADCY3 activity in
CM patients with the TT genotype may favor proliferation of abnormal melanocytes leading to relapse or death
by CM effects. Again, the possible increased activity of MITF in patients with GA or AA genotype may have
contributed to this clinical unfavorable outcome.
It is also worth to comment that pigmentation-related genes have been seen as potential therapeutic targets.
Previous studies showed that increased ADCY expression generated resistance to MAPK inhibitions and up
regulates MITF in melanoma cells8, and the suppression of MITF expression by the CH6868398 agent caused
melanoma cell growth inhibition45. Inhibition of p300 acetyltransferase transcriptional coactivator of MITF by
p300/CBP complex had growth inhibitory effects in melanoma cells expressing MITF46,47, and Kazinol U reduced
melanogenesis by inhibition of MITF in melanoma cells48. Since response to new agents depends on ADCY3
and MITF expressions, it is possible that patients with distinct genotypes of these genes present differentiated
responses to therapies.
At this time, we draw attention to the fact that no differences in ADCY3, CREB1 and MITF expressions were
identified in leukocytes of peripheral blood of individuals with the distinct genotypes of ADCY3, CREB1 and
MITF SNVs. It is possible that the sample size evaluated was not enough to identify differences in gene expression
among individuals or, alternatively, these variants may determine gene expression abnormalities only in tumor
tissue or only protein functional changes.
In summary, we described for the first time the potential importance of ADCY3 c.675+9196T>G, CREB1
c.303+373G>A, and MITF c.938-325G>A SNVs in the pigmentation-related genes in CM risk and clinicopatho-
logical features in Brazilian individuals. We recognize that the present study has limitations: it was conducted on
a relatively small number of individuals and only quantitative analysis of gene expression in normal leukocytes
was performed. Thus, we believe that our results will require confirmation in a further larger epidemiological
study in our population and others, and quantitative and functional analyses of ADCY3, CREB1 and MITF SNVs
in melanoma cells. If these findings are confirmed, they might help to identify individuals with high risk for
CM who deserves to receive additional recommendations for CM prevention and early tumor detection and/
or differentiated treatment, perhaps including the targeting lineage specific MC1R signalizing pathway agents.
Data availability
The authors declare that all data of the present study are available for the corresponding author upon reasonable
request.
Received: 1 February 2020; Accepted: 4 May 2020
References
1. Schadendorf, D. et al. Melanoma. Nat. Rev. Dis. Primers 1, 15003. https://doi.org/10.1038/nrdp.2015.3 (2015).
2. Balch, C. M. et al. Final version of 2009 AJCC melanoma staging and classification. J. Clin. Oncol. 27, 6199–6206. https://doi.
org/10.1200/JCO.2009.23.4799 (2009).
3. Potrony, M. et al. Update in genetic susceptibility in melanoma. Ann. Transl. Med. 3, 210. https://doi.org/10.3978/j.issn.2305-
5839.2015.08.11 (2015).
4. Potrony, M. et al. IRF4 rs12203592 functional variant and melanoma survival. Int. J. Cancer 140, 1845–1849. https://doi.
org/10.1002/ijc.30605(2017).
5. D’Mello, S. A., Finlay, G. J., Baguley, B. C. & Askarian-Amiri, M. E. Signaling pathways in melanogenesis. Int. J. Mol. Sci. https://
doi.org/10.3390/ijms17071144 (2016).
6. Lin, J. Y. & Fisher, D. E. Melanocyte biology and skin pigmentation. Nature 445, 843–850. https://doi.org/10.1038/nature05660
(2007).
7. Plonka, P. M. et al. What are melanocytes really doing all day long…?. Exp. Dermatol. 18, 799–819. https://doi.org/10.111
1/j.1600-0625.2009.00912.x (2009).
8. Rodríguez, C. I. & Setaluri, V. Cyclic AMP (cAMP) signaling in melanocytes and melanoma. Arch. Biochem. Biophys. 563, 22–27.
https://doi.org/10.1016/j.abb.2014.07.003 (2014).
9. Slominski, A., Tobin, D. J., Shibahara, S. & Wortsman, J. Melanin pigmentation in mammalian skin and its hormonal regulation.
Physiol. Rev. 84, 1155–1228. https://doi.org/10.1152/physrev.00044.2003 (2004).
10. Slominski, A., Zbytek, B. & Slominski, R. Inhibitors of melanogenesis increase toxicity of cyclophosphamide and lymphocytes
against melanoma cells. Int. J. Cancer 124, 1470–1477. https://doi.org/10.1002/ijc.24005 (2009).
11. Brożyna, A. A., Jóźwicki, W., Roszkowski, K., Filipiak, J. & Slominski, A. T. Melanin content in melanoma metastases affects the
outcome of radiotherapy. Oncotarget 7, 17844–17853. https://doi.org/10.18632/oncotarget.7528 (2016).
12. Brozyna, A. A., VanMiddlesworth, L. & Slominski, A. T. Inhibition of melanogenesis as a radiation sensitizer for melanoma therapy.
Int. J. Cancer 123, 1448–1456. https://doi.org/10.1002/ijc.23664 (2008).
13. Slominski, A. et al. The role of melanogenesis in regulation of melanoma behavior: melanogenesis leads to stimulation of HIF-1α
expression and HIF-dependent attendant pathways. Arch. Biochem. Biophys. 563, 79–93. https: //doi.org/10.1016/j.abb.2014.06.030
(2014).
14. Duffy, D. L. et al. Novel pleiotropic risk loci for melanoma and nevus density implicate multiple biological pathways. Nat. Commun.
9, 4774. https://doi.org/10.1038/s41467-018-06649-5 (2018).
Scientific Reports | (2020) 10:12129 | https://doi.org/10.1038/s41598-020-68945-9 9
Vol.:(0123456789)www.nature.com/scientificreports/
15. Law, M. H. et al. Genome-wide meta-analysis identifies five new susceptibility loci for cutaneous malignant melanoma. Nat. Genet.
47, 987–995. https://doi.org/10.1038/ng.3373 (2015).
16. Ransohoff, K. J. et al. Two-stage genome-wide association study identifies a novel susceptibility locus associated with melanoma.
Oncotarget 8, 17586–17592. https://doi.org/10.18632/oncotarget.15230 (2017).
17. Visconti, A. et al. Genome-wide association study in 176,678 Europeans reveals genetic loci for tanning response to sun exposure.
Nat. Commun. 9, 1684. https://doi.org/10.1038/s41467-018-04086-y (2018).
18. Zhu, Y., Tazearslan, C. & Suh, Y. Challenges and progress in interpretation of non-coding genetic variants associated with human
disease. Exp. Biol. Med. (Maywood) 242, 1325–1334. https://doi.org/10.1177/1535370217713750 (2017).
19. Baralle, D. & Baralle, M. Splicing in action: assessing disease causing sequence changes. J. Med. Genet. 42, 737–748. https://doi.
org/10.1136/jmg.2004.029538 (2005).
20. Will, C. L. & Lührmann, R. Spliceosome structure and function. Cold Spring Harb. Perspect. Biol. https://doi.org/10.1101/cshpe
rspect.a003707 (2011).
21. Choi, J. et al. A common intronic variant of PARP1 confers melanoma risk and mediates melanocyte growth via regulation of
MITF. Nat. Genet. 49, 1326–1335. https://doi.org/10.1038/ng.3927 (2017).
22. Pena, S. D. et al. The genomic ancestry of individuals from different geographical regions of Brazil is more uniform than expected.
PLoS ONE 6, e17063. https://doi.org/10.1371/journal.pone.0017063 (2011).
23. Fitzpatrick, T. B. The validity and practicality of sun-reactive skin types I through VI. Arch. Dermatol. 124, 869–871 (1988).
24. Rigel, D. S., Friedman, R. J., Levenstein, M. J. & Greenwald, D. I. Relationship of fluorescent lights to malignant melanoma: another
view. J. Dermatol. Surg. Oncol. 9, 836–838 (1983).
25. Gomez, G. V. B. et al. PDCD1 gene polymorphisms as regulators of T-lymphocyte activity in cutaneous melanoma risk and prog-
nosis. Pigment Cell Melanoma Res. 31, 308–317. https://doi.org/10.1111/pcmr.12665 (2018).
26. Gillgren, P. et al. 2-cm versus 4-cm surgical excision margins for primary cutaneous melanoma thicker than 2 mm: a randomised,
multicentre trial. Lancet 378, 1635–1642. https://doi.org/10.1016/S0140-6736(11)61546-8 (2011).
27. Sondak, V. K. & Gibney, G. T. Indications and options for systemic therapy in melanoma. Surg. Clin. North Am. 94, 1049–1058,
viii. https://doi.org/10.1016/j.suc.2014.07.007 (2014).
28. Sasse, A. D., Sasse, E. C., Clark, L. G., Ulloa, L. & Clark, O. A. Chemoimmunotherapy versus chemotherapy for metastatic malignant
melanoma. Cochrane Database Syst. Rev. https://doi.org/10.1002/14651858.CD005413.pub2 (2007).
29. Burmeister, B. H. et al. Adjuvant radiotherapy versus observation alone for patients at risk of lymph-node field relapse after
therapeutic lymphadenectomy for melanoma: a randomised trial. Lancet Oncol. 13, 589–597. https://doi.org/10.1016/S1470
-2045(12)70138-9 (2012).
30. Carvalho, B. S., Louis, T. A. & Irizarry, R. A. Quantifying uncertainty in genotype calls. Bioinformatics 26, 242–249. https://doi.
org/10.1093/bioinformatics/btp624 (2010).
31. Huang, D. W. et al. Extracting biological meaning from large gene lists with DAVID. Curr. Protoc. Bioinform. Chapter 3, Unit
13.11. https://doi.org/10.1002/0471250953.bi1311s27 (2009).
32. Kanehisa, M. & Goto, S. KEGG: Kyoto Encyclopedia of Genes and Genomes. Nucleic Acids Res 28, 27–30 (2000).
33. Desmet, F. O. et al. Human Splicing Finder: an online bioinformatics tool to predict splicing signals. Nucleic Acids Res 37, e67.
https://doi.org/10.1093/nar/gkp215 (2009).
34. Walters, R., Laurin, C. & Lubke, G. H. An integrated approach to reduce the impact of minor allele frequency and linkage dis-
equilibrium on variable importance measures for genome-wide data. Bioinformatics 28, 2615–2623. https://doi.org/10.1093/bioin
formatics/bts483 (2012).
35. Livak, K. J. & Schmittgen, T. D. Analysis of relative gene expression data using real-time quantitative PCR and the 2(−Delta Delta
C(T)) method. Methods 25, 402–408. https://doi.org/10.1006/meth.2001.1262 (2001).
36. Tortorelli, G. A. et al. CASP8 (rs3834129) and CASP3 (rs4647601) polymorphisms in oropharynx cancer risk, tumor cell dif-
ferentiation, and prognosis in a cohort of the Brazilian population. Mol. Biol. Rep. 46, 6557–6563. https://doi.org/10.1007/s1103
3-019-05107-9 (2019).
37. Davis, L. E., Shalin, S. C. & Tackett, A. J. Current state of melanoma diagnosis and treatment. Cancer Biol. Ther. 20, 1366–1379.
https://doi.org/10.1080/15384047.2019.1640032 (2019).
38. Rao, M., Zhu, Y., Cong, X. & Li, Q. Knockdown of CREB1 inhibits tumor growth of human gastric cancer in vitro and in vivo.
Oncol. Rep. 37, 3361–3368. https://doi.org/10.3892/or.2017.5636 (2017).
39. Wu, K. et al. Integration of protein interaction and gene co-expression information for identification of melanoma candidate genes.
Melanoma Res. 29, 126–133. https://doi.org/10.1097/CMR.0000000000000525 (2019).
40. Melnikova, V. O. & Bar-Eli, M. Transcriptional control of the melanoma malignant phenotype. Cancer Biol. Ther. 7, 997–1003
(2008).
41. Garraway, L. A. et al. Integrative genomic analyses identify MITF as a lineage survival oncogene amplified in malignant melanoma.
Nature 436, 117–122. https://doi.org/10.1038/nature03664 (2005).
42. Hong, S. H. et al. Upregulation of adenylate cyclase 3 (ADCY3) increases the tumorigenic potential of cells by activating the CREB
pathway. Oncotarget 4, 1791–1803. https://doi.org/10.18632/oncotarget.1324 (2013).
43. Fukuhisa, H. et al. Gene regulation by antitumor miR-130b-5p in pancreatic ductal adenocarcinoma: the clinical significance of
oncogenic EPS8. J. Hum. Genet. https://doi.org/10.1038/s10038-019-0584-6 (2019).
44. Masugi, Y. et al. Overexpression of adenylate cyclase-associated protein 2 is a novel prognostic marker in malignant melanoma.
Pathol. Int. 65, 627–634. https://doi.org/10.1111/pin.12351 (2015).
45. Aida, S. et al. MITF suppression improves the sensitivity of melanoma cells to a BRAF inhibitor. Cancer Lett. 409, 116–124. https
://doi.org/10.1016/j.canlet.2017.09.008 (2017).
46. Wang, R. et al. Targeting lineage-specific MITF pathway in human melanoma cell lines by A-485, the selective small-molecule
inhibitor of p300/CBP. Mol. Cancer Ther. 17, 2543–2550. https://doi.org/10.1158/1535-7163.MCT-18-0511 (2018).
47. Kim, E. et al. MITF expression predicts therapeutic vulnerability to p300 inhibition in human melanoma. Cancer Res. https://doi.
org/10.1158/0008-5472.CAN-18-2331 (2019).
48. Lim, J. et al. Kazinol U inhibits melanogenesis through the inhibition of tyrosinase-related proteins via AMP kinase activation.
Br. J. Pharmacol. 176, 737–750. https://doi.org/10.1111/bph.14560 (2019).
Acknowledgements
We would like to thank Barretos Cancer Hospital Biobank and Research Support Department (NAP) for the
clinical data and specimen collection, and “Fundação de Amparo à Pesquisa do Estado de São Paulo” (FAPESP)
(Grants: 2012/15880-3, 2012/16617-4, 2016/02193-9), “Conselho Nacional de Desenvolvimento Científico e
Tecnológico” (CNPq) (Grant: 402873/2016-5), and “Coordenação de Aperfeiçoamento de Pessoal de Nível Supe-
rior” (CAPES) for the financial support.
Scientific Reports | (2020) 10:12129 | https://doi.org/10.1038/s41598-020-68945-9 10
Vol:.(1234567890)www.nature.com/scientificreports/
Author contributions
G.J.L. and C.O. were responsible for the study design, experiments, acquisition, analysis and interpretation of
data, and drafting the manuscript. C.T., J.K.S., G.V.B.G., and W.L.O. made relevant contributions in genotyping
and analysis of gene expression. G.J.L. and B.S.C. analyzed the data. J.A.R., V.L.V., S.S., and A.M.M. conducted the
clinical treatment of patients. C.S.P.L. was responsible for the concept and study design, acquisition and interpre-
tation of data, and critical revision of the manuscript. All authors approved the final version of the manuscript.
Competing interests
The authors declare no competing interests.
Additional information
Supplementary information is available for this paper at https://doi.org/10.1038/s41598-020-68945-9.
Correspondence and requests for materials should be addressed to C.S.P.L.
Reprints and permissions information is available at www.nature.com/reprints.
Publisher’s note Springer Nature remains neutral with regard to jurisdictional claims in published maps and
institutional affiliations.
Open Access This article is licensed under a Creative Commons Attribution 4.0 International
License, which permits use, sharing, adaptation, distribution and reproduction in any medium or
format, as long as you give appropriate credit to the original author(s) and the source, provide a link to the
Creative Commons license, and indicate if changes were made. The images or other third party material in this
article are included in the article’s Creative Commons license, unless indicated otherwise in a credit line to the
material. If material is not included in the article’s Creative Commons license and your intended use is not
permitted by statutory regulation or exceeds the permitted use, you will need to obtain permission directly from
the copyright holder. To view a copy of this license, visit http://creativecommons.org/licenses/by/4.0/.
© The Author(s) 2020
Scientific Reports | (2020) 10:12129 | https://doi.org/10.1038/s41598-020-68945-9 11
Vol.:(0123456789)You can also read