Clear phylogeographic pattern and genetic structure of wild boar Sus scrofa population in Central and Eastern Europe
←
→
Page content transcription
If your browser does not render page correctly, please read the page content below
www.nature.com/scientificreports
OPEN Clear phylogeographic pattern
and genetic structure of wild boar
Sus scrofa population in Central
and Eastern Europe
Magdalena Niedziałkowska1*, Ewa Tarnowska1, Joanna Ligmanowska2,3,
Bogumiła Jędrzejewska1, Tomasz Podgórski1,4, Anna Radziszewska2, Iwona Ratajczyk2,
Szilvia Kusza5, Aleksei N. Bunevich6, Gabriel Danila7, Maryna Shkvyria8,
Tomasz Grzybowski2 & Marcin Woźniak2
The wild boar Sus scrofa is one of the widely spread ungulate species in Europe, yet the origin and
genetic structure of the population inhabiting Central and Eastern Europe are not well recognized.
We analysed 101 newly obtained sequences of complete mtDNA genomes and 548 D-loop sequences
of the species and combined them with previously published data. We identified five phylogenetic
clades in Europe with clear phylogeographic pattern. Two of them occurred mainly in western and
central part of the continent, while the range of the third clade covered North-Eastern, Central and
South-Eastern Europe. The two other clades had rather restricted distribution. In Central Europe,
we identified a contact zone of three mtDNA clades. Population genetic structure reflected clear
phylogeographic pattern of wild boar in this part of Europe. The contribution of lineages originating
from the southern (Dinaric-Balkan) and eastern (northern cost of the Black Sea) areas to the observed
phylogeographic pattern of the species in Central and Eastern Europe was larger than those from
the regions located in southern France, Iberian, and Italian Peninsulas. The present work was the
first mitogenomic analysis conducted in Central and Eastern Europe to study genetic diversity and
structure of wild boar population.
Wild boar (Sus scrofa) is one of the most numerous ungulates in Europe and the terrestrial mammal species with
the widest geographical range1. It naturally occurs over large areas in Europe (except for the most northern parts
of the continent), Asia and North Africa. The species has also been introduced by humans to all other continents
(except Antarctica) and many islands1. Wild boar evolved in South-Eastern Asia, and then colonized northern,
central and western parts of Eurasia in several migration waves2,3. Omnivorous and ecologically flexible, the
species occurs in many different temperate and tropical habitats from forests, marshes and grasslands to semi-
deserts1,4. Furthermore, in many areas of Eurasia wild boar hybridized with domestic p igs5–7.
Population numbers of boars have been greatly fluctuating in time. In Europe in the 17-nineteenth centuries,
the wild boar number decreased due to climate cooling and overhunting by humans. Since the nineteenth cen-
tury, their numbers started to increase but then during and after the World Wars in the twentieth century the
population was reduced again due to intensive culling. In the second half of twentieth century, the numbers of
wild boars significantly increased in Europe8,9.
The most important natural factors affecting the fluctuations in population numbers of wild boar are winter
temperature, depth of snow and multiannual variation in acorn (oak seed) c rop4,8,10. At biogeographical scale,
1
Mammal Research Institute Polish Academy of Sciences, Białowieża, Poland. 2Department of Forensic
Medicine, Ludwik Rydygier Collegium Medicum in Bydgoszcz, Nicolaus Copernicus University in Toruń, Toruń,
Poland. 3Department of Clinical Pathology, Ludwik Rydygier Collegium Medicum in Bydgoszcz, Nicolaus
Copernicus University in Toruń, Toruń, Poland. 4Department of Game Management and Wildlife Biology, Faculty
of Forestry and Wood Sciences, Czech University of Life Sciences, Prague, Czech Republic. 5Centre for Agrar
Genomics and Biotechnology, University of Debrecen, Debrecen, Hungary. 6State National Park Belovezhskaya
Pushcha, Brest Oblast, Kamenec Raion, Kamenyuki, Belarus. 7Facultatea de Silvicultura, Universitatea Stefan Cel
Mare Suceava, Suceava, Romania. 8Kyiv Zoological Park of National Importance, Kyiv, Ukraine. *email: mniedz@
ibs.bialowieza.pl
Scientific Reports | (2021) 11:9680 | https://doi.org/10.1038/s41598-021-88991-1 1
Vol.:(0123456789)
www.nature.com/scientificreports/
the mean January temperature and vegetation productivity index were the best factors explaining the variability
in wild boar population densities, whereas predation by wolves Canis lupus played a lesser role11. Due to high
breeding potential, the species is able to recover in numbers very quickly, even when the densities were highly
reduced by natural or human-related f actors8.
Since 2007, when ASF (African swine fever) was introduced to Georgia, the disease has been spreading
across Eurasia affecting wild boar and domestic pigs from Western Europe12 to Eastern Asia13,14. As of 2020,
the disease is still expanding, with many European (Bulgaria, Germany, Greece, Hungary, Latvia, Lithuania,
Poland, Romania, Serbia, Slovakia) and Asian (China, Hong Kong, North Korea, South Korea, Laos, Vietnam,
Myanmar, Cambodia, Indonesia, Philippines, Timor-Leste, Papua New Guinea, India) countries reporting new
cases15, while only two countries (Czech Republic and Belgium) were declared free of ASF following a success-
ful eradication programme. ASF causes high mortality in wild boar populations resulting in as much as 80%
decrease of abundance16. Sanitary culling of wild boar, which is one of the preventive measures for ASF control,
is further contributing to the decline in the abundance of the s pecies17,18.
There have been several phylogenetic studies performed on wild boar in E urasia2,3,19–22, which revealed two
or three main mtDNA lineages of wild boar: the Asian (or East Asian and Near Eastern) and the European one
divided further into clades. However, the phylogenetic positions of these lineages and clades varied among studies
due to different length, number, and geographic distribution of analysed sequences (comp. e.g.,2,3,20. The contact
zone of the European and the Asian lineages of wild boar occurs in the vicinity of the Caspian Sea in I ran20 and
the Caucasian Mountains21.
Late Pleistocene glaciations, postglacial recolonization, translocations, and hybridization with domestic pigs
were pointed out as important factors that shaped the contemporary phylogeographic pattern of wild boar in
Europe and western Asia5,23–25. The mtDNA studies and localization of subfossil remains indicated that in Europe
the species survived the Last Glacial Maximum (LGM) in southern refugia. The mtDNA lineages of wild boar
inhabiting Italy, the Caucasus Mountains and the Near East are distinct from all other lineages occurring in
western Eurasia5,26. Veličković et al.19 showed high frequencies of private microsatellite alleles in the popula-
tions inhabiting the three southern peninsulas (Iberian, Italian and Balkan), which confirmed the uniqueness
of those populations. The more northern areas of Europe have been inhabited by wild boar of admixed origin.
They were descendants of specimens recolonizing large areas of Europe from the LGM refugia during the post-
glacial times24. Almost all of them (except several individuals with Asiatic haplotypes, comp.26,27) grouped in one
mtDNA lineage called E1, which were further divided into clades E1-A and E1-C. The majority of individuals
occurring in Central and Eastern Europe belonged to clade E1-C27. The genetic structure of that vast population
was weak with no signs of significant demographic fluctuations. It was not clear, which of the LGM refugia the
contemporary wild boar population in Central and Eastern Europe originated f rom27.
Until now the results of almost all studies concerning the phylogenetic and phylogeographic studies of wild
boar in Europe have been based on analyses of relatively short fragments of mtDNA control region (411 bp
in5; 443 bp in25; 637 bp in24; 664 bp in27). A recently published study by Khederzadeh et al.26 for the first time
showed the results of phylogenetic analyses of the complete mtDNA genome of wild boar from large areas in
North Africa, Europe and Western Asia. The authors evidenced that the Italian E2 lineage of wild boar was
closely related to that in the eastern Caucasus Mts., and those lineages were basal to other European haplotypes
of the species. Khederzadeh et al.26 also suggested that there had been gene flow between those two (Italian and
Caucasian) LGM refugial populations and Southern Europe could have been recolonized from the east. This
hypothesis has been confirmed by Frantz et al.23, who found an extinct mtDNA haplogroup Y2 among Holocene
wild boar samples in southern Ukraine (Crimea Peninsula), the Balkans and Italy. That haplogroup was earlier
found exclusively among ancient wild boar from Turkey24. We hypothesize that also the Eastern and Central
parts of European continent were recolonized not only from the well-known southern LGM refugia but also
from areas localized in eastern Europe, as it was shown earlier for bank vole Clethriononys glareolus30, hamster
Cricetus cricetus29 or moose Alces alces30. To test this hypothesis more detailed analysis of genetic diversity of
wild boar population in Central and eastern Europe and western Asia is required.
In this paper, we report on a study on phylogeny and phylogeography of wild boar in six countries of Central
and Eastern Europe, based on 101 sequences of complete mitogenomes and 548 mtDNA control region (D-loop)
sequences of the species (Fig. 1, Tables 1, S1). Our data set consist of the largest number of samples and the
longest mtDNA sequences analysed in wild boar populations in this part of the continent. To further enlarge
the number of analysed sequences and their geographic span, we combined our data with 77 mtDNA sequences
published by Khederzadeh et al.26. The aims of our study were to: (1) estimate wild boar mitochondrial genetic
diversity, (2) reveal their mtDNA phylogenetic and phylogeographic pattern, (3) identify the genetic structure
of the species population, and (4) identify the possible regions of origin of the wild boar that currently inhabit
Central and Eastern Europe. The analysed samples were collected between 2001 and 2015, thus before the enor-
mous decline of wild boar numbers in Central and Eastern Europe caused by the spread of ASF. Therefore, the
results of our study will provide invaluable reference data for future investigations of large scale genetic structure
of wild boar population during and after the process of its recovery.
Results
Genetic diversity, phylogeny and phylogeography of wild boar. Among 101 sequences of com-
plete mitochondrial genomes of wild boar 29 new haplotypes were identified, not described previously by other
authors. Among 548 analysed sequences of mtDNA control region we revealed 19 distinct haplotypes. Based
on our analysis of mitochondrial genomes as well as that by Khederzadeh et al.26, we identified seven phyloge-
netic clades of wild boar with high a posteriori probability (> 0.75) (Figs. 2, 3). Clades 5 and 4, which included
sequences from Italy and Dagestan (Russia), respectively, were the most distinct genetically (differed by more
Scientific Reports | (2021) 11:9680 | https://doi.org/10.1038/s41598-021-88991-1 2
Vol:.(1234567890)
www.nature.com/scientificreports/
Figure 1. Distribution of wild boar (Sus scrofa) samples analysed in this study and grouped into 15 populations
for D-loop (control region) analyses (upper panel) and 9 populations for the mitogenome-based analyses (lower
panel). The map was created with the ArcGIS software 10.3.1. based on source map from ESRI https://www.esri.
com/en-us/home.
Scientific Reports | (2021) 11:9680 | https://doi.org/10.1038/s41598-021-88991-1 3
Vol.:(0123456789)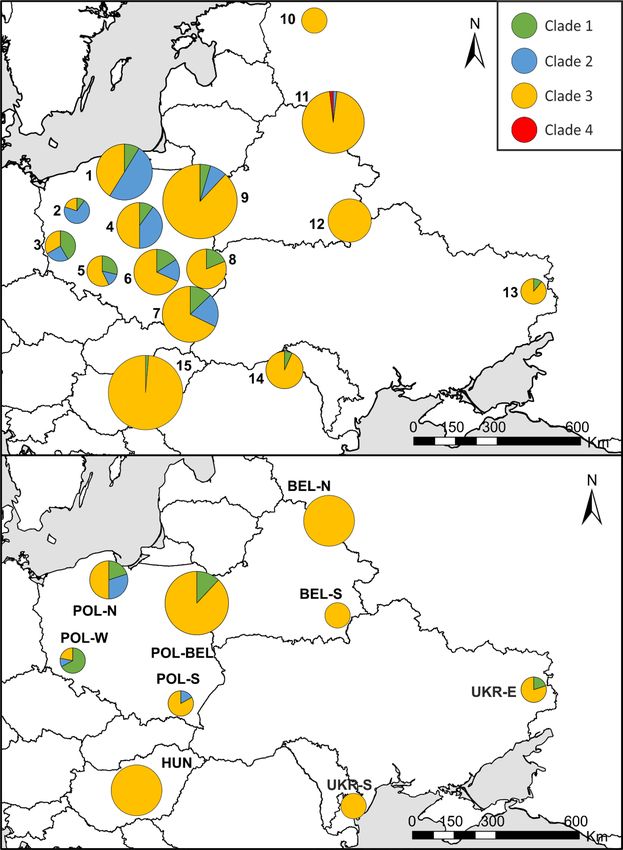
www.nature.com/scientificreports/

                                           Figure 2.  Bayesian phylogenetic tree (MCMC = 1 000,000) of mitogenome sequences of wild boar Sus scrofa.
                                           Posterior probability values on all branches were between 90 and 100. Black dots mark values in the range 63 –
                                           89.

          Scientific Reports |   (2021) 11:9680 |              https://doi.org/10.1038/s41598-021-88991-1                                                   4

Vol:.(1234567890)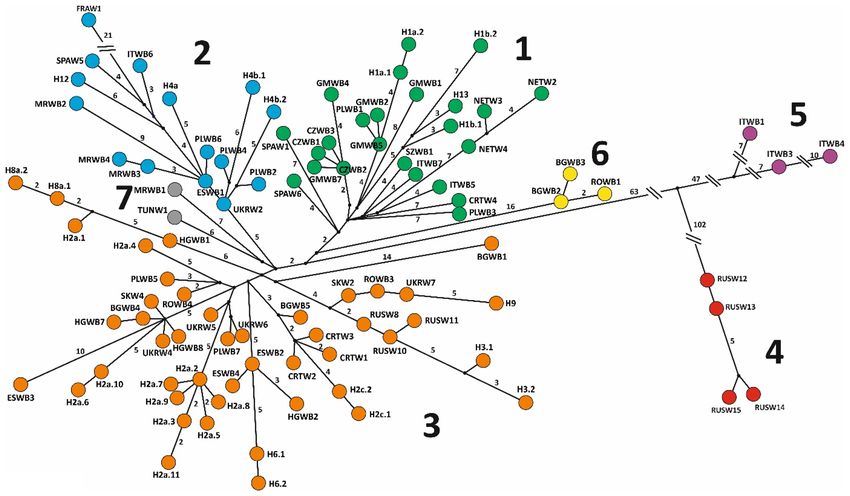
www.nature.com/scientificreports/

                                 Figure 3.  Haplotype network of the mitogenome sequences of wild boar from this study and Khederzadeh
                                 et al.26. Colours and numbers of clades as in Fig. 2. Numbers on branches mean mutation steps (if > 1) between
                                 sequences.

                                 than 100 mutation steps from all other mtDNA clades, Fig. 3) and represented the oldest evolutionary branches
                                 on the tree (Fig. 2). The Italian clade (5) is a sister haplogroup to all the remaining clades of wild boar from
                                 Europe and North Africa (Fig. 2). Among these, the most distinct genetically were clade 6 and the haplotype
                                 BGWB1 of the clade 3 (Figs. 2, 3), all found in individuals from South-Eastern Europe (Bulgaria and Roma-
                                 nia;26). The remaining European clades (1–3), and the North African clade 7 differed from each other by 12–15
                                 mutation steps (Fig. 3). The phylogenetic tree based on the D-loop sequences (Fig. S1) showed basically the same
                                 structure, yet it slightly differed in topology from the mitochondrial genome tree. As the values of posterior
                                 probabilities on its branches were lower, the phylogeny of wild boar based on the whole mitogenomes is more
                                 credible.
                                     The spatial distribution of the seven clades of wild boar showed a clear phylogeographic pattern in Europe
                                 and North Africa (Fig. 4). Clades 1 and 2 occurred mainly in Western and Central Europe. Clade 3 covered the
                                 largest area: from the northern Ural Mts. to Eastern, Central and South-Eastern Europe including the Balkans.
                                 The remaining clades had more restricted distribution: clade 4 occurred (except one individual from Western
                                 Russia) in the Caucasus Mountains, clade 5 in Italy, and clade 6 in South-Eastern Europe (Romania and Bulgaria).
                                 Clade 7, although genetically closely related to the European clades 2 and 3, occurred only in the North Africa
                                 (Fig. 4). Interestingly, we identified a contact zone of three mtDNA clades: 1, 2 and 3 in the Central Europe, on
                                 the territory of Poland (Fig. 4).

                                 Genetic diversity of wild boar population in Central and Eastern Europe. In our study area the
                                 overall haplotype diversity of wild boar mitogenomes was 0.92 (SD = 0.013) and nucleotide diversity 0.0006
                                 (SD = 0.00003) (Table S2). About 0.5% of the nucleotide sites in the sequences were polymorphic. The most
                                 numerous haplotypes were H2a.2 (17% of samples) and H6.1 (16%). More than half of the haplotypes were
                                 singletons. In the D-loop sequences 2.5% of nucleotide sites were polymorphic. Overall haplotype diversity was
0.71 (SD = 0.017) and nucleotide diversity 0.0015 (SD = 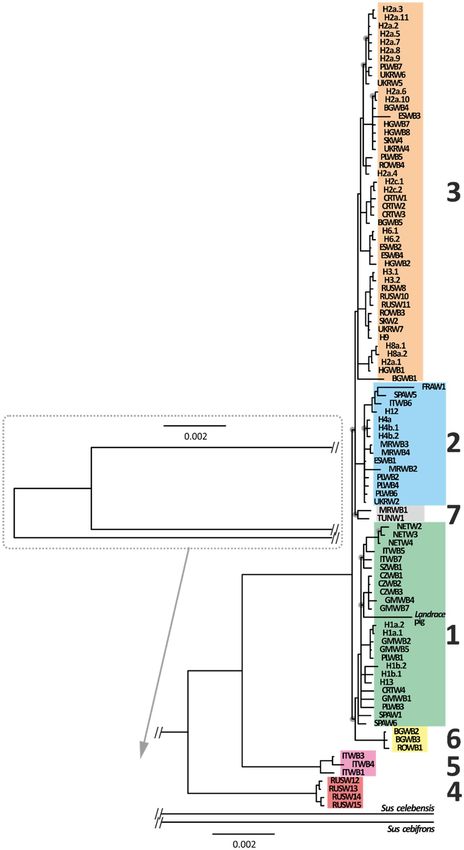
www.nature.com/scientificreports/
Figure 4. Geographic distribution of clades of wild boar (Sus scrofa) distinguished based on the analyses of
mtDNA sequences. Colours and numbers of clades as in Fig. 2. Triangles denote mitogenomes published by
Khederzadeh et al.26, circles—mitogenomic and D-loop sequences obtained in this study. The map was created
with the ArcGIS software 10.3.1. based on source map from ESRI https://www.esri.com/en-us/home.
lower than those of the clade 3 (Table 2). In Central and Eastern Europe haplotypes of clades 1 and 2 occurred
mainly in Poland, and most of them were rare and represented only by single individuals (Figs. 5, S4, S5).
Mismatch distribution analyses and neutrality tests (Tajimas’D, Fu’s Fs) performed for the three clades of
mitogenomic and D-loop sequences of wild boar did not reveal expansion of those clades (Table 2, Fig. S6).
We compared the frequencies of different mtDNA clades and the indices of genetic diversity among 9 (mitog-
enomes) and 15 local (D-loop) populations (Fig. 5, Tables S2, S3). The frequency of clade 1 was highest in the
South-West Poland (42–67%) and it declined to 20–0% towards south and east (Fig. 5). Clade 2 were found
exclusively in Poland, with the exception of one individual recorded in Eastern Belarus. The share of clade 3
was highest in north-eastern, eastern and south eastern parts of Central and Eastern Europe (up to 80–100% in
Russia, Belarus, Ukraine and Hungary) and it declined towards west (20–33% in Western Poland).
The haplotype diversity of the mitogenomic populations varied from 0.73 to 1, the values of the B index from
3 to 4.76 and the nucleotide diversity ranged between 0.4 and 1 × 10⁻³ (Table S2). The haplotype diversity of the
D-loop populations varied from 0.51 to 0.86, the value of B index from 1.72 to 5.55 and the nucleotide diversity
from 0.7 to 2.0 × 10⁻³. Both indices of haplotype diversity (Hd and B) revealed that the most diverse populations
of wild boar in our studied region inhabited southern, central and northern Poland and north-eastern Belarus
(Tables S2, S3, comp. Figure 5). The nucleotide diversity of the D-loop populations increased significantly with
latitude (r = 0.712, p = 0.003), but we did not find such statistically significant correlations for haplotype diversity
indices. The neutrality tests performed for each of the mitogenomic and D-loop populations did not reveal any
sings of expansion (Tables S2, S3).
Genetic structure of wild boar population in Central and Eastern Europe. Genetic differentia-
tion (Fst) between pairs of the analysed populations varied from very low (Fst = 0.001) to high and significant
values (0.498), indicating unrestricted gene exchange in the first case and complete isolation in the second one
(Tables S4, S5). According to the values of pairwise Fst, the most distant genetically were wild boar from western
Poland (populations: mitogenomic POL-W and D-loop pop 2; Tables S4, S5). The Fst values were usually low
between pairs of populations located in close proximity (Tables S4, S5). We did not detect significant isolation
Scientific Reports | (2021) 11:9680 | https://doi.org/10.1038/s41598-021-88991-1 6
Vol:.(1234567890)www.nature.com/scientificreports/
Number of samples
Country D-loop Mitogenomes
Poland 337 39
Belarus 79 30
Ukraine 19 10
Hungary 67 17
Russia 27 2
Romania 19 3
Total 548 101
Table 1. Number of analysed wild boar tissue samples per country. Russia—European part only. See Fig. 1 for
spatial distribution of samples.
by distance, as the genetic differentiation did not increase with geographic distance between them (Mantel tests:
R = 0.25, p = 0.09 for D-loop and R = 0.04, p = 0.37 for mitogenomic populations).
Analyses performed using Geneland for both D-loop and mitogenomic sequences showed three genetic
groups of wild boar in Central and Eastern Europe, although the distribution of these groups were different for
each set of the populations (Fig. 6). D-loop sequences were assembled in three groups GI – GIII and mitog-
enomic sequences in groups GmI–GmIII (Fig. 6). D-loop sequences were clumped into GI consisting of samples
from Poland and a few from western Belarus and western Ukraine, GII covering north-western Russia, Belarus,
northern and southern Ukraine, Romania and Hungary and GIII grouping the easternmost samples from eastern
Ukraine and western Russia (Fig. 6). However, if Geneland was run on D-loop sequences from Poland only, the
border between two identified genetic groups was very similar to that between mitogenomic groups GmI and
GmIII (see insert in Fig. 6, upper panel). Based on mitogenomic sequences, Geneland separated three groups:
GmI in north-western Poland, Gm II in southern Poland, Slovakia, Hungary and the southern-most Ukraine,
and GmIII in north-eastern Poland, Belarus, Ukraine and western Russia (Fig. 6).
Among the D-loop genetic groups the highest haplotype diversity was detected in the GII group and nucleo-
tide diversity was the highest in the GIII group (Table S6). The highest haplotype diversity among three mitog-
enomic genetic groups was observed in the GmI group, and nucleotide diversity in the GmIII group (Table S6).
The Fst values calculated among all pairs of genetic groups (D-loop and mitogenomic) were statistically signifi-
cant in all cases but the largest genetic differentiation was detected between mitogenomic groups GmI and GmII
(Fst = 0.22, Table S7) and the lowest between D-loop groups GI and GII (Fst = 0.08, Table S8).
Discussion
Previous studies on European wild boar, based on shorter fragments of mtDNA (from 80 diagnostic bp i n2, to
410–660 bp in Scandura et al.5 and Kusza et al.27, respectively) did not show any clear phylogeographic structure
within the large pan-European clade E1, spanning from Iberia to Ukraine and western Russia. The proposed
division of E1 into A and C clusters2,23 soon appeared too simplified, as several regional studies revealed numer-
ous subclades of intermediate phylogenetic position between A and C and geographically restricted ranges of
occurrence, namely in G reece24 and the Dinaric-Balkan region (from Slovenia to North M acedonia25). This work,
based on 1175-bp long fragment of mtDNA and full mitogenomes of wild boar (from our study combined with
those published by Khederzadeh et al.26) described the phylogeny of wild boar with much higher resolution and
allowed for the spatial lineage sorting across Europe.
We found seven phylogenetic clades of wild boar in the geographic area from North Africa, to the mainland
of Europe, to Dagestan in the North Caucasus. We confirmed the findings by Khederzadeh et al.26 that haplo-
types from Dagestan and Italy (our clades 4 and 5, respectively) were genetically most distinct from all other
lineages in Europe. Our clade 5 corresponded to E2 and clades 1–3, 6 and 7 (the last one found in North Africa)
to the pan-European clade E12,5,31. Clade 6, not reported in earlier studies, with 3 haplotypes from Bulgaria and
Romania, along with the most distinct haplotype BGWB1 from Bulgaria (clade 3) are most likely signals of very
diverse populations in the Balkans (comp.24,25). This requires further detailed studies including more dense
sampling in that region.
Clades 1 and 2 occurred widely in western and central Europe (from Iberia to Czech Republic and Poland) and
only sporadically further south and east, whereas clade 3 appeared and increased in frequency to be a dominant
one among wild boar populations in Eastern Poland, Hungary, Belarus, Ukraine, Romania and Western Rus-
sia. Therefore, a complete exchange of clades takes place between the two longitudinal extremes of continental
Europe. A contact zone of one eastern and two western clades (about 700 km wide in Poland) probably runs
diagonally from Croatia, Western Hungary, to Poland and the Baltic States. Our dense sampling in Central and
Eastern Europe, where the eastern clade 3 was dominating, revealed—not surprisingly—that it was genetically
diverse, with further spatial substructuring: groups of haplotypes with different positions on the branches of
the phylogenetic trees and networks had different frequencies regionally. Future research should focus on a
comparable dense sampling of wild boar from western and southern Europe for mitogenomic analyses. This
will be essential to reveal the spatial pattern of clade 1 and 2 frequencies in Iberia, Italy, and Western Europe.
In Central and Eastern Europe, the highest genetic diversity was detected in the contact zone of different
mtDNA clades that occurred in wild boar populations inhabiting the Western, South-Western, and Central
Poland. According to the obtained Fst values and distribution of different haplotypes, the most intensive gene
Scientific Reports | (2021) 11:9680 | https://doi.org/10.1038/s41598-021-88991-1 7
Vol.:(0123456789)www.nature.com/scientificreports/
Figure 5. Frequencies of mtDNA clades of wild boar populations based on D-loop (upper panel) and
mitogenomic analyses (lower panel). The maps were created with the ArcGIS software 10.3.1. based on source
map from ESRI https://www.esri.com/en-us/home.
flow among wild boar populations in our study area is in the north-east to south-east direction and the east–west
direction. Wild boar inhabiting Western Poland were genetically most distant among the analysed popula-
tions. This is in agreement with the results of Veličković et al.19, who showed that populations of wild boar with
Scientific Reports | (2021) 11:9680 | https://doi.org/10.1038/s41598-021-88991-1 8
Vol:.(1234567890)www.nature.com/scientificreports/
admixture origin had larger genetic diversity than the refugial populations. The identification of the easternmost
subpopulation, indicated by the analysis of D-loop sequences in Geneland, was in line with the earlier results of
Kusza et al.27. Further sampling of wild boar populations in the European part of Russia, especially in the gap
between Eastern Ukraine and the Caucasus Mountains might reveal another contact zone of clades 3 and 4 and
possibly the Asiatic clades. Such a contact zone of European, Near East and Asiatic clades of wild boar was found
south of the Caucasus Mts., in Northwestern I ran20,23.
The clear phylogeographic patterns of the identified clades 1–6 raises a question about the glacial refugia
of wild boar, and the contributions of the refugial populations to the contemporary gene pool of the species in
Europe. The contact zones of different genetic lineages in Central and Eastern Europe were identified for sev-
eral other mammalian species and they testify to the origin of those lineages from different refugia (e.g.32–34).
According to fossil records35, during the LGM wild boar inhabited Northern Spain, Central Portugal, Southern
France, South-central and North-western Italy, Slovenia, Croatia, and Greece. Sommer and N adachowski35 did
not analyse the eastern regions, such as Black Sea coasts and the Caucasus. Reconstruction of wild boar LGM
range by modelling based on the present-time habitat suitability of the species was done by Vilaça et al.36, how-
ever, this did not include Russian populations. Thus, the model of LGM refugia only produced three candidate
regions: Iberia-Southern France, Italy, and Greece. Another approach was applied by Markova and P uzachenko37,
who reconstructed the ecosystems of Europe (the whole continent from the Atlantic and Mediterranean coasts
to the Ural Mountains) based on records of indicative plant (spores and pollen) and mammal (fossils) species.
Habitats suitable for wild boar (Mediterranean forest, Caucasian forest, and the southern variant of periglacial
forest-steppe) were supposed to form the continuous belt of variable width covering northern half of the Iberian
peninsula, southern France, Apennine peninsula (without its southern part) up to the Alps, the whole Balkan
region (with the exception of the southernmost Peloponnese peninsula), the Pannonian Basin, the northern
and eastern coast of the Black Sea, ending around the Caucasus Mountain ridge, with a larger refugial area on
its southern side [37 p. 46]. Ecological niche modelling performed by Niedziałkowska et al.38 for the European
red deer (Cervus elaphus), a species with habitat preferences similar to those of wild boar, also showed that the
surroundings of the Black Sea provided suitable refugium for deer during LGM.
Interestingly, phylogeographic studies on the present-day wild boar populations inhabiting their presumed
LGM refugia evidenced great genetic diversity in those regions, and the endemic character of the local gene
pools rather than source of postglacial recolonization of Europe. This was true for E2 clade in I taly2, Southern
Balkan haplogroup25, numerous haplotypes from Greece and S pain24. The last authors concluded that those
southernmost peninsular regions still harbour the remnants of pre-LGM gene pool, yet they played no role in
the recolonization of Central-Eastern Europe. The recolonization must have been only based on the gene pool
in the northern parts of the refugia (leading-edge colonization;39).
Vilaça et al.36 believed that the Iberian refugium did not significantly contribute to the post-glacial European
range of wild boar, and proposed two major colonization routes: one starting from the refugium in southern
France and/or northern Italy, and leading wild boars to western and central Europe, and the second one starting
from the Balkans and reaching north-eastern parts of the continent. Veličković et al.25 argued that mtDNA line-
ages originating from Iberia, Italian and Balkan Peninsulas played a similar role in the post-glacial recolonization
of Europe by wild boar. The results of our study partly confirmed the hypotheses of Vilaça et al.36 and Veličković
et al.25. It is highly probable that clades 1 and 2 spread from south-west towards central and eastern Europe,
whereas wild boar belonging to clade 3 could have arrived from the south and/or south-east and populated the
central and north-eastern Europe. The two colonization waves met in central-eastern part of the continent and
formed a contact zone. As regards clade 3, we suppose that the LGM refugium of this highly diverse clade cov-
ered the Dinaric and the Balkan region as well as the contiguous northern coast of the Black Sea. As suggested
by the spatial distribution of subgroups of related haplotypes (comp. Figs S4 and S5), the northward dispersal
of wild boar in the postglacial period began both from the south (Dinaric-Balkan) and the south-east (Black
Sea northern coast).
To answer the question where the western waves of colonizers (clades 1 and 2) originated from, we would
need to expand the sampling and mitogenome analyses of wild boar in the gaps between the area of the contact
zone and the potential refugial regions in Iberia, France, and Italy.
Although the genetic diversity of wild boar populations in Europe was higher in the past, than nowadays,
the spatial distribution of the main mtDNA clades (E1, E2 and the Near Eastern) has not changed significantly
since the early Holocene, in contrast to the mtDNA phylogeographic pattern of the domestic p igs21,23,40. Only
one clade of the species (Y2 according to nomenclature provided i n21,22), occurring in the past in southern and
south-eastern Europe but genetically rather closely related to the Near Eastern wild boar [21, this study Figs
S7, S8], is today extinct. Furthermore, according to Scandura et al.23, hybridization with pigs has not had any
significant impact on the genetic diversity of wild boar.
Despite fluctuations in wild boar numbers in the recent past (e.g. population decrease in the Little Ice Age of
the eighteenth-nineteenth centuries), the species never disappeared from Central and Eastern E urope8. Therefore,
such climate-driven oscillations probably did not have significant impact on the phylogeographic pattern of wild
boar. A similar situation was recorded in another temperate ungulate species—the European red deer. Although
the genetic diversity of deer was higher in the past and their numbers significantly decreased or they even became
extinct in the eighteenth–nineteenth centuries in some regions of north-central Europe, the present-day phy-
logeographic pattern of the species reflects the postglacial migration routes from different LGM refugia local-
ized in western and south-eastern parts of Europe (e.g.32,41–43). Further studies on wild boar genetics including
also nuclear DNA markers are needed to confirm the phylogenetic pattern of wild boar in this part of Europe.
Nonetheless, the study performed by Frantz et al.21 suggested that, on a larger spatial scale, the phylogeographic
pattern obtained based on the mtDNA data and whole genomes were concordant.
Scientific Reports | (2021) 11:9680 | https://doi.org/10.1038/s41598-021-88991-1 9
Vol.:(0123456789)www.nature.com/scientificreports/
Parameter Mitogenomes D-loop
Clade 1
n 13 38
h 5 4
Hd 0.69 0.36
π × 10–3 0.28 0.40
B 2.78 1.54
Tajima’s D − 1.23 − 1.23
Fu’s Fs 2.18 − 1.19
Clade 2
n 5 63
h 4 4
Hd 0.90 0.50
π × 10–3 0.22 0.48
B 3.57 1.96
Tajima’s D − 0.44 − 0.22
Fu’s Fs − 0.04 − 0.39
Clade 3
n 83 446
h 20 10
π × 10–3 0.46 1.05
B 7.81 2.35
Tajima’s D − 0.41 − 0.38
Fu’s Fs − 0.07 − 1.17
Table 2. Summary statistics of the genetic diversity in three lineages of wild boar in Central and Eastern
Europe, based on full mitogenome and D-loop (control region) sequences; n—number of individuals, h—
number of haplotypes Hd—haplotype diversity, π × 10–3—nucleotide diversity, B—haplotype diversity index.
Neutrality tests: Tajimas’s D and Fu’s Fs. Values of neutrality tests were not significant.
Conclusions
Analyses of the whole mitogenomes of wild boar and combination of the obtained sequences with previously
published data revealed the phylogeny of European wild boar with higher resolution. We detected five European
clades of the species with clear phylogeographic pattern. During the post-glacial times, Central and Eastern
Europe was probably recolonized by wild boar belonging to at least two western clades and one large, diverse
clade from south-eastern Europe. Nowadays, the contribution of mtDNA lineages originating from the south-
east (most probably the Dinaric-Balkan region and the contiguous area of northern coast of the Black Sea) to the
wild boar population in Central and Eastern Europe, is larger than that of clades originating from western and
south-western part of the continent. Genetic diversity was largest in the populations occurring in the contact zone
of three different clades of wild boar. Genetic differentiation (Fst) among studied populations varied from very
low to very high values. No isolation by distance was detected. The most intensive gene flow among studied wild
boar populations took place in the north-east to south-east direction and in the east–west direction. Population
genetic structure of wild boar in Central and Eastern Europe reflected the phylogeographic pattern of this species.
Material and methods
Collection and laboratory analyses of samples. We analysed tissue samples and hair follicles of 548
wild boars collected in six countries of Central and Eastern Europe in 2001–2015 (Table 1). Tissue samples were
provided by licensed hunters. Hair follicle samples came from the zoological collection of the Mammal Research
Institute Polish Academy of Sciences in Białowieża, Poland. Ethic permissions were not required. No animals
were killed or hurt for the purposes of this project. The study did not involve live animals.
We sequenced mitochondrial control region (D-loop of 1175 bp) of all individuals and full mitogenome
(16,615 bp) of selected (according to their localizations in different areas) 101 individuals (Table 1). We divided
the analysed 548 wild boar into 15 populations, and the 101 individuals with sequenced mitogenomes into 9
populations according to their sampling regions (Fig. 1). A list of sampling localities with the exact number of
specimens and years of sampling is given in Table S1.
The whole genomic DNA was extracted using BioTrace DNA Purification Kit (Eurx, Poland). The sequence
of mitochondrial control region (1175 bp) was amplified using two sets of primers: (1) SSmtDNApm33F 5′-ATA
CCAATCACTAGCATCATCG-3′; SSmtDNApm34R 5′ GAGT TCCATGAAGTCCAGCTAC-3′44 and (2) 1F: 5′
CTTACTTCAGGACCATCTCA-3′; 1B: 5″- GGTTGAGCAAGGCGTTAT-3′45. Full mitochondrial genome was
amplified using 19 sets of primers described by Jiang et al.45 (Table S9). PCR reactions were set in 25 µl volume
and run in 2720 Thermal Cycler (Applied Biosystems, US). Reaction mix contained GoTaq Hot Start Polymerase
Scientific Reports | (2021) 11:9680 | https://doi.org/10.1038/s41598-021-88991-1 10
Vol:.(1234567890)www.nature.com/scientificreports/
Figure 6. Distribution of three genetic populations indicated by the Geneland software based on the analyses
of 548 D-loop sequences (upper panel) and 101 mitogenomes of wild boar (lower panel). Asterik means
sequence assigned to one of the genetic populations with 30% probability; # means sequence assigned with 50%
probability. All other sequences assigned to their populations with > 50% probability. Insert map in the upper
panel: results of Geneland analysis done on D-loop sequences from Poland only. The maps were created with the
ArcGIS software 10.3.1. based on source map from ESRI https://www.esri.com/en-us/home.
Scientific Reports | (2021) 11:9680 | https://doi.org/10.1038/s41598-021-88991-1 11
Vol.:(0123456789)www.nature.com/scientificreports/
(Promega, US) 1 × buffer, 1.5 mM MgCl2, 250 µM dNTP’s, 2 × 10 pmol of primers, 0.5 U Taq polymerase, and
0.3 µl DNA. PCR profile consisted of initial denaturation step at 94 °C for 5 min followed by 32 cycles of 94 °C for
30 s, 55 °C for 30 s, and 68 °C for 90 s, with final elongation step at 68 °C for 10 min. PCR products were checked
on 3% agarose gel with addition of ethidium bromide and were purified using Amicon Ultra – 0.5 Centrifugal
Filter Devices (Millipore, Germany). Next, we used both primers (forward and reverse in separate sequencing
reactions for each pair of primers) and BigDye Terminator (BDT) v3.1 Cycle Sequencing Kit (Applied Biosys-
tems, US) to obtain sequences of the control region and mitogenome from both strands of each DNA fragment.
The sequencing reaction mix contained 3 µl 5X BDT buffer, 1 µl BDT RR Mix, 0.32 µl (10 pmol concentration)
primer, 3 µl of amplified and purified DNA and 2.68 µl of distilled water. Sequencing PCR profile consisted of
initial denaturation step at 96 °C for 1 min followed by 30 cycles of 96 °C for 10 s, 50 °C for 5 s, 60 °C for 4 s.
Sequencing products were precipitated and purified using mix of 96% ethanol, 3 M sodium acetate and distilled
water (exact description of precipitation process is given in Supplementary Materials). The obtained pellet was
suspended in 30 µl of HI-DI. 10 µl of suspended sequencing product was placed on the 96-well plate, denatured
at 94 °C for 3 min, then cooled on ice for 3 min and analysed on 3130xl GeneticAnalyzer (Applied Biosystems,
US). Sequences were checked and aligned to the reference sequence (GenBank accession number AF034253)
using SeqScape v. 2.5 software (Applied Biosystems, US).
Statistical analysis. The phylogenetic relationships among wild boars, both for mitogenomic and D-loop
sequences, were reconstructed using Bayesian phylogenetic tree in MrBayes 3.2.7 s oftware46. HKY + G + I evo-
lutionary model was used after the model selection in Mega 7.0.2647. Two independent Monte Carlo Markov
Chains (MCMC) were run for 10,000,000 generations, with samplefreq = 100, printfreq = 500, diagnfreq = 5000,
standard deviation after 10,000,000 mcmc < 0.005). Phylogenetic trees were visualised in FigTree 1.4.4 (http://
tree.bio.ed.ac.uk/software/figtree/). For phylogenetic comparisons, the sequences obtained in this study were
combined with those from26 pre-processed in SAMtools48 to reconstruct full nucleotide sequences. Trees were
rooted with sequences of two swine species: Sus cebifrons and Sus celebensis (GenBank accession numbers:
KF952600 and KM203891). Phylogenetic network for mitogenomic haplotypes from both studies (our and those
of Khederzadeh et al.26) were constructed with Maximun likelihood (ML) approach using Phylip 3.695 (http://
evolution.genetics.washington.edu/phylip.html) and Haplotype Viewer (http://www.cibiv.at/~greg/haplo-
viewer). The networks for all sequences obtained in this study for the two markers (mitogenomes and D-loop)
were also constructed using Median joining method in PopArt 1.749.
Parameters of genetic diversity (number of haplotypes, number of polymorphic loci, and haplotype and
nucleotide diversity) were calculated for the two mtDNA markers in DNAsp 6.11.0150. We also calculated B
index using the formula B = 1/Σpi2 where pi is the frequency of haplotype i in the population51. It ranges from
1 to n—where n is the total number of detected haplotypes. This index better reflects the effective number of
haplotypes in a sample due to its wider range than the commonly used haplotype diversity index (see28,33). Two
tests of neutrality (Tajima’s D and Fu’s Fs) as well as their statistical significance for populations and for whole
sample set in the two markers were calculated in DNAsp. We checked the Isolation by Distance (IBD) for both
markers using Mantel Test performed in Arlequin v3.5.2.252. The described parameters of genetic variability were
also calculated for each of the three main mtDNA clades of wild boar detected in Central and Eastern Europe.
Neutrality tests, using DNAsp, and mismatch analysis, using Arlequin, were also performed for each of the clades
detected by mitogenome and D-loop sequences.
Correlations between genetic variability parameters (haplotype diversity, nucleotide diversity, B index), coor-
dinates of the localities of mitogenomic or D-loop populations and sample size were calculated using the rcor.
test implemented in “ltm” package R (Rizopoulos 2006, https://www.r-project.org/).
To detect the genetic structure of wild boars, we ran three independent Geneland ver. 4.9.253–58 analyses: for
mitogenomes, for all D-loop sequences, and for D-loop sequences only from Poland, were performed under
spatial model with 100,000 iterations, thinning = 100, and 20 multiple independent runs. Parameters of genetic
diversity for the groups indicated by Geneland were calculated using the software described above and used for
calculation of such variables for populations. To evaluate gene flow, Fst values among all pairs of populations (for
the two markers) and genetic groups indicated by Geneland ver. 4.9.253–58 were calculated in Arlequin.
Data availability
D-loop sequences obtained in this study are deposited in GenBank (Accession numbers: MW842550-
MW842568). Other datasets generated during and/or analysed during the current study are available from the
corresponding author on reasonable request.
Received: 4 January 2021; Accepted: 19 April 2021
References
1. Keuling, O. & Leus, K. Sus scrofa. The IUCN Red List of Threatened Species 2019: e.T41775A44141833. https://doi.org/10.2305/
IUCN.UK.2019-3.RLTS.T41775A44141833.en. Downloaded on 26 Oct 2020. (2019)
2. Larson, G. et al. Worldwide phylogeography of wild boar reveals multiple centers of pig domestication. Science 307, 1618–1621.
https://doi.org/10.1126/science.1106927 (2005).
3. Choi, S. K. et al. Asia-wide phylogeography of wild boar (Sus scrofa) based on mitochondrial DNA and Y-chromosome: Revising
the migration routes of wild boar in Asia. PLoS ONE 15, e0238049. https://doi.org/10.1371/journal.pone.0238049 (2020).
4. Borowik, T., Cornulier, T. & Jędrzejewska, B. Environmental factors shaping ungulate abundances in Poland. Acta Theriol. 58,
403–413. https://doi.org/10.1007/s13364-013-0153-x (2013).
5. Scandura, M. et al. Ancient vs recent processes as factors shaping the genetic variation of the European wild boar: Are the effects
of the last glaciation still detectable?. Mol. Ecol. 17, 1745–1762 (2008).
Scientific Reports | (2021) 11:9680 | https://doi.org/10.1038/s41598-021-88991-1 12
Vol:.(1234567890)www.nature.com/scientificreports/
6. Larson, G. et al. Patterns of East Asian pig domestication, migration, and turnover revealed by modern and ancient DNA. Proc.
Natl. Acad. Sci. U S A 107, 7686–7691. https://doi.org/10.1073/pnas.0912264107 (2010).
7. Iacolina, L. et al. Hotspots of recent hybridization between pigs and wild boars in Europe. Sci. Rep. 8, 17372. https://doi.org/10.
1038/s41598-018-35865-8 (2018).
8. Jędrzejewska, B., Jędrzejewski, W., Bunevich, A. N., Miłkowski, L. & Krasiński, Z. A. Factors shaping population densities and
increase rates of ungulates in Białowieża Primeval Forest (Poland and Belarus) in the 19th and 20th centuries. Acta Theriol. 42,
399–451 (1997).
9. Apollonio, M., Anderson, R. & Putman, R. European Ungulates and Their Management in the 21st Century (Cambridge University
Press, Cambridge, 2010).
10. Okarma, H. et al. The roles of predation, snow cover, acorn crop, and man-related factors on ungulate mortality in Białowieża
Primeval Forest, Poland. Acta Theriol. 40, 197–217. https://doi.org/10.4098/AT.arch.95-20 (1995).
11. Melis, C., Szafrańska, P. A., Jędrzejewska, B. & Bartoń, K. Biogeographical variation in the population density of wild boar (Sus
scrofa) in western Eurasia. J. Biogeogr. 33, 803–811. https://doi.org/10.1111/j.1365-2699.2006.01434.x (2006).
12. Dellicour, S. et al. Unravelling the dispersal dynamics and ecological drivers of the African swine fever outbreak in Belgium. J.
Appl. Ecol. 57, 1619–1629. https://doi.org/10.1111/1365-2664.13649 (2020).
13. Wang, T., Sun, Y. & Qiu, H.-J. African swine fever: An unprecedented disaster and challenge to China. Infect. Dis. Poverty 7, 111.
https://doi.org/10.1186/s40249-018-0495-3 (2018).
14. Schulz, K., Conraths, F. J., Blome, S., Staubach, C. & Sauter-Louis, C. African swine fever: Fast and furious or slow and steady?.
Viruses https://doi.org/10.3390/v11090866 (2019).
15. Blome, S., Franzke, K. & Beer, M. African swine fever: A review of current knowledge. Virus Res. 287, 198099. https://doi.org/10.
1016/j.virusres.2020.198099 (2020).
16. Morelle, K. et al. Disease-induced mortality outweighs hunting in causing wild boar population crash after african swine fever
outbreak. Front. Vet. Sci. https://doi.org/10.3389/fvets.2020.00378 (2020).
17. Vicente, J. et al. Science-based wildlife disease response. Science 364, 943–944. https://doi.org/10.1126/science.aax4310 (2019).
18. Schulz, K. et al. Epidemiological evaluation of Latvian control measures for African swine fever in wild boar on the basis of surveil-
lance data. Sci. Rep. 9, 4189. https://doi.org/10.1038/s41598-019-40962-3 (2019).
19. Veličković, N. et al. Demographic history, current expansion and future management challenges of wild boar populations in the
Balkans and Europe. Heredity 117, 348–357. https://doi.org/10.1038/hdy.2016.53 (2016).
20. Khalilzadeh, P. et al. Contact Zone of Asian and European Wild Boar at North West of Iran. PLoS ONE 11, e0159499. https://doi.
org/10.1371/journal.pone.0159499 (2016).
21. Frantz, L. A. F. et al. Ancient pigs reveal a near-complete genomic turnover following their introduction to Europe. Proc. Natl.
Acad. Sci. USA 116, 17231 (2019).
22. Larson, G. et al. Ancient DNA, pig domestication, and the spread of the Neolithic into Europe. Proc. Natl. Acad. Sci. USA 104,
15276 (2007).
23. Scandura, M., Iacolina, L. & Apollonio, M. Genetic diversity in the European wild boar Sus scrofa: Phylogeography, population
structure and wild x domestic hybridization. Mamm. Rev. 41, 125–137. https://doi.org/10.1111/j.1365-2907.2010.00182.x (2011).
24. Alexandri, P. et al. The Balkans and the colonization of Europe: The post-glacial range expansion of the wild boar, Sus scrofa. J.
Biogeogr. 39, 713–723. https://doi.org/10.1111/j.1365-2699.2011.02636.x (2012).
25. Veličković, N. et al. From north to south and back: The role of the Balkans and other southern peninsulas in the recolonization of
Europe by wild boar. J. Biogeogr. 42, 716–728. https://doi.org/10.1111/jbi.12458 (2015).
26. Khederzadeh, S. et al. Maternal genomic variability of the wild boar (Sus scrofa) reveals the uniqueness of East-Caucasian and
Central Italian populations. Ecol. Evol. 9, 9467–9478. https://doi.org/10.1002/ece3.5415 (2019).
27. Kusza, S. et al. Contemporary genetic structure, phylogeography and past demographic processes of Wild Boar Sus scrofa Popula-
tion in Central and Eastern Europe. PLoS ONE 9, e91401. https://doi.org/10.1371/journal.pone.0091401 (2014).
28. Tarnowska, E. et al. Spatial distribution of the Carpathian and Eastern mtDNA lineages of the bank vole in their contact zone
relates to environmental conditions. Biol. J. Linn. Soc. https://doi.org/10.1111/bij.12764 (2016).
29. Korbut, Z., Rusin, M., Neumann, K. & Banaszek, A. Filling the gap: the common hamster, Cricetus cricetus, phylogeography: A
case study of Ukraine as potential refugial area. Folia Zool. 68, 48–58. https://doi.org/10.25225/fozo.068.2019 (2019).
30. Niedziałkowska, M. Phylogeography of European moose (Alces alces) based on contemporary mtDNA data and archaeological
records. Mamm. Biol. 84, 35–43. https://doi.org/10.1016/j.mambio.2017.01.004 (2017).
31. Maselli, V. et al. Southern Italian wild boar population, hotspot of genetic diversity. Hystrix 27, 137–144. https://doi.org/10.4404/
hystrix-27.2-11489 (2016).
32. Niedziałkowska, M. et al. Molecular biogeography of red deer Cervus elaphus from eastern Europe: Insights from mitochondrial
DNA sequences. Acta Theriol. 56, 1–12. https://doi.org/10.1007/s13364-010-0002-0 (2011).
33. Niedzialkowska, M. et al. Spatial structure in European moose (Alces alces): Genetic data reveal a complex population history. J.
Biogeogr. 41, 2173–2184. https://doi.org/10.1111/jbi.12362 (2014).
34. Stojak, J. & Tarnowska, E. Polish suture zone as the goblet of truth in post-glacial history of mammals in Europe. Mamm. Res. 64,
463–475. https://doi.org/10.1007/s13364-019-00433-6 (2019).
35. Sommer, R. S. & Nadachowski, A. Glacial refugia of mammals in Europe: evidence from fossil records. Mamm. Rev. 36, 251–265
(2006).
36. Vilaça, S. T. et al. Mitochondrial phylogeography of the European wild boar: the effect of climate on genetic diversity and spatial
lineage sorting across Europe. J. Biogeogr. 41, 987–998. https://doi.org/10.1111/jbi.12268 (2014).
37. Markova, A. et al. Evolution of European Ecosystems during Pleistocene–Holocene Transition (24–8 Kyr BP). (2008).
38. Niedziałkowska, M. et al. Winter temperature and forest cover have shaped red deer distribution in Europe and the Ural Mountains
since the Late Pleistocene. J. Biogeogr. https://doi.org/10.1111/jbi.13989 (2020).
39. Hewitt, G. M. Post-glacial re-colonization of European biota. Biol. J. Lin. Soc. 68, 87–112. https://doi.org/10.1006/bijl.1999.0332
(1999).
40. Evin, A. et al. Unravelling the complexity of domestication: A case study using morphometrics and ancient DNA analyses of
archaeological pigs from Romania. Philos. Trans. R. Soc. B 370, 20130616 (2015).
41. Skog, A. et al. Phylogeography of red deer (Cervus elaphus) in Europe. J. Biogeogr. 36, 66–77. https://doi.org/10.1111/j.1365-2699.
2008.01986.x (2009).
42. Meiri, M. et al. Late-glacial recolonization and phylogeography of European red deer (Cervus elaphus L.). Mol. Ecol. 22, 4711–4722.
https://doi.org/10.1111/mec.12420 (2013).
43. Doan, K. et al. The history of Crimean red deer population and Cervus phylogeography in Eurasia. Zool. J. Linn. Soc. 183, 208–225.
https://doi.org/10.1093/zoolinnean/zlx065 (2018).
44. Kijas, J. M. H. & Andersson, L. A phylogenetic study of the origin of the domestic pig estimated from the near-complete mtDNA
genome. J. Mol. Evol. 52, 302–308. https://doi.org/10.1007/s002390010158 (2001).
45. Jiang, Y. N. et al. Interpopulation and intrapopulation maternal lineage genetics of the Lanyu pig (Sus scrofa) by analysis of mito-
chondrial cytochrome b and control region sequences1. J. Anim. Sci. 86, 2461–2470. https://d oi.o
rg/1 0.2 527/j as.2 007-0 049 (2008).
46. Ronquist, F. & Huelsenbeck, J. P. MrBayes 3: Bayesian phylogenetic inference under mixed models. Bioinformatics 19, 1572–1574.
https://doi.org/10.1093/bioinformatics/btg180 (2003).
Scientific Reports | (2021) 11:9680 | https://doi.org/10.1038/s41598-021-88991-1 13
Vol.:(0123456789)www.nature.com/scientificreports/
47. Kumar, S., Stecher, G. & Tamura, K. MEGA7: Molecular evolutionary genetics analysis version 7.0 for bigger datasets. Mol. Biol.
Evol. 33, 1870–1874. https://doi.org/10.1093/molbev/msw054 (2016).
48. Li, H. et al. The sequence alignment/map format and SAMtools. Bioinformatics 25, 2078–2079. https://d oi.o
rg/1 0.1 093/b
ioinf orma
tics/btp352 (2009).
49. French, N. et al. Evolution of Campylobacter species in New Zealand. In Campylobacter Ecology and Evolution (eds Sheppard, S.
K. & Méric, G.) 221–240 (Caister Academic Press, 2014).
50. Rozas, J. et al. DnaSP 6: DNA sequence polymorphism analysis of large data sets. Mol. Biol. Evol. 34, 3299–3302. https://doi.org/
10.1093/molbev/msx248 (2017).
51. Levins, R. Evolution in Changing Environments (Princeton University Press, 1968).
52. Excoffier, L. & Lischer, H. E. L. Arlequin suite ver 3.5: a new series of programs to perform population genetics analyses under
Linux and Windows. Mol. Ecol. Resour. 10, 564–567. https://doi.org/10.1111/j.1755-0998.2010.02847.x (2010).
53. Guillot, G., Estoup, A., Mortier, F. & Cosson, J. F. A spatial statistical model for landscape genetics. Genetics 170, 1261–1280. https://
doi.org/10.1534/genetics.104.033803 (2005).
54. Guillot, G. I. L. L., Mortier, F. R. E. D. & Estoup, A. R. N. A. Geneland: A computer package for landscape genetics. Mol. Ecol. Notes
5, 712–715 (2005).
55. Guillot, G. Inference of structure in subdivided populations at low levels of genetic differentiation: The correlated allele frequencies
model revisited. Bioinformatics 24, 2222–2228. https://doi.org/10.1093/bioinformatics/btn419 (2008).
56. Guillot, G., Santos, F. & Estoup, A. Analysing georeferenced population genetics data with Geneland: A new algorithm to deal with
null alleles and a friendly graphical user interface. Bioinformatics 24, 1406–1407. https://doi.org/10.1093/bioinformatics/btn136
(2008).
57. Guillot, G. & Santos, F. Using AFLP markers and the Geneland program for the inference of population genetic structure. Mol.
Ecol. Resour. 10, 1082–1084. https://doi.org/10.1111/j.1755-0998.2010.02864.x (2010).
58. Guedj, B. & Guillot, G. Estimating the location and shape of hybrid zones. Mol. Ecol. Resour. 11, 1119–1123. https://doi.org/10.
1111/j.1755-0998.2011.03045.x (2011).
Acknowledgements
The study were financed by the National Science Centre, Poland (grant no. 2013/09/B/NZ8/03284) and the budget
of the Mammal Research Institute Polish Academy of Sciences in Białowieża. We thank Kamila Plis, Igor Dyky,
Vadim E. Sidorovich and personel of the Polish State Forests and hunters for their help in collection of the wild
boar samples for this study. We would like to thank Ms. Aneta Jakubowska, Ewa Lewandowska and Mariola
Mrozek for their excellent technical assistance.
Author contributions
M.W., M.N., B.J. and T. G. conceived the ideas and applied for the financial support; J.L., A.R., I.R. conducted
the laboratory analyses, E.T. conducted the statistical analyses and prepared all figures and tables, T.P., Sz.K.,
A.N.B., G.D. and M.S. provided materials for the study, M.N. and B.J. wrote the main manuscript. All authors
reviewed the manuscript.
Competing interests
The authors declare no competing interests.
Additional information
Supplementary Information The online version contains supplementary material available at https://doi.org/
10.1038/s41598-021-88991-1.
Correspondence and requests for materials should be addressed to M.N.
Reprints and permissions information is available at www.nature.com/reprints.
Publisher’s note Springer Nature remains neutral with regard to jurisdictional claims in published maps and
institutional affiliations.
Open Access This article is licensed under a Creative Commons Attribution 4.0 International
License, which permits use, sharing, adaptation, distribution and reproduction in any medium or
format, as long as you give appropriate credit to the original author(s) and the source, provide a link to the
Creative Commons licence, and indicate if changes were made. The images or other third party material in this
article are included in the article’s Creative Commons licence, unless indicated otherwise in a credit line to the
material. If material is not included in the article’s Creative Commons licence and your intended use is not
permitted by statutory regulation or exceeds the permitted use, you will need to obtain permission directly from
the copyright holder. To view a copy of this licence, visit http://creativecommons.org/licenses/by/4.0/.
© The Author(s) 2021
Scientific Reports | (2021) 11:9680 | https://doi.org/10.1038/s41598-021-88991-1 14
Vol:.(1234567890)You can also read