Impact of Local Stiffness on Entropy Driven Microscopic Dynamics of Polythiophene - Nature
←
→
Page content transcription
If your browser does not render page correctly, please read the page content below
www.nature.com/scientificreports

            OPEN           Impact of Local Stiffness on
                           Entropy Driven Microscopic
                           Dynamics of Polythiophene
                           Sudipta Gupta 1 ✉, Sourav Chatterjee1, Piotr Zolnierczuk2, Evgueni E. Nesterov                         1,3 ✉
                                                                                                                                          &
                           Gerald J. Schneider 1,4 ✉

                           We exploited the high temporal and spatial resolution of neutron spin echo spectroscopy to investigate
                           the large-scale dynamics of semiflexible conjugated polymer chains in solutions. We used a generalized
                           approach of the well-established Zimm model of flexible polymers to describe the relaxation mode
                           spectra of locally stiff polythiophene chains. The Zimm mode analysis confirms the existence of beads
                           with a finite length that corresponds to a reduced number of segmental modes in semiflexible chains.
                           Irrespective of the temperature and the molecular weight of the conjugated polymer, we witness a
                           universal behavior of the local chain stiffness and invariability of the bead length. Our experimental
                           findings indicate possibly minor role of the change in π-electron conjugation length (and therefore
                           conjugated backbone planar to non-planar conformational transition) in the observed thermochromic
                           behavior of polythiophene but instead point on the major role of chain dynamics in this phenomenon.
                           We also obtained the first experimental evidence of an existence of a single-chain glass state in
                           conjugated polymers.

                           Since the pioneering work of Rouse, Zimm, and De Gennes1–3 virtually all of our current understanding of the
                           large-scale dynamics of polymers is based on flexible polymers. However, most biopolymers, like DNA, cellu-
                           lose4,5, and advanced electronic polymers, such as conjugated polymers6, are locally quite stiff. On length-scales
                           shorter than the Kuhn length, the relaxation mode spectra of semiflexible and flexible chains are considerably
                           different. This has a substantial impact on macroscopic properties, such as the response to mechanical, electrical,
                           and optical stimulation as well as on proper functioning of the living cell. A unified approach that self-consistently
                           describes the large-scale chain dynamics for both flexible and semiflexible chains is of paramount importance to
                           understand the microscopic origin of their macroscopic properties. We exploit the high temporal and spatial res-
                           olution of neutron spin echo (NSE) spectroscopy to identify a unique set of physical parameters that can quantify
                           the impact of the chain stiffness on the large-scale polymer dynamics.
                               In case of flexible polymers at the length-scale larger than monomer size, the chemical details become less
                           important and the statistical nature of the chain gives rise to the conformational entropic forces. The large-scale
                           dynamics of the polymer is driven by the balance between thermal fluctuations and the entropy-driven restoring
                           forces. Such forces are responsible for the rubber elasticity7–11. The force constant is inherently connected to the
                           flexibility of the chain. In semiflexible polymers, a finite damping slows down the relaxation towards achieving
                           thermodynamic equilibrium. The finite rigidity of the chains is responsible for nonaffine rubber elasticity in
                           cross-linked polymer networks12 and shear-induced banding in polymeric liquids13.
                               Depending on the solvent quality and temperature, long flexible polymers in dilute solution can assume a
                           swollen coil, a Gaussian chain, or collapse to a globule conformation. On the contrary, semiflexible polymers
                           can exhibit random coil to rod-like conformations. In dilute solutions, the long-range hydrodynamic interaction
                           imparted by the solvent molecules reduces frictional resistance resulting in faster chain dynamics. The inherent
                           stiffness reduces the segmental mobility and can lead to a partially frozen or glassy state. De Gennes suggested
                           that this affects the mode spectrum of single chains14. Recently, NSE spectroscopy experiments on semiflexi-
                           ble polymer chains suggested the existence of such single chain glassy (SCG) states15,16. The organic polymeric

                           1
                             Department of Chemistry, Louisiana State University, Baton Rouge, LA, 70803, USA. 2Jülich Centre for Neutron
                           science (JCNS) and outstation at SNS, POB 2008, 1 Bethel Valley Road, TN, 37831, Oak Ridge, USA. 3Department
                           of Chemistry and Biochemistry, Northern Illinois University, DeKalb, IL, 60115, USA. 4Department of Physics and
                           Astronomy, Louisiana State University, Baton Rouge, LA, 70803, USA. ✉e-mail: g.sudipta26@gmail.com; een@
                           niu.edu; gjschneider@lsu.edu

Scientific Reports |   (2020) 10:9966 | https://doi.org/10.1038/s41598-020-66354-6                                                             1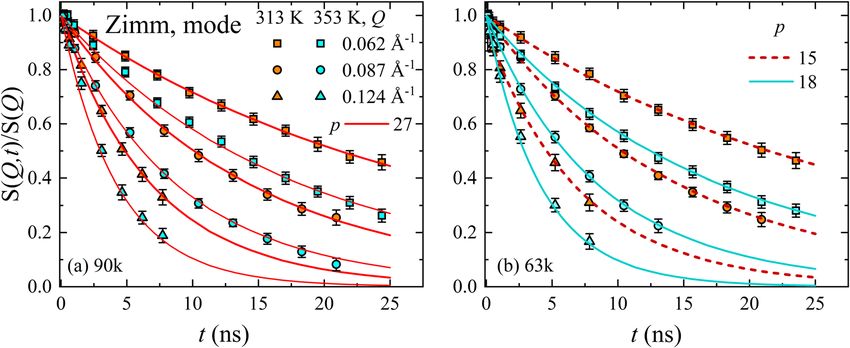
www.nature.com/scientificreports/ www.nature.com/scientificreports
P3HT Dz × 10−2
Label Mn (kg/mol) PDI = Mw/Mn T (K) Rg (nm) Ree (nm) (nm2 ns−1) τz (ns) p pmin α Rrigid (nm)
63k 63.1 1.51 313 15 ± 1 37 ± 2 2.36 4125 15 ± 1 60 0.030 ± 0.007 4.77 ± 0.09
63k 63.1 1.51 353 17 ± 1 41 ± 3 3.43 3195 18 ± 2 75 0.022 ± 0.003 4.72 ± 0.05
90k 89.7 1.54 313 19 ± 1 48 ± 2 1.67 8884 27 ± 2 100 0.013 ± 0.006 4.77 ± 0.07
90k 89.7 1.54 353 21 ± 1 50 ± 3 2.70 5998 27 ± 3 120 0.008 ± 0.001 4.60 ± 0.13
Table 1. Sample labels, molecular weight Mn, polydispersity Mw/Mn (determined by 1H NMR and GPC),
radius of gyration Rg (determined from SANS). The chain end-to-end distance, Ree, Zimm diffusion, DZ, and
the Zimm time, τz, are calculated. The Zimm modes, p, the estimated number of modes, pmin, above which the
NSE relaxation spectra is independent of p, the stiffness parameter, α, and the dynamic rigid length, Rrigid, as
obtained from NSE experiments.
semiconductors represent a unique class, in which the delocalized π-electrons essentially govern the chain stiff-
ness and the macroscopic optoelectronic properties17–21. At the same time, chemical defects22 and dynamic het-
erogeneity23 in conjugated polymers cause a reduction in conductivity and variation in electronic properties24.
Recent small angle neutron scattering (SANS) studies on poly(3-alkylthiophene)s suggest a close relationship
between the polymer conformation and its optoelectronic characteristics, such as those related to thermochro-
mism phenomenon25,26. Still understanding the role of dynamics of conjugated polymer chain on its electronic
and optical characteristics remains elusive.
In this work, we report a comprehensive study of the temperature-dependent single chain conformation and
dynamics of regioregular poly(3-hexylthiophene) (P3HT) in deuterated 1,2-dichlorobenzene (DCB-D4) solvent
using SANS and NSE. P3HT was chosen as a well-studied representative of conjugated polymers that has proven
to be an archetypal material for electronic and optoelectronic applications, and is often used to understand
properties of conjugated polymers in general27–29. The materials and the systems are described in the methods,
together with the theoretical and experimental techniques applied to the analysis of the results. The obtained
dynamic data are interpreted in terms of the static structural properties derived by complimentary SANS experi-
ments. An extensive discussion is presented followed by a summary, where we draw our conclusions.
Results
We carried out experiments on two P3HT samples of different number averaged molecular weights (Mn 63.1 kg/
mol and 89.7 kg/mol), which had close to 100% regioregularity (Table 1). Experiments were conducted at elevated
temperatures and a low concentration (φ = 0.75%) to reduce inter-chain aggregation30.
Polymer synthesis. P3HT samples were prepared using controlled Kumada catalyst-transfer polymeriza-
tion following the procedure described in ref. 31. The preparation was carried out using an external catalytic
initiator prepared via the reaction of 5-bromo-2,2′-bithiophene and bis[1,3-bis(diphenylphosphino)propane]
nickel(0), and the polymer samples with different molecular weights were obtained through the variation of the
ratio between the external catalytic initiator and 5-bromo-4-hexyl-2-thienylmagnesium chloride monomer. The
polymers were additionally purified using Soxhlet extraction, with successive extraction with methanol, hexane,
and CHCl3. Determination of Mn and polydispersity index (PDI) was carried out with GPC, and regioregularity
of the P3HT samples was determined using 1H NMR spectroscopy (Fig. 1) as described in ref.31.
In order to minimize aggregation or chains folding upon themselves owning to their strong intramolecular
π-π stacking interactions30, solutions of P3HT in DCB-D4 were prepared via heating and stirring P3HT samples
with the solvent at 70 °C overnight. In every neutron scattering experiment, the samples were equilibrated at con-
stant temperature for 30 mins in a tumbler before measurements were performed.
Theoretical description. Our theoretical approach is based on detailed analysis of the spectrum of relax-
ation modes to account for the entropic forces and hydrodynamic interactions of polymer in solutions. NSE
spectroscopy measures the normalized dynamic structure factor, S(Q, t)/S(Q), as a function of Fourier time, t
at a given momentum transfer, Q. At the intermediate length scale, the center of mass diffusion and segmental
relaxation of a polymer melt is well described by the Rouse model. The molecular motion originates from the
balance between entropic and frictional forces caused by the surrounding heat bath and is best described by its
spectrum of relaxation modes32. For polymers in solution, the hydrodynamic interactions become important, and
the dynamic structure factor can be formulated within the framework of the Zimm model1:
Schain(Q , t ) =
1
N
1
{
exp[ −Q 2DZ t] ∑ exp − n − m 2ν Q 2 2 ×
n ,m 6 }
2 Ree2 Q 2 pπm pπn tp3ν
exp
1 −
−
3 π 2 ∑ p2ν + 1
cos
N
cos
N
1 − exp
τz
p
(1)
Here n, m are the polymer segment numbers where the summation runs over the total number of monomer
segments, N. The statistical segment length is given by ℓ and is obtained from 2 . The first part in Eq. 1
Ree = 2N 2ν
αD kBT
describes the Zimm center of mass diffusion with a diffusion coefficient DZ = , here, ηs is the solvent viscos-
(ηsR ee)
Scientific Reports | (2020) 10:9966 | https://doi.org/10.1038/s41598-020-66354-6 2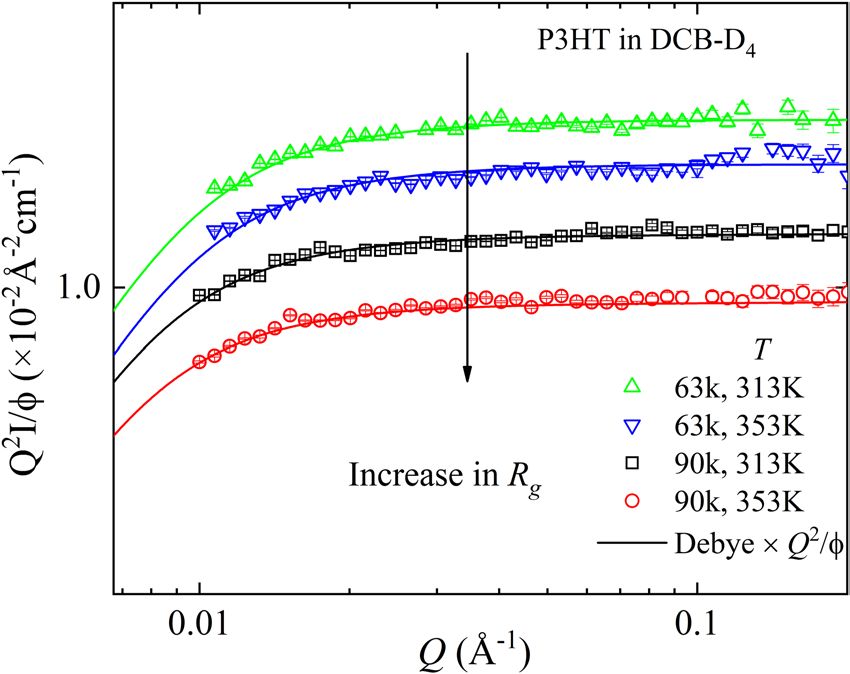
www.nature.com/scientificreports/                                                              www.nature.com/scientificreports

                           Figure 1. Representative 1H NMR spectrum of P3HT (63.1 kg/mol) in CDCl3.

                           Figure 2. Kratky plots for P3HT of two different molecular weights and temperatures in DCB-D4, determined
                           from SANS. The data are normalized by their volume fraction, φ. The lines represent the fit with Debye model.
                           The original intensity data can be found in the SI.

                           ity. The constant pre-factor, αD = 0.196 (Θ-solvent) and αD = 0.203 (good solvent)33. Schain(Q) represents the static
                           structure factor of the chain. The third term represents the more local dynamics, including rotational diffusion (p
                           = 1). It is represented by a sum over relaxation modes of the polymer chain with mode number, p, and character-
                           istic time τp = τZp−3ν . The corresponding Zimm segmental relaxation time is given by τZ = 0.325ηsRee3 /(kBT )33,
                           with ηs being the solvent viscosity at a thermal energy kBT , where kB is the Boltzmann constant.

                           Chain conformation.          We determined the unperturbed chain dimensions by SANS experiments. The scat-
                           tering data, intensity vs. momentum transfer, Q, can be found in the SI. In these data, we see a typical form factor
                           of an aggregated polymer. The Flory exponent and the radius of gyration, Rg, can be conveniently extracted from
                           the Kratky plot, as illustrated in Fig. 2. For the sake of clarity we omitted the intensity values at low Q34. Fig. 2
                           displays Kratky plots for the two polymers with two different molecular weights at two temperatures in DCB-D4
                           solutions. The plateau at intermediate momentum transfer, Q, is a signature of a Gaussian coil and indicates a
                           scaling relationship I ~ Q−1/ν= Q−2 34. For a Θ-solvent, the Flory exponent, ν = ½, and for a good solvent, ν =
                                                                                                                        2
                           0.588. Thus, SANS data verify random coils in a Θ-solvent. A fit with the Debye function: 2 [u − 1 + exp( −u)],
                                                                                                                       ( u)
                           with u = Q 2Rg 2, shows an increasing radius of gyration, Rg, or chain end-to-end distance, Ree = √6Rg , with
                           increasing molecular weight and a slight variation with temperature (Table 1). Slight deviations of the fit at high
                           Q are due to the incoherent background scattering that increases the noise level, but does not change our results
                           on Rg. Since, Rg2 ∝ Mn, which is valid within experimental accuracy as shown in Table 1. This result is in favor of
                           our assumption of Gaussian statistics of the chain with stiff segments, where we observed an increase of Rg with
                           temperature by 10 to 15%.

Scientific Reports |   (2020) 10:9966 | https://doi.org/10.1038/s41598-020-66354-6                                                            3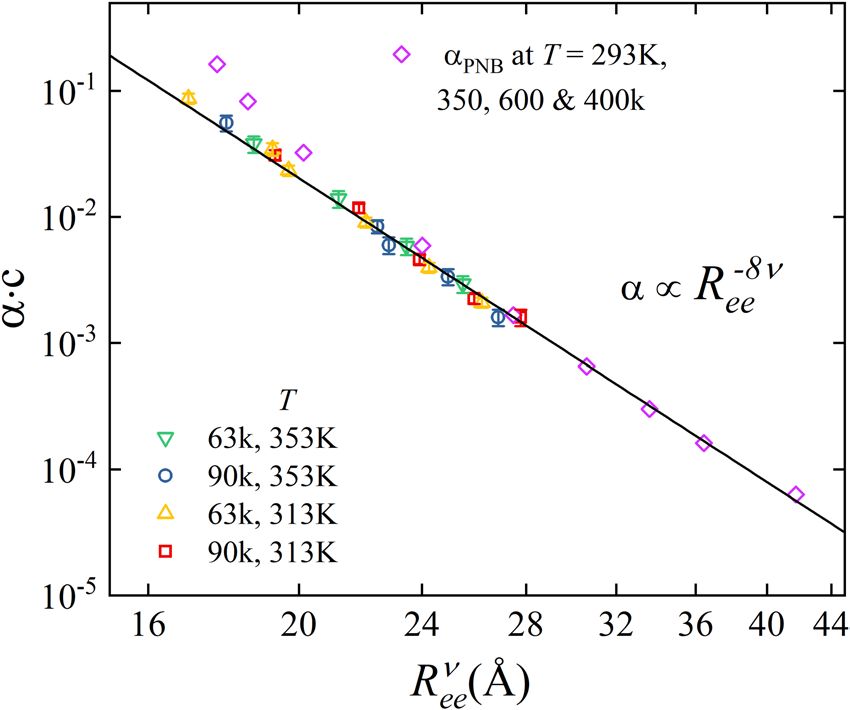
www.nature.com/scientificreports/ www.nature.com/scientificreports
Figure 3. Normalized dynamic structure factor, S(Q , t )/S(Q), as a function of Fourier time, t, for P3HT samples
with different Mn = 90 (top) and 63 kg/mol (bottom) and T = 313 K (red) and 353 K (cyan), respectively. The
momentum transfer, Q, is given by, ◻ = 0.062 Å−1, ⚪ = 0.087 Å−1 and ▵ = 0.124 Å−1. The solid and dashed
lines in (a,b) represent the summation over finite number of Zimm modes, p.
Chain dynamics. Figure 3 illustrates S(Q, t )/S(Q) obtained by NSE experiments over a Q-range from 0.062
to 0.124 Å−1, for P3HT of two different molecular weights, at 313 K and 353 K.
First, we assumed a rigid polymer model and calculated DZ and τZ from the solvent viscosity ηs , and the chain
end-to-end distance Ree as obtained independently from SANS (Table 1). As can be seen, this model does not
suffice to describe the measured data (cf. SI). The much faster decay of our experimental data indicates a substan-
tial contribution of another relaxation mechanism.
In a next step, we considered P3HT in solution as a rigid worm like chain as proposed by McCulloch et al.25,
which requires to add the rotational diffusion (p = 1). The comparison with the experimental data shows that
this is still not sufficient (cf. SI). Hence, we improve the model by considering a polymer coil with mobile seg-
ments, that requires to include the segmental relaxation (p > 1). We obtained an accurate description of S(Q,t)
by adding only a finite number of modes, p = 2, …, P, cf. Figure 3a,b. The number of modes needed to describe
the data is surprisingly low, with p ranging from 15 to 27. Within the experimental accuracy, the p is temperature
independent but changes with Mn. This observation is expected because the number of modes is proportional to
the number of repeating units in the polymer chain35. The corresponding analysis protocol for different modes is
presented in the SI.
The parameter, p, represents the number of modes necessary to describe the experimental dynamic structure
factor S(Q , t )/S(Q) at different temperatures and molecular weights simultaneously for all Q’s. We would like to
emphasize that this theoretical description of the experimental NSE data involves no free parameter, except p.
Discussions
Limiting the analysis to finite number of modes P ignores a substantial part of the mode spectrum and seems to
be unjustified. On the other hand, the increased stiffness caused by the delocalized π-electron system in P3HT
introduces a finite correlation length (dynamic equivalent to the static Kuhn segment), which can be taken into
account by adding a fourth-order term, p2 + αp4, to the entropic spring constant (k = 3kBT / 2 ∝ p−2), with the
dynamic stiffness parameter α15,36,37. The modified Zimm scattering model is obtained by replacing the mode
dependence, p3v, of τz (in Eq. 1) by p3ν + αp4 −ν and the corresponding cosine amplitude, p2ν+1, which evolves as
p2ν+1 + αp415. Unlike limiting the number of modes, we now exploit the fact that by increasing the momentum
transfer Q, the dynamic structure becomes more sensitive to higher modes. In addition, for a given Q, the calcu-
lated S(Q,t)/S(Q) becomes independent of p, beyond a certain threshold (p > pmin). This uses the fact that 2π/Q
probes a certain finite length, which limits the number of modes required to describe the experimental data the-
oretically. As a consequence, the spatial resolution is only determined by the Q dependence of S(Q, t) but not
affected by the maximum Q.
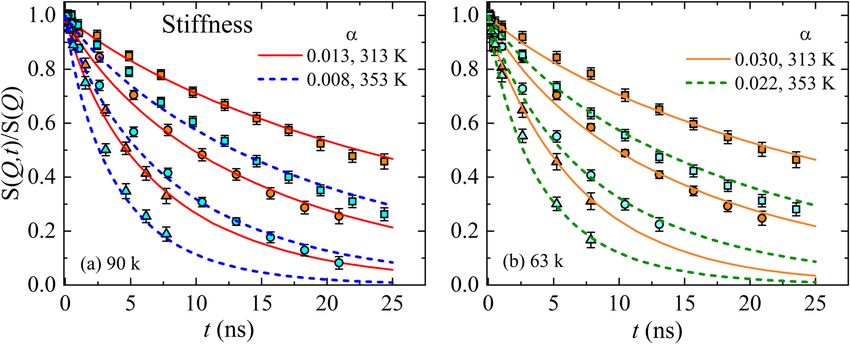
The solid lines in Fig. 4a,b compare the result of our analysis with the experimental dynamical structure fac-
tor. We can accurately describe our experimental data by simultaneously fitting all the Q’s. From this analysis, we
obtain the stiffness parameter α, that decreases with increasing molecular weight and/or temperature, cf. Table 1.
Based on this result, we can now estimate the minimum number of modes, pmin, that are required to theoreti-
cally describe the experimental S(Q, t), within the Q range of our NSE experiments, by solving
S(Q , t , α = 0, N = pmin ) = S(Q , t , α , N = N∞). To calculate the mode independent parameter α, above the
threshold, p > pmin, we summed over p = 1… 1000. We obtain considerably greater pmin than earlier determined p
values. This pmin is the maximum mode numbers which are visible in our experiment.
If we compare the quality of the fits based on the stiffness parameter (Fig. 4) with those calculated assuming a
low number of modes (Fig. 3), we observe a similarly good description irrespective of their physical origins. The
description of the relaxation of a chain by its mode spectrum assumes a certain number of statistically independ-
ent segments, connected by entropic springs. Numerous experiments justified the assumption of an infinite
Scientific Reports | (2020) 10:9966 | https://doi.org/10.1038/s41598-020-66354-6 4www.nature.com/scientificreports/ www.nature.com/scientificreports
Figure 4. Normalized dynamic structure factor, S(Q , t )/S(Q), as a function of Fourier time, t, for P3HT samples
with different molecular weight (a) Mn = 90, and (b) 63 kg/mol. Each figure includes two temperatures,
T = 313 K (solid) and 353 K (dash). The momentum transfer, Q, is given by, ◻ = 0.062 Å−1, ⚪ = 0.087 Å−1 and
▵ = 0.124 Å−1. The solid and dashed lines in (a,b) represent the best fit summing over a large number of modes,
pmin, and a finite dynamical stiffness, α.
number of modes in case of flexible polymers like poly(ethylene-alt-propylene) or poly(ethylene glycol) (with α
= 0)38,39. In the present case the conjugated polymer P3HT, the increased stiffness caused by the delocalized
π-electron system introduces a finite correlation length, which decreases the number of statistically independent
beads. Thus, the calculation of S(Q , t )/S(Q) using a reduced number of modes is formally equivalent to the calcu-
lation using a stiffness parameter α (cf. Table 1). The absence of higher order modes elucidates the fact that the
chain dynamics is partially frozen. Indeed, this is the first experimental evidence of the existence of single chain
glass (SCG) state in a conjugated polymer. As the highest Q is limited in experiments, S(Q , t ) cannot represent the
entire mode spectrum. However, higher Q values probe more local structures. If the stiffness already impacts the
smaller momentum transfers, it is very likely that the wider angles would not change this discussion. However, we
re-emphasize, if Q-values are reached that start to probe more local dynamics, then additional processes are to be
incorporated in the model40,41. However, in the current situation there was no indication that this is the case with
P3HT.
The comparison of the data with the Zimm model with all modes illustrates that the equivalent flexible poly-
mer relaxes faster. At least two potential reasons can explain why the relaxation appears to be slower: (1) a reduced
number of modes (Fig. 3), or (2) damping of the modes (Fig. 4). Apparently NSE data can be described by a finite
number of modes (no damping). A decay of S(Q , t ) sets in, once modes contribute to the relaxation. Therefore,
fewer modes result in less relaxation and more modes lead to a faster decay of S(Q, t). However, the momentum
transfer corresponds to a certain length-scale, Q = 2 π /d . Therefore, the higher the Q the more local the NSE
experiment is, which implies higher modes. In a simplified wording, moving to the higher Q’s requires more
modes contributing to S(Q , t ). In this context, we exploit the fact that each Q has a maximum number of modes
and increasing the number of modes would not change the calculated S(Q , t ) at this specific Q* and at every
Q < Q*. Obviously, this calculated S(Q , t ) relaxes faster than the experimental data. However, including damping
slows down the decay. Therefore, we have now the opposite description.
This explanation can be rationalized by a simple estimation. For semi-flexible polymers, the number of modes,
pmin in Eq. 1, limits the displacement, cos(pmin πm/N ), over m = N /pmin segments. Therefore, we can estimate a
dynamic rigid length, R rigid. For distances less than R rigid, the segments are correlated. These modes will be absent
in the analysis. Thus, within a bead spring approach R rigid represents the length of a bead. It is given by:
R rigid = (N /pmin )ν = Ree N −ν (N /pmin )ν = Ree pmin
−ν 15
. From Table 1, it is evident that the effects of temperature and
molecular weight are negligible on Rrigid, and we obtain R rigid = 4.72 ± 0.1 nm. From the structural standpoint,
Rrigid could likely be interpreted as the polymer conjugation length. Conjugation length is a length of a planarized
chain segment where π-bonding is maintained over the entire segment, and is a key parameter which determines
electronic and optoelectronic properties of conjugated polymers. Indeed, the value of Rrigid corresponds to a bead
length of approximately 12 thienyl repeating units, that is within the range of polythiophene conjugation length
reported in literature (ranging between 10 and 20 repeating units)42. It needs to be mentioned that the value of
Rrigid determined from the dynamic data is substantially higher than the P3HT persistence length (2.9 ± 0.1 nm)
determined from wormlike chain modeling of static SANS data25, and reflects the fact that π-electron delocaliza-
tion in P3HT extends on essentially longer distances than the geometrical persistence length.
It should be noted that, independently of the observed length scale, we obtained two significant parameters,
namely, finite global stiffness, α and a finite size of the bead, R rigid. The parameter α describes the damping of the
mode relaxation. In the Rouse or Zimm approach, normal coordinates are introduced to solve the Langevin equa-
tion by simple exponential functions. The orthogonality of these normal coordinates follows from the uncorre-
lated random forces. This assumption corresponds to the freely jointed chain model that neglects correlations
between bond vectors. In a good approximation, those finite correlations in a real polymer can be neglected if
Scientific Reports | (2020) 10:9966 | https://doi.org/10.1038/s41598-020-66354-6 5www.nature.com/scientificreports/ www.nature.com/scientificreports
Figure 5. Generalized scaling behavior, α ∝ Ree−8ν , of the polymer stiffness, α, as a function of the chain
dimension, Ree of P3HT samples (two molecular weights and two temperatures) and polynorbornene (PNB)
(three molecular weights from ref. 15). Here α is vertically scaled by a factor c.
greater distances along the chain contour are considered. This leads to the introduction of R rigid and similarly to
α.
In order to investigate the scaling behavior between the chain end-to-end distance and the dynamical chain
stiffness α, we systematically varied Ree from low to high values. As shown in Fig. 5, we have used five different
linearly spaced values above and below the experimentally obtained Ree. This was done for both temperatures and
polymer molecular weights. This reveals the dependence of α on the chain length. In addition to our results on
P3HT, we have included the stiffness parameter αPNB of polynorbornene (PNB) of different molecular weights in
a good solvent15. For a better comparison, we rescaled αPNB by a factor ~ 7. Irrespective of the polymer, molecular
weight and temperature, we observe a generic power-law scaling, α ∝ Ree−8ν . As a consequence, the molecular
weight dependence of α is attributed to the increase in Gaussian coil dimension, Ree by a factor ~ 1.26.
We now want to explore how our findings based on the analysis of polymer dynamics, can be translated to
macroscopic materials properties of conjugated polymers. As a special important case, we consider the correla-
tion between the large-scale chain dynamics and thermochromism. Polythiophene shows a distinct thermochro-
mic behavior both in solution and in solid state, as the polymer electronic absorption band undergoes reversible
hypsochromic shift upon temperature increase43.
Let’s sum up some of the essential facts. (i) The radius of gyration depends on the molecular weight as expected
for a Gaussian coil, and increases around 15% with increase in temperature. At the same time, within the Q-range
of our SANS experiments the aggregation is nearly independent of molecular weight or temperature. (ii) The bead
size, R rigid , is independent of molecular weight and temperature. (iii) The stiffness parameter, α, decreases with
increasing temperature and molecular weights. (iv) The absorption spectra of both P3HT samples in DCB-D4 are
independent of the molecular weight but show a thermochromic blue shift and an increase in band gap energy, Eg,
with increasing temperature, cf. Figure 2 in the supplemental information (SI). These spectroscopic results agree
with those found earlier for regioregular P3HT and seem to be common for semiconducting polymers44–48.
As it is widely accepted in the literature, the thermochromic blue shift in the absorption spectra of polythio-
phenes, including P3HT, upon increasing temperature is related to cooperative static conformational twisting (i.e.
planar to non-planar conformational transition) of the π-electron conjugated backbone49–52. From our analysis,
both the conjugation length (as reflected in the value of Rrigid) and our scaling law, α ∝ Ree−8ν , show no depend-
ence on temperature. It elucidates the fact that within the observed temperature range the constant bead size
excludes a correlation with the observed changes in the absorption spectra. Also, the static chain end-to-end
distance is not associated with the thermochromic blue-shift. Therefore, our results do not support static intra-
molecular conformational twisting of the π-conjugated backbone, and thus reduction of the conjugation length
as a key factor in the observed thermochromic behavior.
The SANS data in Fig. 2 cannot access the bead size since R rigid = 4.7 ± 0.1 nm corresponds to Q = 2π /R rigid
= 0.13 Å−1, which is at the upper Q-limit of the SANS experiment. As the competition between coherent and
incoherent scattering may contribute in this region, we abstain from the discussion of weak effects, which may not
be related to the structure. Therefore, it impossible to see a structural peak. However, our SANS data at low Q
indicate significant aggregation of P3HT (cf. SI) even at higher temperature, we should suggest that
temperature-affected changes in the interchain aggregation may be responsible for the thermochromic blue-shift
at the higher temperature. This finding emphasizes the unique role of the large-scale dynamics in understanding
the fundamental physics of locally stiff polymers and deriving correlations between the chain stiffness and the
macroscopic material properties, which has not been explored in the literature so far. We should emphasize that
our findings derived from P3HT behavior in dilute solution have been only studied for the narrow temperature
range (313 to 353 K). They may not be directly applied to thermochromism in solid state. Nevertheless, they do
Scientific Reports | (2020) 10:9966 | https://doi.org/10.1038/s41598-020-66354-6 6www.nature.com/scientificreports/ www.nature.com/scientificreports
agree with recent conclusions about rather complicated nature of thermochromic phenomenon in conjugated
polymers where multiple contributing factors are responsible for the observed spectroscopic changes53.
Summary
To conclude, we showed that conjugated polymers such as P3HT are ideally suited to understand the impact of
locally stiff segments on the large-scale chain dynamics by SANS and NSE studies. This is the first experimental
demonstration of single chain glassy state in conjugated polymers. We generalize the well-established Zimm
model approach of flexible polymers and successfully describe the relaxation mode spectra of locally stiff chains.
Only one parameter, the damping constant α, is sufficient to represent the full mode spectrum of both flexible and
semiflexible chains. The increase in stiffness is reflected by a bead element R rigid of increased size, in concert with
a reduction of the number of modes pmin. We derived a renormalized stiffness α from the generic scaling of the
stiffness α ∝ Ree−8ν , and the molecular weight. Irrespective of the temperature, the band gap energy, and the
molecular weight of the conjugated polymer, we obtain a universal behavior of the local chain stiffness. Our find-
ings impressively confirm that the so-called local stiffness is the only controlling parameter to describe the dissi-
pation of the entropic forces in large-scale polymer dynamics. As related to macroscopic materials properties, our
results show a rather minor role of the conjugated backbone conformational twisting (planar to non-planar
single-chain conformational transition leading to decrease in conjugation length) in the thermochromic behavior
of P3HT, and indicate that interchain phenomena (such as change in interchain aggregation) and chain dynamics
are likely responsible for the thermochromic phenomenon. We hypothesize that our findings may also be appli-
cable for understanding of other related phenomena such as solvatochromic behavior of conjugated polymers
where interplay of complex pathways has been recently shown to affect observed spectroscopic changes26. In this
way, our findings open up new frontiers for understanding the macroscopic properties like viscoelastic and opto-
electronic response for material processing as well as macromolecular crowding associated with the biological
functioning of living organisms.
Methods
Sample preparation. All reactions toward P3HT preparation were performed under an atmosphere of dry
nitrogen, unless mentioned otherwise. Tetrahydrofuran (THF) for polymerization was dried by passing through
activated alumina using a PS-400 Solvent Purification System from Innovative Technology, Inc. The water con-
tent of THF was periodically controlled by Karl Fischer titration, using a DL32 coulometric titrator from Mettler
Toledo. Isopropylmagnesium chloride (2.0 M solution in THF) was purchased from Acros Organics. All other
reagents and solvents were obtained from Sigma Aldrich and Alfa Aesar and used without further purification.
Deuterated solvents (chloroform-D and 1,2-dichlorobenzene-D4 (DCB-D4)) were purchased from Cambridge
Isotope Laboratories. Determination of the polymer Mn and polydispersity index (PDI) was carried out with
GPC (using Agilent 1100 chromatograph equipped with two PLgel 5 μm MIXED-C and one PLgel 5 μm 1000 Å
columns connected in series, using THF as a mobile phase) calibrated against polystyrene standards
Small angle neutron scattering (SANS) measurements. SANS experiments were performed at the
GP-SANS in High Flux Isotope Reactor (HFIR) at Oak Ridge National Laboratory (ORNL)54. All the samples
were measured in a standard 1 mm Hellma Banjo cells. The sample-to-detector distance d and the neutron wave-
length λ were kept at d = 19.2 m for λ = 12 Å; d = 8.8 m for λ = 4.75 Å and d = 1.1 m for λ = 4.75 Å. This config-
uration covers a Q - range from ~ 0.005 Å–1 to ~ 0.23 Å–1, where the momentum transfer, Q = 4πsin(θ /2)/λ , for
the scattering angle θ. A wavelength resolution of Δλ/λ = 15% was used. All data reduction into intensity I (Q) vs.
→
momentum transfer Q = Q was carried out following the standard procedures that are implemented in the
SPICE SANS reduction package for the Igor software. The data scaling into absolute units (cm–1), and the detector
sensitivity correction was done with a porous silica standard measurement. The solvents and empty cell were
measured separately as backgrounds and were subtracted.
Neutron spin echo (NSE) measurements. NSE spectroscopy was performed at the Spallation Neutron
Source (SNS), ORNL, using the SNS-NSE spectrometer at BL-1555. We detect the normalized dynamic structure
factor representing the sum of coherent Scoh and incoherent Sinc scattering. The coherent signal dominates56–59, i.e.,
1
S (Q , t ) σcohScoh(Q , t ) − 3 σincSinc (Q , t ) S (Q , t )
= 1
≈ coh
S ( Q) σcohScoh(Q) − 3 σincSinc (Q) Scoh(Q) (2)
here, σcoh and σinc are the coherent and incoherent scattering intensities, respectively. For the NSE experiment an
incoming wavelength band, Δλ, from 5 to 8 Å was used with 42 time channels for the time-of-flight data acquisi-
tion. This allowed to access a dynamic range of 2 ps ≤ t ≤ 25 ns over a momentum transfer Q = 0.062–0.124 Å−1.
For the measured coherent NSE data, corrections were performed using resolution data from Al2O3, sample and
background from the DCB-D4 solvent. The background subtraction was performed from the neutron spin-echo
amplitude (A) to spin up-down intensity ratio (Up − Dwn) as described by Monkenbusch et al.60. We used spe-
cially designed two-part Al sample containers sealed with PTFE (PolyTetraFluoroEthylene), attached to a tum-
bler, and maintaining a sample thickness of 4 mm. The data reduction was performed with the standard
ECHODET software package of the SNS-NSE instrument. The incoherent and coherent contributions were deter-
mined by polarization analysis in the diffraction mode of the spectrometer. The elastic incoherent scattering from
the background, including the solvent, the scattering that results from empty cell, sample environment and
instrument, were subtracted accordingly to obtain the coherent dynamic structure factor. For further details the
reader is referred to refs.56,60.
Scientific Reports | (2020) 10:9966 | https://doi.org/10.1038/s41598-020-66354-6 7www.nature.com/scientificreports/ www.nature.com/scientificreports
NMR spectroscopy. 1H NMR spectra were recorded at 400 MHz using Bruker AV-400 NMR spectrometer,
and are reported in ppm downfield from tetramethylsilane.
Disclaimer. This report was prepared as an account of work sponsored by an agency of the United States
Government. Neither the United States Government nor any agency thereof, nor any of their employees, makes
any warranty, express or implied, or assumes any legal liability or responsibility for the accuracy, completeness,
or usefulness of any information, apparatus, product, or process disclosed, or represents that its use would not
infringe privately owned rights. Reference herein to any specific commercial product, process, or service by
trade name, trademark, manufacturer, or otherwise does not necessarily constitute or imply its endorsement,
recommendation, or favoring by the United States Government or any agency thereof. The views and opinions of
authors expressed herein do not necessarily state or reflect those of the United States Government or any agency
thereof.
Received: 7 January 2020; Accepted: 19 May 2020;
Published: xx xx xxxx
References
1. Doi, M., Edwards, S. F. The Theory of Polymer Dynamics. Vol. 73 (Oxford University Press, 2007).
2. Wischnewski, A. et al. Molecular observation of contour-length fluctuations limiting topological confinement in polymer melts.
Phys Rev Lett 88, 058301, https://doi.org/10.1103/PhysRevLett.88.058301 (2002).
3. Pyckhout-Hintzen, W. et al. Direct observation of nonaffine tube deformation in strained polymer networks. Phys Rev Lett 110,
196002, https://doi.org/10.1103/PhysRevLett.110.196002 (2013).
4. Hogan, M. E. & Austin, R. H. Importance of DNA stiffness in protein-DNA binding specificity. Nature 329, 263–266, https://doi.
org/10.1038/329263a0 (1987).
5. Lee, W. J., Clancy, A. J., Kontturi, E., Bismarck, A. & Shaffer, M. S. Strong and stiff: high-performance cellulose nanocrystal/
poly(vinyl alcohol) composite fibers. ACS Appl Mater Interfaces 8, 31500–31504, https://doi.org/10.1021/acsami.6b11578 (2016).
6. Burroughes, J. H. et al. Light-emitting diodes based on conjugated polymers. Nature 347, 539–541, https://doi.org/10.1038/347539a0
(1990).
7. Patel, A. J. et al. Relationship between structural and stress relaxation in a block-copolymer melt. Phys Rev Lett 96, 257801, https://
doi.org/10.1103/PhysRevLett.96.257801 (2006).
8. Nusser, K., Schneider, G. J. & Richter, D. Microscopic origin of the terminal relaxation time in polymer nanocomposites: an
experimental precedent. Soft Matter 7, 7988–7991, https://doi.org/10.1039/c1sm05555k (2011).
9. Nusser, K., Schneider, G. J. & Richter, D. Rheology and anomalous flow properties of poly(ethylene-alt-propylene)–silica
nanocomposites. Macromolecules 46, 6263–6272, https://doi.org/10.1021/ma3025927 (2013).
10. Lodge, T. P. Solvent dynamics, local friction, and the viscoelastic properties of polymer solutions. J Phys Chem 97, 1480–1487,
https://doi.org/10.1021/j100110a004 (1993).
11. Sahouani, H. & Lodge, T. P. Onset of excluded-volume effects in chain dynamics. Macromolecules 25, 5632–5642, https://doi.
org/10.1021/ma00047a012 (1992).
12. Heussinger, C., Schaefer, B. & Frey, E. Nonaffine rubber elasticity for stiff polymer networks. Phys Rev E Stat Nonlin Soft Matter Phys
76, 031906, https://doi.org/10.1103/PhysRevE.76.031906 (2007).
13. Fischer, H., Keller, A. & Windle, A. H. The origin of banded textures induced by shear—a suggested scheme and a relevant
rheological effect. J Non-Newton Fluid Mech 67, 241–268, https://doi.org/10.1016/s0377-0257(96)01482-6 (1996).
14. De Gennes, P. G. Scaling Concepts in Polymer Physics. (Cornell University Press, 1979).
15. Monkenbusch, M. et al. Nonflexible coils in solution: A neutron spin-echo investigation of alkyl-substituted polynorbornenes in
tetrahydrofuran. Macromolecules 39, 9473–9479, https://doi.org/10.1021/ma0618979 (2006).
16. Mi, Y., Xue, G. & Lu, X. A new perspective of the glass transition of polymer single-chain nanoglobules. Macromolecules 36,
7560–7566, https://doi.org/10.1021/ma030127j (2003).
17. Petekidis, G., Vlassopoulos, D., Galda, P., Rehahn, M. & Ballauff, M. Determination of chain conformation of stiff polymers by
depolarized Rayleigh scattering in solution. Macromolecules 29, 8948–8953, https://doi.org/10.1021/ma961128x (1996).
18. Choi, J., Ruiz, C. R. & Nesterov, E. E. Temperature-induced control of conformation and conjugation length in water-soluble
fluorescent polythiophenes. Macromolecules 43, 1964–1974, https://doi.org/10.1021/ma902136a (2010).
19. Salaneck, W. R. et al. Thermochromism in poly(3-hexylthiophene) in the solid state: A spectroscopic study of temperature-
dependent conformational defects. J Chem Phys 89, 4613–4619, https://doi.org/10.1063/1.454802 (1988).
20. Brustolin, F., Goldoni, F., Meijer, E. W. & Sommerdijk, N. A. J. M. Highly ordered structures of amphiphilic polythiophenes in
aqueous media. Macromolecules 35, 1054–1059, https://doi.org/10.1021/ma011334r (2002).
21. Iwasaki, K., Fujimoto, H. & Matsuzaki, S. Conformational changes of poly(3-alkylthiophene)s with temperature and pressure. Synth.
Met. 63, 101–108, https://doi.org/10.1016/0379-6779(94)90256-9 (1994).
22. Hu, D. et al. Collapse of stiff conjugated polymers with chemical defects into ordered, cylindrical conformations. Nature 405,
1030–1033, https://doi.org/10.1038/35016520 (2000).
23. Harmandaris, V. A., Kremer, K. & Floudas, G. Dynamic heterogeneity in fully miscible blends of polystyrene with oligostyrene. Phys
Rev Lett 110, 165701, https://doi.org/10.1103/PhysRevLett.110.165701 (2013).
24. Obrzut, J. & Page, K. A. Electrical conductivity and relaxation in poly(3-hexylthiophene). Phys Rev B 80, https://doi.org/10.1103/
PhysRevB.80.195211 (2009).
25. McCulloch, B. et al. Polymer chain shape of poly(3-alkylthiophenes) in solution using small-angle neutron scattering.
Macromolecules 46, 1899–1907, https://doi.org/10.1021/ma302463d (2013).
26. Newbloom, G. M. et al. Solvatochromism and conformational changes in fully dissolved poly(3-alkylthiophene)s. Langmuir 31,
458–468, https://doi.org/10.1021/la503666x (2015).
27. Ludwigs, S. P3HT Revisited - From Molecular Scale to Solar Cell Devices, Advances in Polymer Science. (Springer, Berlin, 2014).
28. Osaka, I. & McCullough, R. D. Advances in molecular design and synthesis of regioregular polythiophenes. Acc. Chem. Res. 41,
1202–1214, https://doi.org/10.1021/ar800130s (2008).
29. Jeffries-El, M. & McCullough, R. D. Regioregular polythiophenes. In: Handbook of Conducting Polymers, Third Edition. Vol. 1 9-1–9-
49 (CRC Press, 2007).
30. Johnston, D. E. et al. Nanostructured surfaces frustrate polymer semiconductor molecular orientation. ACS Nano 8, 243–249,
https://doi.org/10.1021/nn4060539 (2014).
31. Chavez, C. A., Choi, J. & Nesterov, E. E. One-step simple preparation of catalytic initiators for catalyst-transfer kumada
polymerization: synthesis of defectfree polythiophenes. Macromolecules 47, 506–516, https://doi.org/10.1021/ma401959e (2014).
32. Richter, D., Ewen, B., Farago, B. & Wagner, T. Microscopic dynamics and topological constraints in polymer melts: A neutron-spin-
echo study. Phys Rev Lett 62, 2140–2143, https://doi.org/10.1103/PhysRevLett.62.2140 (1989).
Scientific Reports | (2020) 10:9966 | https://doi.org/10.1038/s41598-020-66354-6 8www.nature.com/scientificreports/ www.nature.com/scientificreports
33. Ewen, B. & Richter, D. Neutron spin echo investigations on the segmental dynamics of polymers in melts, networks and solutions.
Adv Polym Sci 134, 1–129, https://doi.org/10.1007/3-540-68449-2_1 (1997).
34. Lindner, P. & Zemb, T. H. Neutron, X-rays and Light: Scattering Methods Applied to Soft Condensed Matter. 1st edn, (Elsevier
Science, 2002).
35. Michael, Rubinstein & Colby, R. H. Polymer Physics. (Oxford University Press, 2003).
36. Richter, D., Monkenbusch, M., Arbe, A. & Colmenero, J. Neutron Spin Echo in Polymer Systems. Adv Polym Sci 174, 1–221, https://
doi.org/10.1007/b106578 (2005).
37. Richter, D. et al. From Rouse dynamics to local relaxation: A neutron spin echo study on polyisobutylene melts. J. Chem Phys 111,
6107–6120, https://doi.org/10.1063/1.479907 (1999).
38. Glomann, T. et al. Microscopic dynamics of polyethylene glycol chains interacting with silica nanoparticles. Phys Rev Lett 110,
178001, https://doi.org/10.1103/PhysRevLett.110.178001 (2013).
39. Schneider, G. J. et al. Anomalous chain diffusion in unentangled model polymer nanocomposites. Soft Matter 9, 4336–4348, https://
doi.org/10.1039/c3sm27886g (2013).
40. Gupta, S. et al. Dynamics of phospholipid membranes beyond thermal undulations. J Phys Chem Lett 9, 2956–2960, https://doi.
org/10.1021/acs.jpclett.8b01008 (2018).
41. Gupta, S. & Schneider, G. J. Modeling the dynamics of phospholipids in the fluid phase of liposomes. Soft Matter 16, 3245–3256,
https://doi.org/10.1039/c9sm02111f (2020).
42. Martin, R. E. & Diederich, F. Linear monodisperse π-conjugated oligomers: model compounds for polymers and more. Angew.
Chem. Int. Ed. 38, 1350–1377, https://doi.org/10.1002/(SICI)1521-3773(19990517)38:103.0.CO;2-6 (1999).
43. Rughooputh, S. D. D. V., Hotta, S., Heeger, A. J. & Wudl, F. Chromism of soluble polythienylenes. J Polym Sci Pol Phys 25, 1071–1078,
https://doi.org/10.1002/polb.1987.090250508 (1987).
44. Bredas, J. L., Silbey, R., Boudreaux, D. S. & Chance, R. R. Chain-length dependence of electronic and electrochemical properties of
conjugated systems: polyacetylene, polyphenylene, polythiophene, and polypyrrole. J. Am. Chem. Soc. 105, 6555–6559, https://doi.
org/10.1021/ja00360a004 (1983).
45. Jenekhe, S. A. A class of narrow-band-gap semiconducting polymers. Nature 322, 345–347, https://doi.org/10.1038/322345a0
(1986).
46. Clark, J., Silva, C., Friend, R. H. & Spano, F. C. Role of intermolecular coupling in the photophysics of disordered organic
semiconductors: aggregate emission in regioregular polythiophene. Phys Rev Lett 98, 206406, https://doi.org/10.1103/
PhysRevLett.98.206406 (2007).
47. Hosaka, N., Tachibana, H., Shiga, N., Matsumoto, M. & Tokura, Y. Photoinduced Phase Transformation in Polythiophene. Phys Rev
Lett 82, 1672–1675, https://doi.org/10.1103/PhysRevLett.82.1672 (1999).
48. Miteva, T., Palmer, L., Kloppenburg, L., Neher, D. & Bunz, U. H. F. Interplay of thermochromicity and liquid crystalline behavior in
poly(pphenyleneethynylene) s: π−π interactions or planarization of the conjugated backbone? Macromolecules 33, 652–654, https://
doi.org/10.1021/ma9912397 (2000).
49. Inganäs, O., Salaneck, W. R., Österholm, J. E. & Laakso, J. Thermochromic and solvatochromic effects in poly(3-hexylthiophene).
Synth. Met. 22, 395–406, https://doi.org/10.1016/0379-6779(88)90110-5 (1988).
50. Roux, C., Bergeron, J.-Y. & Leclerc, M. Thermochromic properties of polythiophenes: structural aspects. Makromol. Chem. 194,
869–877, https://doi.org/10.1002/macp.1993.021940311 (1993).
51. Garreau, S., Leclerc, M., Errien, N. & Louarn, G. Planar-to-nonplanar conformational transition in thermochromic polythiophenes:
A spectroscopic study. Macromolecules 36, 692–697, https://doi.org/10.1021/ma021358d (2003).
52. Faid, K. et al. Chromic phenomena in regioregular and nonregioregular polythiophene Derivatives. Chem. Mater. 7, 1390–1396,
https://doi.org/10.1021/cm00055a018 (1995).
53. Panzer, F., Bassler, H. & Kohler, A. Temperature induced order-disorder transition in solutions of conjugated polymers probed by
optical spectroscopy. J Phys Chem Lett 8, 114–125, https://doi.org/10.1021/acs.jpclett.6b01641 (2017).
54. Berry, K. D. et al. Characterization of the neutron detector upgrade to the GP-SANS and Bio-SANS instruments at HFIR. Nucl
Instrum Meth A 693, 179–185, https://doi.org/10.1016/j.nima.2012.06.052 (2012).
55. Ohl, M. et al. The spin-echo spectrometer at the Spallation Neutron Source (SNS). Nucl Instrum Meth A 696, 85–99, https://doi.
org/10.1016/j.nima.2012.08.059 (2012).
56. Mezei, F., Pappas, C. & Gutberlet, T. Neutron Spin Echo Spectroscopy Basics, Trends and Applications. (Springer-Verlag, 2002).
57. Gupta, S. et al. Effect of adding nanometre-sized heterogeneities on the structural dynamics and the excess wing of a molecular glass
former. Sci. Rep. 6, 35034, https://doi.org/10.1038/srep35034 (2016).
58. Gupta, S., Mamontov, E., Jalarvo, N., Stingaciu, L. & Ohl, M. Characteristic length scales of the secondary relaxations in glass-
forming glycerol. Eur Phys J E Soft Matter 39, 40, https://doi.org/10.1140/epje/i2016-16040-7 (2016).
59. S. Gupta et al. Excess wing in glass-forming glycerol and LiCl-glycerol mixtures detected by neutron scattering. Eur Phys J E Soft
Matter 38 (1), https://doi.org/10.1140/epje/i2015-15001-0 (2015).
60. Monkenbusch, M., Schatzler, R. & Richter, D. The Julich neutron spin-echo spectrometer - Design and performance. Nucl Instrum
Meth A 399, 301–323, https://doi.org/10.1016/S0168-9002(97)00956-X (1997).
Acknowledgements
The neutron scattering work was supported by the U.S. Department of Energy (DOE) under EPSCoR Grant No.
DE-SC0012432 with additional support from the Louisiana Board of Regents. Research conducted at ORNL’s
High Flux Isotope Reactor (HFIR) and at Spallation Neutron Source (SNS) was sponsored by the Scientific User
Facilities Division, Office of Basic Energy Sciences, U.S. Department of Energy (DoE). We thank Lilin He (HFIR),
Marius Hofmann (LSU), Stefan Otto Huber (LSU) and Christopher Van Leeuwen (LSU) for helping with the
scattering experiments.
Author contributions
S.G. performed the NSE and SANS experiments. S.C. and E.E.N. synthesized the samples and performed NMR
and UV/vis experiments. P.Z. helped with the NSE experiments and data reduction. S.G. and G.J.S. analyzed the
NSE data. All authors contributed to discussion of the original idea of this work and writing the manuscript.
Competing interests
The authors declare no competing interests.
Additional information
Supplementary information is available for this paper at https://doi.org/10.1038/s41598-020-66354-6.
Correspondence and requests for materials should be addressed to S.G., E.E.N. or G.J.S.
Scientific Reports | (2020) 10:9966 | https://doi.org/10.1038/s41598-020-66354-6 9www.nature.com/scientificreports/ www.nature.com/scientificreports
Reprints and permissions information is available at www.nature.com/reprints.
Publisher’s note Springer Nature remains neutral with regard to jurisdictional claims in published maps and
institutional affiliations.
Open Access This article is licensed under a Creative Commons Attribution 4.0 International
License, which permits use, sharing, adaptation, distribution and reproduction in any medium or
format, as long as you give appropriate credit to the original author(s) and the source, provide a link to the Cre-
ative Commons license, and indicate if changes were made. The images or other third party material in this
article are included in the article’s Creative Commons license, unless indicated otherwise in a credit line to the
material. If material is not included in the article’s Creative Commons license and your intended use is not per-
mitted by statutory regulation or exceeds the permitted use, you will need to obtain permission directly from the
copyright holder. To view a copy of this license, visit http://creativecommons.org/licenses/by/4.0/.
© The Author(s) 2020
Scientific Reports | (2020) 10:9966 | https://doi.org/10.1038/s41598-020-66354-6 10You can also read