The Maximal Lactate Steady State Workload Determines Individual Swimming Performance
←
→
Page content transcription
If your browser does not render page correctly, please read the page content below
ORIGINAL RESEARCH
                                                                                                                                                published: 26 April 2021
                                                                                                                                       doi: 10.3389/fphys.2021.668123

                                                The Maximal Lactate Steady State
                                                Workload Determines Individual
                                                Swimming Performance
                                                Gernot O. Hering 1* and Jens Stepan 1,2

                                                Department of Sport and Health Science, University of Konstanz, Konstanz, Germany, 2 Department of Obstetrics and
                                                1

                                                Gynaecology, Paracelsus Medical University, Salzburg, Austria

                                                The lactate threshold (LT) and the strongly related maximal lactate steady state workload
                                                (MLSSW) are critical for physical endurance capacity and therefore of major interest in
                                                numerous sports. However, their relevance to individual swimming performance is not
                                                well understood. We used a custom-made visual light pacer for real-time speed modulation
                                                during front crawl to determine the LT and MLSSW in a single-exercise test. When
                                                approaching the LT, we found that minute variations in swimming speed had considerable
                                                effects on blood lactate concentration ([La−]). The LT was characterized by a sudden
                                                increase in [La−], while the MLSSW occurred after a subsequent workload reduction, as
                                                indicated by a rapid cessation of blood lactate accumulation. Determination of the MLSSW
                                                by this so-called “individual lactate threshold” (ILT)-test was highly reproducible and valid
                            Edited by:          in a constant speed test. Mean swimming speed in 800 and 1,500 m competition (S-Comp)
                      Hassane Zouhal,           was 3.4% above MLSSW level and S-Comp, and the difference between S-Comp and
       University of Rennes 2 – Upper
                       Brittany, France
                                                the MLSSW (Δ S-Comp/MLSSW) were higher for long-distance swimmers (800–1,500 m)
                        Reviewed by:
                                                than for short- and middle-distance swimmers (50–400 m). Moreover, Δ S-Comp/MLSSW
                         Carlo Capelli,         varied significantly between subjects and had a strong influence on overall swimming
             University of Verona, Italy        performance. Our results demonstrate that the MLSSW determines individual swimming
                         Claire Tourny,
          Université de Rouen, France           performance, reflects endurance capacity in the sub- to supra-threshold range, and is
                  *Correspondence:              therefore appropriate to adjust training intensity in moderate to severe domains of exercise.
                    Gernot O. Hering
                                                Keywords: lactate threshold, maximal lactate steady state, swimming, performance testing, exercise physiology
       gernot.hering@uni-konstanz.de

                   Specialty section:
         This article was submitted to          INTRODUCTION
                   Exercise Physiology,
               a section of the journal         Changes in physical endurance capacity require precise adaptation of various physiological
               Frontiers in Physiology
                                                processes. The exact knowledge of the exercise associated stimulus/response pattern, and the
        Received: 15 February 2021              availability of reliable and valid diagnostic systems are prerequisites to induce particular
         Accepted: 31 March 2021                homeostatic perturbations and to implement successful training interventions (Fluck and Hoppeler,
           Published: 26 April 2021
                                                2003). Frequency, duration and volume are the major parameters for controlling training load.
                            Citation:           However, selective adjustment of training intensity is the most potent trigger of endurance
 Hering GO and Stepan J (2021) The
                                                capacity specification (Bishop et al., 2019; Jamnick et al., 2020).
       Maximal Lactate Steady State
      Workload Determines Individual
                                                   At some point, a steadily increasing workload (WL) will lead to rapid arterial lactate accumulation.
            Swimming Performance.               This so-called lactate threshold (LT; Brooks, 1985a) is closely related to the maximal lactate
          Front. Physiol. 12:668123.            steady state workload (MLSSW), the highest WL with equilibrium between lactate production
   doi: 10.3389/fphys.2021.668123               and removal and thus constant arterial lactate concentration [La−] (Donovan and Brooks, 1983;

Frontiers in Physiology | www.frontiersin.org                                         1                                            April 2021 | Volume 12 | Article 668123

                                                             Konstanzer Online-Publikations-System (KOPS)
                                                    URL: http://nbn-resolving.de/urn:nbn:de:bsz:352-2-9oikl903b8g79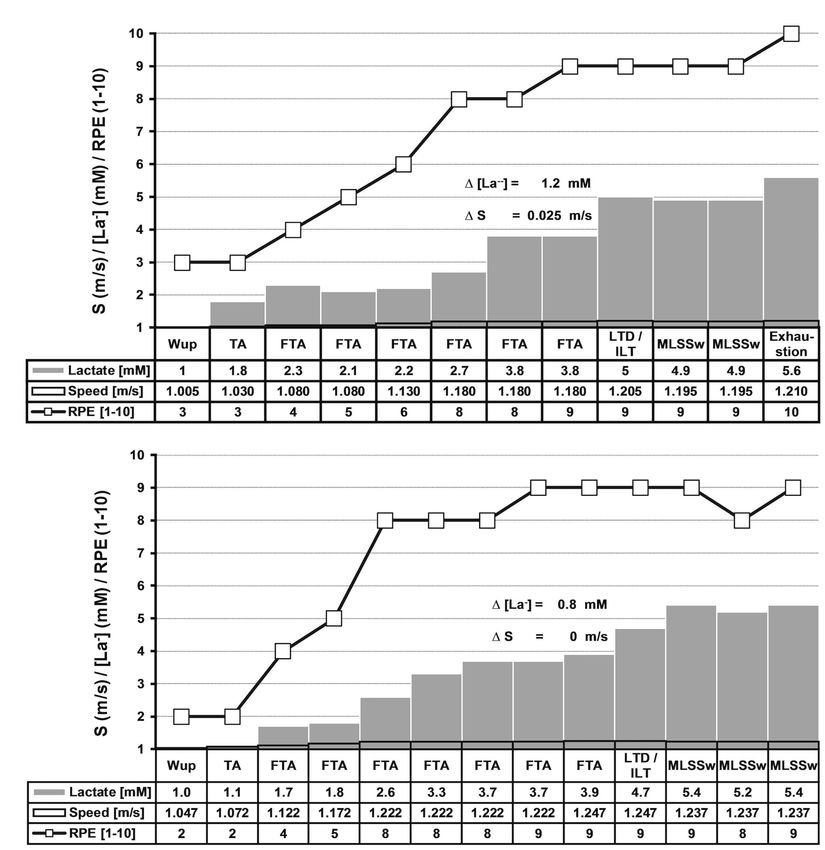
Hering and Stepan                                                                                                                          MLSSw in Swimming

Brooks, 1985a,b; Heck et al., 1985; Stanley et al., 1985). For                       as an important submaximal parameter for the precise adjustment
the following reasons, others and we suggest the MLSSW as a                          of training stimuli in moderate to severe domains of exercise.
major submaximal parameter for individual training intensity
recommendations (Billat et al., 2003; Faude et al., 2009; Hering
et al., 2018; Jamnick et al., 2020): First, the MLSSW is highly                      MATERIALS AND METHODS
reproducible, valid, and objective across endurance sports (Hering
et al., 2018; Jamnick et al., 2020). Second, it has been repeatedly                  Subjects
shown that exercise in the MLSSW range induces key                                   Fifty-five single-exercise swimming tests [50 amateur athletes
neuromuscular and metabolic adaptations (Bergman et al., 1999;                       with regular participation in competitions up to national
Dubouchaud et al., 2000; Messonnier et al., 2013;                                    championships aged 11–32 years (19 ± 0.74 years, 27 females)]
Figueiredo et al., 2014; de Araujo et al., 2015; Hering et al., 2018).               were selected for ILT and MLSSW determination. Each participant
    At the MLSSW, minute WL increments cause a rapid increase                        gave written, informed consent after being provided a detailed
in [La−], which is very likely due to an imbalance between                           description of the study requirements and protocols. The
lactate production and removal within the complex shuttle                            experimental procedures were approved by the University of
network of lactate metabolism (Donovan and Brooks, 1983;                             Konstanz Institutional Review Board and were performed in
Brooks, 1985b; Stainsby and Brooks, 1990; Messonnier et al.,                         accordance with the ethical standards of the Government of
2013). An underlying neuromuscular mechanism is increased                            Baden Württemberg. All subjects were healthy and avoided heavy
activity in motor units with high lactate efflux. If activity in                     exercise and maintained a normal diet at least 2 days before testing.
lactate-consuming motor units remains unchanged, this triggers
rapid arterial lactate accumulation in relation to power output.
In addition, changes in the intra- and inter-muscular innervation,
                                                                                     Pacing System
                                                                                     The visual light pacing system consisted of 25 interconnected
muscle-fiber recruitment pattern, fatigue, and in molecular
                                                                                     polycarbonate tubes, each with four light-emitting diodes. The
signaling cascades contribute to perturbations of lactate
                                                                                     100 red lights could be switched on and off individually via
homeostasis at the MLSSW (Hering et al., 2018).
                                                                                     a microcontroller connected to a PC (control box for swimming
    The traditional method of MLSSW determination requires
                                                                                     speed, Figure 1). A waterproof power cable and a steel cable
several tests on different days and is therefore time-consuming
                                                                                     ensured a constant distance of 25 mm between the diodes
and inappropriate for daily use (Heck et al., 1985; Figueiredo
                                                                                     (Figure 1). The software-controlled, portable pacing system
et al., 2014; Pelarigo et al., 2017; Jamnick et al., 2020). To
                                                                                     was located on the pool floor and the swimmer followed the
circumvent these problems, we recently introduced a single-
                                                                                     continuously moving light strip (Figure 1).
exercise test in running and cycling (Hering et al., 2018). Here,
we have adapted the test algorithm for swimming and can
reliably determine the MLSSW in less than 1 h. Our data not                          Study Protocol of Swim Tests
only recapitulate a remarkably fine-tuned regulation of lactate                      The basic protocol for the so called individual lactate threshold
metabolism at the MLSSW in swimming, but also provide                                (ILT)-test was identical to previous treadmill and bicycle ergometer
evidence that the MLSSW reflects physical endurance capacity                         tests (Hering et al., 2018; for detailed explanation see below,
in ranges above the MLSSW. Consequently, we suggest the MLSSW                        and Figures 2A,B, 3). The ILT-test consists of five distinct

  FIGURE 1 | Experimental arrangement of the individual lactate threshold-test in swimming.

Frontiers in Physiology | www.frontiersin.org                                    2                                        April 2021 | Volume 12 | Article 668123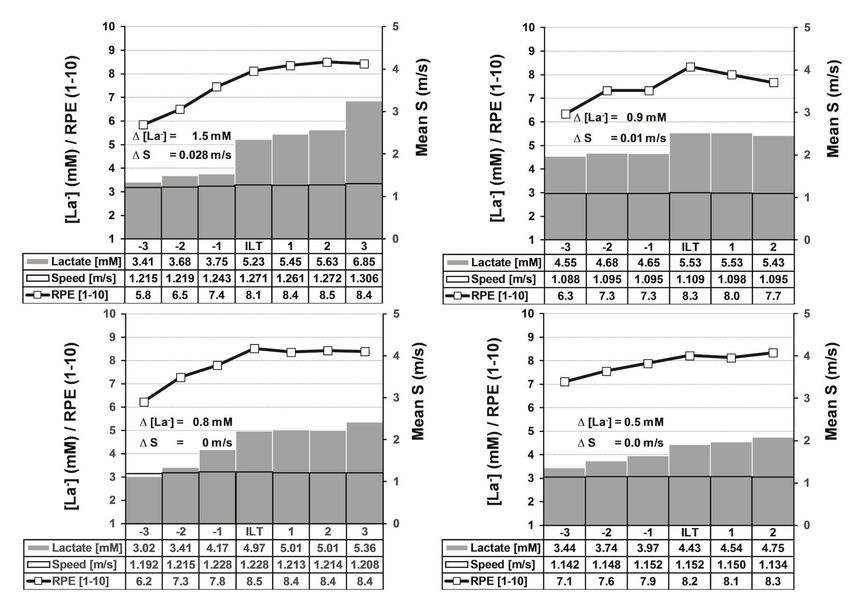
Hering and Stepan MLSSw in Swimming
stages: (i) warm-up (WUP), (ii) threshold adaptation (TA), (iii) slight WL increments until a TC was realized (Figures 2A,B, 3).
fine threshold adaptation (FTA), (iv) lactate threshold detection Every WL increment/reduction was set in accordance to lactate
(LTD) by means of two threshold criteria (TC), followed by concentration from the previous step (Figures 2A,B, 3). We favored
(v) a minimal workload reduction for verification of the MLSSW a 3–4-min step duration to ensure a metabolic and blood
(Figures 2A,B, 3, 4A,B). It is important to note that the ILT-test circulation adaptation phase of at least 3 min after a potential
does not have a fixed number of stages and the swimming WL variation (Weltman et al., 1990; Bentley et al., 2007). The
speed is set in relation to the [La−] from the previous step. blood sample was taken when the swimmer reached the end
For the present study, all 55 datasets were retrospectively of the pool after a step duration of at least 180 s. [La−] was
analyzed with the latest TC. The TC were refined over several measured [Arkray Lactate Pro® 1710, sampling volume 5 μl,
years to optimize the test procedure (e.g., faster FTA), the results measuring time 60 s, coefficient of variation = 3% (Pyne et al.,
however, have not changed. Each subject performed a warm-up 2000; Baldari et al., 2009; Tanner et al., 2010; Mamen, 2014)],
in a 25 m swimming pool at a self-chosen pace (SSin), followed after swimming was stopped for approximately 15 s to collect
by a 60-s period to calibrate the visual light pacing system. The capillary blood samples from the hyperemirized earlobe (Finalgon®,
initial swimming speed was set 0.025 m/s above SSin. The fine- Sanovi-Aventis Germany GmbH, Frankfurt am Main, Germany;
tuning toward the LT was achieved by means of several steps with Dassonville et al., 1998; Feliu et al., 1999). Afterward, the test
A
B
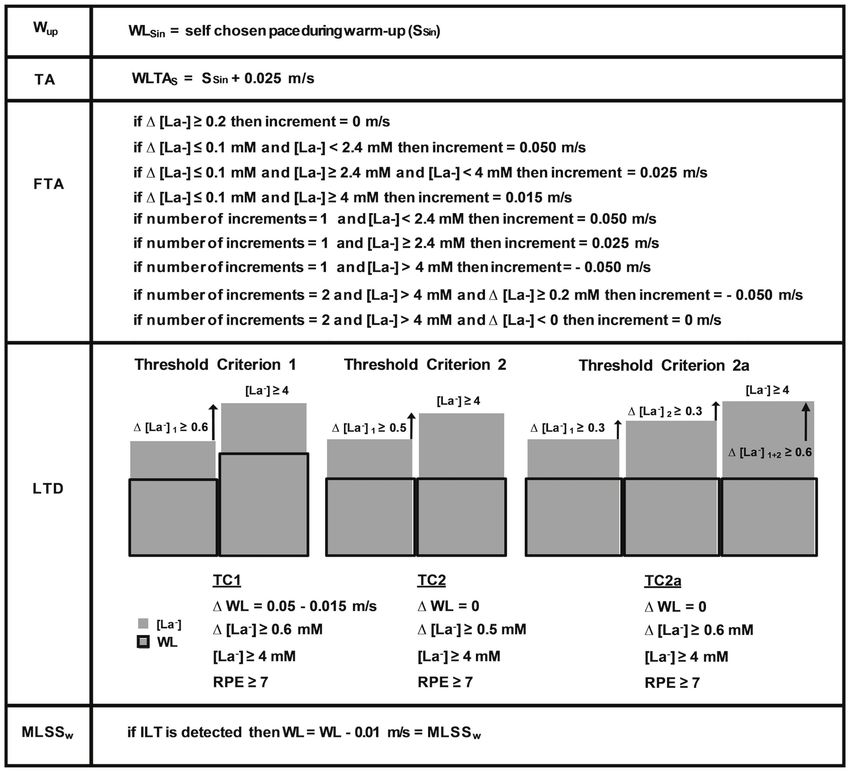
FIGURE 2 | Experimental protocols of two typical ILT-tests. (A) LT detection with threshold criterion 1 (TC1) and (B) with threshold criterion 2 (TC2; Figure 3). The
basic experimental protocol is identical on the treadmill, bicycle ergometer, and for swimming (for detailed information, see Figures 4A,B; Hering et al., 2018). After
warm-up (WUP), threshold adjustment (TA), and fine threshold adjustment (FTA; see section “Material and Methods”), a step-like blood lactate accumulation occurred
at the individual lactate threshold (ILT; ∆[La−]) after 1 (TC1; A) or after up to six steps (TC2; B). Immediately or one increment after a comparable slight workload
reduction (0.01–0.015 m/s), the lactate accumulation slowed down, indicating the maximal lactate steady state workload (MLSSW). Real-time workload adjustments
were set in accordance to blood lactate level in the previous exercise period, explaining the variable test durations even intraindividually (data not shown). [La−],
blood lactate concentration; RPE, rate of perceived exertion; S, speed.
Frontiers in Physiology | www.frontiersin.org 3 April 2021 | Volume 12 | Article 668123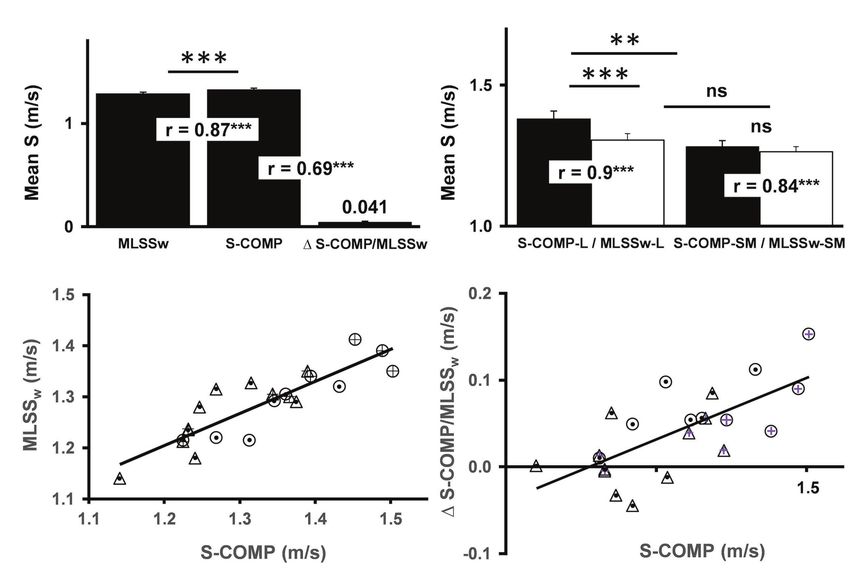
Hering and Stepan                                                                                                                                     MLSSw in Swimming

was continued at the pre-rest speed until the blood sample                               aged 19–32 years (26.2 ± 1.1 years, 5 females). Here, the initial
was analyzed.                                                                            speed was set 0.02 m/s below the previously determined
    Figures 2A,B, 3 depict the algorithms for the TA, the FTA,                           swimming speed at the MLSSW and increased by 0.01 m/s if
and the LTD. After detection of the LT, swimming speed was                               the [La−] was constant (∆[La−] < 0.3 mM) in two consecutive
slightly reduced (0.01–0.015 m/s) to stop lactate accumulation                           3-min steps. When a TC was realized, swimming speed was
and to verify the MLSSW. Participants were instructed to rate                            reduced by 0.01 m/s to stop or, at least, to stabilize the increase
exercise intensity on a scale from 1 to 10, 1 is defined as                              in [La−]. The test consisted of at least 10 steps with a break
very light and 10 as the maximum load (Borg, 1982).                                      of 15 s in between. The RPE was recorded simultaneously.
    The test-protocol, data analyses, and documentation were
executed automatically by custom written software. The digitized                         Validation of the Study Protocol in
speed data were averaged across 5 s intervals and stored together                        Swimming Competitions
with lactate levels, RPE, anthropometric, and time dependent data.                       Seven to fourteen days before an official swimming competition
                                                                                         (800 m women/1500 m men), all 22 subjects aged 13–23 years
Constant Speed-Test                                                                      (17.3 ± 0.92 years, 13 women/9 men, swim training/strength
The validity and reproducibility were assessed in a constant                             training 8.5/2.4 h/week) conducted an ILT-test as described
speed (CS)-test with 13 regional competitive swimmers/triathletes                        above. According to their own statements and based on their

  FIGURE 3 | ILT-test algorithms. Swimming pace (SSin) during warm-up (WUP) was self-chosen. The fine threshold adjustment (FTA) was executed in accordance to
  test duration and blood lactate dynamics. The current threshold criteria (TC) 1, 2 and 2a for determination of the individual lactate threshold (ILT), have been
  developed into their current form by continuously incorporating ILT-test data. After determination of the individual lactate threshold (ILT), the lactate accumulation
  usually slowed down after a slight workload reduction indicating the MLSSW. [La−], blood lactate concentration; MLSSW, maximal lactate steady state workload;
  RPE, rate of perceived exertion; and WLTAs, initial workload adaptation.

Frontiers in Physiology | www.frontiersin.org                                        4                                               April 2021 | Volume 12 | Article 668123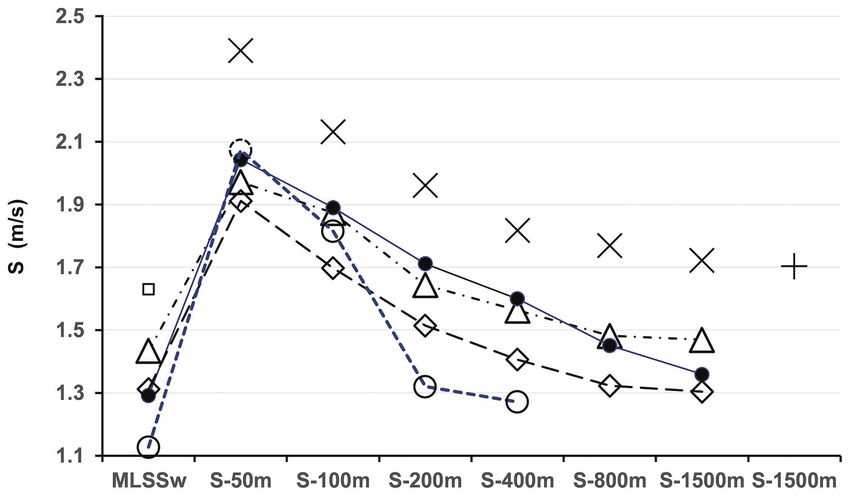
Hering and Stepan                                                                                                                                  MLSSw in Swimming

                A                                                                      C

                B                                                                      D

  FIGURE 4 | Summary of (individual lactate threshold) ILT-tests and constant speed (CS)-tests. (A,B) Summary of ILT-tests that met threshold criterion 1 (A, n = 18)
  or 2 (B, n = 37). Group mean values are shown for blood lactate concentration (mM), speed (m/s), and RPE (1–10). Note that the step-like lactate accumulation at
  the ILT in response to a minute increase in swimming speed. (A) Threshold criterion 1: ∆[La−] = 1.5 ± 0.237 mM, ∆S = 0.028 ± 0.003 m/s. (B) Threshold criterion 2:
  ∆[La−] = 0.8 ± 0.065 mM. (C/D) Summary of (CS)-tests that met threshold criterion 1 (C, n = 4) or 2 (D, n = 9). Group mean values are shown for blood lactate
  concentration (mM), Speed (m/s), and RPE (1–10). Note that the step-like lactate accumulation at the ILT in response to a minute increase in swimming speed.
  (C) Threshold criterion 1: ∆[La−] = 0.9 ± 0.17 mM, ∆S = 0.01 m/s, n = 4. (D) Threshold criterion 2: ∆[La−] = 0.5 ± 0.05 mM. Data are mean ± SE. [La−], arterial
  lactate concentration; RPE, rate of perceived exertion; S, speed.

training and competition history, 10 athletes, aged 14–31 years                        RESULTS
(17.9 ± 1.6 years, nine females) were defined as long-distance
swimmers. Twelve subjects, aged 13–26 (16.8 ± 1.1, six females)                        For running and cycling, we recently demonstrated that the
were assigned to the short-/middle-distance group. The group                           equilibrium between lactate production and elimination and,
assignment based on the official FINA regulations (FINA,                               thus, the MLSSW can be disturbed by minute changes in exercise
F.I.d.N., 2021). No information about the ILT-test results was                         intensity (±0.1 m/s/7 W; Hering et al., 2018). Here, the athletes
given to the athletes before competition. The average swimming                         could implement such small changes in swimming speed by
speed during competition was compared to ILT-test results.                             means of a visual light pacer mounted on the pool floor
For the analysis of individual swimming performance, four                              (Figure 1; see also section “Material and Methods”). In this
male swimmers aged 17–22 years (19.8 ± 1 years) completed                              way, we have determined LT and MLSSW in 55 “individual
a full set of Olympic distances (50, 100, 200, 400, 1,500 m)                           lactate threshold-tests” (ILT-tests) in swimmers (Figures 4A,B).
and 800 m within 3–14 days after the ILT-test (Figure 5).                                 We previously defined two threshold criteria (TC) for treadmill
                                                                                       and bicycle ergometer tests based on an algorithm that has
Statistical Analysis                                                                   been developed into its current form by continuously
Statistical analyses were run in SPSS 24.0 (IBM). Data were                            incorporating ILT-test data (Hering et al., 2018). We applied
analyzed by two-tailed paired and unpaired t-tests as appropriate.                     the same procedure on swimming tests and, again, uncovered
The F-test was used to test for equality of variances. Correlations                    two scenarios of blood lactate accumulation at the LT
between variables were assessed using Pearson’s correlation                            (Figures 2A,B, 3; Hering et al., 2018). Either the arterial blood
coefficient (r). Coefficient of variation (CV) was calculated for                      lactate concentration [La−] raised more than 0.5 mM in the
the ILT-/CS-test comparison. Data are shown as the mean ± SE                           exercise period directly after a WL increment (TC1) or it
unless otherwise stated. p < 0.05 were considered as                                   raised more than 0.4 mM 1–6 steps after the initial WL
statistically significant.                                                             increment (TC2; Figures 2A,B, 3, 4A,B). Both, TC1 and TC2

Frontiers in Physiology | www.frontiersin.org                                      5                                              April 2021 | Volume 12 | Article 668123
Hering and Stepan MLSSw in Swimming FIGURE 5 | Comparison of swimming performance in relation to maximal lactate steady state workload (MLSSW) across Olympic distances. ▲ = Test person (TP) 1, ● = TP 2, ◊ = TP3, ○ = TP4, □ = estimated MLSSW Australian National Team 1996, according to Pyne et al. (2001), + = world record 1994 (Kieren Perkins, Australia), X = current world records (FINA, F.I.d.N., 2021). TP1 had the highest MLSSW, resulting in comparatively good results across all distances. TP4 was slightly faster at 50 m, but slowed down rapidly at longer distances. Note that TP2 performed close to the MLSSW in the 1,500 m race (∆ S-Comp/MLSSW = −0.008 m/s). ∆S-Comp/ MLSSW for TP1/TP3 was moderate (0.035/0.067 m/s) with a relatively high MLSSW for TP1 and a relatively low MLSSW for TP3 (1.434/1.387 m/s; for a detailed analysis see section “Discussion”). Since MLSSW data from world record holders were not available, we estimated the values using data from Pyne et al. (2001). Although these calculations are certainly not entirely accurate, they clearly demonstrate the large gap between MLSSW1996 and the 1,500 m world record in 1994. S, speed. were characterized by a steep increase in [La−], which occurred This demonstrates the high reliability and validity of the ILT-test between absolute lactate levels of 1.8–7 mM (Figures 4A,B). in accessing the MLSSw in swimming. As already shown for The mean increase in [La−] was 1.1 ± 0.91 mM and the the ILT-test, increasing swimming speed by only 0.01 m/s maximum increase was 5.1 mM (Figures 4A,B). In 4 out of resulted in a pronounced change in lactate kinetics 55 tests, the increase in [La−] did not reach 0.5 mM, but (Figures 4C,D). raised slowly in at least three successive steps at constant To evaluate the physiological relevance of the ILT-test in swimming speed (TC2a; Figure 3). After ILT detection, a slight swimming, we compared the test results with data obtained workload reduction (0.01–0.015 m/s) stopped lactate from long distance competitions (800/1500 m). All swimmers accumulation and was used for MLSSW verification performed the ILT-test, followed by a competition after at (Figures 2A,B, 3, 4A,B). The rate of perceived exertion (RPE) least 7 days of recovery. In accordance with our recent study raised or kept constant at high subjective fatigue levels after on half-marathon runners (Hering et al., 2018), swimming reaching the ILT (Figures 2A,B, 4A,B). speed in ILT-tests correlated with swimming speed in competition Notably, rapid blood lactate accumulation (>0.4 mM, TC1/2) (Figures 7A,C). However, while the average running speed in occurred within six steps at constant pace, after swimming speed a half-marathon was 5.2% below threshold speed (Hering et al., was increased very slightly (0.01 m/s). We next evaluated the 2018), the swimmers performed 3.4% above their MLSSW impact of higher increments on lactate dynamics. While increments (S-Comp vs. MLSSW, Figures 7A,C). When the same analysis of 0.015 and 0.025 m/s do not differ from 0.01 m/s, a step of was applied separately for short-/middle-distance (S-Comp-SM, 0.05 m/s provoked another significant lactate accumulation 50–400 m) and long-distance athletes (S-Comp-L, 800/1500 m), (Figure 6A). These data show an extremely sensitive regulated a ∆ S-Comp/MLSSW only occurred in the long-distance group lactate metabolism in swimming and indicate that minute changes (S-Comp-L vs. MLSSW-L, Figure 7B). Finally, we found a close in workload can rapidly unbalance lactate homeostasis. relationship between S-Comp and ∆ S-Comp/MLSSW (∆ S-Comp/ To examine the validity and reproducibility of the ILT-test, MLSSW vs. S-Comp, Figure 7D), which is more pronounced we verified the results in a CS-test of at least 30 min near the in long-distance swimmers (∆ S-Comp-L/MLSSW-L vs. ∆ MLSSW (see section “Material and Methods”). Swimming speed S-Comp-SM/MLSSW-SM, Figure 7B). This finding demonstrates at the MLSS correlated well between ILT-tests and CS-tests the major role of supra-threshold capacity in swimming and (Figure 6B). The minimal difference in average swimming speed very likely determines swimming performance on longer distances at the MLSS between the two test protocols (0.002 m/s) was (S-Comp-L vs. S-Comp-SM, Figure 7B). below the smallest workload increment used in the ILT-tests (0.01 m/s; Figure 6B). In addition, the test-retest coefficient (CC, 0.997) and the coefficient of variation (CV, 0.49%) are below DISCUSSION the values known from the literature for day to day variability of the so-called “Gold Standard Method” (Hauser et al., 2013; Along with biochemical and morphological adaptation, successful CC = 0.98, CV = 3%; Batschelet, 2004; CV = 0.77%). training stimuli integrate dimensions of time, movement Frontiers in Physiology | www.frontiersin.org 6 April 2021 | Volume 12 | Article 668123
Hering and Stepan                                                                                                                                     MLSSw in Swimming

                                                                                                marker and accurate predictor of subthreshold endurance
    A                                                                                           capacity in running and cycling (Heck et al., 1985; Hering
                                                                                                et al., 2018; Jamnick et al., 2018), its relevance for supra-
                                                                                                threshold intensities of exercise is unknown. Here, we have
                                                                                                adapted a recently introduced single-visit test (ILT-test) for
                                                                                                reliable determination of the MLSSW in running and cycling
                                                                                                for swimming and showed that swimming speed in competitions
                                                                                                up to 1,500 m is well above the MLSSW. Moreover, absolute
                                                                                                MLSSW level and the difference between the MLSSW and
                                                                                                swimming speed in competition correlate well with general
                                                                                                swimming performance, in particular with supra-threshold
                                                                                                endurance capacity. Importantly, a training-related combination
                                                                                                of a high MLSSW and a high ∆ S-Comp/MLSSW is more likely
                                                                                                to be found in long-distance trained athletes than in short-
                                                                                                distance trained athletes. Consequently, these data suggest that
                                                                                                the MLSSW is a reliable submaximal parameter for predicting
                                                                                                endurance capacity below and above the LT and to set the
                                                                                                optimal training intensity even in severe domains of exercise.
                                                                                                    We recently provided a detailed discussion on physiological
    B                                                                                           meanings of the ILT-test (Hering et al., 2018). Two issues are
                                                                                                of particular interest and illustrate the relevance of the test
                                                                                                procedure to exercise physiology: first, the extremely fine-tuned
                                                                                                regulation of lactate homeostasis, which can be captured by
                                                                                                the ILT-test. Minute workload variations while running, cycling,
                                                                                                and swimming at the MLSSW (0.1 m/s/7 W/0.01 m/s) generate
                                                                                                drastic changes in blood lactate levels (Figure 6A). Second,
                                                                                                ILT-test results are highly reproducible. The test-retest coefficients
                                                                                                for running and swimming are 0.996 and 0.997, respectively
                                                                                                (Hering et al., 2018).
                                                                                                    We previously demonstrated a strong correlation between
                                                                                                the MLSSW and performance in half-marathon competition
                                                                                                (r = 0.96; Hering et al., 2018). This allows a remarkably precise
                                                                                                prediction of race results (Hering et al., 2018). Compared to
                                                                                                half-marathon runners, we found a lower correlation between
  FIGURE 6 | Lactate dynamics at the individual lactate threshold (ILT).
                                                                                                the MLSSW and the average swimming pace in competition
  (A) Relationship between workload (WL) variation (∆S) and blood lactate
  dynamics (∆[La−]) at the ILT using threshold criterion 1 and 2 (TC1/2). A rapid               (S-Comp, 0.96 vs. 0.87). Hence, S-Comp in swimmers was on
  blood lactate accumulation (>0.4 Mm) occurs in response to a minute WL                        average 3.4% above the MLSSW (data not shown), while half-
  increase (0.01 m/s) after 1–6 steps at constant speed. While increments of                    marathon runners exercised 5.2% below (Hering et al., 2018).
  0.015 m/s and 0.025 m/s do not differ from 0.01 m/s, a step of 0.05 m/s                       Moreover, we found differences in swimming speed (S-Comp-L
  provokes another significant lactate accumulation (0.05 m/s vs. 0.025 m/s;
  0.05 m/s vs. 0.015 m/s, 0.05 m/s vs. 0.01 m/s, N = 65, ***p < 0.001, two-
                                                                                                vs. S-Comp-SM) and for the gap between MLSSW and S-Comp
  tailed unpaired t-tests). (B) Reliability and validity of the ILT-test. Intraindividual       (∆ S-Comp-L/MLSSW-L vs. ∆ S-Comp-SM/MLSSW-SM) when
  day to day comparison of the maximal lactate steady state workload (MLSSW)                    comparing long-distance (L, 400–1,500 m), and short-/middle-
  obtained by an ILT-test and a subsequent constant speed (CS)-test (ILT-                       distance (50–200 m) athletes (SM; Figure 7B). The MLSSW did
  test = 1.132 m/s, CS-test = 1.130 m/s, ∆ ILT-test/CS-test = 0.002 m/s,                        not differ between the two groups (Figure 7B). Therefore, in
  CV = 0.49%, n = 13, r = 0.997, p < 0.001). Data are mean ± SE. [La−], arterial
  lactate concentration; S, speed.
                                                                                                contrast to half-marathon running, race results in swimming
                                                                                                cannot be explained by the MLSSW level alone. Rather, these
                                                                                                data provide substantial evidence that the WL range above the
quality, and exercise intensity to prime neuromuscular plasticity.                              MLSSW is a major factor in swimming and probably in sports
Given the complexity of such highly individual and movement-                                    with comparable racing time. Thus, we speculate, that both, a
specific processes, attention should be paid toward application                                 high MLSSW and a large ∆ S-Comp/MLSSW are crucial in
of reliable, valid, and unbiased reference parameters, which                                    Olympic long-distance swimming (Figures 5, 7A,C,D). Finally,
capture exercise intensities in the form of speed (running and                                  we found a stronger correlation (r = 0.9) between MLSSW-L
swimming) or power (cycling). There is compelling evidence                                      and S-Comp-L compared to MLSSW-SM and S-Comp-SM (0.84;
that the MLSSW is the most appropriate parameter to meet                                        Figure 7B), while only the correlation between ∆ MLSSW-L/S-
these requirements (Jamnick et al., 2020; for excellent reviews                                 Comp-L vs. S-Comp-L was significant (p < 0.05; data not shown).
see also (Fluck and Hoppeler, 2003; Bishop et al., 2019).                                       In long-distance swimmers, this indicates an increased fatigue
Although the MLSSW has repeatedly been described as a reliable                                  resistance of the muscle fibers that are recruited above the MLSSW.

Frontiers in Physiology | www.frontiersin.org                                               7                                        April 2021 | Volume 12 | Article 668123
Hering and Stepan MLSSw in Swimming
A B
C D
FIGURE 7 | Comparison of test and race results. (A) Comparison of swimming speed at MLSSW and swimming speed in competition (S-Comp) and their difference
(∆ S-Comp/MLSSW; MLSSW: 1.283 m/s vs. S-Comp: 1.326, ∗∗∗p < 0.001, two-tailed paired t-test, r = 0.87, ∗∗∗p < 0.001; S-Comp: 1.326 m/s vs. ∆S-Comp/MLSSW:
0.041 m/s, r = 0.69, ∗∗∗p < 0.001; n = 22). (B) Comparison of mean swimming speed at MLSSW and in competition (800 and 1,500 m, S-Comp) between long-
distance swimmers (L, n = 10) and middle- and short-distance swimmers (SM, n = 12; S-Comp-L: 1.378 vs. MLSSW-L: 1.305, ∗∗∗p < 0.001, two-tailed paired t-test,
r = 0.9, ∗∗∗p < 0.001; S-Comp-SM: 1.281 vs. MLSSW-SM: 1.264, ns., two-tailed paired t-test, r = 0.84, ∗∗∗p < 0.001; S-Comp-L: 1.378 m/s vs. S-Comp-SM:
1.281 m/s, ∗∗p < 0.01, two-tailed unpaired t-test; MLSSW-L: 1.305 m/s vs. MLSSW-SM: 1.264 m/s, ns., two-tailed unpaired t-test; ∆ S-Comp-L/MLSSW-L:
0.072 m/s vs. ∆ S-Comp-SM/MLSSW-SM: 0.015 m/s, ∗∗p < 0.01, two-tailed unpaired t-test). (C) Relationship between swimming speed at the MLSSW and
swimming speed in competition (r = 0.87, p < 0.001; ○ = long distance group (L), ∆ = middle and short distance group (SM), + = men, ● = women).
(D) Relationship between ∆ S-Comp/MLSSW and S-Comp (r = 0.698, p < 0.001). Data are mean ± SE. S, speed.
With increasing WL demands at the MLSSW, fast-twitching muscle fibers from MHC IIa type to MHC I type, with the
and more glycolytic type II fibers get more likely recruited same or larger fiber diameter has been demonstrated in cyclists
(Henneman et al., 1965; Burke et al., 1971; Peter et al., 1972; (Coyle et al., 1992; Horowitz et al., 1994; Coyle, 2005) and
Vollestad and Blom, 1985). The accompanying blood lactate in a bicycle ergometer training-study at 75% peak oxygen
accumulation will rapidly exceed clearance systems and is consumption (Dubouchaud et al., 2000). Importantly, the plasticity
commonly referred to as LT. Exercise in this intensity range of muscles was correlated with higher endurance capacity (Coyle
can trigger the following adaptions: (i) higher mitochondrial et al., 1992; Horowitz et al., 1994; Coyle, 2005) possibly because
content and/or activity (Dudley et al., 1982; Howald et al., the ATP consumption of type I fibers is comparatively lower
1985; Hoppeler, 1986; Daussin et al., 2008), increased for the same force production (Greenhaff et al., 1993; Stienen
capillarization (Li et al., 2020), (ii) higher MCT1/MCT4 content et al., 1996; He et al., 2000; Szentesi et al., 2001). However,
(Dubouchaud et al., 2000; de Araujo et al., 2015) and (iii) an there would only be a net advantage if the discipline-specific
overall increase in lactate clearance rate (Bergman et al., 1999; movement execution corresponds to the twitching properties
Messonnier et al., 2013; for comprehensive reviews, see Fluck of performance-relevant muscles/muscle fibers (Tesch and
and Hoppeler, 2003; Schiaffino and Reggiani, 2011; Hoppeler, Karlsson, 1985). To our knowledge, no bioptically proven,
2016). These adaptions may at least partially explain the higher training-induced fiber transformation in swimming has been
fatigue resistance above the MLSSW of long-distance swimmers reported so far. Comparison of highly-trained elite 1,500 m
(800–1,500 m). swimmers and amateurs demonstrated larger and more type
Fast-twitching muscle fibers consume considerably more ATP I fibers in the M. vastus lateralis of elite swimmers (Gerard
and O2 (Greenhaff et al., 1993; Stienen et al., 1995; He et al., et al., 1986). Although exercise induced fiber transformation
2000; Szentesi et al., 2001). Converting them into muscles with from fast to slow after several years of training is a possible
a higher aerobic capacity to expand supra-threshold endurance explanation for the higher S-Comp of long-distance swimmers,
capacity is challenging in humans, since everyday movements data on arm muscles is not available.
counteract eventual training interventions (Monster et al., 1978; Recent studies show that training stimuli in the MLSSW
Lindstedt et al., 1991; Pette and Staron, 1997). A conversion of range (Dubouchaud et al., 2000) induce not only muscle fiber
Frontiers in Physiology | www.frontiersin.org 8 April 2021 | Volume 12 | Article 668123Hering and Stepan MLSSw in Swimming
transformation but also prime neuronal plasticity in severe Together with the improved coordination patterns described
domains of exercise (Pin-Barre et al., 2017; Rahmati and Kazemi, above, peripheral and/or central recruitment of additional
2019; Constans et al., 2021). Complicating this picture, metabolic motor units and their higher discharge frequencies can
homeostasis in swimming is more dependent on technical skills be converted into strength increases (Henneman et al., 1965;
than in running or cycling (Figueiredo et al., 2014). For example, Sale, 1988; Wakeling et al., 2002, 2006, 2012; Jensen et al.,
elite swimmers use different combinations of stroke parameters 2005; Ansdell et al., 2020). This ultimately leads to higher
compared to amateur-level athletes (Seifert et al., 2010b). muscle power (Power = Force · Velocity/Speed) with a constant
Moreover, several studies consistently found increased stroke fiber/muscle cross-section and thus also a constant weight
frequency accompanied by decreased stroke length slightly (Gabriel et al., 2006). A further increase in strength can
above the MLSSW (Oliveira et al., 2012; Figueiredo et al., 2013, be achieved by increasing the cross-sectional area of muscles
2014; Pelarigo et al., 2017). Alberty et al. assume that a change through unspecific or specific strength training (Fyfe et al.,
in arm coordination has two key benefits: (i) a better chain 2014). However, it is important to note, that the isolated
of the propulsive actions and (ii) a greater time allotted to stimulation of muscle hypertrophy neglects neuromuscular
propulsion per distance unit during increasing muscular fatigue optimization, which limits its application in competitive sports.
(Alberty et al., 2009; Seifert et al., 2010a). Nevertheless, an elevated fiber/muscle cross-section will likely
A study on open water swimmers (OWSs, 5–25 km) and result in improved performance if ∆MLSSW/S-Comp increases
short distance swimmers (SDSs, 50–100 m), two subgroups at low or constant MLSSW. Such a scenario may also explain
comparable to the present study, clearly demonstrates the strong the performance profile of TP4 (Figure 5, see also the
relationship between muscle coordination and energy metabolism next paragraph).
(Seifert et al., 2010a). In an intensity-adjusted progressive An in-depth analysis of complete sets of Olympic distances
6 × 300 m test, the OWS achieved a higher mean speed (1.39 (Figure 5) reveals significant differences in MLSSW scores and
vs. 1.27 m·s−1), stroke rate (0.62 vs. 0.55 Hz), and stroke index for the gap between MLSSW and swimming pace in competition
(SI = SL·SV, 3.19 vs. 2.96 m2 s−1), and a lower stroke length (∆ S-Comp/MLSSW). The comparatively high MLSSW of TP1
(SL, 2.28 vs. 2.31 m·stroke−1) and index of coordination (IdC, indicates substantial neuromuscular adaptations, which may
−21.7 vs. −11.2%) than the SDS. When a lag time occurred explain the race results above the average in all disciplines.
between the propulsive phases of the two arms, the stroke Other athletes (TP2-4) seem to have less well coordinated
coordination was called as “catch-up” (IdC < 0%; Chollet et al., movement patterns, likely underlying their lower threshold
2000). Importantly, the OWS, who should be highly fatigue speeds (MLSSW). TP4 has the fastest 50 m time, but a considerably
resistant, kept their coordination in great catch-up, presumably lower MLSSW manifesting in a rapid decline in performance
because they were highly focused on their hydro-dynamic starting from 200 m. Although at a lower level, ∆ S-Comp/
position in order to minimize resistive forces and maximize MLSSW of TP2 follows the course of TP1 indicating a similar
efficiency (Seifert et al., 2010a). The relationship between history of training stimuli. In contrast, the relatively high ∆
increasing energy consumption and decreasing catch-up phase S-Comp/MLSSW for distances up to 400 m and the decline
was observed in both groups [IdC vs. energy cost (C), p < 0.05], in speed at 800 and 1,500 m of TP4 suggests insufficient
but the OWS had longer glide phases in catch-up mode (IdC) aerobic neuromuscular adaptation of muscle fibers involved
and higher stroke efficiency (SI) for the same energy consumption, in supra-threshold exercise.
resulting in more efficient propulsion. Moreover, on the average
of six progressive 300 m sets beginning with a swimming
speed near the MLSSW (0.1 m/s below the 400 m best time, CONCLUSION
increment = 0.017 m/s), the OWS also had lower blood lactate
concentrations (3.1 vs. 5.9 mmol·L−1), lower energy consumption Considerable progress has been made in understanding the
(C, 12.89 vs. 14.8 J·kg−1·m−1), and a greater net VO2 (2,903 molecular and neuromuscular architecture of adaptation
vs. 2,825 ml·min−1) than the SDS (Seifert et al., 2010a). This processes to various training stimuli (Fluck and Hoppeler,
is in line with our data showing a higher S-Comp and a 2003; Fyfe et al., 2014; Granata et al., 2018; Bishop et al.,
larger ∆ S-Comp/MLSSW in 800–1,500 m swimmers. In 2019). However, successful translation of basic insights into
accordance with Seifert et al. (2010a), we hypothesize that useful training concepts has been constrained by the lack of
long-distance trained swimmers, and likely endurance athletes appropriate reference parameters (Jamnick et al., 2020). Using
with comparable racing times, have a higher fatigue resistance a sophisticated single-exercise test in swimming and results
in the supra-threshold range due to improvements in technique from swimming competitions, we provide clear evidence that
and metabolism. Training intensity/duration adjustment in the MLSSW is a reliable and valid parameter to assess endurance
moderate to severe domains of exercise will trigger neuromuscular capacity in moderate to severe domains of exercise (Hering
adaptations (Dudley et al., 1982; Dubouchaud et al., 2000; et al., 2018; Jamnick et al., 2020). Consequently, we suggest
Messonnier et al., 2013; Figueiredo et al., 2014; de Araujo that personal training recommendations and monitoring of
et al., 2015), which most likely manifest in a higher MLSSW exercise-induced changes in individual performance level
(Billat et al., 2004; Philp et al., 2008). Such a higher fatigue should be calculated relative to the MLSSW rather than to
resistance in the supra-threshold range can facilitate economic peak or maximal workload parameters (Baldwin et al., 2000;
movement over longer periods of time. Skorski et al., 2012; Bishop et al., 2019).
Frontiers in Physiology | www.frontiersin.org 9 April 2021 | Volume 12 | Article 668123Hering and Stepan MLSSw in Swimming
DATA AVAILABILITY STATEMENT figures, and edited and revised the manuscript. JS performed
experiments, interpreted results, prepared figures, and edited
The raw data supporting the conclusions of this article and revised the manuscript.
will be made available by the authors, without undue reservation.
ACKNOWLEDGMENTS
ETHICS STATEMENT
We sincerely thank the test persons and the BA and
The studies involving human participants were reviewed and MA students, namely Patrick Thumm, Mike Baumann,
approved by the Ethics Committee (institutional review board, Benjamin Singer, Christian Bächle, Frederic Wortmeier,
IRB) of the University of Konstanz. Written informed consent Patricia Scheller, and Jasmin Wagner for their dedication and
to participate in this study was provided by the participants’ participation in this study. We also gratefully acknowledge the
legal guardian/next of kin. technical support of the engineering department, namely Harald
Kautz, Hubert Fink, Harald Richter, and Bruno Erne.
Furthermore, we would like to thank the representatives of
AUTHOR CONTRIBUTIONS the sports department of the city of Konstanz, especially
Roland Lohr for the opportunity to generously use the
GH developed the hardware and software, conceived and municipal swimming pool. Finally, we would like to thank
designed research, performed experiments, analyzed data, the Research Committee of the University of Konstanz for
prepared and interpreted results, drafted the manuscript, prepared financial support.
REFERENCES Brooks, G. A. (1985a). Anaerobic threshold: review of the concept and directions
for future research. Med. Sci. Sports Exerc. 17, 22–34.
Alberty, M., Sidney, M., Pelayo, P., and Toussaint, H. M. (2009). Stroking Brooks, G. A. (1985b). “Lactate:Glycolytic End Product and Oxidative Substrate
characteristics during time to exhaustion tests. Med. Sci. Sports Exerc. 41, During Sustained Exercise in Mammals — the “Lactate Shuttle,”” in Circulation,
637–644. doi: 10.1249/MSS.0b013e31818acfba Respiration, and Metabolism: Current Comparative Approaches. ed. R. Gilles
Ansdell, P., Brownstein, C. G., Skarabot, J., Angius, L., Kidgell, D., Frazer, A., (Berlin; New York: Springer-Verlag).
et al. (2020). Task-specific strength increases after lower-limb Burke, R. E., Levine, D. N., and Zajac, F. E. 3rd. (1971). Mammalian motor
compound resistance training occurred in the absence of corticospinal units: physiological-histochemical correlation in three types in cat
changes in vastus lateralis. Exp. Physiol. 105, 1132–1150. doi: 10.1113/ gastrocnemius. Science 174, 709–712. doi: 10.1126/science.174.4010.709
EP088629 Chollet, D., Chalies, S., and Chatard, J. C. (2000). A new index of coordination
Baldari, C., Bonavolonta, V., Emerenziani, G. P., Gallotta, M. C., Silva, A. J., for the crawl: description and usefulness. Int. J. Sports Med. 21, 54–59. doi:
and Guidetti, L. (2009). Accuracy, reliability, linearity of Accutrend and 10.1055/s-2000-8855
Lactate Pro versus EBIO plus analyzer. Eur. J. Appl. Physiol. 107, 105–111. Constans, A., Pin-Barre, C., Molinari, F., Temprado, J. J., Brioche, T., Pellegrino, C.,
doi: 10.1007/s00421-009-1107-5 et al. (2021). High-intensity interval training is superior to moderate intensity
Baldwin, J., Snow, R. J., and Febbraio, M. A. (2000). Effect of training status training on aerobic capacity in rats: impact on hippocampal plasticity markers.
and relative exercise intensity on physiological responses in men. Behav. Brain Res. 398:112977. doi: 10.1016/j.bbr.2020.112977
Med. Sci. Sports Exerc. 32, 1648–1654. doi: 10.1097/00005768- Coyle, E. F. (2005). Improved muscular efficiency displayed as Tour de France
200009000-00020 champion matures. J. Appl. Physiol. 98, 2191–2196. doi: 10.1152/
Batschelet, A. (2004). Reproduzierbarkeit des maximalen Laktat-steady-states. japplphysiol.00216.2005
SEMS 52, 154–156. Coyle, E. F., Sidossis, L. S., Horowitz, J. F., and Beltz, J. D. (1992). Cycling
Bentley, D. J., Newell, J., and Bishop, D. (2007). Incremental exercise efficiency is related to the percentage of type I muscle fibers. Med. Sci.
test design and analysis: implications for performance diagnostics in Sports Exerc. 24, 782–788.
endurance athletes. Sports Med. 37, 575–586. doi: 10.2165/00007256- Dassonville, J., Beillot, J., Lessard, Y., Jan, J., Andre, A. M., Le Pourcelet, C.,
200737070-00002 et al. (1998). Blood lactate concentrations during exercise: effect of sampling
Bergman, B. C., Wolfel, E. E., Butterfield, G. E., Lopaschuk, G. D., Casazza, G. A., site and exercise mode. J. Sports Med. Phys. Fitness 38, 39–46.
Horning, M. A., et al. (1999). Active muscle and whole body lactate kinetics Daussin, F. N., Zoll, J., Dufour, S. P., Ponsot, E., Lonsdorfer-Wolf, E., Doutreleau, S.,
after endurance training in men. J. Appl. Physiol. 87, 1684–1696. doi: 10.1152/ et al. (2008). Effect of interval versus continuous training on cardiorespiratory
jappl.1999.87.5.1684 and mitochondrial functions: relationship to aerobic performance improvements
Billat, V., Sirvent, P., Lepretre, P. M., and Koralsztein, J. P. (2004). Training in sedentary subjects. Am. J. Physiol. Regul. Integr. Comp. Physiol. 295,
effect on performance, substrate balance and blood lactate concentration at R264–R272. doi: 10.1152/ajpregu.00875.2007
maximal lactate steady state in master endurance-runners. Pflugers Arch. de Araujo, G. G., Gobatto, C. A., de Barros Manchado-Gobatto, F., Teixeira, L. F.,
447, 875–883. doi: 10.1007/s00424-003-1215-8 Dos Reis, I. G., Caperuto, L. C., et al. (2015). MCT1 and MCT4 kinetic
Billat, V. L., Sirvent, P., Py, G., Koralsztein, J. P., and Mercier, J. (2003). The of mRNA expression in different tissues after aerobic exercise at maximal
concept of maximal lactate steady state: a bridge between biochemistry, lactate steady state workload. Physiol. Res. 64, 513–522. doi: 10.33549/
physiology and sport science. Sports Med. 33, 407–426. doi: 10.2165/ physiolres.932695
00007256-200333060-00003 Donovan, C. M., and Brooks, G. A. (1983). Endurance training affects lactate
Bishop, D. J., Botella, J., Genders, A. J., Lee, M. J., Saner, N. J., Kuang, J., clearance, not lactate production. Am. J. Phys. 244, E83–E92. doi: 10.1152/
et al. (2019). High-intensity exercise and mitochondrial biogenesis: current ajpendo.1983.244.1.E83
controversies and future research directions. Physiology 34, 56–70. Dubouchaud, H., Butterfield, G. E., Wolfel, E. E., Bergman, B. C., and Brooks, G. A.
doi: 10.1152/physiol.00038.2018 (2000). Endurance training, expression, and physiology of LDH, MCT1,
Borg, G. A. (1982). Psychophysical bases of perceived exertion. Med. Sci. Sports and MCT4 in human skeletal muscle. Am. J. Physiol. Endocrinol. Metab.
Exerc. 14, 377–381. 278, E571–E579. doi: 10.1152/ajpendo.2000.278.4.E571
Frontiers in Physiology | www.frontiersin.org 10 April 2021 | Volume 12 | Article 668123Hering and Stepan MLSSw in Swimming
Dudley, G. A., Abraham, W. M., and Terjung, R. L. (1982). Influence of exercise and [Formula: see text]. PLoS One 13:e0199794. doi: 10.1371/journal.
intensity and duration on biochemical adaptations in skeletal muscle. J. pone.0199794
Appl. Physiol. Respir. Environ. Exerc. Physiol. 53, 844–850. doi: 10.1152/ Jamnick, N. A., Pettitt, R. W., Granata, C., Pyne, D. B., and Bishop, D. J.
jappl.1982.53.4.844 (2020). An examination and critique of current methods to determine exercise
Faude, O., Kindermann, W., and Meyer, T. (2009). Lactate threshold intensity. Sports Med. 50, 1729–1756. doi: 10.1007/s40279-020-01322-8
concepts: how valid are they? Sports Med. 39, 469–490. doi: 10.2165/ Jensen, J. L., Marstrand, P. C., and Nielsen, J. B. (2005). Motor skill training
00007256-200939060-00003 and strength training are associated with different plastic changes in the
Feliu, J., Ventura, J. L., Segura, R., Rodas, G., Riera, J., Estruch, A., et al. central nervous system. J. Appl. Physiol. 99, 1558–1568. doi: 10.1152/
(1999). Differences between lactate concentration of samples from ear lobe japplphysiol.01408.2004
and the finger tip. J. Physiol. Biochem. 55, 333–339. Li, J., Li, Y., Atakan, M. M., Kuang, J., Hu, Y., Bishop, D. J., et al. (2020).
Figueiredo, P., Morais, P., Vilas-Boas, J. P., and Fernandes, R. J. (2013). Changes The molecular adaptive responses of skeletal muscle to high-intensity exercise/
in arm coordination and stroke parameters on transition through the lactate training and hypoxia. Antioxidants 9:656. doi: 10.3390/antiox9080656
threshold. Eur. J. Appl. Physiol. 113, 1957–1964. doi: 10.1007/s00421-013-2617-8 Lindstedt, S. L., Hokanson, J. F., Wells, D. J., Swain, S. D., Hoppeler, H., and
Figueiredo, P., Nazario, R., Sousa, M., Pelarigo, J. G., Vilas-Boas, J. P., and Navarro, V. (1991). Running energetics in the pronghorn antelope. Nature
Fernandes, R. (2014). Kinematical analysis along maximal lactate steady 353, 748–750. doi: 10.1038/353748a0
state swimming intensity. J. Sports Sci. Med. 13, 610–615. Mamen, A. (2014). “Lactate Pro vs Lactate Pro2,” in 19th annual Congress of
FINA, F.I.d.N. (2021). Overall rankings world records swimming men. Available the European College of Sport Science. eds. A. De Haan, C. J. De Ruiter,
at: http://www.fina.org/fina-rankings/results?recordCode=WR&gender=Men& and E. Tsolakidis (Amsterdam VU University Amsterdam & VU University
poolConfiguration=LCM&type=records&selectedGroup=Freestyle&selectedG Medical Center).
ender=Men&selectedDistance=50 (Accessed January 21, 2021). Messonnier, L. A., Emhoff, C. A., Fattor, J. A., Horning, M. A., Carlson, T. J.,
Fluck, M., and Hoppeler, H. (2003). Molecular basis of skeletal muscle plasticity— and Brooks, G. A. (2013). Lactate kinetics at the lactate threshold in trained
from gene to form and function. Rev. Physiol. Biochem. Pharmacol. 146, and untrained men. J. Appl. Physiol. 114, 1593–1602. doi: 10.1152/
159–216. doi: 10.1007/s10254-002-0004-7 japplphysiol.00043.2013
Fyfe, J. J., Bishop, D. J., and Stepto, N. K. (2014). Interference between Monster, A. W., Chan, H., and O’Connor, D. (1978). Activity patterns of human
concurrent resistance and endurance exercise: molecular bases and the role skeletal muscles: relation to muscle fiber type composition. Science 200,
of individual training variables. Sports Med. 44, 743–762. doi: 10.1007/ 314–317. doi: 10.1126/science.635587
s40279-014-0162-1 Oliveira, M. F., Caputo, F., Dekerle, J., Denadai, B. S., and Greco, C. C. (2012).
Gabriel, D. A., Kamen, G., and Frost, G. (2006). Neural adaptations to resistive Stroking parameters during continuous and intermittent exercise in regional-
exercise: mechanisms and recommendations for training practices. Sports level competitive swimmers. Int. J. Sports Med. 33, 696–701. doi: 10.1055/
Med. 36, 133–149. doi: 10.2165/00007256-200636020-00004 s-0031-1298003
Gerard, E. S., Caiozzo, V. J., Rubin, B. D., Prietto, C. A., and Davidson, D. M. Pelarigo, J. G., Machado, L., Fernandes, R. J., Greco, C. C., and Vilas-Boas, J. P.
(1986). Skeletal muscle profiles among elite long, middle, and short distance (2017). Oxygen uptake kinetics and energy system’s contribution around
swimmers. Am. J. Sports Med. 14, 77–82. doi: 10.1177/036354658601400113 maximal lactate steady state swimming intensity. PLoS One 12:e0167263.
Granata, C., Jamnick, N. A., and Bishop, D. J. (2018). Training-induced changes doi: 10.1371/journal.pone.0167263
in mitochondrial content and respiratory function in human skeletal muscle. Peter, J. B., Barnard, R. J., Edgerton, V. R., Gillespie, C. A., and Stempel, K. E.
Sports Med. 48, 1809–1828. doi: 10.1007/s40279-018-0936-y (1972). Metabolic profiles of three fiber types of skeletal muscle in Guinea
Greenhaff, P. L., Soderlund, K., Ren, J. M., and Hultman, E. (1993). Energy pigs and rabbits. Biochemistry 11, 2627–2633. doi: 10.1021/bi00764a013
metabolism in single human muscle fibres during intermittent contraction Pette, D., and Staron, R. S. (1997). Mammalian skeletal muscle fiber type
with occluded circulation. J. Physiol. 460, 443–453. doi: 10.1113/jphysiol.1993. transitions. Int. Rev. Cytol. 170, 143–223. doi: 10.1016/s0074-7696(08)61622-8
sp019480 Philp, A., Macdonald, A. L., Carter, H., Watt, P. W., and Pringle, J. S. (2008).
Hauser, T., Bartsch, D., Baumgartel, L., and Schulz, H. (2013). Reliability of Maximal lactate steady state as a training stimulus. Int. J. Sports Med. 29,
maximal lactate-steady-state. Int. J. Sports Med. 34, 196–199. doi: 10.1055/ 475–479. doi: 10.1055/s-2007-965320
s-0032-1321719 Pin-Barre, C., Constans, A., Brisswalter, J., Pellegrino, C., and Laurin, J. (2017).
He, Z. H., Bottinelli, R., Pellegrino, M. A., Ferenczi, M. A., and Reggiani, C. Effects of high- versus moderate-intensity training on neuroplasticity and
(2000). ATP consumption and efficiency of human single muscle fibers functional recovery after focal ischemia. Stroke 48, 2855–2864. doi: 10.1161/
with different myosin isoform composition. Biophys. J. 79, 945–961. doi: STROKEAHA.117.017962
10.1016/S0006-3495(00)76349-1 Pyne, D. B., Boston, T., Martin, D. T., and Logan, A. (2000). Evaluation of
Heck, H., Mader, A., Hess, G., Mucke, S., Muller, R., and Hollmann, W. (1985). the Lactate Pro blood lactate analyser. Eur. J. Appl. Physiol. 82, 112–116.
Justification of the 4-mmol/l lactate threshold. Int. J. Sports Med. 6, 117–130. doi: 10.1007/s004210050659
doi: 10.1055/s-2008-1025824 Pyne, D. B., Lee, H., and Swanwick, K. M. (2001). Monitoring the lactate
Henneman, E., Somjen, G., and Carpenter, D. O. (1965). Excitability and threshold in world-ranked swimmers. Med. Sci. Sports Exerc. 33, 291–297.
inhibitability of motoneurons of different sizes. J. Neurophysiol. 28, 599–620. doi: 10.1097/00005768-200102000-00019
doi: 10.1152/jn.1965.28.3.599 Rahmati, M., and Kazemi, A. (2019). Various exercise intensities differentially
Hering, G. O., Hennig, E. M., Riehle, H. J., and Stepan, J. (2018). A lactate regulate GAP-43 and CAP-1 expression in the rat hippocampus. Gene 692,
kinetics method for assessing the maximal lactate steady state workload. 185–194. doi: 10.1016/j.gene.2019.01.013
Front. Physiol. 9:310. doi: 10.3389/fphys.2018.00310 Sale, D. G. (1988). Neural adaptation to resistance training. Med. Sci. Sports
Hoppeler, H. (1986). Exercise-induced ultrastructural changes in skeletal muscle. Exerc. 20 (Suppl. 5), S135–S145. doi: 10.1249/00005768-198810001-00009
Int. J. Sports Med. 7, 187–204. doi: 10.1055/s-2008-1025758 Schiaffino, S., and Reggiani, C. (2011). Fiber types in mammalian skeletal
Hoppeler, H. (2016). Molecular networks in skeletal muscle plasticity. J. Exp. muscles. Physiol. Rev. 91, 1447–1531. doi: 10.1152/physrev.00031.2010
Biol. 219, 205–213. doi: 10.1242/jeb.128207 Seifert, L., Komar, J., Lepretre, P. M., Lemaitre, F., Chavallard, F., Alberty, M.,
Horowitz, J. F., Sidossis, L. S., and Coyle, E. F. (1994). High efficiency of type et al. (2010a). Swim specialty affects energy cost and motor organization.
I muscle fibers improves performance. Int. J. Sports Med. 15, 152–157. doi: Int. J. Sports Med. 31, 624–630. doi: 10.1055/s-0030-1255066
10.1055/s-2007-1021038 Seifert, L., Toussaint, H. M., Alberty, M., Schnitzler, C., and Chollet, D. (2010b).
Howald, H., Hoppeler, H., Claassen, H., Mathieu, O., and Straub, R. (1985). Arm coordination, power, and swim efficiency in national and regional front
Influences of endurance training on the ultrastructural composition of the crawl swimmers. Hum. Mov. Sci. 29, 426–439. doi: 10.1016/j.humov.2009.11.003
different muscle fiber types in humans. Pflugers Arch. 403, 369–376. doi: Skorski, S., Faude, O., Urhausen, A., Kindermann, W., and Meyer, T. (2012).
10.1007/BF00589248 Intensity control in swim training by means of the individual anaerobic
Jamnick, N. A., Botella, J., Pyne, D. B., and Bishop, D. J. (2018). Manipulating threshold. J. Strength Cond. Res. 26, 3304–3311. doi: 10.1519/
graded exercise test variables affects the validity of the lactate threshold JSC.0b013e31824b6014
Frontiers in Physiology | www.frontiersin.org 11 April 2021 | Volume 12 | Article 668123Hering and Stepan MLSSw in Swimming
Stainsby, W. N., and Brooks, G. A. (1990). Control of lactic acid metabolism Wakeling, J. M., Kaya, M., Temple, G. K., Johnston, I. A., and Herzog, W.
in contracting muscles and during exercise. Exerc. Sport Sci. Rev. 18, 29–63. (2002). Determining patterns of motor recruitment during locomotion. J.
Stanley, W. C., Gertz, E. W., Wisneski, J. A., Morris, D. L., Neese, R. A., and Exp. Biol. 205, 359–369.
Brooks, G. A. (1985). Systemic lactate kinetics during graded exercise in Wakeling, J. M., Lee, S. S., Arnold, A. S., de Boef Miara, M., and Biewener, A. A.
man. Am. J. Phys. 249, E595–E602. doi: 10.1152/ajpendo.1985.249.6.E595 (2012). A muscle’s force depends on the recruitment patterns of its fibers.
Stienen, G. J., Kiers, J. L., Bottinelli, R., and Reggiani, C. (1996). Myofibrillar Ann. Biomed. Eng. 40, 1708–1720. doi: 10.1007/s10439-012-0531-6
ATPase activity in skinned human skeletal muscle fibres: fibre type and temperature Wakeling, J. M., Uehli, K., and Rozitis, A. I. (2006). Muscle fibre recruitment
dependence. J. Physiol. 493, 299–307. doi: 10.1113/jphysiol.1996.sp021384 can respond to the mechanics of the muscle contraction. J. R. Soc. Interface
Stienen, G. J., Zaremba, R., and Elzinga, G. (1995). ATP utilization for calcium 3, 533–544. doi: 10.1098/rsif.2006.0113
uptake and force production in skinned muscle fibres of Xenopus laevis. Weltman, A., Snead, D., Stein, P., Seip, R., Schurrer, R., Rutt, R., et al. (1990).
J. Physiol. 482, 109–122. doi: 10.1113/jphysiol.1995.sp020503 Reliability and validity of a continuous incremental treadmill protocol for
Szentesi, P., Zaremba, R., van Mechelen, W., and Stienen, G. J. (2001). ATP the determination of lactate threshold, fixed blood lactate concentrations,
utilization for calcium uptake and force production in different types of and VO2max. Int. J. Sports Med. 11, 26–32. doi: 10.1055/s-2007-1024757
human skeletal muscle fibres. J. Physiol. 531, 393–403. doi: 10.1111/
j.1469-7793.2001.0393i.x Conflict of Interest: The authors declare that the research was conducted in
Tanner, R. K., Fuller, K. L., and Ross, M. L. (2010). Evaluation of three portable the absence of any commercial or financial relationships that could be construed
blood lactate analysers: Lactate Pro, Lactate Scout and Lactate Plus. Eur. J. as a potential conflict of interest.
Appl. Physiol. 109, 551–559. doi: 10.1007/s00421-010-1379-9
Tesch, P. A., and Karlsson, J. (1985). Muscle fiber types and size in trained Copyright © 2021 Hering and Stepan. This is an open-access article distributed
and untrained muscles of elite athletes. J. Appl. Physiol. 59, 1716–1720. doi: under the terms of the Creative Commons Attribution License (CC BY). The use,
10.1152/jappl.1985.59.6.1716 distribution or reproduction in other forums is permitted, provided the original
Vollestad, N. K., and Blom, P. C. (1985). Effect of varying exercise intensity author(s) and the copyright owner(s) are credited and that the original publication
on glycogen depletion in human muscle fibres. Acta Physiol. Scand. 125, in this journal is cited, in accordance with accepted academic practice. No use,
395–405. doi: 10.1111/j.1748-1716.1985.tb07735.x distribution or reproduction is permitted which does not comply with these terms.
Frontiers in Physiology | www.frontiersin.org 12 April 2021 | Volume 12 | Article 668123You can also read