Leaf wax n-alkane patterns and compound-specific δ13C of plants and topsoils from semi-arid and arid Mongolia
←
→
Page content transcription
If your browser does not render page correctly, please read the page content below
Biogeosciences, 17, 567–580, 2020
https://doi.org/10.5194/bg-17-567-2020
© Author(s) 2020. This work is distributed under
the Creative Commons Attribution 4.0 License.

Leaf wax n-alkane patterns and compound-specific δ 13C of plants
and topsoils from semi-arid and arid Mongolia
Julian Struck1 , Marcel Bliedtner1,2 , Paul Strobel1 , Jens Schumacher3 , Enkhtuya Bazarradnaa4 , and Roland Zech1
1 Institute of Geography, Friedrich Schiller University Jena, Löbdergraben 32, 07743 Jena, Germany
2 Institute of Geography and Oeschger Centre for Climate Change Research, University of Bern,
Hallerstrasse 12, 3012 Bern, Switzerland
3 Institute of Mathematics, Friedrich Schiller University Jena, Ernst-Abbe-Platz 2, 07743 Jena, Germany
4 Institute of Plant and Agricultural Sciences, Mongolian University of Life Sciences, Darkhan, Mongolia

Correspondence: Julian Struck (julian.struck@uni-jena.de)

Received: 25 June 2019 – Discussion started: 23 July 2019
Revised: 3 January 2020 – Accepted: 10 January 2020 – Published: 5 February 2020

Abstract. Leaf wax n-alkane patterns and their compound-          oclimatic conditions when used in sediment archives from
specific δ 13 C signatures are valuable proxies for paleoenvi-    Mongolia.
ronmental reconstructions. So far, their potential has not been
investigated in semi-arid to arid Mongolia. We have therefore
analysed the leaf wax n-alkanes and their compound-specific
δ 13 C signature of five plant species (Poaceae, Cyperaceae,      1   Introduction
Artemisia spp., Caragana spp. and Larix sp.) and topsoils
                                                                  Leaf wax biomarkers such as long-chain n-alkanes (n-C25 −
(0–5 cm) along two transects in central and southern Mongo-
                                                                  n-C35 ) are produced in the plant cuticle as a protection
lia.
                                                                  layer against environmental stress and are synthesised by
   Grasses show a distinct dominance of the n-C31 homo-
                                                                  the polyketide biosynthetic pathway, resulting in a distinct
logue, whereas the shrubs Caragana spp. and Artemisia spp.
                                                                  odd-over-even predominance (OEP; Eglinton and Hamil-
are dominated by n-C29 . Larix sp. is characterised by the
                                                                  ton, 1967; Shepherd and Wynne Griffiths, 2006). Due to
mid-chain n-alkanes n-C23 and n-C25 . From plant to top-
                                                                  their water insolubility, chemical inertness and relative resis-
soil, n-alkane patterns show the potential to differentiate
                                                                  tance against biochemical degradation, leaf wax n-alkanes
between grass-covered sites from those covered by Cara-
                                                                  stay well preserved in sediment archives over geological
gana spp. n-Alkane concentrations and odd-over-even pre-
                                                                  timescales and serve as valuable biomarkers for former envi-
dominance (OEP) of the topsoils are distinctly influenced
                                                                  ronmental conditions (Eglinton and Eglinton, 2008). During
by mean annual temperature, mean annual precipitation and
                                                                  the last decades, leaf wax n-alkanes have increasingly been
aridity, likely reflecting the degree of n-alkane degradation
                                                                  used for paleoenvironmental reconstructions in lake sedi-
and biomass production. In contrast, the average chain length
                                                                  ments (Aichner et al., 2017; Rach et al., 2017; Schwark et al.,
(ACL) and the n-alkane ratio (n-C31 /n-C29 + n-C31 ) are not
                                                                  2002; Sun et al., 2016), marine sediments (Castañeda et al.,
affected by climatic parameters and, thus, are not biased by
                                                                  2009; Rommerskirchen et al., 2006; Schefuss et al., 2005),
climate. The compound-specific δ 13 C signatures are strongly
                                                                  loess–paleosol sequences (Häggi et al., 2019; Schäfer et al.,
correlated to climate, showing a significant enrichment with
                                                                  2018; Zech et al., 2013) and fluvial sediment–paleosol se-
increasing aridity, indicating the effect of water use effi-
                                                                  quences (Bliedtner et al., 2018b).
ciency. Our calibration results suggest that long-chain n-
                                                                     The relative homologue distribution of leaf wax n-alkanes
alkanes and their compound-specific δ 13 C signatures have
                                                                  has been used as a chemotaxonomic marker to differenti-
great potential to reconstruct paleoenvironmental and pale-
                                                                  ate among vegetation forms and thus reconstruct paleoveg-
                                                                  etation: the n-alkanes n-C27 and n-C29 are thought to be

Published by Copernicus Publications on behalf of the European Geosciences Union.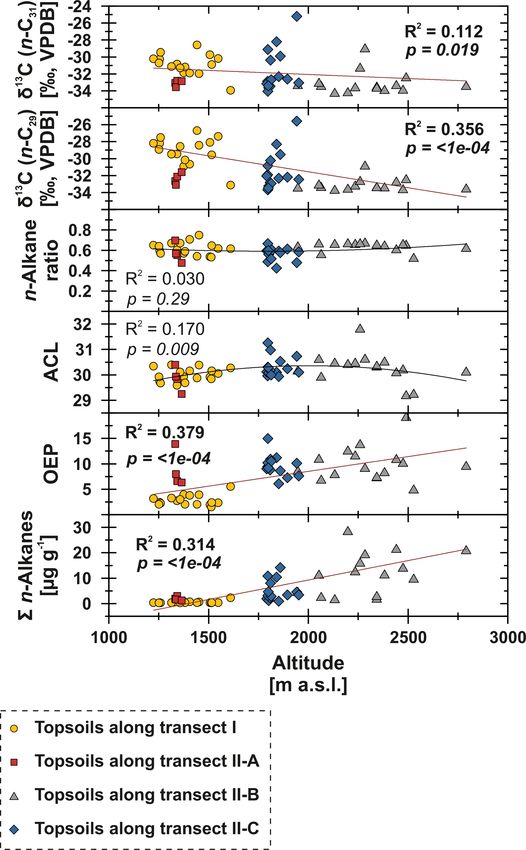
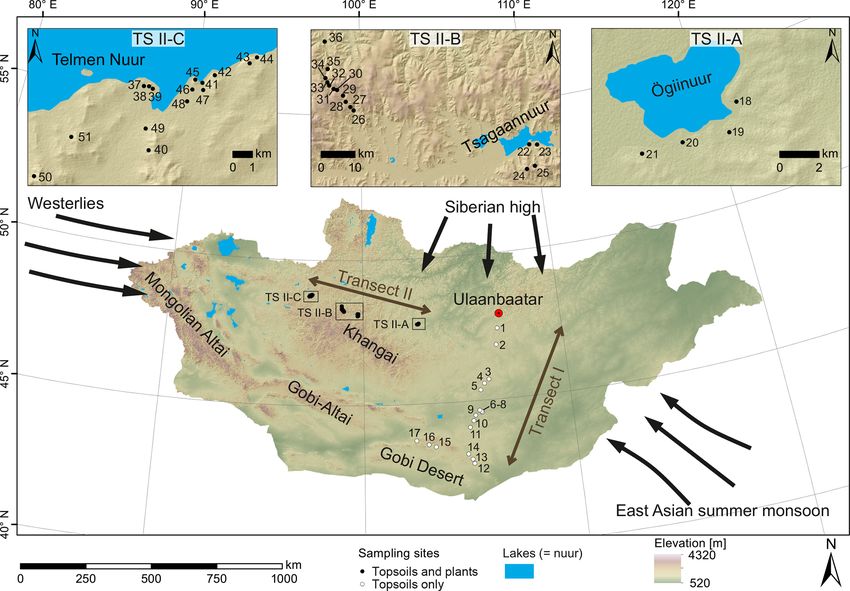
568                               J. Struck et al.: Leaf wax n-alkane pattern and compound-specific δ 13 C from Mongolia

mainly produced by deciduous trees and shrubs, whereas n-         tial climatic biases on the leaf wax signal do not exist for
C31 and n-C33 are mainly produced by grasses and herbs            Mongolia.
(Bliedtner et al., 2018a; Schäfer et al., 2016; Vogts et al.,        Thus, this study investigates leaf wax n-alkane patterns
2009). The compound-specific δ 13 C signature of leaf wax         and compound-specific δ 13 C of modern plants and topsoils
n-alkanes has also been used for reconstructing changes           from semi-arid and arid Mongolia to evaluate their poten-
in the vegetation composition of C3 (−20 ‰ to −35 ‰)              tial for regional paleovegetation and paleoclimate reconstruc-
and C4 (−10 ‰ to −14 ‰) plants (Castañeda et al., 2009;           tions. More specifically, we tested the chemotaxonomic po-
Lane, 2017; Rao et al., 2016; Rommerskirchen et al., 2006)        tential of leaf wax n-alkane patterns from five dominant plant
and give additional paleoclimatic information about drought       species and whether their homologue distribution can be used
stress and arid conditions for C3 plants (Aichner et al.,         to discriminate between woody shrubs and grasses–herbs on
2010a, b; Schäfer et al., 2018). Several studies have shown       a regional scale. Moreover, we investigate differences in the
a strong correlation between the δ 13 C leaf wax signal of        compound-specific δ 13 C signature of leaf wax from plants
C3 plants and water use efficiency (WUE) that is influenced       and topsoils and how the plant signal is incorporated into the
by precipitation, temperature and evapotranspiration and de-      topsoil. Since only the topsoils represent an averaged decadal
scribes the stomata conductance of a plant to avoid water         leaf wax signal, we check for potential environmental and cli-
loss (Diefendorf and Freimuth, 2017; Farquhar et al., 1982;       matic influences by correlating the leaf wax n-alkane patterns
Rao et al., 2017). Along a 400 mm isohyet in China, J. Wang       and δ 13 C with altitude, mean annual temperature (MAT),
et al. (2018b) have shown that the compound-specific δ 13 C       mean annual precipitation (MAP) and the aridity index (AI).
signature of leaf wax n-alkanes is strongly correlated to tem-    While we test that the n-alkane patterns are not biased by
perature, with strongest correlations observed for the aver-      climatic influences, we test the potential of leaf wax δ 13 C
age temperature of June, July and August (J. Wang et al.,         to reflect on MAT, MAP and aridity. Additionally, we test
2018b). Thus, warmer and dryer conditions cause an increase       for a potential bias from altitude on leaf wax n-alkane pat-
in WUE, resulting in an 13 C enrichment and cooler and wet-       terns and the δ 13 C signal. Therefore, our calibration results
ter conditions vice versa (Aichner et al., 2015; Castañeda        will be a base for future robust paleovegetational and paleo-
et al., 2009; Diefendorf and Freimuth, 2017; J. Wang et al.,      climate reconstructions in semi-arid and arid Mongolia using
2018b).                                                           leaf wax n-alkanes from regional sediment archives. Such la-
   Although leaf wax n-alkane patterns and compound-              custrine, loess–paleosol and colluvial sediment archives have
specific δ 13 C have been increasingly used in sediment           been increasingly investigated in semi-arid and arid Mongo-
archives for paleoenvironmental reconstructions within the        lia and could potentially be used for future paleoenvironmen-
last decades, they need to be calibrated regionally on re-        tal reconstructions based on leaf wax n-alkanes (Klinge et al.,
cent reference material before any paleoenvironmental re-         2017; Peck et al., 2002; Prokopenko et al., 2007; Rudaya and
construction can be made. The need for regional calibrations      Li, 2013; Wang et al., 2011).
has been emphasised by the fact that Bush and McInerney
(2013) questioned whether leaf wax n-alkane patterns can
discriminate between modern vegetation forms on a global          2     Material and methods
scale, while several regional studies found them discriminat-
ing on a regional scale. Although the most abundant homo-         2.1    Geographical setting and sampling
logues differ from region to region, a good discrimination
power has been reported from Europe (Schäfer et al., 2016;        Semi-arid and arid Mongolia is a highly continental region
Zech et al., 2009, 2010), the Caucasus region (Bliedtner          characterised by harsh and long winters and hot and short
et al., 2018a), North and South America (Diefendorf et al.,       summers (Dashkhuu et al., 2015). Mongolia is located at the
2015; Feakins et al., 2016; Lane, 2017), and the African rain-    interface of three major atmospheric circulation systems con-
forest and savanna (Vogts et al., 2009).                          trolling the regional climate (Fig. 1). The summer climate is
   However, when interpreting leaf wax n-alkanes and their        dominated by the East Asian summer monsoon (EASM) and
compound-specific δ 13 C signature several potential pitfalls,    the Westerlies, which provide most of the yearly moisture
such as species-specific and intra-leaf variations (Diefendorf    and precipitation during the summer months; i.e. 75 % of the
et al., 2011; Gao et al., 2015), the influence of environmen-     annual precipitation falls in June, July and August (Rao et al.,
tal and climatic factors (Carr et al., 2014; Diefendorf and       2015; Wang and Feng, 2013). The dry and cold winter cli-
Freimuth, 2017; Farquhar et al., 1982; Hoffmann et al., 2013;     mate is dominated by the Siberian high, which mostly blocks
Rao et al., 2017; Tipple et al., 2013), the dependency on alti-   the moisture supply from the Westerlies during winter (Peck
tude (Feakins et al., 2018; Hultine and Marshall, 2000), and      et al., 2002). The Mongolian climate has a north–south gra-
n-alkane degradation (Brittingham et al., 2017; Buggle et al.,    dient in MAT and MAP, with increasing MAT from north to
2010; Li et al., 2018a), have to be considered and accounted      south and MAP vice versa (Fig. 2a, b; Harris et al., 2014).
for. So far, such regional calibration studies on recent leaf     This north–south gradient in temperature and precipitation is
wax n-alkane patterns, compound-specific δ 13 C and poten-        further reflected by the AI (Fig. 2c) and in the distribution of

Biogeosciences, 17, 567–580, 2020                                                       www.biogeosciences.net/17/567/2020/
J. Struck et al.: Leaf wax n-alkane pattern and compound-specific δ 13 C from Mongolia                                         569

regional vegetation biomes with taiga and mountain and for-        2.2.2    Compound-specific δ 13 C analysis
est steppe in northern and central Mongolia and steppe and
desert steppe in southern Mongolia (Hilbig, 1995; Klinge and       Compound-specific carbon isotopes were measured for the
Sauer, 2019).                                                      most abundant n-alkanes, n-C29 and n-C31 . Isotope mea-
   Topsoils (0–5 cm) were sampled along a north–south tran-        surements were performed on an isoprime visION isotope
sect (transect I; see Fig. 1 for location) in June 2016, and       ratio mass spectrometer coupled to a gas chromatograph
plants and topsoils (0–5 cm) were sampled along an east–           (Agilent 7890B GC) equipped with an Agilent HP5GC col-
west transect (transect II; see Fig. 1 for location) in July–      umn (30 m × 320 µm × 0.25 µm film thickness) via a GC5
August 2017. Along transect II, the topsoils were sampled to-      pyrolysis–combustion interface. The GC5 operated in the
gether with the dominant plant species (5 m2 around the top-       combustion mode, with a CuO reactor at 850 ◦ C. Samples
soil sampling site), which comprise the woody shrub Cara-          were injected in splitless mode and measured in triplicates. n-
gana spp.; the grasses and herbs Poaceae, Cyperaceae and           Alkane standards (n-C27 , n-C29 and n-C33 ) with known iso-
Artemisia spp.; and Larix sp. as a coniferous tree. Artemisia      topic composition (Schimmelmann standard, Indiana) were
spp. summarises different herbaceous species and peren-            measured as duplicates after every third triplicate. The stan-
nial “shrubby” species with a woody base (e.g. Artemisia           dard deviation for the triplicate measurements was < 0.7 ‰,
frigida). Transect I covers an altitudinal range between 1224      and the standard deviation for the standards was < 0.2 ‰
and 1611 m a.s.l., and MAT and MAP range from −1.7 to              (n = 102). Carbon isotopic composition is given in the delta
5.5 ◦ C and 99 to 276 mm a−1 . Transect II covers an altitudinal   notation (δ 13 C) versus the Vienna Pee Dee Belemnite stan-
range between 1333 and 2792 m a.s.l. and a range from −7.3         dard (VPDB).
to −0.5 ◦ C and 210.8 to 276.2 mm a−1 in MAT and MAP,
respectively, and is separated into the Ögiinuur catchment         2.2.3    Data analysis
(TS II-A), an altitudinal transect (TS II-B) and the Telmen                                    P
                                                                   n-Alkane concentrations ( n-Alkane) are given in micro-
Nuur catchment (TS II-C; Fig. 2; Fick and Hijmans, 2017).
                                                                   grams per gram (µg g−1 ) dry weight and were calculated as
2.2     Leaf wax analysis                                          the sum of n-C25 to n-C35 . Additionally, we tested the n-
                                                                   alkane concentrations as the sum of n-C23 to n-C35 because
2.2.1    Leaf wax extraction and quantification                    of the high proportions of n-C23 in Larix sp. However, differ-
                                                                   ences between both n-alkane concentrations are minor, and,
Total lipids of the topsoils (∼ 35 g) from transect I were ex-     thus, we present the n-alkane concentrations including n-C23
tracted at the University of Bern, Switzerland, using acceler-     in the Supplement. The OEP was calculated according to
ated solvent extraction (Dionex ASE 200: 6.9 MPa, 100 ◦ C)         Hoefs et al. (2002) and serves as a proxy for degradation,
with 60 mL dichloromethane : methanol (DCM : MeOH; 9 :             with values below 5 indicating enhanced n-alkane degrada-
1, v/v) over three extraction cycles as described by Bliedt-       tion (Buggle et al., 2010; Zech et al., 2009, 2010):
ner et al. (2018b). The total lipids of topsoils (∼ 10 g) and
plant leaves (∼ 1 g) from transect II were extracted at the                  n-C27 + n-C29 + n-C31 + n-C33
                                                                   OEP =                                   .                   (1)
Friedrich Schiller University of Jena, Germany, using ultra-                 n-C26 + n-C28 + n-C30 + n-C32
sonic extraction with 20 mL DCM : MeOH (9 : 1, v/v) over
                                                                     The average chain length (ACL) was determined after
three cycles as described by Bliedtner et al. (2018a).
                                                                   Poynter et al. (1989) and is used to distinguish between leaf
   The total lipid extract from both transects was separated
                                                                   wax predominantly produced by deciduous trees and shrubs
over aminopropyl pipette columns (Supelco; 45 µm) into
                                                                   (n-C27 and n-C29 ) and grasses and herbs (n-C31 and n-C33 ;
(i) an apolar fraction including the n-alkanes, (ii) a more
                                                                   Bliedtner et al., 2018a):
polar fraction and (iii) an acid fraction. n-Alkanes were
eluted with ∼ 4 mL hexane and additionally cleaned over            ACL
coupled silver–nitrate (AgNO3 ) and zeolite pipette columns.
                                                                         27 · n-C27 + 29 · n-C29 + 31 · n-C31 + 33 · n-C33
n-Alkanes were subsequently dissolved in hydrofluoric acid           =                                                     .   (2)
                                                                                 n-C27 + n-C29 + n-C31 + n-C33
and liquid–liquid recovered with hexane. Identification and
quantification of the n-alkanes was performed on an Ag-              A normalised n-alkane ratio was calculated for the most
ilent 7890B gas chromatograph equipped with an Agilent             abundant n-alkanes, n-C29 and n-C31 :
HP5MS column (30 m×320 µm×0.25 µm film thickness) and
a gas chromatography–flame ionisation detector (GC–FID).                                    n-C31
                                                                   n-Alkane ratio =                      .                     (3)
For identification and quantification, external n-alkane stan-                          (n-C29 + n-C31 )
dards with a known concentration (n-alkane mix: n-C21 − n-
C40 ; Supelco) were run with each sequence.                        2.3     Statistical analysis

                                                                   Differences in n-alkane concentration, OEP, ACL, n-alkane
                                                                   ratio and compound-specific δ 13 C among plant species and

www.biogeosciences.net/17/567/2020/                                                              Biogeosciences, 17, 567–580, 2020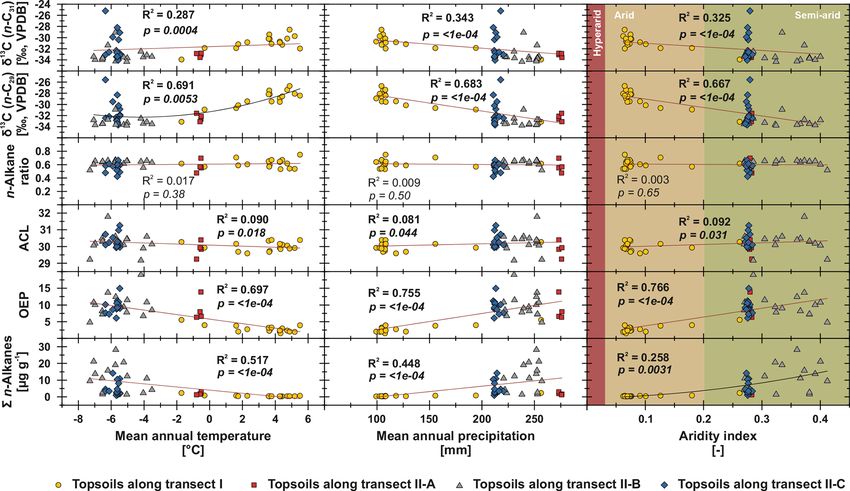
570                                 J. Struck et al.: Leaf wax n-alkane pattern and compound-specific δ 13 C from Mongolia

Figure 1. Map of Mongolia (SRTM digital elevation model). The black and white circles mark the sampling sites along transect I and II.
Black arrows indicate the influence of three major atmospheric circulation systems: the Westerlies, the East Asian summer monsoon and the
Siberian high. Submaps show (TS II-A) the Ögiinuur catchment, (TS II-B) an altitude transect near the Tsagaannuur catchment and (TS II-C)
the Telmen Nuur catchment in more detail.

Figure 2. Climate and environmental conditions of Mongolia. Mean annual temperature (a), mean annual precipitation (b) and the aridity
index (c). MAT and MAP are based on the WorldClim dataset of Fick and Hijmans (2017); the AI is based on the Global Aridity Index and
Potential Evapotranspiration Climate Database v2 of Trabucco and Zomer (2019).

between topsoils and plants were analysed using analysis of            ACL, n-alkane ratio and compound-specific δ 13 C with cli-
variance (ANOVA) followed by pairwise comparisons based                matic parameters and altitude were tested using weighted lin-
on Tukey’s honestly significant difference. Since the relative         ear or polynomial regression. The environmental parameters
homologue distribution of the n-alkanes is important for the           MAT and MAP were derived from the WorldClim 2.0 dataset
discrimination between plant species, the n-alkane patterns            (1970–2000; 30 s resolution; Fick and Hijmans, 2017) and
were analysed as compositional data according to Aitchi-               the AI from the Global Aridity Index and Potential Evapo-
son (2003). Correlations of n-alkane concentration, OEP,               transpiration (ET0) Climate Database v2 (1970–2000; 30 s

Biogeosciences, 17, 567–580, 2020                                                             www.biogeosciences.net/17/567/2020/
J. Struck et al.: Leaf wax n-alkane pattern and compound-specific δ 13 C from Mongolia 571
resolution; Trabucco and Zomer, 2019). The altitude was ex- spp. and Larix sp. tend to have the lowest values. The top-
tracted from the Shuttle Radar Topography Mission (SRTM) soils range from 0.42 to 0.75 for both transects (Fig. 4d).
data (Jarvis et al., 2008). Regressions were tested only for
the topsoils because they represent an averaged leaf wax sig- 3.2 Compound-specific δ 13 C
nal over some decades (Angst et al., 2016) and can thus be
correlated with the WorldClim and the Global Aridity Index Compound-specific δ 13 C values were measured for the most
data that represent averaged climate data over 30 years. In abundant n-alkanes, n-C29 and n-C31 (Fig. 5). Plants show
contrast, plants only reflect an annual signal of the sampling δ 13 C values between −36 ‰ and −29.5 ‰ for n-C29 and
year 2017 and cannot be correlated with the available cli- between −35.8 ‰ and −30.3 ‰ for n-C31 , with Larix sp.
matic parameters from the WorldClim and the Global Aridity being the most enriched in leaf wax 13 C among all plant
Index dataset, and also annual climate data for the sampling species. In comparison to plants, topsoils tend to be more en-
year 2017 are not available. Model selection was based on riched in 13 C, with a larger scatter, and range from −33.8 ‰
hierarchical comparison of models with increasing polyno- to −25.6 ‰ for n-C29 and from −34.3 ‰ to −25.2 ‰ for
mial order using F ratios. Goodness of fit of the final models n-C31 , with a distinct enrichment along transect I (Fig. 5).
was assessed using weighted R 2 values. All statistical analy- Compound-specific δ 13 C values of n-C29 and n-C31 differ
ses were done using the statistical software system R (R Core significantly between topsoils from transect I and transect II
Team, 2019) and the package compositions (Boogaart, 2013) but not significantly between plant species and between plant
for compositional data analysis. species and topsoils from transect II (Table 1).
4 Discussion
3 Results
4.1 n-Alkane patterns in plants
3.1 n-Alkane patterns in plants and topsoils
The plant species from Mongolia show distinct differences
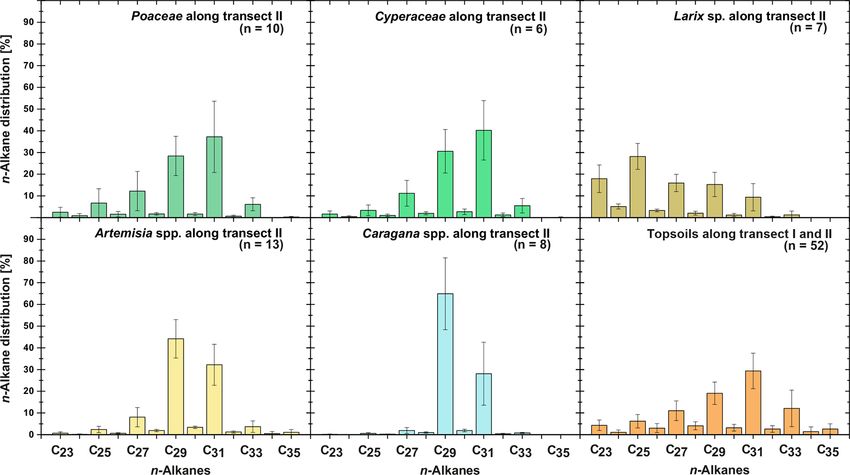
Leaf wax n-alkanes are present in all analysed plants and in their relative n-alkane homologue pattern (Fig. 3). The
topsoils and show a distinct OEP (Fig. 3). For the analysed grasses Poaceae and Cyperaceae are dominated by n-C31 ,
plants from transect II, the most abundant n-alkane homo- whereas the woody shrub Caragana spp. is dominated by
logues vary among the plant species: Poaceae and Cyper- n-C29 . These findings are in line with previous regional stud-
aceae tend to be dominated by n-C31 , and Artemisia spp. ies from the Tibetan Plateau (Cheung et al., 2015; Z. Wang
and Caragana spp. tend to be dominated by n-C29 . Larix et al., 2018), the Chinese Loess Plateau (Liu et al., 2018) and
sp. is dominated by the mid-chain n-alkane n-C25 . The top- the Caucasus region (Bliedtner et al., 2018a), which report
soils from both transects are mostly dominated by n-C31 n-C31 being mainly produced by grasses and herbs and n-
(Fig. 3). Figure 4 illustrates differences in n-alkane concen- C29 by deciduous trees and shrubs. Although Artemisia spp.
trations, OEP, ACL and the n-alkane ratio of the analysed could be expected to be herbaceous, with a dominance in n-
plant species and topsoils, and Table 1 shows the correspond- C31 , our results show a distribution maximum at n-C29 ; i.e.
ing level of significance. n-Alkane concentrations are signif- it is more similar to the woody shrub Caragana spp. than to
icantly higher in plants than topsoils (p = 5.1e−07 ). Plants the grass species. This is not necessarily contradictory and
range from 9 to 2508 µg g−1 , with Caragana spp. having corroborates the findings of J. Wang et al. (2018b) along a
significantly the highest concentrations and Larix sp. hav- 400 mm isohyet transect from north-western to central China,
ing the lowest concentrations (Fig. 4a; Table 1). n-Alkane which reports that Artemisia can grow both as herbaceous
concentrations in topsoils range from 0.2 to 59 µg g−1 , with plant and as a woody shrub (e.g. Artemisia frigida). In con-
transect I having much lower concentrations than transect II trast to the other plant species, the coniferous tree Larix sp. is
(Fig. 4a). Plants show a wide-ranging OEP, with values rang- dominated by the mid-chain n-alkanes n-C23 and n-C25 , re-
ing between 4 and 39. The highest OEP values are observed sulting in a significantly lower ACL (Fig. 4c; Table 1). How-
for Caragana spp., followed by Poaceae, Cyperaceae, and ever, statistically significant differences between the ACLs of
Artemisia spp. and Larix sp. Topsoils have generally lower the other plant species are not evident, although the relative
OEP values than plants, ranging from 1.5 up to 5.5 for tran- homologue pattern reveals differences among them (Table 1;
sect I and from 4.8 to 19 for transect II (Fig. 4b). ACL values Figs. 3 and 4c). The ACLs of the grasses and herbs Poaceae
of plants range from 28.3 to 30.8, with Larix sp. showing sig- and Cyperaceae and Artemisia spp. and the woody shrub
nificantly lower ACLs compared to the other plants (Table 1). Caragana spp. have only slight differences and a small range,
ACL values for topsoils are higher but in the same range as between 29.6 and 29.9. This is due to a strong ACL scat-
most plant species, ranging from 29.6 to 30.4 along transect tering of the grasses and herbs that overlap the ACL of the
I and from 29.2 to 31.8 along transect II (Fig. 4c). The n- woody shrubs (Fig. 4c). Thus, a clear chemotaxonomic dis-
alkane ratio shows values between 0.16 and 0.8. Poaceae and crimination between grasses and herbs and woody shrubs is
Cyperaceae tend to have the highest values, and Caragana not given by the ACL for the investigated modern plants from
www.biogeosciences.net/17/567/2020/ Biogeosciences, 17, 567–580, 2020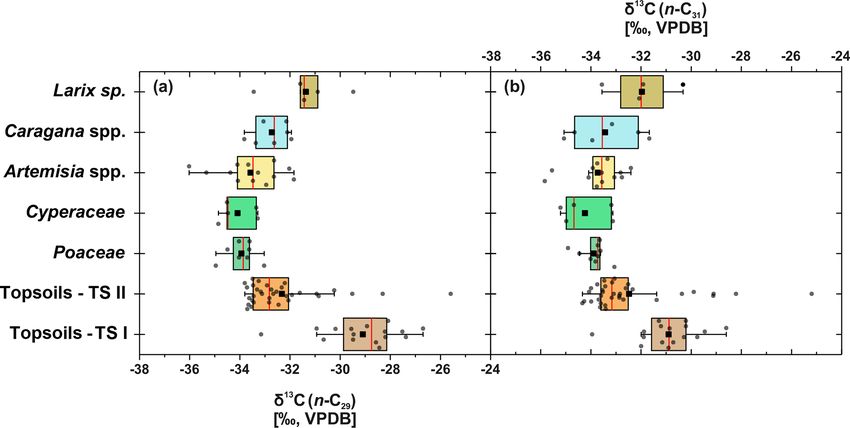
572                                 J. Struck et al.: Leaf wax n-alkane pattern and compound-specific δ 13 C from Mongolia

Figure 3. n-Alkane patterns of plants (transect II) and topsoils (transect I and II) from Mongolia. The bars show the mean values ±SD.

Table 1. ANOVA p values, indicating differences among plant species and between topsoils and plants for n-alkane pattern and compound-
specific δ 13 C (n-C29 and n-C31 ). Bold values indicate significance (α = 0.05). TS is topsoil.

                                                                                                        δ 13 C29   δ 13 C31
                                                     P
                                                       n-Alkane       OEP     ACL     n-Alkane ratio
                                                 (n-C25 – n-C35 )
                Poaceae–Cyperaceae                          1.000    0.979    1.000            0.999      1.000      0.999
                Larix sp.–Cyperaceae                        0.505    0.032    0.000            0.010      0.203      0.315
                Poaceae–Artemisia spp.                      0.999    0.392    0.986            0.069      0.998      1.000
                Poaceae–Caragana spp.                       0.000    0.000    0.861            0.000      0.814      0.995
                Poaceae–Larix sp.                           0.325    0.001    0.000            0.007      0.164      0.381
                Cyperaceae–Artemisia spp.                   0.999    0.948    0.959            0.079      0.995      0.991
                Cyperaceae–Caragana spp.                    0.000    0.000    0.802            0.000      0.812      0.965
                Caragana spp.–Artemisia spp.                0.000    0.000    0.991            0.185      0.928      0.999
                Larix sp.–Artemisia spp.                    0.137    0.083    0.000            0.806      0.230      0.425
                Larix sp.–Caragana spp.                     0.000    0.000    0.004            0.946      1.826      0.734
                TS Transect II–Poaceae                      0.063    0.000    0.204            0.801      0.085      0.198
                TS Transect II–Cyperaceae                   0.259    0.075    0.658             0.99      0.162      0.219
                TS Transect II–Artemisia spp.               0.006    0.251    0.012            0.000      0.132      0.181
                TS Transect II–Caragana spp.                0.000    0.000    0.009            0.000      0.994      0.799
                TS Transect II–Larix sp.                    1.000    0.573    0.000            0.000      0.818      0.996
                TS Transect I–TS Transect II                0.003    0.000    0.082            0.273      0.000      0.006

Mongolia. A better chemotaxonomic discrimination is pro-                ratio of Artemisia spp. lies in between the woody shrubs and
vided by the n-alkane ratio n-C31 / (n-C29 + n-C31 ), which             grasses, most likely because of their ability to grow as both
is based on the most abundant homologues, n-C29 and n-                  herbaceous and woody shrubs (Fig. 4d). This is further ex-
C31 . The n-alkane ratio significantly separates the grasses            pressed statistically, as the n-alkane ratio of Artemisia spp.
Poaceae and Cyperaceae from the woody shrub Caragana                    is equal to that calculated from both Caragana spp. and the
spp. and the coniferous tree Larix sp. (Fig. 4d). The n-alkane          grass species (Table 1). Besides Artemisia spp., the n-alkane

Biogeosciences, 17, 567–580, 2020                                                              www.biogeosciences.net/17/567/2020/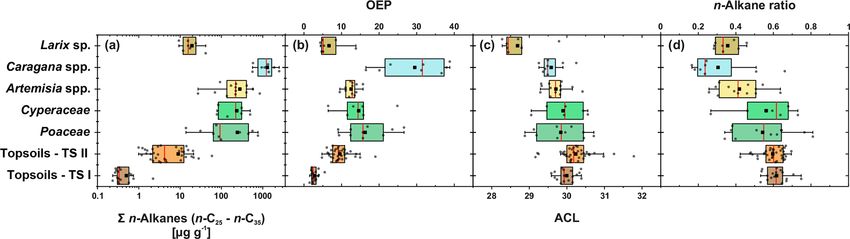
J. Struck et al.: Leaf wax n-alkane pattern and compound-specific δ 13 C from Mongolia                                                   573

Figure 4. n-Alkane concentration (n-C25 − n-C35 ) (a), OEP (b), ACL (c) and n-alkane ratio (n-C31 / (n-C29 + n-C31 )) (d) of plants and top-
soils from Mongolia (n: Larix sp. = 7, Cyperaceae = 6, Poaceae = 10, Caragana spp. = 8, Artemisia spp. = 13, topsoils TS I = 17, topsoils
TS II = 35). The boxplots indicate median values (red lines), mean values (black squares), interquartile ranges with lower (25 %) and upper
(75 %) quartiles (box), outlier (whiskers), and investigated samples (grey circles). See Table 1 for statistics.

Figure 5. Compound-specific δ 13 C of plants and topsoils from Mongolia. (a) Compound-specific δ 13 C29 (n: Larix sp. = 5, Cyperaceae = 5,
Poaceae = 8, Caragana spp. = 7, Artemisia spp. = 13, topsoils TS I = 16, topsoils TS II = 34). (b) δ 13 C31 (n: Larix sp. = 4, Cyperaceae = 5,
Poaceae = 9, Caragana spp. = 6, Artemisia sp. = 13, topsoils TS I = 16, topsoils TS II = 34). The boxplots indicate median values (red lines),
mean values (black squares), interquartile ranges with lower (25 %) and upper (75 %) quartiles (box), outlier (whiskers), and investigated
samples (grey circles). See Table 1 for statistics.

ratio has the chemotaxonomic potential to discriminate sig-              4.2    Compound-specific δ 13 C of plants
nificantly between Larix sp. and grasses as well as between
Caragana spp. and grasses. However, the n-alkane patterns
                                                                         The compound-specific δ 13 C values of the n-alkanes from
from Larix sp. with their mid-chain dominance have to be in-
                                                                         our investigated plants from transect II show consistent δ 13 C
terpreted with caution when comparing species-specific dif-
                                                                         values among the plant species, except for Larix sp., and
ferences to the long-chain dominated plant species, which
                                                                         are in a typical range of C3 plants (Fig. 5; Tipple and Pa-
is mostly due to the fact that Larix sp. only produce small
                                                                         gani, 2007). Although Pyankov et al. (2000) have reported
amounts of n-alkanes. When incorporated into the soil, the
                                                                         C4 plants in Mongolia among 16 plant families, including
coniferous n-alkane signal from Larix sp. should become
                                                                         Poaceae, which are not evident along our sampled plant
overproportionately overprinted by the undergrowth of the
                                                                         transect. While some C4 plants have been found in the
grasses and herbs (Diefendorf et al., 2011; Schäfer et al.,
                                                                         Khangai Mountains, their distribution is mainly limited to the
2016).
                                                                         semi-arid steppe and semi-desert areas in southern Mongo-

www.biogeosciences.net/17/567/2020/                                                                  Biogeosciences, 17, 567–580, 2020
574 J. Struck et al.: Leaf wax n-alkane pattern and compound-specific δ 13 C from Mongolia
lia and the Gobi desert, i.e. beyond our plant sampling sites show a dominance of n-C29 (Supplement). Thus, the domi-
(Pyankov et al., 2000; Su et al., 2011). Statistically signifi- nant n-C29 signal produced by the woody shrubs is also re-
cant differences did not exist between the most abundant ho- flected in the respective topsoils. This is further expressed
mologues, n-C29 and n-C31 (p = 1), indicating that no differ- by lower ACLs and n-alkane ratios for those topsoils, which
ent fractionation occurred during biosynthesis (J. Wang et al., explains the scattering towards n-C29 in ACL and 0.4 for the
2018b). Consistent δ 13 C values between the most abundant n-alkane ratio, respectively (Fig. 4c, d). At sites covered with
homologues are in good agreement with compound-specific Larix sp., the mid-chain-length dominance of Larix sp. is not
δ 13 C analyses of three Artemisia species (Artemisia argyi, reflected in the respective topsoils, which are mainly dom-
Artemisia capillaris and Artemisia scoparia) along a 400 mm inated by n-C31 n-alkanes. Thus, n-alkanes from Larix sp.
isohyet in China (J. Wang et al., 2018b). While no differences must become strongly diluted from plant to topsoil, and the
are found between the δ 13 C values of the grasses and herbs topsoils reflect mostly the n-alkanes from the grassy under-
and woody shrubs, only Larix sp. is enriched up to 2 ‰, but growth, as previously shown by Schäfer et al. (2016) for sev-
this is still in the range of C3 plants (Fig. 5; Table 1). Such eral coniferous sites, including Larix, Picea, Abies and Pinus.
an enrichment of coniferous trees compared to other plants Compared to the plants, the isotopic signature of the topsoils
might be explained by differences in species-specific frac- is slightly more enriched but reveal no statistical significance
tionation (Diefendorf et al., 2015). (Fig. 5; Table 1), which is in line with previous studies and
might reflect an enrichment by diagenesis from litter to top-
4.3 Comparing n-alkane patterns and soil or a change in vegetation composition (Wu et al., 2019,
compound-specific δ 13 C of plants versus topsoils and references therein).
Environmental information of the plants’ compound-
4.3.1 The leaf wax signal from plants to topsoils along specific δ 13 C signal only reflects one vegetation period,
transect II whereas the topsoils’ compound-specific δ 13 C signal re-
flects environmental variability on decadal timescales, which
Along transect II, modern plants have higher n-alkane con- might explain the 13 C-enriched leaf wax n-alkanes in top-
centration than the topsoils, with Artemisia spp. and Cara- soils. However, one topsoil (TLC4 Ah1) shows a strong 13 C
gana spp. having significantly higher n-alkane concentra- enrichment of up to ∼ −25 ‰. Such an enrichment might be
tions than the respective topsoils (Fig. 4a; Table 1). Thus, explained by n-alkane contributions from succulent plants,
lower n-alkane concentration in the topsoils indicates that n- which tend to be more enriched in 13 C within the range of
alkanes become diluted during the incorporation from plant C3 plants (Boom et al., 2014). Succulents were growing on
biomass into the topsoil (Fig. 4a). Likewise, the OEP de- stone-rich, thin topsoils in the catchment of Telmen Nuur
creases from plants to topsoil and indicates enhanced organic (Fig. 1; TS II-C). For comparison, we sampled the succulent
matter degradation (Buggle et al., 2010; Schäfer et al., 2016) Orostachys malacophylla from the Telmen catchment and
and microbial alteration (Fig. 4b; Schulz et al., 2012). De- analysed its compound-specific δ 13 C isotopes, which yield
spite possible degradation effects during soil development, −24.7 ‰ for n-C29 (n = 1) and −25.03 ‰ for n-C31 (n = 1).
the topsoils show distinct OEP values between 4.8 and 19, Thus, increased inputs of succulent δ 13 C might best explain
still indicating good preservation (Zech et al., 2009). Along the enriched isotopes in the Telmen catchment and the ex-
transect II, one exception in terms of the higher n-alkane treme value of ∼ −25 ‰ from site TLC4.
concentration and OEP is TSC10 Ah1, showing 59 µg g−1
and 19, respectively (Fig. 1; sampling site 25). Site TSC10 4.3.2 The leaf wax signal of the topsoils along both
is characterised by stagnating soil conditions with a dis- transects
tinct organic rich topsoil, limiting organic matter degradation
and microbial alteration of n-alkanes (Hoefs et al., 2002). The topsoils of both Mongolian transects show distinct
Thus, TSC10 Ah1 remains exceptional and not comparable differences in n-alkane concentration and OEP, which are
to the other topsoils from transects II. Overall, decreasing higher along transect II and decrease along transect I. This
concentrations and OEP values from plants to topsoils are in is mostly due to the fact that n-alkane production and degra-
good agreement with other regional studies (Bliedtner et al., dation are influenced by the climatic gradient along transect
2018a; Howard et al., 2018; Li et al., 2018b; Schäfer et al., I (see Sect. 4.4 and Fig. 2 for more detailed discussion).
2016; Zech et al., 2009). Besides some n-C29 dominated sites with Caragana spp.,
For the topsoils, n-C31 is on average the most abundant n- the ACL and the n-alkane ratio show the dominance of n-
alkane homologue, indicating a typical n-alkane pattern pro- C31 , which indicates the n-alkane origin from the grasses
duced by grasses (Fig. 3; Bliedtner et al., 2018a). The only Poaceae and Cyperaceae (Fig. 4; Bliedtner et al., 2018a;
exceptions are sites covered with Caragana spp. (n = 8), Schäfer et al., 2016; Vogts et al., 2009; Zech et al., 2010).
where higher amounts of n-C29 are evident within the respec- This is further expressed by the results of ANOVA because
tive topsoils and the two Caragana-covered topsoils TLC4 the ACL and n-alkane ratios from topsoils and grasses are
Ah1 and TLC6 Ah1 (Fig. 1; sampling sites 40 and 42) even not statistically different (Table 1).
Biogeosciences, 17, 567–580, 2020 www.biogeosciences.net/17/567/2020/J. Struck et al.: Leaf wax n-alkane pattern and compound-specific δ 13 C from Mongolia 575
Figure 6. n-Alkane concentration (n-C25 – n-C35 ), OEP, ACL, n-alkane ratio (n-C31 / (n-C29 + n-C31 )) and compound-specific δ 13 C (n-
C29 and n-C31 ) from Mongolian topsoils plotted against climatic parameters (MAP, MAT and AI; Fick and Hijmans, 2017; Trabucco and
Zomer, 2019). Red trend lines illustrate linear regressions, and black lines illustrate polynomial regressions. Bold values indicate significance
(α = 0.05).
4.4 Climatic influences on topsoil n-alkane patterns trast, sites along transect II-B (above 2000 m a.s.l.) describe
and compound-specific δ 13 C a favourable area for plant growth and thus an increase in n-
alkane concentrations and OEP (Fig. 7). However, especially
To test potential climatic influences on our n-alkane prox- transect II-B and II-C are characterised by a distinct scatter,
ies, we correlate them with MAT, MAP and AI (Fig. 6). which is mainly the result of variations in plant physiology
The n-alkane patterns show that n-alkane concentrations and site-specific and micro-climatic characteristics which are
in topsoils and their preservation (OEP) are correlated not not covered by the reanalysis data.
only to climatic parameters but also to altitude, indicating Previous studies have shown correlations between the pro-
higher n-alkane concentrations and better n-alkane preser- duction of the most abundant homologues with climatic pa-
vation above 2000 m a.s.l. (Fig. 7; transect II-B). Since alti- rameters and altitude; i.e. common vegetation proxies such
tude generally controls MAT (R 2 = 0.624) and MAP (R 2 = as the ACL and n-alkane ratio could reflect changes in MAT,
0.395), we suggest that variations along the investigated tran- since plants tend to produce longer n-alkanes as a protec-
sects are primarily climate induced. Thus, we detected MAT tion against water loss (Bush and McInerney, 2013; Feakins
(R 2 = 0.517, p =< 1e − 04) as the main climatic control pa- et al., 2016; Sachse et al., 2006; Tipple et al., 2013; J. Wang
rameter on n-alkane concentrations for the topsoils from et al., 2018b, a). However, this could not be observed by the
both transects. Correlations of n-alkane concentration with n-alkanes from Mongolian topsoils, since the ACL and the
MAP (R 2 = 0.448, p =< 1e − 04) and AI (R 2 = 0.258, p = n-alkane ratio as common vegetation proxies show no corre-
0.0031) are likewise significant, indicating a clear correla- lations with MAT, MAP, AI or altitude (Figs. 6, 7).
tion (Fig. 6). We conclude that lower n-alkane concentra- In contrast, compound-specific δ 13 C values of the top-
tions probably indicate reduced biomass production and en- soils correlate significantly with climatic parameters. Our re-
hanced n-alkane degradation in the topsoils. The former even sults show an enrichment in 13 C with increasing temperature,
intensifies when combined with livestock grazing (Kölbl aridity and decreasing precipitation (Fig. 6). This climate-
et al., 2011, and references therein), especially along tran- induced enrichment in 13 C follows mainly the north–south
sect I (sampling sites 1–17), where biomass production is gradient in decreasing MAP and increasing MAT along tran-
reduced and overgrazing occurs extensively (Fig. 6). In con- sect I from central Mongolia into the Gobi Desert. The
www.biogeosciences.net/17/567/2020/ Biogeosciences, 17, 567–580, 2020576 J. Struck et al.: Leaf wax n-alkane pattern and compound-specific δ 13 C from Mongolia
shall, 2000, and references therein). However, our data show
the opposite behaviour, indicating that the observed 13 C en-
richment is based on stomata conductance induced by cli-
mate (water stress) and not by altitude (Figs. 6, 7). Thus, the
13 C enrichment basically indicates the photorespiration of C
3
plants, affected by water availability and evapotranspiration
and, thus, the WUE (Tipple and Pagani, 2007; Diefendorf
and Freimuth, 2017).
5 Conclusions
This study investigates leaf wax n-alkane patterns and
compound-specific δ 13 C of modern plants and topsoils from
semi-arid and arid Mongolia to test their chemotaxonomic
potential and dependency on climate. Our results provide the
first regional calibration of leaf wax n-alkanes for semi-arid
and arid Mongolia, with the following results.
i. Caragana spp., Artemisia spp. and grasses (Poaceae
and Cyperaceae) from semi-arid and arid Mongolia
show distinct differences in their relative n-alkane pat-
terns. n-Alkanes from the grasses are clearly dominated
by n-C31 , whereas the woody shrub Caragana spp. is
dominated by n-C29 . Since Artemisia species can grow
both as herbaceous and woody shrubs, Artemisia spp.
does not show a typical n-C31 dominance but is rather
more equal to Caragana spp., with a dominance in n-
C29 . Larix sp. is dominated by the mid-chain n-alkanes
n-C23 and n-C25 . However, Larix sp. produces only
few amounts of n-alkanes, and its dominance of mid-
chain n-alkanes is not distinct in the respective top-
soils. Thus, n-alkanes are not useful for reconstruct-
ing changes in the abundance of Larix sp. Although
the ACL reveals no potential to discriminate between
Figure 7. n-Alkane concentration (n-C25 – n-C35 ), OEP, ACL, plant species, the most abundant n-alkanes, n-C29 and
n-alkane ratio (n-C31 / (n-C29 + n-C31 )) and compound-specific
n-C31 , allow for discriminating between woody shrubs
δ 13 C (n-C29 and n-C31 ) from Mongolian topsoils plotted against
altitude (m a.s.l.; Jarvis et al., 2008). Red trend lines illustrate linear
and grasses, which is expressed in the n-alkane ratio n-
regressions, and black lines illustrate polynomial regressions. Bold C31 /n-C29 + n-C31 .
values indicate significance (α = 0.05). ii. From plants to topsoils of transect II, the decrease in
n-alkane concentrations and OEP values indicates n-
alkane dilution with mineral soil components and on-
only exceptions are the extreme values near Telmen Nuur,
going n-alkane degradation. The n-alkane pattern of the
which are mostly due to the input of the 13 C-enriched
topsoils is mainly characterised by a dominance of n-
succulent Orostachys malacophylla. As already proposed
C31 , indicating dominant input from grasses. Caragana-
by Diefendorf et al. (2010), MAP is an intense predictor
covered sites tend to reflect the homologue pattern of
of δ 13 C (n-C29 : R 2 = 0.683, p =< 1e − 04; n-C31 : R 2 =
Caragana spp., with n-C29 being the most dominant n-
0.343, p =< 1e − 04), which is further expressed in distinct
alkane. Topsoils under Larix sp. are dominated by the
linear correlations with the AI (Fig. 6). However, δ 13 C also
input from the grassy undergrowth. There are no sig-
correlates with altitude; i.e. leaf wax 13 C shows a signifi-
nificant differences in compound-specific δ 13 C between
cant depletion with increasing altitude. Previous studies have
plant species and topsoils. Topsoils tend to be 2 ‰ more
shown strong positive correlations between δ 13 C and alti-
enriched compared to the plants, indicating diagenesis
tude, indicating enhanced 13 C enrichment due to an altitude
from litter to topsoil.
effect (Feakins et al., 2018) and/or environmental and cli-
matic plant physiological adaptions, like a decrease in stom- iii. n-Alkane concentrations and OEP values from Mon-
atal conductance with increasing altitude (Hultine and Mar- golian topsoils are significantly correlated to climatic
Biogeosciences, 17, 567–580, 2020 www.biogeosciences.net/17/567/2020/J. Struck et al.: Leaf wax n-alkane pattern and compound-specific δ 13 C from Mongolia 577
parameters and decrease with increasing MAT and de- and sample logistics. JuS, MB, PS and RZ wrote the paper, with
creasing MAP. In contrast, our data indicate that the contributions from JeS and EB.
n-alkane patterns from the topsoils (ACL, n-alkane ra-
tio) are not influenced by climatic parameters, and, thus,
the n-alkane ratio can reliably be used to detect and re- Competing interests. The authors declare that they have no conflict
construct differences between the vegetation forms of of interest.
grasses and woody shrubs. Although increasing alti-
tude correlates with increasing n-alkane concentrations
and OEP, altitude has no influences on the ACL and Acknowledgements. We thank the Swiss National Science Founda-
tion (SNF) for funding (SNF: 150590). Furthermore we acknowl-
n-alkane ratio. For compound-specific δ 13 C of the top-
edge our logistic partners in Mongolia and all field trip partici-
soils, strong correlations exist with increasing MAT and pants (2017 and 2018). For assistance in the laboratory, we would
decreasing MAP, indicating an enhanced enrichment like to thank Magdalena Wagner and Felix Freitag, as well as
in 13 C with increasing aridity and drought stress. Al- Michael Zech, for scientific discussion.
though, δ 13 C and altitude are also significantly negative
correlated, the influence of altitude is negligible, since
MAT decreases and MAP increases with altitude. Thus, Financial support. This research has been supported by the SNF
leaf wax δ 13 C is a valuable proxy for changes in climate (grant no. PP00P2-150590).
and water use efficiency in semi-arid and arid Mongolia.
Our results show that the n-alkane homologues n-C29 and
Review statement. This paper was edited by Frank Hagedorn and
n-C31 have the chemotaxonomic power to differentiate be-
reviewed by two anonymous referees.
tween grasses and the woody shrub Caragana spp. Future
studies on plant n-alkane patterns should include a detailed
identification of plants regarding different species of each
plant genus to reveal the full power of the n-alkane ratio as References
a vegetation proxy. This is particularly the case for different
Artemisia species, which can so far not be separated from Aichner, B., Herzschuh, U., and Wilkes, H.: Influence
grasses and woody shrubs. While the n-alkane patterns are of aquatic macrophytes on the stable carbon isotopic
not biased by climatic influences, compound-specific δ 13 C signatures of sedimentary organic matter in lakes on
indicates a strong climatic dependency. Thus, n-alkanes and the Tibetan Plateau, Org. Geochem., 41, 706–718,
their compound-specific δ 13 C can be potentially used as https://doi.org/10.1016/j.orggeochem.2010.02.002, 2010a.
valuable proxies for future paleoenvironmental reconstruc- Aichner, B., Wilkes, H., Herzschuh, U., Mischke, S., and Zhang,
tion based on leaf wax n-alkanes in sediment archives from C.: Biomarker and compound-specific δ 13 C evidence for chang-
ing environmental conditions and carbon limitation at Lake
semi-arid and arid Mongolia.
Koucha, eastern Tibetan Plateau, J. Paleolimnology, 43, 873–
899, https://doi.org/10.1007/s10933-009-9375-y, 2010b.
Aichner, B., Feakins, S. J., Lee, J. E., Herzschuh, U., and Liu, X.:
Data availability. Climate reanalysis data used in this study are High-resolution leaf wax carbon and hydrogen isotopic record of
based on the WorldClim 2 dataset of Fick and Hijmans (2017) the late Holocene paleoclimate in arid Central Asia, Clim. Past,
and the Global Aridity Index and Potential Evapotranspiration 11, 619–633, https://doi.org/10.5194/cp-11-619-2015, 2015.
(ET0) Climate Database v2 of Trabucco and Zomer (2019), Aichner, B., Hilt, S., Périllon, C., Gillefalk, M., and Sachse,
which can be found online at http://worldclim.org/version2 (last D.: Biosynthetic hydrogen isotopic fractionation factors dur-
access: 30 January 2020) and https://cgiarcsi.community/data/ ing lipid synthesis in submerged aquatic macrophytes: Effect of
global-aridity-and-pet-database/ (last access: 30 January 2020), re- groundwater discharge and salinity, Org. Geochem., 113, 10–16,
spectively. https://doi.org/10.1016/j.orggeochem.2017.07.021, 2017.
The dataset that is used in this study is available in the Supple- Aitchison, J.: The statistical analysis of compositional data, Black-
ment. burn Press, Caldwell, 460 pp., 2003.
Angst, G., John, S., Mueller, C. W., Kögel-Knabner, I., and Rethe-
meyer, J.: Tracing the sources and spatial distribution of organic
Supplement. The supplement related to this article is available on- carbon in subsoils using a multi-biomarker approach, Sci. Rep.,
line at: https://doi.org/10.5194/bg-17-567-2020-supplement. 6, 29478, https://doi.org/10.1038/srep29478, 2016.
Bliedtner, M., Schäfer, I. K., Zech, R., and von Suchodoletz,
H.: Leaf wax n-alkanes in modern plants and topsoils from
Author contributions. JuS, MB and RZ designed the study. MB and eastern Georgia (Caucasus) – implications for reconstruct-
RZ collected samples along transect I in 2016. JuS and RZ collected ing regional paleovegetation, Biogeosciences, 15, 3927–3936,
samples along transect II in 2017. JuS carried out the major part of https://doi.org/10.5194/bg-15-3927-2018, 2018a.
the laboratory analyses and was assisted by PS and MB. JeS con- Bliedtner, M., Zech, R., Kühn, P., Schneider, B., Zielhofer,
ducted the statistical analyses. EB organised the plant determination C., and von Suchodoletz, H.: The potential of leaf wax
www.biogeosciences.net/17/567/2020/ Biogeosciences, 17, 567–580, 2020578 J. Struck et al.: Leaf wax n-alkane pattern and compound-specific δ 13 C from Mongolia
biomarkers from fluvial soil-sediment sequences for paleoveg- Eglinton, G. and Hamilton, R. J.: Leaf epicuticular waxes, Science
etation reconstructions – Upper Alazani River, central southern (New York, NY), 156, 1322–1335, 1967.
Greater Caucasus (Georgia), Quaternary Sci. Rev., 196, 62–79, Eglinton, T. I. and Eglinton, G.: Molecular proxies for
https://doi.org/10.1016/j.quascirev.2018.07.029, 2018b. paleoclimatology, Earth Planet. Sc. Lett., 275, 1–16,
Boogaart, K. G. v. d.: Analyzing compositional data with R, https://doi.org/10.1016/j.epsl.2008.07.012, 2008.
Springer, Berlin, Heidelberg, 258 pp., 2013. Farquhar, G. D., O’Leary, M. H., and Berry, J. A.: On the Rela-
Boom, A., Carr, A. S., Chase, B. M., Grimes, H. L., and Mead- tionship Between Carbon Isotope Discrimination and the Inter-
ows, M. E.: Leaf wax n-alkanes and δ 13 C values of CAM cellular Carbon Dioxide Concentration in Leaves, Aust. J. Plant
plants from arid southwest Africa, Org. Geochem., 67, 99–102, Physiol., 9, 121–137, https://doi.org/10.1071/PP9820121, 1982.
https://doi.org/10.1016/j.orggeochem.2013.12.005, 2014. Feakins, S. J., Peters, T., Wu, M. S., Shenkin, A., Sali-
Brittingham, A., Hren, M. T., and Hartman, G.: Microbial nas, N., Girardin, C. A., Bentley, L. P., Blonder, B., En-
alteration of the hydrogen and carbon isotopic composi- quist, B. J., Martin, R. E., Asner, G. P., and Malhi,
tion of n-alkanes in sediments, Org. Geochem., 107, 1–8, Y.: Production of leaf wax n-alkanes across a tropical
https://doi.org/10.1016/j.orggeochem.2017.01.010, 2017. forest elevation transect, Org. Geochem., 100, 89–100,
Buggle, B., Wiesenberg, G. L., and Glaser, B.: Is there https://doi.org/10.1016/j.orggeochem.2016.07.004, 2016.
a possibility to correct fossil n-alkane data for postsedi- Feakins, S. J., Wu, M. S., Ponton, C., Galy, V., and West,
mentary alteration effects?, Appl. Geochem., 25, 947–957, A. J.: Dual isotope evidence for sedimentary integration
https://doi.org/10.1016/j.apgeochem.2010.04.003, 2010. of plant wax biomarkers across an Andes-Amazon ele-
Bush, R. T. and McInerney, F. A.: Leaf wax n-alkane distribu- vation transect, Geochim. Cosmochim. Ac., 242, 64–81,
tions in and across modern plants: Implications for paleoecology https://doi.org/10.1016/j.gca.2018.09.007, 2018.
and chemotaxonomy, Geochim. Cosmochim. Ac., 117, 161–179, Fick, S. E. and Hijmans, R. J.: WorldClim 2: New 1-km spatial res-
https://doi.org/10.1016/j.gca.2013.04.016, 2013. olution climate surfaces for global land areas, Int. J. Climatol.,
Carr, A. S., Boom, A., Grimes, H. L., Chase, B. M., Meadows, 37, 4302–4315, https://doi.org/10.1002/joc.5086, 2017.
M. E., and Harris, A.: Leaf wax n-alkane distributions in arid Gao, L., Guimond, J., Thomas, E., and Huang, Y.: Major
zone South African flora: Environmental controls, chemotaxon- trends in leaf wax abundance, δ 2 H and δ 13 C values along
omy and palaeoecological implications, Org. Geochem., 67, 72– leaf venation in five species of C3 plants: Physiological
84, https://doi.org/10.1016/j.orggeochem.2013.12.004, 2014. and geochemical implications, Org. Geochem., 78, 144–152,
Castañeda, I. S., Mulitza, S., Schefuss, E., Lopes dos Santos, https://doi.org/10.1016/j.orggeochem.2014.11.005, 2015.
Raquel A., Sinninghe Damste, J. S., and Schouten, S.: Wet Häggi, C., Eglinton, T. I., Zech, W., Sosin, P., and Zech, R.:
phases in the Sahara/Sahel region and human migration patterns A 250 ka leaf-wax δD record from a loess section in Darai
in North Africa, P. Natl. Acad. Sci. USA, 106, 20159–20163, Kalon, Southern Tajikistan, Quaternary Sci. Rev., 208, 118–128,
https://doi.org/10.1073/pnas.0905771106, 2009. https://doi.org/10.1016/j.quascirev.2019.01.019, 2019.
Cheung, M.-C., Zong, Y., Wang, N., Aitchison, J. C., and Zheng, Harris, I., Jones, P. D., Osborn, T. J., and Lister, D. H.: Up-
Z.: δ 13 C org and n-alkane evidence for changing wetland dated high-resolution grids of monthly climatic observations
conditions during a stable mid-late Holocene climate in the – the CRU TS3.10 Dataset, Int. J. Climatol., 34, 623–642,
central Tibetan Plateau, Palaeogeogr. Palaeocl., 438, 203–212, https://doi.org/10.1002/joc.3711, 2014.
https://doi.org/10.1016/j.palaeo.2015.08.007, 2015. Hilbig, W.: The vegetation of Mongolia, SPB Acad. Publ, Amster-
Dashkhuu, D., Kim, J. P., Chun, J. A., and Lee, W.-S.: dam, 258 pp., 1995.
Long-term trends in daily temperature extremes over Hoefs, M. J., Rijpstra, W. C., and Sinninghe Damsté, J. S.:
Mongolia, Weather and Climate Extremes, 8, 26–33, The influence of oxic degradation on the sedimentary
https://doi.org/10.1016/j.wace.2014.11.003, 2015. biomarker record I: Evidence from Madeira Abyssal Plain
Diefendorf, A. F. and Freimuth, E. J.: Extracting the most from turbidites, Geochim. Cosmochim. Ac., 66, 2719–2735,
terrestrial plant-derived n-alkyl lipids and their carbon isotopes https://doi.org/10.1016/S0016-7037(02)00864-5, 2002.
from the sedimentary record: A review, Org. Geochem., 103, 1– Hoffmann, B., Kahmen, A., Cernusak, L. A., Arndt, S. K., and
21, https://doi.org/10.1016/j.orggeochem.2016.10.016, 2017. Sachse, D.: Abundance and distribution of leaf wax n-alkanes
Diefendorf, A. F., Mueller, K. E., Wing, S. L., Koch, P. L., in leaves of Acacia and Eucalyptus trees along a strong humid-
and Freeman, K. H.: Global patterns in leaf δ 13 C dis- ity gradient in northern Australia, Org. Geochem., 62, 62–67,
crimination and implications for studies of past and fu- https://doi.org/10.1016/j.orggeochem.2013.07.003, 2013.
ture climate, P. Natl. Acad. Sci. USA, 107, 5738–5743, Howard, S., McInerney, F. A., Caddy-Retalic, S., Hall, P. A., and
https://doi.org/10.1073/pnas.0910513107, 2010. Andrae, J. W.: Modelling leaf wax n-alkane inputs to soils along
Diefendorf, A. F., Freeman, K. H., Wing, S. L., and Graham, H. V.: a latitudinal transect across Australia, Org. Geochem., 121, 126–
Production of n-alkyl lipids in living plants and implications for 137, https://doi.org/10.1016/j.orggeochem.2018.03.013, 2018.
the geologic past, Geochim. Cosmochim. Ac., 75, 7472–7485, Hultine, K. R. and Marshall, J. D.: Altitude trends in conifer leaf
https://doi.org/10.1016/j.gca.2011.09.028, 2011. morphology and stable carbon isotope composition, Oecologia,
Diefendorf, A. F., Leslie, A. B., and Wing, S. L.: Leaf 123, 32–40, https://doi.org/10.1007/s004420050986, 2000.
wax composition and carbon isotopes vary among major Jarvis, A., Reuter, H. I., Nelson, A., and Guevara, E.: Hole-filled
conifer groups, Geochim. Cosmochim. Ac., 170, 145–156, seamless SRTM data V4, International Centre for Tropical Agri-
https://doi.org/10.1016/j.gca.2015.08.018, 2015. culture (CIAT), http://srtm.csi.cgiar.org (last access: 30 January
2020), 2008.
Biogeosciences, 17, 567–580, 2020 www.biogeosciences.net/17/567/2020/J. Struck et al.: Leaf wax n-alkane pattern and compound-specific δ 13 C from Mongolia 579
Klinge, M. and Sauer, D.: Spatial pattern of Late Glacial and R Core Team: R: A Language and Environment for Statistical
Holocene climatic and environmental development in Western Computing, https://www.R-project.org/ (last access: 30 January
Mongolia – A critical review and synthesis, Quaternary Sci. Rev., 2020), 2019.
210, 26–50, https://doi.org/10.1016/j.quascirev.2019.02.020, Rach, O., Engels, S., Kahmen, A., Brauer, A., Martín-Puertas,
2019. C., van Geel, B., and Sachse, D.: Hydrological and ecologi-
Klinge, M., Lehmkuhl, F., Schulte, P., Hülle, D., and Not- cal changes in western Europe between 3200 and 2000 years
tebaum, V.: Implications of (reworked) aeolian sedi- BP derived from lipid biomarker δD values in lake Meer-
ments and paleosols for Holocene environmental change felder Maar sediments, Quaternary Sci. Rev., 172, 44–54,
in Western Mongolia, Geomorphology, 292, 59–71, https://doi.org/10.1016/j.quascirev.2017.07.019, 2017.
https://doi.org/10.1016/j.geomorph.2017.04.027, 2017. Rao, M. P., Davi, N. K., D’Arrigo, R. D., Skees, J., Nachin,
Kölbl, A., Steffens, M., Wiesmeier, M., Hoffmann, C., Funk, R., B., Leland, C., Lyon, B., Wang, S.-Y., and Byambasuren,
Krümmelbein, J., Reszkowska, A., Zhao, Y., Peth, S., Horn, R., O.: Dzuds, droughts, and livestock mortality in Mongolia,
Giese, M., and Kögel-Knabner, I.: Grazing changes topography- Environ. Res. Lett., 10, 074012, https://doi.org/10.1088/1748-
controlled topsoil properties and their interaction on different 9326/10/7/074012, 2015.
spatial scales in a semi-arid grassland of Inner Mongolia, P. R. Rao, Z., Jia, G., Li, Y., Chen, J., Xu, Q., and Chen, F.: Asynchronous
China, Plant Soil, 340, 35–58, https://doi.org/10.1007/s11104- evolution of the isotopic composition and amount of precipita-
010-0473-4, 2011. tion in north China during the Holocene revealed by a record of
Lane, C. S.: Modern n-alkane abundances and isotopic composi- compound-specific carbon and hydrogen isotopes of long-chain
tion of vegetation in a gymnosperm-dominated ecosystem of n-alkanes from an alpine lake, Earth Planet. Sc. Lett., 446, 68–
the southeastern US coastal plain, Org. Geochem., 105, 33–36, 76, https://doi.org/10.1016/j.epsl.2016.04.027, 2016.
https://doi.org/10.1016/j.orggeochem.2016.12.003, 2017. Rao, Z., Guo, W., Cao, J., Shi, F., Jiang, H., and Li, C.: Relationship
Li, G., Li, L., Tarozo, R., Longo, W. M., Wang, K. J., between the stable carbon isotopic composition of modern plants
Dong, H., and Huang, Y.: Microbial production of and surface soils and climate: A global review, Earth-Sci. Rev.,
long-chain n-alkanes: Implication for interpreting sedi- 165, 110–119, https://doi.org/10.1016/j.earscirev.2016.12.007,
mentary leaf wax signals, Org. Geochem., 115, 24–31, 2017.
https://doi.org/10.1016/j.orggeochem.2017.10.005, 2018a. Rommerskirchen, F., Eglinton, G., Dupont, L., and Rullkötter,
Li, X., Anderson, B. J., Vogeler, I., and Schwendenmann, L.: J.: Glacial/interglacial changes in southern Africa: Compound-
Long-chain n-alkane and n-fatty acid characteristics in plants specific δ 13 C land plant biomarker and pollen records from
and soil – potential to separate plant growth forms, primary southeast Atlantic continental margin sediments, Geochem. Geo-
and secondary grasslands?, Sci. Total Environ., 645, 1567–1578, phy. Geosy., 7, 1–21, https://doi.org/10.1029/2005GC001223,
https://doi.org/10.1016/j.scitotenv.2018.07.105, 2018b. 2006.
Liu, J., An, Z., and Liu, H.: Leaf wax n-alkane dis- Rudaya, N. and Li, H.-C.: A new approach for reconstruction
tributions across plant types in the central Chi- of the Holocene climate in the Mongolian Altai: The high-
nese Loess Plateau, Org. Geochem., 125, 260–269, resolution δ 13 C records of TOC and pollen complexes in
https://doi.org/10.1016/j.orggeochem.2018.09.006, 2018. Hoton-Nur Lake sediments, J. Asian Earth Sci., 69, 185–195,
Peck, J. A., Khosbayar, P., Fowell, S. J., Pearce, R. B., Ariunbileg, https://doi.org/10.1016/j.jseaes.2012.12.002, 2013.
S., Hansen, B. C., and Soninkhishig, N.: Mid to Late Holocene Sachse, D., Radke, J., and Gleixner, G.: δD values of individual
climate change in north central Mongolia as recorded in the sed- n-alkanes from terrestrial plants along a climatic gradient – Im-
iments of Lake Telmen, Palaeogeogr. Palaeocl., 183, 135–153, plications for the sedimentary biomarker record, Org. Geochem.,
https://doi.org/10.1016/S0031-0182(01)00465-5, 2002. 37, 469–483, https://doi.org/10.1016/j.orggeochem.2005.12.003,
Poynter, J. G., Farrimond, P., Robinson, N., and Eglinton, G.: 2006.
Aeolian-Derived Higher Plant Lipids in the Marine Sedimen- Schäfer, I. K., Lanny, V., Franke, J., Eglinton, T. I., Zech,
tary Record: Links with Palaeoclimate, in: Paleoclimatology and M., Vysloužilová, B., and Zech, R.: Leaf waxes in litter
Paleometeorology: Modern and Past Patterns of Global Atmo- and topsoils along a European transect, SOIL, 2, 551–564,
spheric Transport, edited by: Leinen, M. and Sarnthein, M., https://doi.org/10.5194/soil-2-551-2016, 2016.
NATO ASI Series, Series C, Springer, Dordrecht, 282, 435–462, Schäfer, I. K., Bliedtner, M., Wolf, D., Kolb, T., Zech, J.,
https://doi.org/10.1007/978-94-009-0995-3, 1989. Faust, D., and Zech, R.: A δ 13 C and δ 2 H leaf wax
Prokopenko, A. A., Khursevich, G. K., Bezrukova, E. V., Kuzmin, record from the Late Quaternary loess-paleosoil sequence El
M. I., Boes, X., Williams, D. F., Fedenya, S. A., Kulagina, Paraíso, Central Spain, Palaeogeogr. Palaeocl., 507, 52–59,
N. V., Letunova, P. P., and Abzaeva, A. A.: Paleoenvironmental https://doi.org/10.1016/j.palaeo.2018.06.039, 2018.
proxy records from Lake Hovsgol, Mongolia, and a synthesis of Schefuss, E., Schouten, S., and Schneider, R. R.: Climatic con-
Holocene climate change in the Lake Baikal watershed, Quater- trols on central African hydrology during the past 20,000 years,
nary Res., 68, 2–17, https://doi.org/10.1016/j.yqres.2007.03.008, Nature, 437, 1003–1006, https://doi.org/10.1038/nature03945,
2007. 2005.
Pyankov, V. I., Gunin, P. D., Tsoog, S., and Black, C. C.: C4 plants Schulz, S., Giebler, J., Chatzinotas, A., Wick, L. Y., Fetzer, I., Welzl,
in the vegetation of Mongolia: Their natural occurrence and geo- G., Harms, H., and Schloter, M.: Plant litter and soil type drive
graphical distribution in relation to climate, Oecologia, 123, 15– abundance, activity and community structure of alkB harbouring
31, https://doi.org/10.1007/s004420050985, 2000. microbes in different soil compartments, ISME J., 6, 1763–1774,
https://doi.org/10.1038/ismej.2012.17, 2012.
www.biogeosciences.net/17/567/2020/ Biogeosciences, 17, 567–580, 2020You can also read