Tract Proles of The Cerebellar Peduncles In Children Who Stutter
←
→
Page content transcription
If your browser does not render page correctly, please read the page content below
Tract Profiles of The Cerebellar Peduncles In
Children Who Stutter
Chelsea Johnson
Michigan State University Department of Communicative Sciences and Disorders
Yanni Liu
University of Michigan
Noah Waller
University of Michigan
Soo-Eun Chang ( sooeunc@med.umich.edu )
University of Michigan https://orcid.org/0000-0003-4448-9525
Research Article
Keywords: Stuttering, Cerebellum, diffusion MRI, fractional anisotropy, error monitoring
DOI: https://doi.org/10.21203/rs.3.rs-682966/v1
License: This work is licensed under a Creative Commons Attribution 4.0 International License.
Read Full License
Page 1/26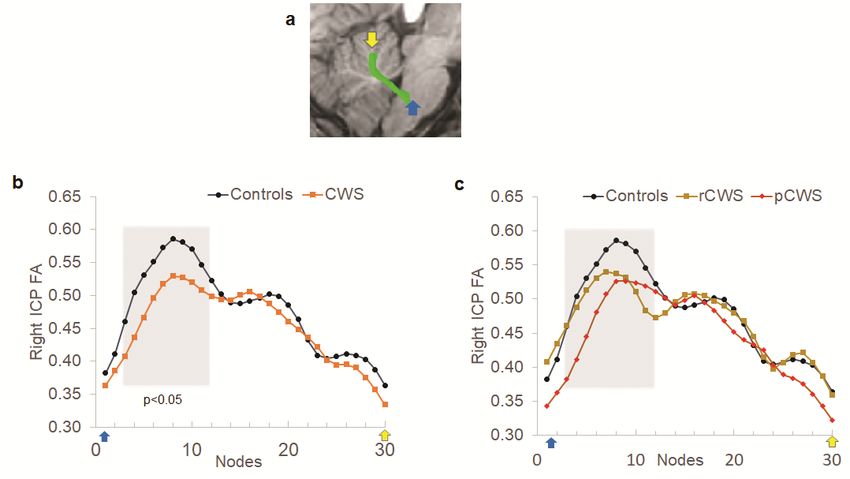
Abstract
Cerebellar-cortical loops comprise critical neural circuitry that supports self-initiated movements and
motor adjustments in response to perceived errors, functions that are affected in stuttering. It is unknown
whether structural aspects of cerebellar circuitry are affected in stuttering, in particular in children close to
symptom onset. Here we examined white matter diffusivity characteristics of the three cerebellar
peduncles (CP) based on diffusion MRI (dMRI) data collected from 41 children who stutter (CWS) and 42
controls in the 3-11 year range. We hypothesized that CWS would exhibit decreased fractional anisotropy
(FA) in the right CPs given the contralateral connectivity of the cerebellar-cortical loops and past reports
of structural differences in left cortical areas in stuttering speakers. Automatic Fiber Quantification (AFQ)
was used to track and segment cerebellar white matter pathways and to extract diffusivity measures. We
found significant group differences for FA in the right Inferior CP (ICP) only: controls showed significantly
higher FA in the right ventral ICP compared to CWS, controlling for age, sex, and verbal IQ. Furthermore, FA
of right ICP was negatively correlated with stuttering frequency in CWS. These results suggest an early
developmental difference in the right ICP for CWS compared to age-matched peers, which may indicate
an alteration in error processing, a function previously linked to the ICP. Lower FA here may impact error
monitoring and sensory input processing to guide motor corrections. Further longitudinal investigations
in children may provide additional insights into how CP development links to stuttering persistence and
recovery.

Introduction
Stuttering is a complex neurodevelopmental disorder characterized by frequent disruptions in the flow of
speech. Neuroimaging investigations in the last two decades have revealed significant differences in
speakers who stutter relative to typical speakers in functional neuroanatomy affecting auditory-motor
integration, temporal processing of speech movements, and aberrant inter-hemispheric interactions (for a
review, see Chang et al., 2018). Apart from some convergent findings, there have been disparate reports of
group differences that encompass many parts of the brain, reflecting the complex nature of stuttering
and the probable involvement of multiple, network-level (versus region-specific) neural differences in
stuttering. Examinations of the brain's “hub” areas that support the integration of functions across
multiple neural structures have thus been an area of significant interest in the context of stuttering. One
such area is the basal ganglia, which plays a major role in coordinating and initiating movement
sequences and has been discussed in recent reviews relevant to the neural bases of stuttering (for a
discussion, see Chang & Guenther, Chang et al., 2018; Craig-McQuaide et al., 2014).

The cerebellum is another critical hub area of the brain (Akkal et al., 2007; Bostan et al., 2013; Bostan et
al., 2010; Brodal, 1978; Glickstein et al., 1985; Hoover & Strick, 1999; Hoshi et al., 2005; Kelly & Strick,
2000, 2003; Leichnetz et al., 1984; Middleton & Strick, 1994, 2001; Schmahmann & Pandya, 1991, 1993,
1997; Snider & Maiti, 1976; Strick et al., 2009; Tourville & Guenther, 2011; Vilensky & Van Hoesen, 1981;
Zemanick et al., 1991). Arguably, the cerebellum has received much less exploration than other hub areas
such as the basal ganglia, though a number of studies have reported cerebellar functional and structural
                                                    Page 2/26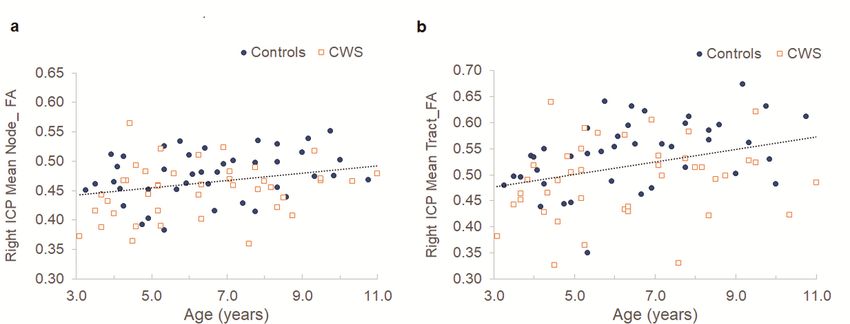
differences in people who stutter (Beal et al., 2007; Brown et al., 2005; Budde et al., 2014; Chang et al.,
2015; Chang et al., 2008, 2016a; Chang & Zhu, 2013; Chow & Chang, 2017; Connally et al., 2014; De Nil et
al., 2001; Garnett et al., 2018; Kell et al., 2018; Lu et al., 2009, 2012; Chunming Lu, Chen, et al., 2010;
Chunming Lu, Peng, et al., 2010a; Sitek et al., 2016; Song et al., 2007; Watkins et al., 2007, 2007; Yang et
al., 2016). Several studies showed that people who stutter relative to controls exhibit greater activity in the
right cerebellum during speech tasks (De Nil et al., 2001, 2003; Ingham et al., 2012; Lu, Peng, et al., 2010b;
Watkins et al., 2007). The cerebellar right hemisphere areas primarily inter-connect with left cerebral
hemisphere regions, supporting functions including orofacial movements and speech motor control. In
addition to motor functions, recent studies have provided strong evidence that the cerebellum is
substantially involved in supporting higher-order cognitive processes. For example, working memory,
semantic judgment, spatial awareness, procedural learning, decision making, and emotion processing all
engage the cerebellum (for a review, see Stoodley & Schmahmann, 2010). Given updated understanding
of cerebellar function and cerebellar networks, further research into cerebellar functional neuroanatomy is
expected to lead to a better understanding of the neural bases underlying the multifactorial nature of
stuttering (for a discussion, see Smith & Weber, 2017).

Major white matter tracts that interconnect the cerebellum and the cerebrum and brainstem are bundled
into cerebellar peduncles. There are 3 pairs of cerebellar peduncles: The superior cerebellar peduncles
(SCP), which contain almost all of the efferent projections from the cerebellum via the thalamus, such as
those projecting to cortical motor areas; the middle cerebellar peduncles (MCP), which are the primary
afferent pathway carrying input from the cortex to the cerebellum via the pons; and the inferior cerebellar
peduncles (ICP), which carry both afferent and efferent tracts. Afferent pathways that travel to the ICP
originate in vestibular areas, the spinal cord, and the brainstem. Efferent channels from this peduncle
also travel to vestibular regions and brainstem areas that mediate vital life functions, such as circadian
rhythm and consciousness, as well as reflexes (e.g., Mangold & Das, 2020). The ICP have also been
associated with sensorimotor adaptation (Jossinger et al., 2020) and error detections during motor
commands (for a review, see Shadmehr, 2017). Relevant to speech-motor control theories, afferent
information from the olivo-cerebellar fibers that enter the cerebellum through the ICP provide the
cerebellum with sensory input from the periphery (Streng et al., 2018). This peripheral information could
help guide the proper updating of motor commands through efferent copy mechanisms that are
supported by the cerebellum (e.g., De Zeeuw et al., 1998; Miall et al., 1993; Rhodes & Bullock, 2002;
Wolpert et al., 1998)

Adults and children with persistent stuttering differ in microstructural characteristics of the cerebellar
peduncles compared to controls and recovered children who stutter (Chow & Chang, 2017; Connally et al.,
2014; Garnett et al., 2018; Watkins et al., 2007). However, there is some disagreement on which peduncles
may be affected in developmental stuttering. While some studies have suggested that all six peduncles
have lower FA in adults who stutter (Connally et al., 2014), other studies have only found the right middle
peduncle to differ significantly in adults who stutter relative to controls (Watkins et al., 2007). Connally et
al. (2014) also showed a significant age effect in the FA of the ICP: FA in ICP increased with age (14–42
years) in speakers who stutter only, whereas there were no such age correlations in the controls. Another
                                                    Page 3/26
study found that while FA of the left ICP was associated with speech rate in adults who stutter, adults
who stutter did not differ from controls in overall structural measures of any of the cerebellar peduncles
(Jossinger et al., 2021). Both the inferior and middle cerebellar peduncles carry afferent signals from
speech motor control substrates in the brainstem and the cerebral cortex, respectively. Given that there
are some controversies surrounding whether speech motor learning differences exist in adults but not in
children who stutter (Daliri et al., 2017; Kim et al., 2020), it is of interest to examine whether subtle
differences reported in cerebellar peduncle structure in adults who stutter are also present in children who
stutter. Examining children who stutter, who are less likely than in adults to have acquired adaptive
neuroplastic changes associated with reactions and compensations to one’s own stuttering, is critical to
be able to attribute any structural changes to be associated with stuttering itself, or to adaptive changes.
In the above-mentioned studies, diffusion MRI (dMRI) was used to quantify water diffusion, reflecting
brain tissue organization on a microstructural scale. The white matter structures inhabited by myelinated
axons induce an anisotropic diffusion of water molecules, compared to gray matter structures or in the
cerebrospinal fluid, where water diffusion would be much more isotropic (i.e., mean diffusion probability
occurring equally in all directions rather than in a preferential direction). Fractional anisotropy (FA) is a
summary measure derived from dMRI that provides a way to quantify how much of the water diffusion
occurs in a principal direction compared to orthogonal directions. FA is influenced by various factors such
as myelination, axonal diameter, presence of crossing fibers, and is commonly used in clinical studies
and discussed as a measure reflecting white matter “integrity” or “coherence”. While FA can be examined
using a voxel-based analysis (e.g., TBSS; Smith et al., 2006) to compare between groups, there are some
limitations in terms of ensuring that TBSS-based tracts correspond to tracts in individual brains (Tsang et
al., 2010; Yeatman et al., 2012). Compared to voxel-wise analyses of FA, tractography involves
probabilistic or deterministic algorithms to track the continuous trajectory of white matter tracts and is
considered a more accurate method to identify white matter tracts in the human brain (Yeatman et al.,
2012). However, most common methods for tractography investigations have relied on manual ROI
definitions that were effortful and time-consuming. Furthermore, diffusion properties of tracts were often
averaged along the length of the whole tract.
A new tractography method, Automated Fiber Quantification (AFQ), improves upon these limitations and
provides a way to automatically identify major white matter tracts (Yeatman et al., 2012). AFQ also
allows examining diffusion measurements at different locations on the tracts rather than just the mean
across the entire tract. While this method has been applied to study adults who stutter (Jossinger et al.,
2021; Kronfeld-Duenias et al., 2016a, 2016b, 2018), it has not yet been applied to study white matter
tracts in children who stutter who are relatively close to stuttering onset. Using this method, we examined
five major cerebellar white matter tracts in children who stutter and their age-matched peers to compare
diffusion properties at anatomically equivalent locations of each tract. These tracts included the left and
right superior cerebellar peduncles, the middle cerebellar peduncle, and the left and right ICPs.
We hypothesized that children who stutter would exhibit decreased FA in the right cerebellar peduncles,
given the contralateral connectivity of the cerebellar cortical loops and previously reported convergent
Page 4/26findings of differences focused on the left cerebral areas in people who stutter. Given the reported role of
the ICP in error detection, and its role in carrying afferent fibers to the cerebellum with peripheral sensory
information that may help support efference copy mechanisms during speech (e.g., Shadmehr, 2017;
Streng et al., 2018), we hypothesized that the right inferior peduncle would be associated with persistent
stuttering and stuttering severity.
Methods
2.1 Participants
A total of 83 children (41 stuttering, 26 boys; 42 controls, 21 boys) between 3 and 11 years of age
participated. All were monolingual native North American English speakers without concomitant
developmental disorders (e.g., dyslexia, attention-deficit/hyperactivity disorder, learning delay, psychiatric
conditions). All children underwent careful screening to ensure typical speech and language
developmental history except for the presence of stuttering in the experimental groups. The children who
stutter and controls were matched in age, handedness (Oldfield, 1971), and socioeconomic status
(Hollingshead, 1975). While most participants were strongly right-handed, 6 children were left-handed (2
persistent, 1 recovered, 3 control) and 7 ambidextrous (4 persistent, 1 recovered, 2 control). All
participants were tested on a battery of standardized speech, language, and cognitive tests, audiometric
hearing screening, oral-motor screening, and cognitive evaluations. The tests included the Peabody
Picture Vocabulary Test (PPVT-3; Dunn, Dunn, & Lenhard, 2007), Expressive Vocabulary Test (EVT-2;
Williams & Williams, 2007), Goldman-Fristoe Test of Articulation (GFTA-2; Goldman, 2000), Wechsler
Preschool and Primary Scale of Intelligence (WPPSI-III; for children 2: 6–7:3; Wechsler, 2002), and
Wechsler Abbreviated Scale of Intelligence (WASI; for children aged 7 and up; Wechsler, 1999). Children
were excluded if scores fell below two standard deviations (SD) of the mean on any standardized
assessments. The average test scores for each group are listed in Table 1.
Stuttering severity was assessed by collecting samples of spontaneous speech elicited through
storytelling and conversational tasks with a parent and a certified speech-language pathologist. These
samples were video recorded for further offline analyses. We calculated percent stuttered utterances per
number of syllables based on narrative samples containing a conversation with the clinician and a
monologue elicited with storytelling with a pictures-only book (‘Frog, where are you?’; Mayer, 1969). In
addition, the Stuttering Severity Instrument (SSI; Riley, 2009) was used to examine the frequency and
duration of disfluencies occurring in the speech sample, as well as any physical concomitants associated
with stuttering; all of these measures were incorporated into a composite stuttering severity rating. To
determine the measurement reliability of the SSI scores, an intraclass correlation coefficient was
calculated based on the ratings from two independent judges on children’s speech samples.
While all children who stutter were diagnosed with stuttering at the initial study visit, they were
categorized as recovered or persistent based on measurements acquired in subsequent early visits that
occurred up to 4 times for each child. A child was categorized as persistent with an SSI-4 score >10 at
Page 5/26two consecutive follow-up visits, and the onset of stuttering had been at least 36 months prior to his most recent visit. A child was considered recovered with an SSI-4 score ≤10 (corresponding to “very mild”) at two consecutive follow-up visits. Such determination also required the consideration of percent occurrence of stuttering-like disfluencies (%SLD) in the speech sample (≥3 for persistent) as well as clinician and parental reports. Similar criteria were used to determine recovery or persistency in previous studies (Yairi & Ambrose, 1999). Using these criteria, we identified 13 recovered children (7 boys), hereafter “recovered” and 28 persistent children (18 boys), hereafter “persistent”. For controls, the inclusion criteria included never having been diagnosed with stuttering, no family history of stuttering, lack of parental concern for their child’s speech fluency, with %SLD
Persistent                   Recovered

                             Controls                    n = 28 (18                   n = 13 (8
                                                         boys)                        boys)
                             n = 42 (21
                             boys)

                             Mean (SD)      Range        Mean (SD)        Range       Mean (SD)      Range

    Age                      6.52 (2.03)    3.25-        6.52 (1.95)      3.08-       5.77           3.66-
                                            10.75                         10.33       (2.31)         11.00

    SES (Maternal            6.36(0.61)     5–7          6.21 (0.83)      4-7         6.30           5-7
    Education)                                                                        (0.63)

    Full-Scale IQ a          114.68         84-144       106.78(14.30)    81-138      104.00         88-130
                             (14.33)                                                  (15.47)

    Performance IQ           111.58         77-145       107.85           79-135      101.53         86- 134
                             (15.92)                     (13.24)                      (14.91)

    Verbal IQ a              117.04         87-153       105.32           77 -        106.00         88-136
                             (14.93)                     (13.83)          137         (15.54)

    PPVT c                   118.26         95-151       109.79           87-147      110.69         86-134
                             (13.61)                     (12.33)                      (15.44)

    EVT c                    115.65         90 - 149     106.57           89-134      106.84         87-137
                             (14.33)                     (11.66)                      13.94)

    GFTA                     105.31         81-123       101.86 (8.58)    77-118      107.38         96-121
                             (7.95)                                                   (8.32)

    %SLD b                   1.08 (0.87)    0.0-3.23     6.88 (6.55)      1.10-       4.62           0.20-
                                                                          30.20       (3.33)         12.0

    %OD                      4.93 (2.67)    0.0-         5.61 (2.91)      1.00-       4.60           2.20-
                                            13.73                         12.70       (1.96)         9.0

    SSI-4 at initial visit   N/A            N/A          21.18 (7.96)     12-48       16.00          6-28
                                                                                      (6.00)

a
    Controls exhibited significantly higher scores than the persistent and recovered CWS groups.

b
    Both persistent and recovered groups exhibited significantly higher scores than in controls.

c
    Controls exhibited significantly higher scores than the persistent CWS group.

SD, standard deviation; SES, socioeconomic status; IQ, intelligence quotient; PPVT, Peabody Picture
Vocabulary Test; EVT, Expressive Vocabulary Test; GFTA, Goldman-Fristoe Test of Articulation; SSI-4,
Stuttering Severity Instrument Edition 4; %SLD, stuttering-like disfluencies (e.g., sound-syllable repetitions,
word repetitions, sound prolongations) occurring per 100 words during conversational speech; %OD, other
                                                     Page 7/26
disfluencies (e.g., interjections, phrase repetitions) occurring per 100 words during conversational speech.
In addition to the speech-language and cognitive tests, all children went through mock scanner training
during a separate visit to familiarize them to the scanner environment and procedures and to practice
keeping still while lying inside the bore for stretches of time. Recordings of MRI scanner noise were
played during this session so that children were aware that they would hear loud sounds during scanning.
This session was repeated in some children as needed. All children were paid a nominal remuneration
and were given small prizes (e.g., stickers) for their participation. All procedures used in this study were
approved by the Michigan State University Institutional Review Board.
2.2 MRI acquisition
MRI scans for this study were acquired on a GE 3T SignaVR HDx MR scanner (GE Healthcare) with an 8-
channel head coil. During each scanning session, 180 T1-weighted 1-mm3 isotropic volumetric inversion
recovery fast spoiled gradient-recalled images, with CSF suppressed, were collected to cover the entire
brain with the following parameters: time of echo 3.8 ms, time of repetition of acquisition 8.6 ms, time of
inversion 831 ms, repetition time of inversion 2,332 ms, flip angle 8 degrees, and receiver bandwidth
+/-20.8 kHz. After collecting T1 data, high-order shimming procedures were performed to improve
magnetic field homogeneity. The dMRI data were obtained with a dual spin-echo echo-planar imaging
sequence for 12 minutes and 6 seconds with the following parameters: 48 contiguous 2.4-mm axial
slices in an interleaved order, field of view 22 x 22 cm, matrix size 128 x 128, number of excitations =2,
echo time 77.5 ms, repetition time 13.7 s, 25 diffusion-weighted volumes (one per gradient direction) with
b=1,000 s/mm2, one volume with b=0 and parallel imaging acceleration factor=2. A member of the
research staff sat inside the scanner room next to the child being scanned for the duration of the scans to
monitor participant comfort and to ensure the child was able to cooperate with scanning protocols.
Children watched a movie to help them stay still during the acquisition of volumetric T1-weighted scans
and dMRI scans.
2.3 Diffusion MRI data preprocessing
Diffusion MRI data were preprocessed individually using the open-source software mrDiffusion
(https://github.com/vistalab/vistasoft/tree/master/mrDiffusion) implemented in MATLAB R2017b. Eddy
current distortions and subject motion in the diffusion-weighted images were removed by a 14-parameter
constrained non-linear co-registration algorithm based on the expected pattern of eddy current
distortions (Rohde et al., 2004). Each diffusion-weighted image was registered to the non-diffusion (b0)
image; the b0 image was registered automatically to the T1 image, which had been aligned to the
canonical MNI template. The combined transformation, incorporating both eddy-current correction and
anatomical alignment, was applied to the raw diffusion data, and the transformed images were
resampled at 2 × 2 × 2 mm isotropic voxels. Diffusion tensors were then fit using a robust least-squares
algorithm. Eigenvectors and eigenvalues of the tensor were extracted. FA was calculated as the
normalized standard deviation of the eigenvalues of the diffusion tensor, and MD was calculated as the
Page 8/26average of all three eigenvalues (Pierpaoli & Basser, 1996). Head motion was quantified in each
participant by calculating the degree of motion correction in each volume relative to prior
volume (Bruckert et al., 2019). Average displacement across participants 0.046+/- 0.030, and there was
no group difference in the displacement (p>0.05).
2.4. Tract identification and segmentation
Five cerebellar peduncles (CPs) (bilateral ICP, bilateral SCP, and MCP) were identified and quantified using
the open-source software Automated Fiber Quantification (AFQ) package (Yeatman et al., 2012). AFQ
consists of three main processing steps: (1) whole-brain fiber tractography, (2) automatic tract
segmentation based on template region of interest (ROIs) warped to native space, and (3) automatic tract
quantification and cleaning. A whole-brain fiber group was tracked using a deterministic streamlines
tracking tractography (STT) algorithm (Mori et al. 1999). Based on previous dMRI studies in
children (Bruckert et al., 2019), the tracking algorithm was seeded with a white matter mask defined as all
the voxels with FA value greater than 0.15. Tracking proceeded in both directions along the principal
diffusion axes and stopped when FA estimated at the current position dropped below 0.10 or when the
angle between the last path segment and next step direction was greater than 30°. Fiber tract
segmentation was based on waypoint ROIs, which were first defined on the JHU MNI T1 template and
then back-transformed to each participants’ native space (Bruckert et al., 2019; Jossinger et al., 2021).
The core of the tract was calculated by defining 30 sample points along the tract and computing the
robust mean position of the corresponding sample points. After tract segmentation, an automated
cleaning algorithm was used to remove fiber longer than 1 standard deviation from the mean fiber length
and spatially deviated more than 4 standard deviations from the core of the tract.
A small number of children who stutter were excluded from each analysis because a tract could not be
segmented or did not conform to anatomical norms. One child who stutters was excluded from the MCP,
1 from the right SCP, and 2 from the left SCP analyses. Diffusion properties (FA, MD) were calculated at
30 equidistant nodes along the central portion of each fiber tract bounded by the same two waypoint
ROIs used for tract segmentation (Bruckert et al., 2019; Jossinger et al., 2021; Yeatman et al., 2012).
Figure S1 shows the tracts of interest identified in one representative participant and visualization of FA
profiles in each group and each CP.
2.5. Statistical analysis
Analyses were conducted on the core of each CP tract between the two waypoint-ROIs used for
tractography.
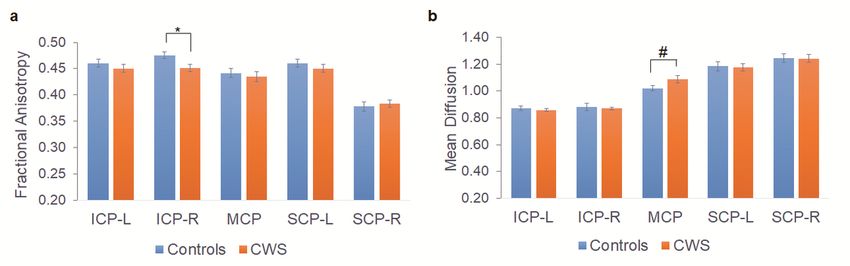
Group differences. Mean tract-diffusion indices (FA and MD) were calculated by averaging values of all
30 nodes for each participant and in each peduncle (hereafter referred to as “tract-FA and tract-MD”).
Independent t-tests were used to compare tract-FA and tract-MD between groups (CWS, controls) in the
MCP, bilateral ICP, and SCP. In addition, we evaluated group differences of the local diffusivity measures
along the 30 nodes in each tract (hereafter, node_FA, node_MD), which may provide better sensitivity
Page 9/26compared to the mean FA and MD for the whole tract. These along-tract group comparison statistics were corrected using a non-parametric permutation test (p
Controls           CWS                Group Difference    Age Correlation

                         mean       ±SD     mean      SD       t         p         r         p

        rightICP_FA      0.475      0.042   0.451     0.046    2.544     0.013*    0.283     0.009*

        rightICP_MD      0.883      0.182   0.869     0.074    0.445     0.657     -0.116    0.298

        leftICP_FA       0.460      0.049   0.450     0.049    0.925     0.358     0.320     0.003*

        leftICP_MD       0.873      0.107   0.859     0.060    0.706     0.482     -0.152    0.172

        rightSCP_FA      0.378      0.054   0.383     0.045    -0.476    0.636     0.330     0.003*

        rightSCP_MD      1.245      0.208   1.242     0.193    0.072     0.943     -0.267    0.016*

        leftSCP_FA       0.368      0.048   0.372     0.052    -0.317    0.752     0.255     0.021*

        leftSCP_MD       1.186      0.228   1.176     0.169    0.218     0.828     -0.075    0.508

        MCP_FA           0.441      0.057   0.435     0.060    0.518     0.606     0.160     0.150

        MCP_MD           1.022      0.123   1.088     0.178    -1.985    0.051#    -0.165    0.140

CWS= children who stutter; ICP = Inferior Cerebellar Peduncle, MCP = Middle Cerebellar Peduncle, SCP =
Superior Cerebellar Peduncle; SD = standard deviation; L= left; R= right. * p
Table 3. Regression analysis for the prediction of tract_FA and node_FA of the right ICP. In addition to
significant group differences found in both node_ and tract_FA for the right ICP, there was a significant
effect of age for this same tract regardless of group.
Node_FA Tract_FA
beta t p beta t p
Group -0.326 -3.004 0.004* -0.240 -2.127 0.037*
Sex -0.021 -0.206 0.837 -0.089 -0.830 0.409
Age 0.303 2.942 0.004* 0.258 2.413 0.018*
IQ 0.026 0.237 0.813 0.013 0.113 0.911
Tract_FA, mean FA for the whole tract; node_FA, mean FA for nodes 3-12. FA, fractional anisotropy. *
p(age range: 14–27 years, N = 17; control group age range: 14–27 years, N = 13) (Watkins et al., 2007), and
in another, no differences were found between the stuttering and control groups, but the left ICP FA was
negatively correlated with speech rate in adults who stutter (age range: 19–52 years, N = 23; control group
age range: 19–53 years, N = 19) (Jossinger et al., 2021). The discrepancies reported by the studies
mentioned above may be explained by differences in the age range of participants examined, varying
statistical power to detect group differences, as well as differing scanning protocols and dMRI analysis
methods applied in the analyses (for a discussion of the latter point, see Jossinger, 2021).
Concerning age, Jossinger et al. (2021) point out that group differences reported by Connally et al. (2014)
for FA of the ICP decreased dramatically with age. This result may suggest that white matter
development for people who stutter (PWS) in ICP may be delayed but eventually catch up to levels seen in
controls during adulthood. Jossinger et al. also did not find significant group differences in the ICP in
their participants who had a higher mean age than in the other two studies. The current study is the first
to examine CP white matter microstructure in children ranging from 3–11 years of age, with the largest
sample size reported of the studies published to date. We found significant group differences in FA of the
right ICP only and age-related increases in this same tract for both groups, which offers some
clarifications on the early development of the CPs that differentiate PWS from age-matched peers. Like
Jossinger et al. (2021) that used identical methods as the current study employing AFQ, we did not find
significant group differences in any of the diffusivity measures in the MCP (only trend level increase in
MD found for CWS relative to controls), bilateral SCP, or left ICP. Unlike Jossinger et al. (2021), we found
group differences in the right ICP where they did not find a significant group difference; they only reported
a relationship between FA in the left ICP with speech rate in PWS. Findings from the two studies
collectively point to the ICP as potentially most relevant among the cerebellar peduncles in relation to
stuttering: while speculative, weaker white matter development in the right ICP during childhood may lead
to possible maladaptive changes in the homologous left ICP that is linked to slower speech rate that may
be a compensatory process associated with years of stuttering.
The results of the current study, which shows reduced white matter integrity in the ICP that conveys error
feedback via the mossy fibers, indicate that the error monitoring function of the cerebellum may be
affected in PWS, which has implications for updating internal models for adaptive motor control. The
afferent fibers from the olivary nucleus relay error signals from mismatches between motor commands
and peripheral input (Streng et al., 2018). Other studies have also suggested the olivo-cerebellar fibers are
associated with sensorimotor adaptation (Jossinger et al., 2020) and detecting motor command errors
(for a review, see Shadmehr, 2017). More specifically, the ICP carries afferent fibers from the olivary
nucleus, which is one of the two main afferent inputs to the cerebellum. These olivary inputs are carried
through the climbing fibers, which convey bottom-up sensory feedback-related signals. The cerebellum
also receives afferent input from the pons via the mossy fibers, which relay information from cortical
areas. These inputs are thought to carry efference copy information, relaying an estimate of the sensory
feedback predicted from the execution of the movement. When there is a mismatch between the
predicted and actual sensory feedback from the movement, the cerebellum can signal this discrepancy
back to the cerebrum, resulting in adaptation of the movement so that any discrepancies between
Page 13/26predicted and actual sensory feedback can be minimized in future movements. In a recent review paper
on altered feedback studies in stuttering, the authors note that while people who stutter seem to show
less compensation to sudden perturbation, they were particularly impaired in tasks that required
adaptation of motor behavior that is induced by sustained perturbation of sensory feedback (Bradshaw
et al., 2021). Of the two types of responses induced by perturbation tasks - automatic compensation to
sudden/unexpected perturbation vs. adaptation in response to sustained perturbation—it is the latter in
which cerebellar activity is most reliably evoked (Johnson et al., 2019). Namely, the cerebellum plays a
critical role in motor adaptation that enables adjusting predictions for subsequent behavior and enabling
fine-tuning of behavior based on feedback. Collectively, the findings reviewed here suggest that altered
performance on adaptation studies reported in people who stutter may be linked to deficits in cerebellar
error monitoring and/or signaling to the cerebrum for adaptive changes in response to sensory feedback
perturbation.
Developmental stuttering is often connected to aberrant error monitoring (Max et al., 2004; Postma &
Kolk, 1992). Some influential theoretical perspectives have suggested that people who stutter have
aberrant internal models, which integrate prediction of the state of the speech system as a result of motor
plans, and sensory feedback that results from speech (Max et al., 2004). The cerebellum is hypothesized
to build associations between sensory states of speech and the motor cortex during development (for a
review, see Tourville & Guenther, 2011) and support learning associated with inverse models (e.g., Kawato,
1999). Structural differences in this pathway in children who stutter suggest that the development of
internal models may be atypical. Auditory perturbation studies have found that adults who stutter are
unable to update their motor commands in response to errors in their feedback (Cai et al., 2012, 2014;
Daliri et al., 2017; Daliri & Max, 2018; Kim et al., 2020; Loucks et al., 2012; Sares et al., 2018). Previous
behavioral studies of auditory perturbation have variable results in children who stutter (Daliri et al., 2017;
Kim et al., 2020). The current AFQ analyses suggest that cerebellar pathways associated with error
monitoring are reduced in white matter integrity in children who stutter and that the higher the stuttering
severity, the lower the white matter integrity in the same tracts. Structural differences in the ICP that carry
olivo-cerebellar tracts may lead to variable error detection signals during speech, resulting in atypical
updating of motor plans and less compensatory behaviors during perturbation trials. Additionally,
associations between the frequency of stuttering and FA of the right ICP in CWS further suggest that
structural differences in this pathway may contribute to greater frequency of disfluencies in speech.
Disruptions to error detection systems of the cerebellum may result in atypical speech motor control
development. Reduced compensation and adaptation responses to auditory perturbation have been
consistently reported in adults who stutter (Cai et al., 2012, 2014; Daliri et al., 2017; Daliri & Max, 2018;
Kim et al., 2020; Loucks et al., 2012; Sares et al., 2018), but not as consistently for children who stutter
(Daliri et al., 2017; Kim et al., 2020) may at least be partially be explained by changes in the speech motor
control systems over a lifetime of stuttering in people who stutter (Cai et al., 2012, 2014; Daliri et al., 2017;
Daliri & Max, 2018; Kim et al., 2020; Loucks et al., 2012; Sares et al., 2018). Over time, an inability for the
cerebellum to efficiently detect errors used for error-based learning may lead to atypical internal model
development that may be especially evident in adults who stutter. Alternatively, a recent study by Kim et
Page 14/26al. (2020) suggests that when feedback alterations induce motor adjustments to aspects of vocal tract
configuration (requiring intrinsic movement control), decreases in adaptation were pronounced in young
children who stutter relative to age-matched controls. This result contrasts with those reported by Daliri et
al. (2017), which showed that while significantly reduced adaptation was observed in adults who stutter
compared to controls, children who stutter did not differ from controls in adaptation extent. However, the
latter study used feedback perturbations that altered perception of the phoneme (vowel target), which
may have led to conscious adjustments to one’s speech. The difference between the more implicitly
controlled speech perturbation paradigm in Kim et al. (2020) compared to Daliri et al. (2017), which may
rely on explicit aspects of adaptation, could have led to the discrepancies between the two studies. Kim et
al. (2020) argue that motor adaptation that involves implicit, rather than explicit, learning components
might differ in people who stutter, regardless of age. Differences in implicit motor adaptation are present
early in development rather than acquired later in life. Motor adaptation in response to feedback
alterations that can be consciously monitored, however, may become more evident with age. Conscious
motor adaptations rely on additional neural resources outside of the cerebellum, including attention
networks. It may be that functional differences in these circuits differentiated adults from controls, but
not between children who stutter and controls (Daliri et al., 2017). The implicit motor adaptation to self-
initiated movement that occurs automatically and is mostly outside of conscious control, however, is
supported by the cerebellum (Knolle et al., 2013). Therefore, the extent of data from published studies in
stuttering suggests that motor adaptation deficits are present in both children and adults who stutter
when implicit learning is involved, indicating that this may be a core characteristic in developmental
stuttering. Namely, atypical internal model development reflected in altered cerebellar morphology could
affect implicit motor adaptation starting in childhood rather than a process acquired later over a lifetime
of stuttering. Because few studies have examined children to date on perturbation experiments, it is
essential to conduct more studies that use perturbation paradigms that induce both implicit and explicit
adaptation mechanisms to confirm whether children close to stuttering onset indeed primarily exhibit
deficits in implicit motor learning. This finding would align with the current results that show that children
who stutter have reduced integrity of white matter tracts associated with error monitoring function of the
cerebellum.
In addition to significant group differences in the right ICP and its negative correlation with stuttering
frequency, FA values in the right ICP showed significant age-related increases in both groups. This finding
suggests that structural development of this largely afferent cerebellar pathway is ongoing at least during
the age range of children we observed in this study (3–11 years). Age related FA increases were also
observed in the left ICP as well as the bilateral SCP (Table 2). White matter integrity increases during
preschool and school-age developmental period thus seem to be on-going in the CPs that contain
afferent fibers from the periphery to the cerebellum, as well as efferent fibers from the cerebellum to
subcortical and cortical regions. It may be that during this period of dynamic growth, children who stutter
are particularly vulnerable to aberrant growth in the ICP, which may either result in or be influenced by
aberrant error-based motor learning and error monitoring in their speech. The directionality of this
relationship is unclear and requires studying greater numbers of younger CWS and longitudinal studies.
Page 15/26Though AFQ presents an updated analysis method for diffusion metrics derived from dMRI, these results
could be further extended and confirmed through tractography analyses using tools that have shown to
be superior in resolving crossing fibers (Tournier et al., 2008; Wedeen et al., 2008; Yeatman et al., 2012).
Future studies could also consider examining white matter microstructure in conjunction with functional
connectivity analyses of resting state fMRI data or task-based fMRI that involve a motor learning
paradigm. These approaches could further establish the links between the structure and function of
cerebellar tracts that are linked to error monitoring and adaptive motor learning. In addition, future
research on this topic could benefit from longitudinal analyses. Neural developmental trajectories differ
between children who stutter and controls and between children who stutter who eventually recover from
or persist in stuttering (e.g., Chang et al., 2018; Chow & Chang, 2017). Future studies that examine
structural development of the cerebellum, as well as functional and structural examinations of cerebello-
cortical networks, would further provide much-needed information on whether and how specific cerebellar
lobules critical to motor control and networks change over development and how that interacts with
speech motor control development and stuttering severity.
In conclusion, results from this study demonstrate that white matter integrity as reflected in fractional
anisotropy (FA) measures are significantly reduced in the right ICP in children who stutter relative to age-
matched peers. Further, FA of the right ICP was found to be negatively correlated with the frequency of
stuttering. The significant differences found in the white matter microstructure of the right ICP in
developmental stuttering support theories that propose that error detection differences contribute to
developmental stuttering.
Abbreviations
AFQ Automated Fiber Quantification
CP Cerebellar Peduncle
CWS Children who stutter
dMRI Diffusion MRI
EVT Expressive Vocabulary Test
FA Fractional Anisotropy
fMRI Functional Magnetic Resonance Imaging
GFTA Goldman-Fristoe Test of Articulation
MD Mean Diffusivity
ICP Inferior Cerebellar Peduncle
Page 16/26MCP Middle Cerebellar Peduncle
PPVT Peabody Picture Vocabulary Test
ROI Region of Interest
SCP Superior Cerebellar Peduncle
SLD Stuttering-like Disfluency
STT Streamlines tracking tractography
WASI Wechsler Abbreviated Scale of Intelligence
WPPSI Wechsler Preschool and Primary Scale of Intelligence
Declarations
Funding (information that explains whether and by whom the research was supported)
This research was supported by the National Institute on Deafness and Other Communication Disorders
grant R01DC011277 (PI Chang)
Conflicts of interest/Competing interests (include appropriate disclosures)
The authors declare that there are no conflicts of interest.
Availability of data and material (data transparency)
The datasets analyzed for this research are are available on reasonable written request and through data
agreement.
Code availability (software application or custom code)
Toolboxes used for AFQ analyses are freely available at GitHub (https://github.com/yeatmanlab/AFQ).
Customized portion is available on request.
Authors' contributions (optional: please review the submission guidelines from the journal whether
statements are mandatory)
Conceptualization: Soo-Eun Chang, Yanni Liu; Methodology: Soo-Eun Chang, Yanni Liu, Noah Waller;
Formal analysis and investigation: Soo-Eun Chang, Yanni Liu, Noah Waller, Chelsea Johnson; Writing -
original draft preparation: Chelsea Johnson, Soo-Eun Chang, Yanni Liu; Writing - review and editing: Soo-
Eun Chang, Chelsea Johnson, Yanni Liu, Noah Waller; Funding acquisition: Soo-Eun Chang; Supervision:
Soo-Eun Chang, Yanni Liu.
Page 17/26Ethics approval (include appropriate approvals or waivers)
All procedures were approved by the Michigan State University Institutional Review Board
Consent to participate (include appropriate statements)
Written informed consent was obtained from one parent of the participants and assent from the
participant prior to participation.
Consent for publication (include appropriate statements)
All authors approved this submission.
References
1. Akkal D, Dum RP, Strick PL (2007) Supplementary Motor Area and Presupplementary Motor Area:
Targets of Basal Ganglia and Cerebellar Output. J Neurosci 27(40):10659–10673.
https://doi.org/10.1523/JNEUROSCI.3134-07.2007
2. Beal DS, Gracco VL, Lafaille SJ, De Nil LF (2007) Voxel-based morphometry of auditory and speech-
related cortex in stutterers. NeuroReport 18(12):1257.
https://doi.org/10.1097/WNR.0b013e3282202c4d
3. Bostan AC, Dum RP, Strick PL (2010) The basal ganglia communicate with the cerebellum.
Proceedings of the National Academy of Sciences, 107(18), 8452–8456.
https://doi.org/10.1073/pnas.1000496107
4. Bostan A, Dum RP, Strick PL (2013) Cerebellar networks with the cerebral cortex and basal ganglia.
Trends in Cognitive Sciences 17(5):241–254. https://doi.org/10.1016/j.tics.2013.03.003
5. Bradshaw AR, Lametti DR, McGettigan C (2021) The Role of Sensory Feedback in Developmental
Stuttering: A Review. Neurobiology of Language, 1–27. https://doi.org/10.1162/nol_a_00036
6. Brodal P (1978) The Corticopontine Projection in the Rhesus Monkey Origin and Principles of
Organization. Brain 101(2):251–283. https://doi.org/10.1093/brain/101.2.251
7. Brown S, Ingham RJ, Ingham JC, Laird AR, Fox PT (2005) Stuttered and fluent speech production: An
ALE meta-analysis of functional neuroimaging studies. Hum Brain Mapp 25(1):105–117.
https://doi.org/10.1002/hbm.20140
8. Bruckert L, Shpanskaya K, McKenna ES, Borchers LR, Yablonski M, Blecher T, Ben-Shachar M, Travis
KE, Feldman HM, Yeom KW (2019) Age-Dependent White Matter Characteristics of the Cerebellar
Peduncles from Infancy Through Adolescence. The Cerebellum 18(3):372–387.
https://doi.org/10.1007/s12311-018-1003-9
9. Budde KS, Barron DS, Fox PT (2014) Stuttering, induced fluency, and natural fluency: A hierarchical
series of activation likelihood estimation meta-analyses. Brain Lang 139:99–107.
https://doi.org/10.1016/j.bandl.2014.10.002
Page 18/2610. Cai S, Beal DS, Ghosh SS, Guenther FH, Perkell JS (2014) Impaired timing adjustments in response to
time-varying auditory perturbation during connected speech production in persons who stutter. Brain
Lang 129:24–29. https://doi.org/10.1016/j.bandl.2014.01.002
11. Cai S, Beal DS, Ghosh SS, Tiede MK, Guenther FH, Perkell JS (2012) Weak Responses to Auditory
Feedback Perturbation during Articulation in Persons Who Stutter: Evidence for Abnormal Auditory-
Motor Transformation. PLOS ONE 7(7):e41830. https://doi.org/10.1371/journal.pone.0041830
12. Chang S-E, Chow HM, Wieland EA, McAuley JD (2016) Relation between functional connectivity and
rhythm discrimination in children who do and do not stutter. NeuroImage: Clinical 12:442–450.
https://doi.org/10.1016/j.nicl.2016.08.021
13. Chang S-E, Erickson KI, Ambrose NG, Hasegawa-Johnson MA, Ludlow CL (2008) Brain anatomy
differences in childhood stuttering. Neuroimage 39(3):1333–1344
14. Chang S-E, Garnett EO, Etchell A, Chow HM (2018) Functional and Neuroanatomical Bases of
Developmental Stuttering: Current Insights. The Neuroscientist, 1073858418803594.
https://doi.org/10.1177/1073858418803594
15. Chang S-E, Zhu DC (2013) Neural network connectivity differences in children who stutter. Brain
136(12):3709–3726. https://doi.org/10.1093/brain/awt275
16. Chang S-E, Zhu DC, Choo AL, Angstadt M (2015) White matter neuroanatomical differences in young
children who stutter. Brain 138(3):694–711. https://doi.org/10.1093/brain/awu400
17. Chow HM, Chang S-E (2017) White matter developmental trajectories associated with persistence
and recovery of childhood stuttering: White Matter Development in Children Who Stutter. Hum Brain
Mapp. https://doi.org/10.1002/hbm.23590
18. Connally EL, Ward D, Howell P, Watkins KE (2014) Disrupted white matter in language and motor
tracts in developmental stuttering. Brain Lang 131:25–35.
https://doi.org/10.1016/j.bandl.2013.05.013
19. Craig-McQuaide A, Akram H, Zrinzo L, Tripoliti E (2014) A review of brain circuitries involved in
stuttering. Frontiers in Human Neuroscience, 8. https://doi.org/10.3389/fnhum.2014.00884
20. Daliri A, Max L (2018) Stuttering adults’ lack of pre-speech auditory modulation normalizes when
speaking with delayed auditory feedback. Cortex 99:55–68.
https://doi.org/10.1016/j.cortex.2017.10.019
21. Daliri A, Wieland EA, Cai S, Guenther FH, Chang SE (2017) Auditory-motor adaptation is reduced in
adults who stutter but not in children who stutter. Developmental Science, e12521.
https://doi.org/10.1111/desc.12521
22. De Nil LF, Kroll RM, Houle S (2001) Functional neuroimaging of cerebellar activation during single
word reading and verb generation in stuttering and nonstuttering adults. Neurosci Lett 302(2):77–80.
https://doi.org/10.1016/S0304-3940(01)01671-8
23. De Nil LF, Kroll RM, Lafaille SJ, Houle S (2003) A positron emission tomography study of short- and
long-term treatment effects on functional brain activation in adults who stutter. Journal of Fluency
Disorders 28(4):357–380. https://doi.org/10.1016/j.jfludis.2003.07.002
Page 19/2624. De Zeeuw CI, Hoogenraad CC, Koekkoek SKE, Ruigrok TJH, Galjart N, Simpson JI (1998)
Microcircuitry and function of the inferior olive. Trends Neurosci 21(9):391–400.
https://doi.org/10.1016/S0166-2236(98)01310-1
25. Garnett EO, Chow HM, Nieto-Castañón A, Tourville JA, Guenther FH, Chang SE (2018) Anomalous
morphology in left hemisphere motor and premotor cortex of children who stutter. Brain.
https://doi.org/10.1093/brain/awy199
26. Glickstein M, May JG, Mercier BE (1985) Corticopontine projection in the macaque: The distribution
of labelled cortical cells after large injections of horseradish peroxidase in the pontine nuclei. Journal
of Comparative Neurology 235(3):343–359. https://doi.org/10.1002/cne.902350306
27. Hoover JE, Strick PL (1999) The Organization of Cerebellar and Basal Ganglia Outputs to Primary
Motor Cortex as Revealed by Retrograde Transneuronal Transport of Herpes Simplex Virus Type 1. J
Neurosci 19(4):1446–1463. https://doi.org/10.1523/JNEUROSCI.19-04-01446.1999
28. Hoshi E, Tremblay L, Féger J, Carras PL, Strick PL (2005) The cerebellum communicates with the
basal ganglia. Nat Neurosci 8(11):1491–1493. https://doi.org/10.1038/nn1544
29. Ingham RJ, Grafton ST, Bothe AK, Ingham JC (2012) Brain activity in adults who stutter: Similarities
across speaking tasks and correlations with stuttering frequency and speaking rate. Brain Lang
122(1):11–24. https://doi.org/10.1016/j.bandl.2012.04.002
30. Johnson JF, Belyk M, Schwartze M, Pinheiro AP, Kotz SA (2019) The role of the cerebellum in
adaptation: ALE meta-analyses on sensory feedback error. Hum Brain Mapp 40(13):3966–3981.
https://doi.org/10.1002/hbm.24681
31. Jossinger S, Kronfeld-Duenias V, Zislis A, Amir O, Ben-Shachar M (2021) Speech rate association with
cerebellar white-matter diffusivity in adults with persistent developmental stuttering. Brain Structure
and Function, 1–16
32. Jossinger S, Mawase F, Ben-Shachar M, Shmuelof L (2020) Locomotor Adaptation Is Associated
with Microstructural Properties of the Inferior Cerebellar Peduncle. The Cerebellum 19(3):370–382.
https://doi.org/10.1007/s12311-020-01116-8
33. Kawato M (1999) Internal models for motor control and trajectory planning. Curr Opin Neurobiol
9(6):718–727. https://doi.org/10.1016/S0959-4388(99)00028-8
34. Kell CA, Neumann K, Behrens M, von Gudenberg AW, Giraud A-L (2018) Speaking-related changes in
cortical functional connectivity associated with assisted and spontaneous recovery from
developmental stuttering. Journal of Fluency Disorders 55:135–144.
https://doi.org/10.1016/j.jfludis.2017.02.001
35. Kelly RM, Strick PL (2000) Rabies as a transneuronal tracer of circuits in the central nervous system.
J Neurosci Methods 103(1):63–71. https://doi.org/10.1016/S0165-0270(00)00296-X
36. Kelly RM, Strick PL (2003) Cerebellar Loops with Motor Cortex and Prefrontal Cortex of a Nonhuman
Primate. The Journal of Neuroscience 23(23):8432–8444. https://doi.org/10.1523/JNEUROSCI.23-
23-08432.2003
Page 20/2637. Kim KS, Daliri A, Flanagan JR, Max L (2020) Dissociated Development of Speech and Limb
Sensorimotor Learning in Stuttering: Speech Auditory-motor Learning is Impaired in Both Children
and Adults Who Stutter. Neuroscience. https://doi.org/10.1016/j.neuroscience.2020.10.014
38. Knolle F, Schröger E, Kotz SA (2013) Cerebellar contribution to the prediction of self-initiated sounds.
Cortex 49(9):2449–2461. https://doi.org/10.1016/j.cortex.2012.12.012
39. Kronfeld-Duenias V, Amir O, Ezrati-Vinacour R, Civier O, Ben-Shachar M (2016a) The frontal aslant
tract underlies speech fluency in persistent developmental stuttering. Brain Structure Function
221(1):365–381. https://doi.org/10.1007/s00429-014-0912-8
40. Kronfeld-Duenias V, Amir O, Ezrati-Vinacour R, Civier O, Ben-Shachar M (2016b) Dorsal and ventral
language pathways in persistent developmental stuttering. Cortex 81:79–92.
https://doi.org/10.1016/j.cortex.2016.04.001
41. Kronfeld-Duenias V, Civier O, Amir O, Ezrati-Vinacour R, Ben-Shachar M (2018) White matter pathways
in persistent developmental stuttering: Lessons from tractography. Journal of Fluency Disorders
55:68–83. https://doi.org/10.1016/j.jfludis.2017.09.002
42. Leichnetz GR, Smith DJ, Spencer RF (1984) Cortical projections to the paramedian tegmental and
basilar pons in the monkey. Journal of Comparative Neurology 228(3):388–408.
https://doi.org/10.1002/cne.902280307
43. Loucks T, Chon H, Han W (2012) Audiovocal integration in adults who stutter. International Journal
of Language Communication Disorders 47(4):451–456. https://doi.org/10.1111/j.1460-
6984.2011.00111.x
44. Lu C, Chen C, Ning N, Ding G, Guo T, Peng D, Yang Y, Li K, Lin C (2010) The neural substrates for
atypical planning and execution of word production in stuttering. Exp Neurol 221(1):146–156.
https://doi.org/10.1016/j.expneurol.2009.10.016
45. Lu C, Chen C, Peng D, You W, Zhang X, Ding G, Deng X, Yan Q, Howell P (2012) Neural anomaly and
reorganization in speakers who stutter: A short-term intervention study. Neurology 79(7):625–632.
https://doi.org/10.1212/WNL.0b013e31826356d2
46. Lu C, Ning N, Peng D, Ding G, Li K, Yang Y, Lin C (2009) The role of large-scale neural interactions for
developmental stuttering. Neuroscience 161(4):1008–1026.
https://doi.org/10.1016/j.neuroscience.2009.04.020
47. Lu C, Peng D, Chen C, Ning N, Ding G, Li K, Yang Y, Lin C (2010a) Altered effective connectivity and
anomalous anatomy in the basal ganglia-thalamocortical circuit of stuttering speakers. Cortex
46(1):49–67. https://doi.org/10.1016/j.cortex.2009.02.017
48. Lu C, Peng D, Chen C, Ning N, Ding G, Li K, Yang Y, Lin C (2010b) Altered effective connectivity and
anomalous anatomy in the basal ganglia-thalamocortical circuit of stuttering speakers. Cortex
46(1):49–67. https://doi.org/10.1016/j.cortex.2009.02.017
49. Mangold SA, Das M, J (2020) Neuroanatomy, Reticular Formation. In StatPearls. StatPearls
Publishing. http://www.ncbi.nlm.nih.gov/books/NBK556102/
Page 21/2650. Max L, Guenther FH, Gracco VL, Ghosh SS, Wallace ME (2004) Unstable or Insufficiently Activated
Internal Models and Feedback-Biased Motor Control as Sources of Dysfluency: A Theoretical Model
of Stuttering. Contemporary issues in communication science disorders 31(Spring):105–122
51. Mayer M (1969) Frog, where are you? Dial Press, New York
52. Miall RC, Weir DJ, Wolpert DM, Stein JF (1993) Is the Cerebellum a Smith Predictor? J Mot Behav
25(3):203–216. https://doi.org/10.1080/00222895.1993.9942050
53. Middleton FA, Strick PL (1994) Anatomical Evidence for Cerebellar and Basal Ganglia Involvement in
Higher Cognitive Function. Science 266(5184):458–461. JSTOR
54. Middleton FA, Strick PL (2001) Cerebellar Projections to the Prefrontal Cortex of the Primate. The
Journal of Neuroscience 21(2):700–712. https://doi.org/10.1523/JNEUROSCI.21-02-00700.2001
55. Nichols TE, Holmes AP (2002) Nonparametric permutation tests for functional neuroimaging: A
primer with examples. Hum Brain Mapp 15(1):1–25
56. Pierpaoli C, Basser PJ (1996) Toward a quantitative assessment of diffusion anisotropy. Magn
Reson Med 36(6):893–906. https://doi.org/10.1002/mrm.1910360612
57. Postma A, Kolk H (1992) Error Monitoring in People Who Stutter: Evidence Against Auditory
Feedback Defect Theories. Journal of Speech Language Hearing Research 35(5):1024–1032
58. Purves D, Augustine GJ, Fitzpatrick D, Hall WC, LaMantia AS, McNamara JO, Williams S (2004)
Modulation of movement by the cerebellum. Neuroscience 3:435–452
59. Rhodes BJ, Bullock D (2002) A Scalable Model of Cerebellar Adaptive Timing and Sequencing: The
Recurrent Slide and Latch (RSL) Model. Applied Intelligence 17(1):35–48
60. Riley GD (2009) Stuttering Severity Instrument: SSI-4. Pro-Ed, Inc
61. Rohde GK, Barnett AS, Basser PJ, Marenco S, Pierpaoli C (2004) Comprehensive approach for
correction of motion and distortion in diffusion-weighted MRI. Magn Reson Med 51(1):103–114.
https://doi.org/10.1002/mrm.10677
62. Sares AG, Deroche MLD, Shiller DM, Gracco VL (2018) Timing variability of sensorimotor integration
during vocalization in individuals who stutter. Sci Rep 8(1):16340. https://doi.org/10.1038/s41598-
018-34517-1
63. Schmahmann JD, Pandya DN (1991) Projections to the basis pontis from the superior temporal
sulcus and superior temporal region in the rhesus monkey. Journal of Comparative Neurology
308(2):224–248. https://doi.org/10.1002/cne.903080209
64. Schmahmann JD, Pandya DN (1993) Prelunate, occipitotemporal, and parahippocampal projections
to the basis pontis in rhesus monkey. Journal of Comparative Neurology 337(1):94–112.
https://doi.org/10.1002/cne.903370107
65. Schmahmann JD, Pandya DN (1997) Anatomic Organization of the Basilar Pontine Projections from
Prefrontal Cortices in Rhesus Monkey. The Journal of Neuroscience 17(1):438–458.
https://doi.org/10.1523/JNEUROSCI.17-01-00438.1997
Page 22/26You can also read


