Comparative analysis on the anti inflammatory/immune effect of mesenchymal stem cell therapy for the treatment of pulmonary arterial hypertension ...
←
→
Page content transcription
If your browser does not render page correctly, please read the page content below
www.nature.com/scientificreports
OPEN Comparative analysis
on the anti‑inflammatory/immune
effect of mesenchymal stem
cell therapy for the treatment
of pulmonary arterial hypertension
Seyeon Oh1,2,12, Albert Y. Jang1,3,12, Sehyun Chae4,5,12, Seungbum Choi1,6, Jeongsik Moon1,2,
Minsu Kim1,3,7, Edda Spiekerkoetter8, Roham T. Zamanian8, Phillip C. Yang9,
Daehee Hwang4,10*, Kyunghee Byun1,2,11* & Wook‑Jin Chung1,3*
Despite the advancement of targeted therapy for pulmonary arterial hypertension (PAH), poor
prognosis remains a reality. Mesenchymal stem cells (MSCs) are one of the most clinically feasible
alternative treatment options. We compared the treatment effects of adipose tissue (AD)-, bone
marrow (BD)-, and umbilical cord blood (UCB)-derived MSCs in the rat monocrotaline-induced
pulmonary hypertension (PH) model. The greatest improvement in the right ventricular function was
observed in the UCB-MSCs treated group. The UCB-MSCs treated group also exhibited the greatest
improvement in terms of the largest decrease in the medial wall thickness, perivascular fibrosis, and
vascular cell proliferation, as well as the lowest levels of recruitment of innate and adaptive immune
cells and associated inflammatory cytokines. Gene expression profiling of lung tissue confirmed that
the UCB-MSCs treated group had the most notably attenuated immune and inflammatory profiles.
Network analysis further revealed that the UCB-MSCs group had the greatest therapeutic effect in
terms of the normalization of all three classical PAH pathways. The intravenous injection of the UCB-
MSCs, compared with those of other MSCs, showed superior therapeutic effects in the PH model for
the (1) right ventricular function, (2) vascular remodeling, (3) immune/inflammatory profiles, and (4)
classical PAH pathways.
Pulmonary arterial hypertension (PAH) is a debilitating disease with progressive elevation of the pulmonary
artery pressure and vascular resistance, which leads to pulmonary vascular remodeling and right ventricular
(RV) failure. Currently approved drugs that modulate the classical pathways (the endothelin, nitric oxide (NO),
and prostacyclin pathways) of PAH have shown therapeutic effects, although the mean survival time for a newly
diagnosed patient is reported to be only 3 to 7 y ears1,2. Stem cell-based therapies have emerged as an alternative
treatment option to the conventional therapies in various cardiovascular diseases3–7. It has been shown that
stem cells have pleotropic effects on angiogenesis, regeneration, and anti-inflammation in animal models8,9.
1
Gachon Cardiovascular Research Institute, Gachon University, Incheon, Republic of Korea. 2Functional Cellular
Networks Laboratory, Lee Gil Ya Cancer and Diabetes Institute, Gachon University, Incheon, Korea. 3Department
of Cardiovascular Medicine, Gachon University Gil Medical Center, Incheon, Republic of Korea. 4Center for Plant
Aging Research, Institute for Basic Science, Daegu Gyeongbuk Institute of Science and Technology, Daegu,
Republic of Korea. 5Korea Brain Bank, Korea Brain Research Institute, Daegu, Republic of Korea. 6Dongguk
University Ilsan Hospital Medical Center, Goyang, Republic of Korea. 7Department of Cardiology, Hallym University
Chuncheon Sacred Heart Hospital, Chuncheon, Republic of Korea. 8Department of Medicine, Vera M. Wall Center
for Pulmonary Vascular Disease, Stanford University, Stanford, CA, USA. 9Division of Cardiovascular Medicine,
Stanford Cardiovascular Institute, Stanford University School of Medicine, Stanford, CA, USA. 10Department
of Biological Sciences, Seoul National University, Seoul, Republic of Korea. 11Department of Anatomy and Cell
Biology, College of Medicine, Gachon University, Incheon, Republic of Korea. 12These authors contributed equally:
Seyeon Oh, Albert Y. Jang and Sehyun Chae. *email: daehee@snu.ac.kr; khbyun1@gachon.ac.kr; wjcheart@
gmail.com
Scientific Reports | (2021) 11:2012 | https://doi.org/10.1038/s41598-021-81244-1 1
Vol.:(0123456789)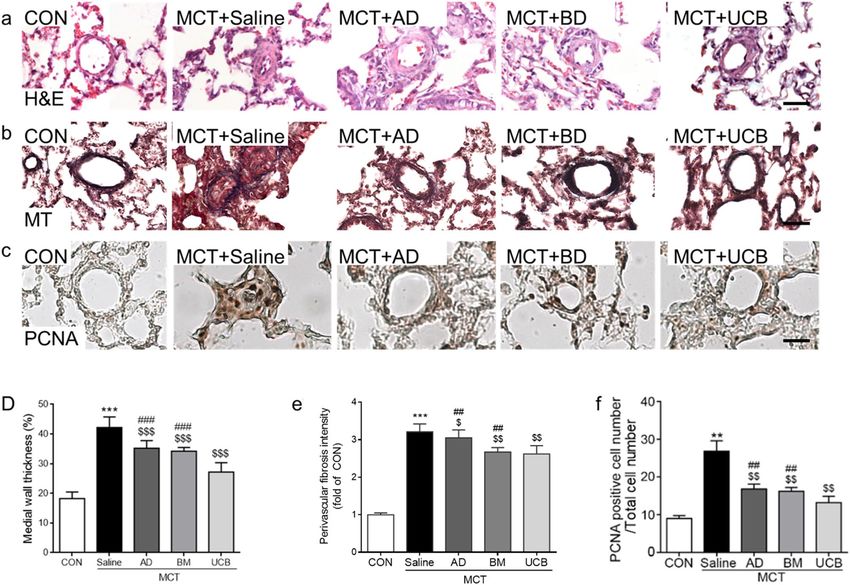
www.nature.com/scientificreports/
Mesenchymal stem cells (MSCs) are one of the most well-characterized stem cells that are clinically applicable
andling10–14. MSCs have
due to their trans-species/individual immune tolerance, rapid proliferation, and easy h
15
also been shown to be pluripotent and to have immune modulatory effects . The therapeutic effects of the MSCs
derived from adipose tissue (AD-MSC)16, bone-marrow (BM-MSC)17,18, and umbilical cord blood (UCB-MSC)
have shown promising data in animal models19, although head-to-head comparisons between these cell types in
a pulmonary hypertension (PH) model have not been investigated. Herein, we compared the therapeutic effects
of intravenous (IV) AD-, BM- and UCB-MSCs treatments in a monocrotaline induced PH (MCT + Saline) rat
model using echocardiography, histology, immunohistochemistry, and gene expression analysis.
Results
Characterization of the cultured MSCs. After culturing AD-, BM-, and UCB-MSCs, we first examined
the purity of the cultured MSCs by measuring the expression of a human MSC-specific positive marker (Cd44
or Cd90) and a negative marker (Cd34)15,20 (sFig. 1). All three MSC cell types showed strong peaks for the posi-
tive markers and virtually no signal for the negative marker, suggesting that the cultured MSCs were highly pure
human MSCs.
MSC therapy reverses RV pressure overload and dysfunction caused by PAH. To evaluate thera-
peutic effects of each type of MSCs in the MCT model, 1 × 10⁶ cultured MSCs were administered by IV tail injec-
tion at 2 weeks post-MCT injection (Fig. 1a). At two weeks post-MSC injection, RV function and pressure over-
load were assessed by echocardiography (Fig. 1b–f). At week 2, the MCT + Saline group showed an increased
tricuspid regurgitation maximal pressure gradient (TR max PG, 61.24 ± 4.31 mmHg) and decreased pulmo-
nary velocity acceleration time (PVAT, 12.65 ± 0.85 ms) were noted compared with the control (CON) group
(11.95 ± 3.99 mmHg for TR max PG and 18.99 ± 1.32 ms for PVAT), suggestive of RV pressure overload(Fig. 1c–
f). The increased TR max PG was significantly reduced by the administration of the MCT + BM (28.96% reduc-
tion, 43.93 ± 2.09 mmHg) and MCT + UCB (35.08% reduction, 39.76 ± 5.08 mmHg) (Fig. 1c). Compared with
the BM- and UCB-MSC treatments, the AD-MSC treatment led to a relatively weaker reduction (13.73% reduc-
tion, 52.83 ± 4.10 mmHg). The decreased PVAT in the MCT + Saline group was also significantly restored in the
MCT + AD (31.38% increase, 16.62 ± 1.85 ms), MCT + BM (20.63% increase, 15.26 ± 1.46 ms) and MCT + UCB
(12.41% increase, 14.22 ± 0.61 ms) groups (Fig. 1d). Tricuspid annular plane systolic excursion (TAPSE) and RV
fractional area contraction (RV FAC) were decreased in MCT + Saline group (1.71 ± 0. 09 mm for TAPSE and
24.95 ± 4.45% for RV FAC), suggestive of RV dysfunction caused by MCT + Saline (Fig. 1e,f). Decreased TAPSE
and RV FAC were also significantly restored in the MCT + AD (28.26% increase for TAPSE and 33.59% increase
for RV FAC), MCT + BM (26.09% increase for TAPSE and 69.70% increase for RV FAC) and MCT + UCB
(55.43% increase for TAPSE and 44.05% for RV FAC) groups (Fig. 1e,f). These data suggested that the BM- and
UCB-MSC treatments had the strongest restorative effect against impaired RV hemodynamics.
Protective effects of UCB‑MSCs on PAH‑induced vascular remodeling. Next, the pulmonary arte-
rial medial wall thickness and perivascular fibrosis in rat lungs were compared between the MCT + Saline and
the MCT + MSC-treated groups to assess the therapeutic effects of the MSCs. The MCT treatment significantly
increased the medial wall thickness and perivascular fibrosis compared with CON group (Fig. 2a,d). Overall,
the treatment of all three MSCs significantly reduced the MCT-induced increase in the media wall thickness for
MCT + AD, BM, and UCB groups, respectively (Fig. 2a,d). Intriguingly, the MCT + UCB group showed the most
significant the reduction compared with the other two MSC groups. Similarly, the increased perivascular fibrosis
in the MCT + Saline group was significantly reduced in the MCT + AD, MCT + BM, and MCT + UCB groups, and
the MCT + UCB group had more significant attenuation than the MCT + AD and MCT + BM groups (Fig. 2b,e).
Moreover, we next compared the efficacy of the three MSCs in attenuating vascular cell proliferation thorough
PCNA, proliferation marker (Fig. 2c,f). The increased percentage of PCNA-positive cells in the MCT + Saline
group was significantly reduced in the MCT + AD, MCT + BM, and MCT + UCB groups, and the MCT + UCB
group showed the greatest effect (Fig. 2f). These data collectively demonstrated that all three MSC treatments
showed protective effects on the medial wall thickening, perivascular fibrosis, and vascular cell proliferation in
the MCT + Saline group, and that the MCT + UCB had significantly greater effects than the other two MSC types.
Effective engraftment of the injected MSCs in lungs. To evaluate the effectiveness of the engraftment
of the injected MSCs, we next measured the levels of the human stem cell markers (CD44, CD90, CD29, human
nuclear antigen (HNA), and human Arthrobacter luteus (Alu)) within the MCT-treated lungs harvested at days
1, 3, 5, 7, and 14 post-MSC injection. Their mRNA levels can reflect the amounts of the engrafted MSCs at days
post-MSC injection. The mRNA levels of the three markers gradually decreased over time (sFig. 2). Intriguingly,
significant levels of the three markers were stably detected up to day 7, suggesting that significant portions of
all three MSCs were stably engrafted in the lungs. Among the three MSCs, the MCT + UCB showed the highest
mRNA levels of the three markers, especially at days 3 and/or 5 post-MSC injection, suggesting the most effec-
tive engraftment of the UCB-MSCs.
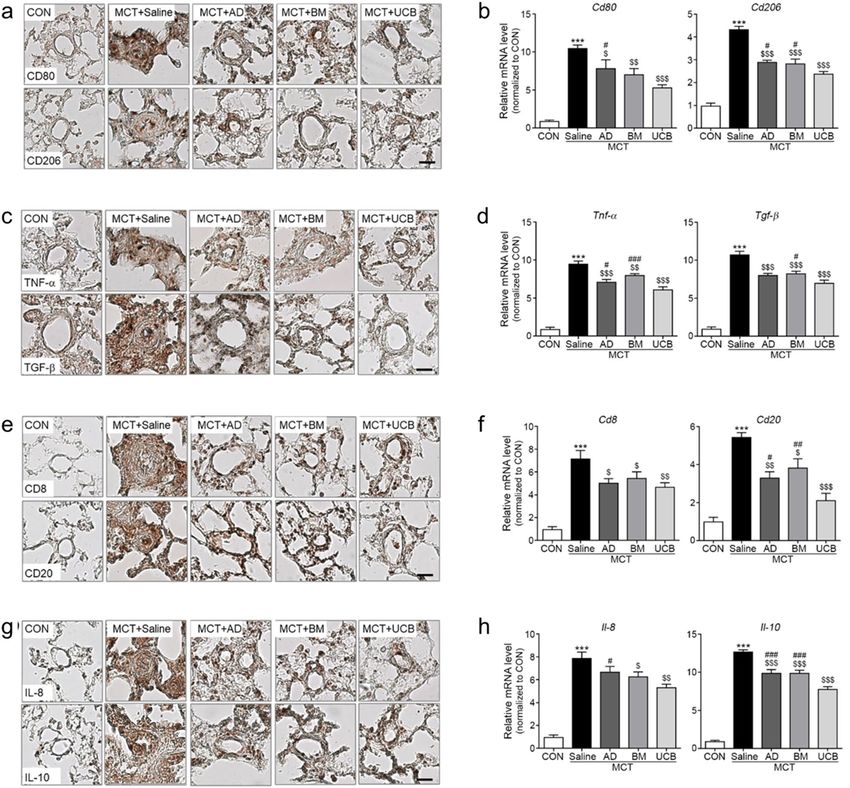
Inhibitory effects of UCB‑MSCs on innate and adaptive immunity. We next compared the level
of infiltrated inflammatory cells within the MCT-treated lungs harvested on day 14 post-MSC injection. The
immunostainings and mRNA levels of the representative markers CD80 and CD206 for the pro-inflammatory
macrophage (MΦ) subtype (M1) and pro-fibrotic MΦ subtype (M2), respectively, were significantly increased
in the MCT + Saline group. The increase was reduced in all MSC-treated groups, and such reduction was rela-
tively stronger in the MCT + UCB group (Fig. 3a,b). Moreover, we analyzed immunostaining and mRNA levels
Scientific Reports | (2021) 11:2012 | https://doi.org/10.1038/s41598-021-81244-1 2
Vol:.(1234567890)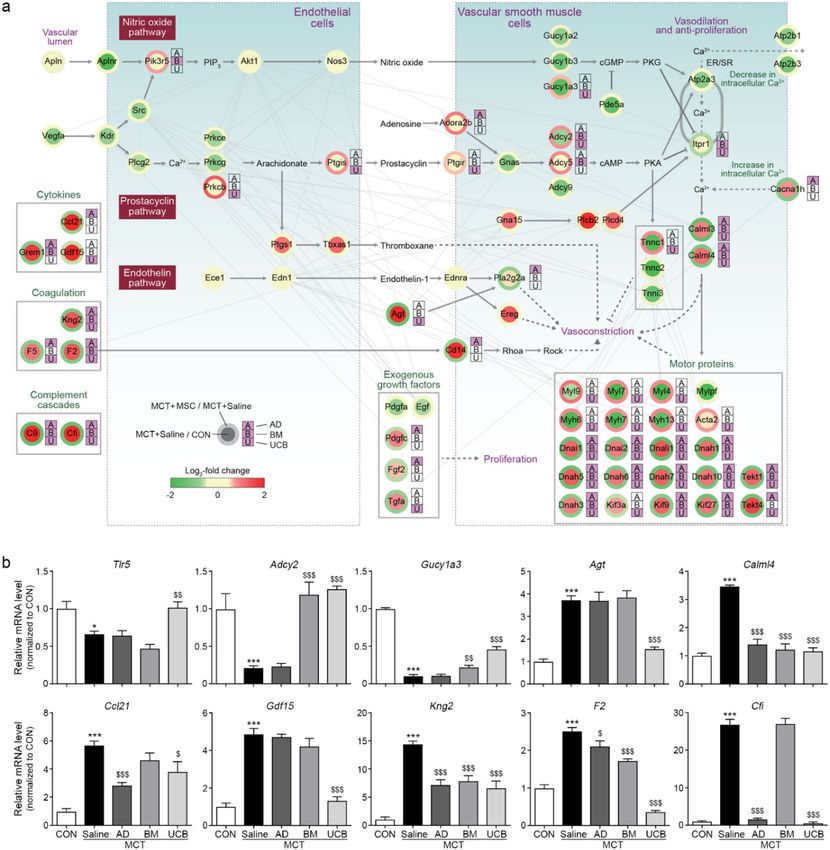
www.nature.com/scientificreports/

                                  Figure 1.  Echocardiographic analysis of MSC-treated lungs at week 2 and 4. (a) Schematic illustration of MCT and MSC treatment
                                  experiments. MCT was subcutaneously injected into 8-week-old male rats. At 2 weeks post-MCT injection, MSCs (1 × 10⁶ cells) were
                                  injected into randomized animals via the tail vein. At 4 weeks post-MCT injection, the echocardiography was performed before
                                  the animals were sacrificed for tissue analysis. (b) The effects of the MSC administration on right ventricular (RV) pressure and
                                  function were evaluated by echocardiography at week 2 and 4 post-MCT injection. Representative images of the short axis view of
                                  the echocardiogram showing the right and left ventricle of the rat heart. D-shaped left ventricles (LV) caused by elevated RV pressure
                                  were observed in MCT + Saline group, where the MSC injected groups had attenuated RV size and D-shaped compared with the
                                  MCT + Saline group. (c–f) The tricuspid regurgitation maximal pressure gradient (TR max PG), pulmonary velocity acceleration time
                                  (PVAT), tricuspid annular plane systolic excursion (TAPSE), and RV fractional area contraction (RV FAC) of each treatment group are
                                  shown. Each group was examined in n = 7 mice. Data are shown as the mean ± SD. Statistical significance is marked with 3 symbols. * for
                                  the comparison with control; $ for the comparison with the MCT + Saline group; # for the comparison with the MCT + UCB group; *, $,
                                  # P < 0.05; **, $$, ## P < 0.01; ***, $$$, ### P < 0.001 from Mann–Whitney test; CON: control ; MCT: monocrotaline; MSC: mesenchymal
                                  stem cell; RV: right ventricule; LV: left ventricle; AD: adipose tissue-derived; BM: bone-marrow-derived; UCB: umbilical cord blood-
                                  derived; TR max PG: tricuspid regurgitation max pressure gradient; PVAT: pulmonary velocity acceleration time; TAPSE: tricuspid
                                  annular plane systolic excursion; RV FAC: right ventricular fractional area contraction.

Scientific Reports |   (2021) 11:2012 |                   https://doi.org/10.1038/s41598-021-81244-1                                                                   3

                                                                                                                                                                 Vol.:(0123456789)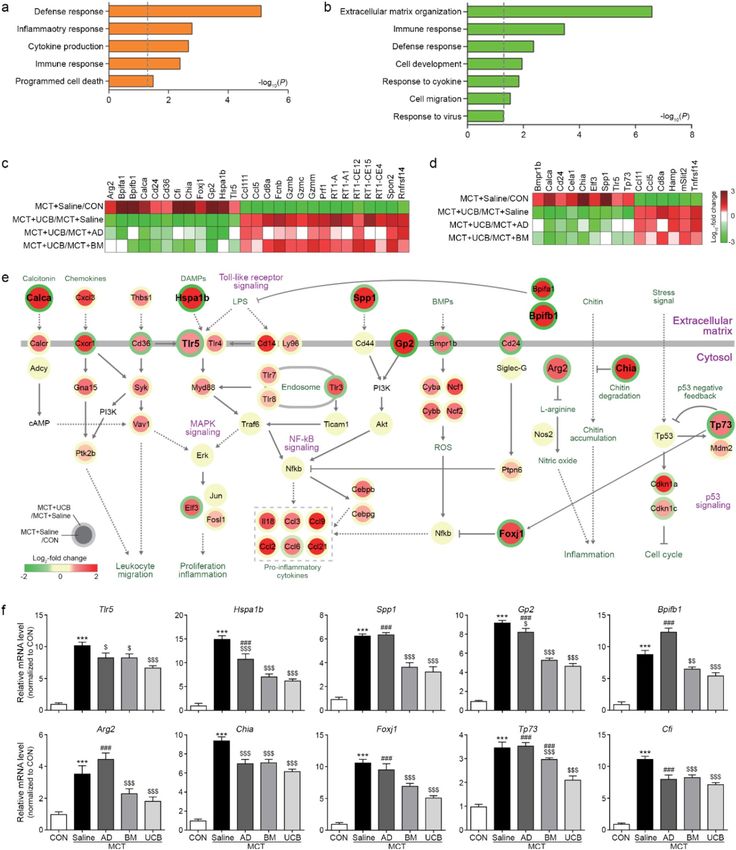
www.nature.com/scientificreports/

                                            Figure 2.  Histological and immunohistochemical analyses of vascular remodeling. (a–c) Representative
                                            images obtained from H&E (a), Masson’s Trichrome (b), and PCNA staining (c), which were used to evaluate
                                            the pulmonary arterial media thickness, perivascular fibrosis, and cell proliferation, respectively. The scale bar
                                            represents 100 μm. (d–f) Quantitation of the medial wall thickness (d), perivascular fibrosis intensity (e), and
                                            PCNA-positive cell numbers (f). Data are shown as the mean ± SD. Statistical significance is marked with 3
                                            symbols. * for the comparison with the control; $ for the comparison with the MCT + Saline group; # for the
                                            comparison with the MCT + UCB group; *, $, # P < 0.05; **, $$, ## P < 0.01; ***, $$$, ### P < 0.001 from Mann–
                                            Whitney test; CON: control ; MCT: monocrotaline; AD: adipose tissue-derived; BM: bone-marrow-derived;
                                            UCB: umbilical cord blood-derived.

                                            of the cytokines that represent the activated M1 (Tnf-α) and M2 (Tgf-β) (Fig. 3c,d). The mRNA levels of these
                                            cytokines were increased in the MCT + Saline group. Similarly, the increase was significantly reduced in all the
                                            MSC-treated groups, and the reduction was relatively stronger in the MCT + UCB group (Fig. 3c,d). Further-
                                            more, we examined whether the attenuated innate immunity further modulates adaptive immunity by measur-
                                            ing the mRNA levels of Cd8 and Cd20, T and B cell markers, respectively. Immunostainings and mRNA levels
                                            of these markers were significantly increased in the MCT + Saline group, although MCT + UCB group had the
                                            largest reversing effects (Fig. 3e,f). Similar immunostaining and mRNA expression patterns of Il-10 and Il-8
                                            that represent T and B cell activations, respectively, were observed in the MCT + Saline and MSC-treated groups
                                            (Fig. 3g,h). Collectively, these data suggest that UCB-MSCs more strongly attenuate innate and adaptive immu-
                                            nity associated with inflammation and fibrosis in the MCT + Saline model.

                                            Modulation of PAH‑related processes by the MSCs.               We next conducted gene expression profiling of
                                            the MSC-treated lung tissues to understand the molecular nature underlying the MSC-induced attenuation of
                                            PAH phenotypes in the MCT + Saline model. To identify the genes affected by MCT and the MSCs, we performed
                                            the following four comparisons: (1) MCT versus saline control (MCT + Saline/CON), (2) AD-MSC versus MCT
                                            (MCT + AD/MCT + Saline), (3) BM-MSC versus MCT (MCT + BM /MCT + Saline), and (4) UCB-MSC versus
                                            MCT (MCT + UCB/MCT + Saline). A total of 3423 differentially expressed genes (DEGs) with an FDR ≤ 0.05
                                            were identified from these comparisons, including 1981, 899, 1078, and 1424 DEGs for MCT + Saline/CON,
                                            MCT + AD/MCT + Saline, MCT + BM/MCT + Saline, and MCT + UCB/MCT + Saline, respectively (Fig. 4a).
                                            The DEGs were subsequently categorized into 8 groups (G1–8) based on their up- or down-regulation pat-
                                            terns by MCT + Saline and/or the MSCs (sFig. 3). Among G1–8, we focused on the four groups (G1–4) whose
                                            expression levels were differently changed by MCT + Saline and the MSCs, which can explain the effects of the
                                            MSCs in the MCT + Saline model (Fig. 4b). The largest number of DEGs were identified from MCT + UCB/

          Scientific Reports |   (2021) 11:2012 |                https://doi.org/10.1038/s41598-021-81244-1                                                      4

Vol:.(1234567890)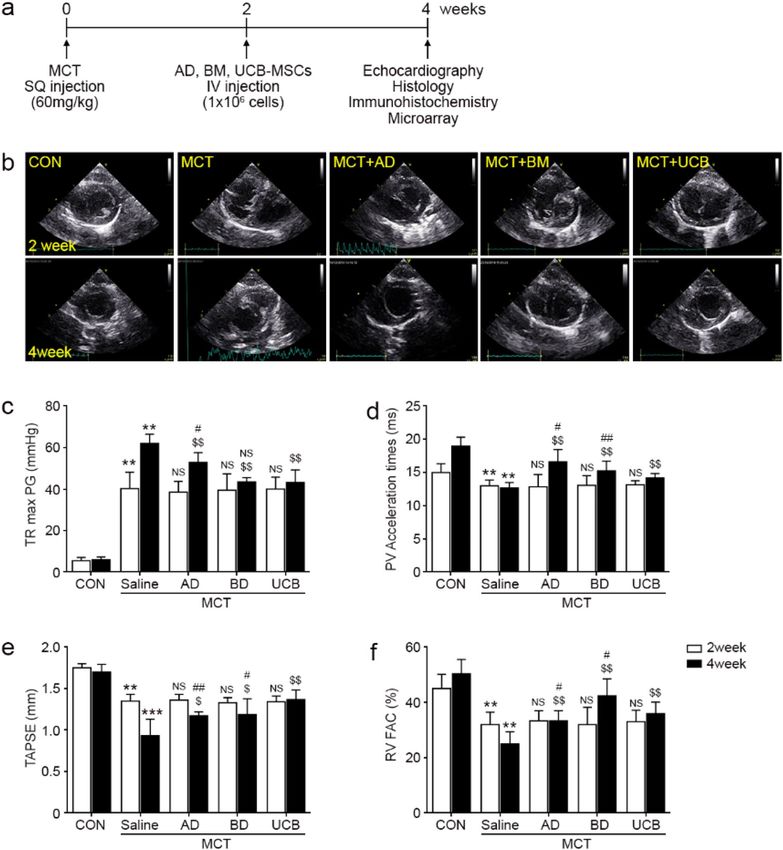
www.nature.com/scientificreports/
Figure 3. Inhibitory effects of UCB-MSCs on innate/adaptive immunity and inflammation. (a,b)
immunostainings and mRNA expression levels of the markers for M1 macrophages (Cd80), and M2
macrophages (Cd206). (c,d) immunostainings and mRNA expression levels of inflammatory cytokines of M1
(Tnf-α) and M2 macrophages (Tgf-β). (e,f) immunostsainings and mRNA expression levels of the markers
for T cells (Cd8) and B cells (Cd20). (g,h) immunostainings and mRNA expression levels of the inflammatory
cytokines in T cells (IL-10) and B cells (IL-8). Data are shown as the mean ± SD. Statistical significance is marked
with 3 symbols. * for the comparison with the control; $ for the comparison with the MCT + Saline group; # for
the comparison with the MCT + UCB group; *, $, #P < 0.05; **, $$, ##P < 0.01; ***, $$$, ###P < 0.001 by Mann–
Whitney test; MCT: monocrotaline; CON: control; AD: adipose tissue-derived; BM: bone-marrow-derived;
UCB: umbilical cord blood-derived.
MCT + Saline (Fig. 4a), and G1–4 included a larger number of DEGs from MCT + UCB/MCT + Saline com-
pared with those from MCT + AD/MCT + Saline and MCT + BM/MCT + Saline, suggesting that UCB-MSCs
most strongly affected gene expression in the MCT + Saline model (Fig. 4b). Next, we identified cellular pro-
cesses associated with G1–4 by performing enrichment analysis of GOBPs using the DAVID s oftware21 (Fig. 4c).
G1–4 were strongly associated with PAH-related cellular processes, such as (1) inflammation (inflammatory
response, Mɸ cytokine production, and wound healing); (2) vascular remodeling (cell adhesion, extracellular
matrix organization, cell proliferation, and blood vessel remodeling); (3) angiogenesis (response to hypoxia and
blood vessel development); (4) apoptosis (apoptotic signaling pathway); and/or (5) cytoskeleton organization
(cilium organization, microtubule-based movement, and regulation of actin cytoskeleton organization. Collec-
tively, these data suggest that UCB-MSCs most greatly modulate PAH-related process including inflammation
and vascular remodeling (Fig. 4c).
Scientific Reports | (2021) 11:2012 | https://doi.org/10.1038/s41598-021-81244-1 5
Vol.:(0123456789)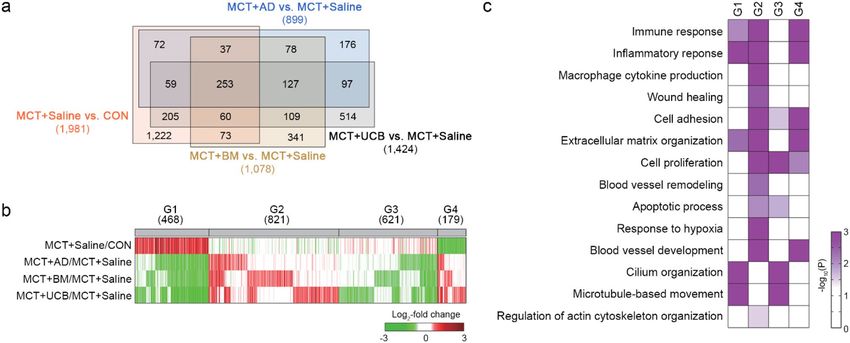
www.nature.com/scientificreports/
Figure 4. Cellular processes affected by AD-, BD-, and UCB-MSCs in the MCT model. (a) Venn diagram
showing the relationships among the DEGs from the four indicated comparisons. Numbers in parentheses
represent the numbers of DEGs identified from the comparisons. (b) Heat map showing the differential
expression of the genes in G1–4. The colors indicate up-regulation (red) and down-regulation (green) in MCT,
and AD-, BD-, and UCB-MSCs, compared to the control conditions in the corresponding comparisons. The
color bar represents the gradient of the log2-fold-changes in the comparisons. Numbers in parentheses represent
the numbers of DEGs in the indicated groups. (c) GOBPs represented by the genes in G1–4. The color bar
represents the gradient of − log10(p), where p is the significance of the individual GOBPs that are enriched by the
DEGs in G1–4. The heat map was generated using MATLAB (imagesc.m in R2019a; www.mathworks.com/).
DEG: differentially expressed genes; GOBP: gene ontology biological processes; MCT: monocrotaline; CON:
control; AD: adipose tissue-derived; BM: bone-marrow-derived; UCB: umbilical cord blood-derived.
Predominant effects of UCB‑MSCs on inflammatory response. As UCB-MSCs showed more
inhibitory effects on PAH phenotypes compared with AD- and BM-MSCs, we next identified the genes showing
up- or down-regulation in the MCT + UCB group compared with the MCT + AD and BM groups. To this end,
among the 468 up-regulated genes by MCT + Saline in G1 and 179 down-regulated genes in G4 (Fig. 4b), we
first identified 380 (G1) and 135 genes (G4) that showed the reversion of the MCT-induced expression changes
by UCB-MSCs (sFig. 4a). Of these genes, we further selected 108 (G1) and 88 genes (G4) that showed the
stronger reversion of the MCT-induced expression changes by UCB-MSCs than by AD- and BM-MSCs through
the comparisons of UCB-MSC versus AD-MSC (MCT + UCB/MCT + AD) and UCB-MSC versus BM-MSC
(MCT + UCB/MCT + BM) (sFig. 4a). The enrichment analysis of the GOBPs revealed that the 108 up-regulated
genes were mainly involved in cellular processes related to inflammatory response (defense, inflammatory, and
immune responses, and cytokine production) (Fig. 5a). The 88 down-regulated genes were mainly involved in
the processes related to immune response (defense response, and responses to cytokine and virus), cell develop-
ment and migration, and extracellular matrix organization (Fig. 5b). Together with the findings in Fig. 3, these
data suggest that the inflammation and immune response-related processes may play critical roles in the inhibi-
tory effects of UCB-MSCs on PAH phenotypes.
Next, we thus selected 27 genes related to inflammation (Fig. 5c) and 15 genes related to immune and defense
responses (Fig. 5d) and found that they included both upregulated and downregulated genes by MSCs. To sort
out cellular processes upregulated and downregulated predominantly by UCB-MSCs in the MCT-treated con-
dition, we built network models describing interactions among these upregulated (Fig. 5e) or downregulated
(sFig. 4b) genes involved in the inflammatory and immune responses. The network model for the upregulated
genes (Fig. 5e) showed that UCB-MSCs predominantly downregulated pro-inflammatory pathways activated
by MCT, including damage-associated molecular patterns, such as heat shock protein A member 1b (Hspa1b),
its receptor [toll-like receptor 5 (Tlr5)), and other modulators and their cofactors (Arg2, Chia, Spp1, and Gp2),
as well as resolution of inflammation (Bpifa1/b). The UCB-MSCs also negatively regulated of the MCT-induced
T and B cell activation (Tp73, and Foxj1). These data suggest that UCB-MSCs, compared with AD- and BM-
MSCs, more strongly decrease the inflammatory responses induced by MCT + Saline in general, including early
inflammation and late resolution of inflammation, as well as activation of adaptive immune responses (T and
B cell activations). On the other hand, the network model for the downregulated genes (sFig. 4b) showed that
UCB-MSCs predominantly upregulated the pathways induced by pathogen infections, which were downregu-
lated by MCT, including complement cascade (Fcnb and C4bpa), NK cell activation (Klrb1a/c, Spon2, and Slit2),
cytotoxic T cell-mediated cell killing pathways-MHC1 class 1 presentation (RT1-A/A1, RT1-CE2/3/4/12/14/15/16,
RT1-S2/3, and Tap1/2), and killing of target cells (Gzma/b/c/k/m, and Prf1). These data suggest that the injected
MSCs are killed as foreign cells by these pathways, and the predominant activation of these pathways in the
MCT + UCB group reflects a prolonged survival of UCB-MSCs, compared with AD- and BM-MSCs, consistent
with the findings illustrated in sFig. 2.
Scientific Reports | (2021) 11:2012 | https://doi.org/10.1038/s41598-021-81244-1 6
Vol:.(1234567890)www.nature.com/scientificreports/
Finally, we confirmed stronger upregulation and downregulation of the representative genes involved in
inflammatory and immune responses (Arg2, Hspa1b, Spp1, Gp2, Bpifb1, Chia, Tp73, Foxj1, and Cfi; Fig. 5F) and
killing of target cells (Fcnb, Spon2, RT1-A, RT1-CE4, and RT1-CE12; sFig. 4c) in the MCT + UCB group, compared
with in the MCT + AD and BM groups. Taken together, all these data suggest that UCB-MSCs, compared with
AD- and BM-MSCs, more strongly suppress the progression of inflammation induced by MCT and thereby the
resolution of inflammation as well.
Inhibitory effects of UCB‑MSCs on PAH progression through the PAH and inflammation‑related
pathways. To understand the effects of the MSCs on the classical PAH pathways (prostacyclin, endothelin,
and NO pathways), we reconstructed a network model describing how the MSCs modulated the MCT-induced
expression changes of the components in the PAH pathways. The network model showed down-regulation of
prostacyclin and NO pathways (Gucy1a2/a3/b3 in NO pathway and Gnas and Adcy2/9 in prostacyclin pathway)
by MCT, which promote vasodilation (Fig. 6a, upper part). In contrast, the network model showed up-regulation
of endothelin pathway (Ereg and Agt) by MCT, which promotes vasoconstriction, consistent with the previous
findings (Fig. 6a, middle part)22. Intriguingly, these alterations in the three pathways were restored by the MSCs
(Gucy1a3 in NO pathway; Prkcb, Ptgir/s, Adora2b, and Adcy2/5 in prostacyclin pathway; and Agt and Pla2g2a in
endothelin pathway). Moreover, the network model showed the effects of the MSCs on C a2+ signaling pathway
2+
that closely interacts with the above PAH pathways (Fig. 6a, right part). Ca transporters were altered (down-
regulation of Atp2a3/2b1/2b3 and up-regulation of Cacna1h) by MCT to increase the cytosolic Ca2+ concen-
tration and activate Ca2+ signaling (Calml3/4) and motor protein complexes (Dnas and Kifs), which promote
vasoconstriction. These alterations were also restored by the MSCs (Cacna1h and Calml3/4). Furthermore, the
network model showed up-regulation of inflammation-related pathways, cytokine (Ccl21, Grem1, and Gdf15)
and coagulation factor (Kng2 and F2/5) pathways by MCT, which can promote vasoconstriction (Fig. 6a, left).
These alterations were also restored by the MSCs. These data suggest that the MSCs can contribute to the resto-
ration of the MCT-induced changes in the PAH and inflammation pathways. However, the comparison of the
numbers of the components in the network model reversed by the individual MSCs revealed that UCB-MSCs
(38 components) had the largest number of the components affected by MCT compared with AD- (28 compo-
nents) and BM-MSCs (23 components). Next, we validated these MSC-induced recovery patterns caused by
MCT for the following representative components in the PAH or inflammation pathways by qRT-PCR analysis:
(1) Ptgis and Adcy2 in the prostacyclin pathway; (2) Gucy1a3 in the NO pathway; (3) Agt in the endothelin
pathway; (4) Calml4 in the C a2+ signaling pathway; and (5) Ccl21, Gdf15, Kng2, F2, and F5 in inflammation
pathways (Fig. 6b). Overall, all these data suggest that MSCs reverse the MCT-induced changes in the PAH
and inflammation pathways. The UCB-MSCs, among the MSCs, can serve as the most potent MSC with such
antagonizing effects.
Discussion
Despite the recent advent of the use of stem cell paracrine factors, such as exosomes and small molecules, as
a treatment option in cardiovascular m edicine23,24, MSC cell therapy remains a potent and valuable biological
treatment option. Although cell-free exosome treatment has been shown to replicate the effects of stem cell
therapy to a certain extent, the heterogeneity of the exosomes, low reproducibility, and short half-life bring into
question whether the treatment effects could be consistently s ustained25–27. Doubts have also been raised about
whether small molecules derived from stem cells, such as microRNAs, could outperform the pleotropic effects
of stem cells. Embryonic stem cells can give rise to virtually all cell lineages, although they are predisposed to
teratoma formation and are difficult to obtain without encountering ethical issues28,29. The discovery of induced
pluripotent stem cells has resolved such ethical issues29, but the genetic instability observed under in vitro culture
conditions, expensive media costs, propensity for teratoma formation, and relatively long period required for
cell reprogramming have been obstacles for their immediate clinical a pplication30–32. MSCs are free from ethi-
cal issues29, easy to obtain from human tissues10,13, immune tolerant between species or individuals11,12,14, stable
under various types and lengths of in vitro culture, and able to be rapidly expanded in an economic f ashion10,13,
which makes them an attractive treatment option.
The most widely investigated MSCs are the AD-, BM-, and UCB-MSCs. All three MSC types have shown
promising treatment effects in animal PH models, although a comparison between the three has not been made
to date16,19,33,34. We therefore systematically performed a comparative analyses of PAH phenotypes (inflammatory
profiles, histological features of vascular remodeling, and echocardiographic parameters of the RV), engraftment
features, genome-wide mRNA expression profiles, and the associations with the classical PAH cellular pathways.
The MSCs significantly restored the PAH phenotypes (Fig. 1–3), modulated PAH-related cellular processes
(Fig. 4), and interacted with the classical PAH pathways (NO, prostacyclin, and endothelin) and inflammation-
related pathways (Fig. 6). Interestingly, the tissue transcriptome revealed that a substantial portion of the genes
that showed significantly different expression compared with the MCT group were genes involved in the immune
response and inflammation (Fig. 4). The attenuation of the recruitment of total alveolar macrophages and the
M1 and M2 subsets (Fig. 3a) are associated with the decrease of both pro- and anti-inflammatory responses
(Fig. 3b)35. The subsequent decrease of adaptive immunity was substantiated by the diminished recruitment of
T and B cells (Fig. 3c) and the levels of cytokines (Fig. 3d). These features support the immunomodulatory role
of MSCs in PAH.
Of the 3 types of MSCs, the UCB-MSCs showed the most promising results for the RV pressure overload
and function (Fig. 1), histological properties (Fig. 2), engraftment (sFig. 1), immune/inflammation modulation
(Figs. 3, 5), and classical PAH pathways (Fig. 6). The UCB-MSCs had the most potent effects in attenuating
the inflammatory and innate immune responses, and in subsequently decreasing the expression of T and B
Scientific Reports | (2021) 11:2012 | https://doi.org/10.1038/s41598-021-81244-1 7
Vol.:(0123456789)www.nature.com/scientificreports/
Scientific Reports | (2021) 11:2012 | https://doi.org/10.1038/s41598-021-81244-1 8
Vol:.(1234567890)www.nature.com/scientificreports/
◂Figure 5. Inhibitory effects of UCB-MSC administration on the immune and inflammatory responses. (a,b)
GOBPs represented by the upregulated (a) and downregulated (b) genes predominantly by UCB-MSCs.
Enrichment significance (p) for each GOBP is displayed in − log10(p). (c,d) Heat maps showing the differential
expression of the genes involved in the inflammatory (c) and immune responses (d). The color bar represents
the gradient of the log2-fold-changes in the comparisons. The heat map was generated using MATLAB
(imagesc.m in R2019a; www.mathworks.com/). (e) A network model describing interactions among the
predominantly upregulated genes by UCB-MSCs. Node center and boundary colors represent upregulation
(red) and downregulation (green) by MCT and UCB-MSCs, respectively. Solid and dotted arrows (or
inhibition symbols) denote direct and indirect activations (or inhibition), respectively. The color bar represents
the gradient of log2-fold-changes in the corresponding comparison (MCT + Saline/CON or MCT + UCB/
MCT + Saline). The network model was generated using Cytoscape software (v.3.3.0; www.cytoscape.org/).
(f) Confirmation of the predominant upregulation of the indicated three representative genes involved in the
inflammatory and immune responses by qRT-PCR. The expression levels were normalized with respect to those
in the control group. The normalized data are expressed as the mean ± SD. Statistical significance is marked
with 3 symbols. * for the comparison with the control; $ for the comparison with the MCT + Saline group; # for
the comparison with the MCT + UCB group; *, $, #P < 0.05; **, $$, ##P < 0.01; ***, $$$, ###P < 0.001 by Mann–
Whitney test; GOBP: gene ontology biological processes; MCT: monocrotaline; CON: control; AD: adipose
tissue-derived; BM: bone-marrow-derived; UCB: umbilical cord blood-derived.
cell markers, which may be the result of a reduction in the recruitment of lymphocytes due to the decreased
activation of MΦ. Moreover, according to the network model, the UCB-MSCs had the most significant effect
in restoring the PAH and inflammation-related pathways (Fig. 6). These controls of the immune responses by
the UCB-MSCs may have led to the better engraftment profiles in MCT + UCB group, for which the engrafted
cell survival was the highest. Interestingly, the potent immunomodulatory effects of the UCB-MSCs could be
translated to improved RV pressure overload and function as shown in Fig. 1c–f.
The exact mechanisms behind the anti-inflammatory effects of MSCs and improved heart function are not
clearly understood. The reduced pro-inflammatory factors predominantly by UCB-MSCs may act as a potential
link of the inflammation to the alleviation of the RV pressure and volume overload. Gene expression profiling and
network analysis showed that the modulation of pro-inflammatory factors (Arg2, Hspa1b, Tlr5, Spp1, and Gp2)
genes may help delineate the attenuated immune response and anti-inflammatory phenotypes that we observed
in the MCT + UCB group. In particular, Tlr5 has been shown to be expressed in the intestinal epithelia and in
endothelial cells that recognize bacterial flagellin and further to mediate the innate immune r esponses36. Recently,
the involvement of Tlr5 in inflammatory diseases such as rheumatoid arthritis was also d iscovered37,38. Although
the role of Tlr5 in PAH has not been elucidated, our data show that the expression level of Tlr5 is increased in
the MCT + Saline group, and such increase is normalized by the MSC treatment, with the most prominent effect
observed in the MCT + UCB group. This may suggest that the Tlr5-mediated innate immune response may play
a role in the pathogenesis of PAH and that the down-regulation of Tlr5 may contribute to an attenuation of the
development of PAH. It has been also suggested that Tlr5 may be a Tnf-α responsive g ene37, indicating that the
attenuated Tlr5 levels may reflect the low Tnf-α levels in the MCT + UCB group. Future studies are warranted to
validate the relationship between Tlr5 and Tnf-α.
G2 showing no change by MCT, but upregulation by MSCs in the MCT-treated condition was associated with
PAH-related processes (immune and inflammatory responses, cytokine production, cell proliferation, blood
vessel development, and response to hypoxia), suggesting that MSCs induce MCT-independent upregulation
of these processes. This observation seems inconsistent with the results presented in Fig. 3. Unlike the MCT-
independent upregulation of PAH-related processes in G2, however, the results in Fig. 3 represent restoration
of the MCT-dependent upregulation of PAH-related processes by MSCs. These PAH-related processes were
represented by the genes in G1 (upregulated by MCT and downregulated by MSCs), G2, and/or G4 (down-
regulated by MCT and upregulated by MSCs). Network analysis showed that G1 was mainly associated with
inflammatory responses induced by MCT, including early inflammation, late resolution of inflammation, and
activation of adaptive immune responses, whereas G4 was associated with cytotoxic immune response related
to killing of the injected MSCs. Interestingly, G2 was predominantly associated with killing of the injected MSCs
(e.g., macrophage activation leading to activation of NK and cytotoxic T cells, as well as neutrophil and B cells;
sFig. 4), which is closely linked to the network model for G4 (sFig. 4b). Moreover, the genes involved in blood
vessel development in G2 were not closely associated with a central VEGF signaling in angiogenesis, suggesting
that they are the indirect angiogenic factors related to immune responses. Also, the genes involved in blood ves-
sel development (45.1%, 23 of 51 genes) and cell proliferation (42.0%, 55 of 131 genes) in G2 overlapped with
those involved in immune and inflammatory responses, suggesting that the above conclusion (i.e., killing of the
injected MSCs) for the immune and inflammatory responses may apply to these processes.
Previous studies have shown that MSCs derived from human embryonic stem cells (hESCs)39 or induced-
pluripotent stem cells (iPSCs)40,41 show potent therapeutic effect. The MSCs, however, have advantages over its
other two counterparts for several reasons, as the clinical availability of hESCs and iPSCs can be a major setback.
The hESCs can give rise to virtually all cell lineages, although they predispose to teratoma formation and are
difficult to obtain without encountering ethical i ssues28,29. The discovery of the iPSCs has resolved such ethical
issues29, but genetic instability under in vitro culture conditions, expensive media costs, propensity for teratoma
formation, and a relatively long period required for cell reprogramming have been obstacles for immediate clini-
cal application30–32. MSCs are free from ethical issues29, easy to obtain from human tissues10,13, immune tolerant
over species or individuals11,12,14, are stable under various and prolonged in vitro cultures conditions, and can
be rapidly expanded economically10,13, which makes it an attractive treatment option.
Scientific Reports | (2021) 11:2012 | https://doi.org/10.1038/s41598-021-81244-1 9
Vol.:(0123456789)www.nature.com/scientificreports/
Figure 6. Inhibitory effects of UCB-MSCs on PAH progression. (a) Network model describing modulation of
PAH and inflammation-related signaling pathways by the MSCs. Node center and boundary colors represent
upregulation (red) and downregulation (green) by MCT and UCB-MSCs, respectively. The color bar represents
the gradient of log2-fold-changes in the corresponding comparison (MCT + Saline/CON or MCT + UCB/
MCT + Saline). The stacked bar shows which MSC significantly affected the corresponding genes: for example,
‘U’ in purple indicates the corresponding gene was identified as a DEG in the comparison of MCT + UCB
versus MCT + Saline. The color bar denotes the gradient of the log2-fold-changes in the four comparisons. Edges
represent the protein–protein interactions (gray) between the genes in the network model, which were collected
from the five interactome databases. Solid and dotted arrows (or inhibition symbols) denote direct and indirect
activations (or inhibition), respectively. The network model was generated using Cytoscape software (v.3.3.0;
www.cytoscape.org/). (b) Confirmation of the differential expression of the indicated representative genes
involved in the PAH and inflammation-related pathways. The expression levels were normalized with respect
to those in the CON group. The normalized data are expressed as the mean ± SD.* for the comparison with the
control; $ for the comparison with the MCT + Saline group; # for the comparison with the MCT + UCB group;
*, $, #P < 0.05; **, $$, ##P < 0.01; ***, $$$, ###P < 0.001 by Mann–Whitney test; DEG = differentially expressed
genes; MCT = monocrotaline; CON = control; AD = adipose tissue-derived; BM = bone-marrow-derived;
UCB = umbilical cord blood-derived.
Scientific Reports | (2021) 11:2012 | https://doi.org/10.1038/s41598-021-81244-1 10
Vol:.(1234567890)www.nature.com/scientificreports/
The data from our study were obtained from the MCT- + Saline PH model, which may not entirely reflect the
true patholobiology of human PAH. The lack of validation of our findings in other robust models, such as the
hypoxic model or the Sugen-hypoxia model, may undermine the validity of our study. Further studies extending
our findings in the hypoxic and sugen-hypoxia model are warranted. Additionally, we were not able to confirm
our echocardiographic estimates of RV systolic pressure (RVsP) through direct right heart catheterization (RHC).
Despite its conveniences in estimating RVsP or mean pulmonary artery pressure, the diagnostic accuracy of
echocardiography has been a concerning i ssue42, leading to guidelines recommending right heart catheterization
(RHC) as a gold standard for confirming the diagnosis of pulmonary h ypertension43. Experimental PH models
44
have also confirmed their findings using RHC . Accordingly, we acknowledge that the lack of validation by direct
pressure measurement is a major limitation of our study. Our data in this sense should be reviewed with caution.
In this study, we focused on the comparison of the effects of three different representative MSCs on PAH phe-
notypes and the restoration of the MSC-perturbed gene expression profiles, and found that UCB-MSCs, among
the MSCs tested, had the most potent protective effects on PAH phenotypes, as well as the association of the UCB-
MSC-induced gene expression changes (PAH and/or inflammation-related pathways) with the improved PAH
phenotypes. Although it can be considered valuable as an initial comparative study, further mechanistic studies
are warranted to elucidate the functional link of the attenuated inflammation to the improved PAH phenotypes.
In conclusion, the present comparative, systemic analysis of AD-, BM- and UCB-MSC cell therapy in the
rat MCT model demonstrated that although all 3 MSC types had therapeutic benefits, the UCB-MSC treatment
showed the most promising features in terms of the (1) RV function, (2) histological features, (3) cell engraftment,
(4) classical PAH pathways, and (5) immune/inflammatory responses. Due to the lack of direct hemodynamic
pressure measurement, however, the current data needs to be interpreted with caution.
Methods
This study was identified the institutional and/or licensing committee approving the experiments, including
any relevant details and confirmed that all experiments were performed in accordance with relevant guidelines
(ARRIVE guidelines) and regulations.
Animal model of PH. Eight-week-old Sprague Dawley male rats (250–300 g) used in this study were in a
pathogen-free and climate-controlled facility with a 12-h light/dark cycle and were fed ad libitum throughout
the experiment. The study was approved by the Center of Animal Care and Use of Gachon University (AAALAC;
approval number LCDI-2013-0015). The PAH rat model was induced by a single subcutaneous injection (60 mg/
kg) of MCT (cat. C2401; Sigma-Aldrich, USA)39,40. The control (CON) and MCT + Saline group (n = 7) was
injected with saline. AD and UCB-derived MSCs were purchased from Medipost (Seongnam, Korea) and BM-
derived MSCs were purchased from Cefobio (Seoul, Korea). At two weeks post-MCT injection, 1.0 × 10⁶ AD-
(n = 7), BM- (n = 7), and UCB- (n = 7) MSCs were administered by an IV tail vein injection. Echocardiography,
tissue harvesting for immunohistochemistry, histology and microarray were performed at the fourth week post-
MCT injection, as shown in Fig. 1a. The survival of engrafted MSCs were assessed by measuring human MSC
markers, such as Cd44, Cd90, Cd29, HNA, and Alu at day 1, 3, 5, 7, and 14 after MSC injection (sFig. 2).
Echocardiography. After rats were anesthetized with isoflurane, transthoracic echocardiography was per-
formed using a 12 MHz probe (GE Healthcare) and a Vivid Q (GE Healthcare, Israel). The assessed transthoracic
echocardiographic parameters included the maximum TR max PG, TAPSE, PVAT, and RV FAC45. TR max PG
and TAPSE was measured in the apical 4 chamber view, whereas the PVAT and RV FAC was evaluated in the
short-axis view46. Echocardiographic parameters were measured following the recommendations of the Ameri-
can Society of Echocardiography. The pulmonary artery systolic pressure was calculated as 4V2 + right atrial
pressure, where V was the maximal velocity of the tricuspid regurgitated jet39. The TR max PG and PVAT were
measured to estimate RV pressure overload, whereas TAPSE and RV FAC were were examined as indicators of
RV functional. The sample sizes of each treatment arm were n = 7 for CON, n = 7 for the MCT + Saline, n = 7 for
MCT + AD, n = 7 for MCT + BM, and n = 7 for MCT + UCB.
Paraffin‑embedded tissue section processing. The collected lung tissues are washed with cold PBS
and stored in 4% paraformaldehyde at 4 °C for 12 h. The fixed tissue is washed for 12 h for embedding and a par-
affin block was processed using a tissue processor. The paraffin blocks were cut to 7 μm using a Microtome and
dried at 40 °C for 24 h. The paraffin blocks were subjected to xylene and four concentrations of ethanol (100%,
95%, 80%, and 70%) for dyeing preparation.
Hematoxylin eosin staining. Paraffin-embedded lung tissues were sectioned with a thickness of 7 μm
and used for histological analyses. To measure the pulmonary medial wall thickness, sections were stained with
Mayer’s Hematoxylin & Eosin. Stained sections were imaged using an Axio Imager Z1 upright microscopy sys-
tem (Carl Zeiss, Oberkochen, Germany). Of the pulmonary arteries (< 120 µm in diameter), 20 were randomly
selected in each animal (n = 3 per group), and the medial wall thickness was calculated as previously reported47:
(medial thickness × 2)/external diameter × 100.
Masson’s trichrome staining. For the assessment of perivascular fibrosis, sections were stained with Mas-
son’s Trichrome ((MT, cat. HT15; Sigma-Aldrich, St. USA)). Perivascular fibrosis was determined by the area of
the MT-stained fibrotic area divided by the short vessel diameter using ImageJ software (NIH, Bethesda, USA).
Scientific Reports | (2021) 11:2012 | https://doi.org/10.1038/s41598-021-81244-1 11
Vol.:(0123456789)www.nature.com/scientificreports/
3,3‑Diaminobenzidine (DAB) staining. Lung paraffin block tissues were sectioned at 7 μm, placed on
slides, and dried at 37 °C for 24 h. Slides were the paraffin embedded, incubated in 0.3% H2O2 (cat. H1009;
Sigma-Aldrich, St. USA) for 30 min, rinsed 3 times with PBS, incubated in animal serum to block antibody bind-
ing, incubated with primary antibodies (sTable 1), and then rinsed 3 times with PBS. They were then treated with
biotinylated secondary antibodies in the ABC kit (cat. PK-6100; Vector Laboratories, USA), incubated for 1 h
in blocking solution, and rinsed 3 times with PBS. Slides were developed with DAB (3,3-diaminobenzidinem,
cat. D8001; Sigma-aldrich, USA) substrate for 12 min, mounted with cover slips and DPX mounting solution
(cat. 06522; Sigma-Aldrich, USA), and visualized by light microscopy (Olympus Optical Co., Japan). The aver-
age number of PCNA-positive cells was counted in 5 small arteries that were randomly chosen (< 120 µm in
diameter) using ImageJ software (NIH, Bethesda, USA). The percentage of PCNA-positive cells was calculated
by dividing the number of PCNA-positive cells by the total cells48.
RNA extraction and cDNA synthesis. The total RNA within cells and tissues was isolated using RNAiso
Plus (cat. 9108, TAKARA, Japan) according to the manufacturer’s instructions. 0.5 ml of RNAiso Plus was mixed
with 0.1 ml of chloroform and incubated at room temperature for 7 min. Afterward, centrifugation is performed
for 15 min at 4 °C at 12,000 × g. The supernatant is collected in a new tube, mixed with 0.25 ml of 100% isopro-
panol, gently shaken and then centrifuged again to precipitate the RNA. The supernatant was discarded and the
submerged RNA pellet was washed with 70% ethanol and centrifuged at 7500×g for 5 min at 4 °C. The dried
pellet was dissolved in 30 μl of diethyl pyrocarbonate (DEPC, cat. W2004; Biosesang, Korea) water and RNA was
quantified using Nanodrop 2000 (Thermo Fisher Scientific). RNA was synthesized into cDNA using the cDNA
synthesis kit (cat. 6210A; Takara, Japan)48.
Quantitative real‑time PCR. Total RNA and cDNA were prepared from rat lungs as described above.
cDNA was used for quantitative real-time PCR (qRT-PCR) using SYBR green (cat. RR820A; Takara, Japan). All
primers were purchased from Cosmogentech (Seoul, Korea). Relative mRNA levels of the genes were normal-
ized to β-actin (Atcb), and the relative expression differences were obtained using the 2-ddCt method49.
Microarray experiments. Gene expression profiles were generated for lung tissues obtained from CON
and MCT + Saline rats, as well as MCT + Saline rats injected with AD-, BM-, and UCB-MSCs using an Agi-
lent-028279 Rat 8 × 60 k chip, which includes 62,976 probes corresponding to 18,584 annotated genes (Agilent,
Santa Clara, CA, USA), according to the manufacturer’s instructions50. In each condition, we performed gene
expression profiling of two biological replicates obtained from independent rats. Total RNA was extracted from
rat lung using Trizol reagent (Invitrogen Life Technologies, Grand Island, NY). The integrity of the total RNA
was analyzed using an Agilent 2100 Bioanalyzer. The RNA integrity values for all samples were larger than 8.8.
Reverse transcription was then performed to generate cRNA, which was amplified and hybridized onto each
array according to the manufacturer’s instructions. The array was scanned using a SureScan Microarray Scanner
(Agilent).
Analysis of gene expression profiles. Probe intensities from the arrays were converted to log2-intensities
and normalized using the quantile normalization method51,52. Differentially expressed genes (DEGs) were iden-
tified using an integrative statistical method as previously d escribed53,54. Briefly, for each gene, we calculated a
T-statistic value using a Student’s t-test and a log2-median-ratio test for each comparison. Empirical distribu-
tions of the T-statistic values and l og2-median-ratios for the null hypothesis that the genes were not differentially
expressed were estimated by performing random permutations of the samples and by then applying the Gauss-
ian kernel density estimation method to the T-statistic values and log2-median-ratios that resulted from the
random permutations. Using the empirical distributions, we computed the adjusted P values for the t-test and
log2-median-ratio test for each gene and then combined these P values with Stouffer’s method54. False discovery
rates (FDRs) of each gene for the combined P values were then computed with the Storey method53. Finally, the
DEGs were defined as the genes with an FDR ≤ 0.05 and an absolute log2-median-ratio ≥ 0.58 (1.5-fold change).
Heat map generation and GOBP enrichment analysis. The DEGs were categorized into 8 groups
(G1–8) based on their up- or down-regulation patterns in the four comparisons: (1) MCT + Saline/CON, (2)
MCT + AD/MCT + Saline, (3) MCT + BM/MCT + Saline, and (4) MCT + UCB/MCT + Saline. In each of the four
major groups (G1–4), the DEGs were then sorted according to their up-regulation, no change, and down-regu-
lation patterns in the order of the four comparisons. The heat map for the DEGs in G1–4 was finally generated
using their log2-fold-changes in the four comparisons with “imagesc.m” in MATLAB (R2019a; www.mathw
orks.com/). Additionally, enrichment analysis of the gene ontology biological processes (GOBPs) for a set of the
DEGs was performed using the DAVID software21. The GOBPs represented by the DEGs were defined as those
with an enrichment P value < 0.05 calculated by DAVID, where P is the significance of the GOBPs being repre-
sented by the DEGs in G1–4. The enrichment P values were converted into − log10(P), and the heat map for the
enrichment significance of GOBPs was generated using their − log10(P) values with “imagesc.m” in MATLAB
(R2019a; www.mathworks.com/).
Network analysis. To reconstruct a network model, we first selected a subset of the DEGs involved in
the traditional pathways related to PAH progression (the endothelin pathway, NO pathway, and prostacyclin
pathway). We then collected the protein–protein interactions (PPIs) among the selected DEGs from five pro-
tein–protein interactome databases: the biomolecular interaction network database22,55, human protein refer-
Scientific Reports | (2021) 11:2012 | https://doi.org/10.1038/s41598-021-81244-1 12
Vol:.(1234567890)www.nature.com/scientificreports/
ence database22, biological general repository for interaction datasets56, molecular INTeraction database57, and
search tool for recurring instances of neighboring genes58. To map human proteins onto the rat proteins, we
used human-rat orthology information in mouse genome informatics59. The PPIs for the selected DEGs in the
“sif ” format were imported into Cytoscape (v.3.3.0; www.cytoscape.org/)60. The node attributes, including the
log2-fold-changes in the four comparisons and gene symbols, in an attribute excel file were then imported into
Cytoscape. Finally, the node and boundary color gradients were set using the continuous mapping of the log2-
fold-changes. The nodes in the network model were arranged manually based on the localizations and relation-
ships of the corresponding proteins in the Kyoto Encyclopedia of Genes and Genomes pathway database61. The
network model was exported from Cytoscape in the PDF format. After opening the PDF file in Adobe Illustrator
CS6 (version 16.0.0; www.adobe.com), additional edges identified from the KEGG pathway database and the
previous literature were included to the network model.
Statistical analysis. Non-parametric analysis was used given the small samples available. Comparisons
were made using the Mann–Whitney U test. Significant differences are indicated as follows; by an asterisk (*)
versus control, $ versus MCT + saline, and # versus MCT + UCB. Results are presented as means ± SDs and
experiments were performed in triplicate. The analysis was conducted using SPSS version 22 (IBM Corporation,
Armonk, NY).
Received: 6 November 2019; Accepted: 30 December 2020
References
1. Jang, A. Y. & Chung, W. J. Current status of pulmonary arterial hypertension in Korea. Korean J. Int. Med. 34, 696–707, https://
doi.org/10.3904/kjim.2019.185 (2019).
2. Jang, A. Y., Kim S., Park, S. J., Choi, H., Oh, P. C., Oh, S., Kim, K. H., Kim, K. H., Byun, K., & Chung, W. J. A Nationwide multicenter
registry and biobank program for deep phenotyping of idiopathic and hereditary pulmonary arterial hypertension in Korea: the
PAH platform for deep phenotyping in Korean subjects (PHOENIKS) cohort. Clinical Hyperten. 25(1) (2019).
3. Aliotta, J. M. et al. Stem cells and pulmonary metamorphosis: New concepts in repair and regeneration. J. Cell. Physiol. 204,
725–741. https://doi.org/10.1002/jcp.20318 (2005).
4. Baber, S. R. et al. Intratracheal mesenchymal stem cell administration attenuates monocrotaline-induced pulmonary hypertension
and endothelial dysfunction. Am. J. Physiol. Heart Circ. Physiol. 292, H1120-1128. https://doi.org/10.1152/ajpheart.00173.2006
(2007).
5. Karoubi, G., Cortes-Dericks, L., Breyer, I., Schmid, R. A. & Dutly, A. E. Identification of mesenchymal stromal cells in human lung
parenchyma capable of differentiating into aquaporin 5-expressing cells. Lab. Invest. 89, 1100–1114. https://doi.org/10.1038/labin
vest.2009.73 (2009).
6. Krause, D. S. Engraftment of bone marrow-derived epithelial cells. Ann. N. Y. Acad. Sci. 1044, 117–124. https://doi.org/10.1196/
annals.1349.015 (2005).
7. Luan, Y. et al. Implantation of mesenchymal stem cells improves right ventricular impairments caused by experimental pulmonary
hypertension. Am. J. Med. Sci. 343, 402–406. https://doi.org/10.1097/MAJ.0b013e31822dc5d3 (2012).
8. Chen, J. Y. et al. Therapeutic effects of mesenchymal stem cell-derived microvesicles on pulmonary arterial hypertension in rats.
Acta Pharmacol. Sin. 35, 1121–1128. https://doi.org/10.1038/aps.2014.61 (2014).
9. Lee, J. C., Cha, C. I., Kim, D. S. & Choe, S. Y. Therapeutic effects of umbilical cord blood derived mesenchymal stem cell-conditioned
medium on pulmonary arterial hypertension in rats. J. Pathol. Transl. Med. 49, 472–480. https://doi.org/10.4132/jptm.2015.09.11
(2015).
10. Tarte, K. et al. Clinical-grade production of human mesenchymal stromal cells: Occurrence of aneuploidy without transformation.
Blood 115, 1549–1553. https://doi.org/10.1182/blood-2009-05-219907 (2010).
11. Li, J., Ezzelarab, M. B. & Cooper, D. K. Do mesenchymal stem cells function across species barriers? Relevance for xenotransplanta-
tion. Xenotransplantation 19, 273–285. https://doi.org/10.1111/xen.12000 (2012).
12. Castro-Manrreza, M. E. & Montesinos, J. J. Immunoregulation by mesenchymal stem cells: Biological aspects and clinical applica-
tions. J. Immunol. Res. 2015, 394917. https://doi.org/10.1155/2015/394917 (2015).
13. Pendleton, C. et al. Mesenchymal stem cells derived from adipose tissue vs bone marrow: In vitro comparison of their tropism
towards gliomas. PLoS ONE 8, e58198. https://doi.org/10.1371/journal.pone.0058198 (2013).
14. Kawamura, M. et al. Xenotransplantation of bone marrow-derived human mesenchymal stem cell sheets attenuates left ven-
tricular remodeling in a porcine ischemic cardiomyopathy model. Tissue Eng. Part A 21, 2272–2280. https://doi.org/10.1089/ten.
TEA.2014.0036 (2015).
15. Kern, S., Eichler, H., Stoeve, J., Kluter, H. & Bieback, K. Comparative analysis of mesenchymal stem cells from bone marrow,
umbilical cord blood, or adipose tissue. Stem Cells 24, 1294–1301. https://doi.org/10.1634/stemcells.2005-0342 (2006).
16. Eguchi, M. et al. Adipose-derived regenerative cell therapy inhibits the progression of monocrotaline-induced pulmonary hyper-
tension in rats. Life Sci. 118, 306–312. https://doi.org/10.1016/j.lfs.2014.05.008 (2014).
17. Zhang, X. et al. Role of bone marrow-derived mesenchymal stem cells in the prevention of hyperoxia-induced lung injury in
newborn mice. Cell Biol. Int. 36, 589–594. https://doi.org/10.1042/CBI20110447 (2012).
18. Zhang, Z. H., Lu, Y., Luan, Y. & Zhao, J. J. Effect of bone marrow mesenchymal stem cells on experimental pulmonary arterial
hypertension. Exp. Ther. Med. 4, 839–843. https://doi.org/10.3892/etm.2012.691 (2012).
19. Lee, H. et al. The effect of umbilical cord blood derived mesenchymal stem cells in monocrotaline-induced pulmonary artery
hypertension rats. J. Korean Med. Sci. 30, 576–585. https://doi.org/10.3346/jkms.2015.30.5.576 (2015).
20. Jin, H. J. et al. Comparative analysis of human mesenchymal stem cells from bone marrow, adipose tissue, and umbilical cord
blood as sources of cell therapy. Int. J. Mol. Sci. 14, 17986–18001. https://doi.org/10.3390/ijms140917986 (2013).
21. da Huang, W., Sherman, B. T. & Lempicki, R. A. Systematic and integrative analysis of large gene lists using DAVID bioinformatics
resources. Nat. Protoc. 4, 44–57. https://doi.org/10.1038/nprot.2008.211 (2009).
22. Peri, S. et al. Human protein reference database as a discovery resource for proteomics. Nucleic Acids Res. 32, D497-501. https://
doi.org/10.1093/nar/gkh070 (2004).
23. Ong, S. G. & Wu, J. C. Exosomes as potential alternatives to stem cell therapy in mediating cardiac regeneration. Circ. Res. 117,
7–9. https://doi.org/10.1161/CIRCRESAHA.115.306593 (2015).
Scientific Reports | (2021) 11:2012 | https://doi.org/10.1038/s41598-021-81244-1 13
Vol.:(0123456789)You can also read