Mismatch negativity indices and functional outcomes in unipolar and bipolar depression - Nature
←
→
Page content transcription
If your browser does not render page correctly, please read the page content below
www.nature.com/scientificreports
OPEN Mismatch negativity indices
and functional outcomes
in unipolar and bipolar depression
Sungkean Kim1, Ji Hyun Baek2, Se‑hoon Shim3, Young Joon Kwon3, Hwa Young Lee3,
Jae Hyun Yoo4 & Ji Sun Kim3*
The aim of the study was to explore the association between functional outcomes and mismatch
negativity (MMN) activity in participants with mood disorders. The study participants were 27
subjects with major depressive disorder (MDD), 29 subjects with bipolar disorder (BD), and 33 healthy
controls who performed a passive auditory oddball paradigm while electroencephalography (EEG)
was recorded. Peak amplitudes and source activity of the MMN were compared across groups. Mood
and anxiety symptoms were evaluated. The functional levels were the lowest in the BD group,
followed by the MDD and healthy control groups. The subjects with BD had significantly lower MMN
amplitudes at the frontal and frontocentral electrodes than the healthy controls. The source activity
of the MMN from the left anterior cingulate cortex, inferior frontal gyrus, and middle frontal gyrus
was significantly increased in the BD group compared to the MDD group. Significant correlations were
detected between the functional outcomes and MMN amplitudes at frontal and frontocentral sites.
The functional outcome was significantly correlated with left frontal regions. In conclusion, MMN
activity appears to be a promising candidate as an evaluation tool for functional outcomes in mood
disorders.
Bipolar disorder (BD) and major depressive disorder (MDD) are chronic, severe and recurrent mood disorders
with substantial disease burden1. As these two psychiatric conditions both involve severe depressive symp-
toms, misdiagnosis of BD as unipolar depression is a serious clinical p roblem2. Previous studies suggested that
3 4
C-reactive protein l evel and heart rate variability are candidate biomarkers for discriminating between bipolar
depression and unipolar depression. In addition, electroencephalography (EEG) cordance and coherence values
may potentially discriminate unipolar from bipolar depression5. Although it is important to find biomarkers to
enable the differential diagnosis between unipolar and bipolar depression, relatively few studies have addressed
this. As such, promising biomarkers to differentiate between the two conditions are needed.
Many patients with BD or MDD usually experience serious functional d ecline6. Depressive symptoms have
been shown to be associated with functional role impairments in multiple domains, such as duties at work or
school, responsibilities at home, and relationships with family and friends7. A previous study found that only
38% patients with major mood disorder achieved functional recovery within 2 years8. The psychosocial dis-
ability resulting from depression is extensive, and encompasses multiple domains, including work and social
interactions, independent living in the community, family adjustment, mortality, and quality of life6. However,
it remains unclear why functional decline is so pervasive in mood disorders. In addition, very few studies have
assessed the specific biomarkers related to functional decline.
Psychosocial functioning is defined as a person’s capability to conduct daily life tasks and to engage in rela-
tionships with other people in ways that meet the demands of the community and individual lives that give rise
to it9. Impairment in social cognition may affect patients’ everyday psychosocial functioning10. Social cognition
reflects the aspect of cognition dedicated to social information processing for adaptive functioning11. More
specifically, it represents a sophisticated set of higher-order neuropsychological domains that enable adaptive
behaviours in response to others12. A previous study revealed that social cognition might be impaired in patients
1
J. Crayton Pruitt Family Department of Biomedical Engineering, University of Florida, Gainesville, FL 32611,
USA. 2Department of Psychiatry, Samsung Medical Center, Seoul, Republic of Korea. 3Department of Psychiatry,
College of Medicine, Soonchunhyang University Cheonan Hospital, 31 Suncheonhyang 6‑gil, Dongnam‑gu,
Cheonan 31151, Republic of Korea. 4Department of Psychiatry, Seoul St. Mary’s Hospital, College of Medicine, The
Catholic University of Korea, Seoul, Republic of Korea. *email: ideal91@hanmail.net
Scientific Reports | (2020) 10:12831 | https://doi.org/10.1038/s41598-020-69776-4 1
Vol.:(0123456789)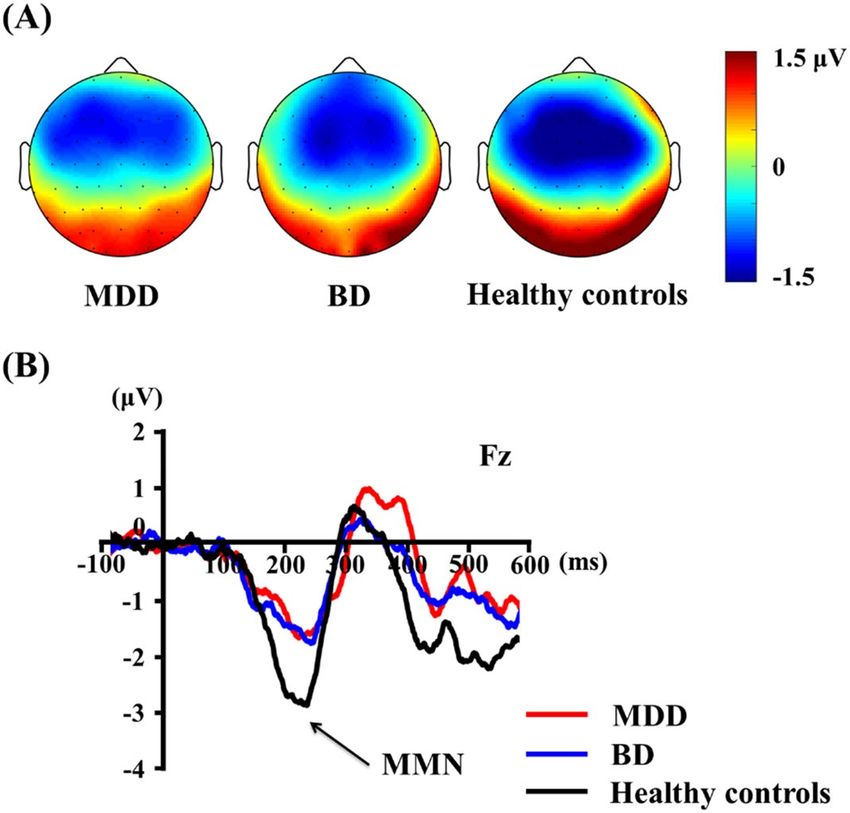
www.nature.com/scientificreports/
with depression13. Significant dysfunctions in theory of mind have been found in BD, in both remitted and
sub-syndromal patients, with a greater impairment during acute p hases12,14. Social cognitive deficits have been
identified in both acutely d epressed and remitted patients with MDD16.
15
Mismatch negativity (MMN) is an event-related potential component responding to a sequence of relatively
standard stimuli interrupted by the infrequent presentation of deviant s timuli17. MMN represents preattentive
auditory processing18. Näätänen et al. comprehensively reviewed studies which closely correlated MMN with
cognitive status19. MMN amplitude reduction is considered to be associated with cognitive function in the vari-
ous domains of cognition in patients with p sychosis7. In particular, MMN is known to be associated with social
20
cognition and functional o utcomes . Previous studies have reported that greater MMN activity correlates with
better productivity in the workplace and independent living, and with better social perception in patients with
schizophrenia20. In addition, functional outcomes were the most powerful predictors of MMN in patients with
schizophrenia21. In light of MMN reflecting glutamatergic function22, MMN reduction may reflect pathological
dysfunction in the N-methyl-D-aspartate (NMDA) receptor s ystem23.
In this regard, MMN may be a promising biomarker associated with functional decline in mood disorders.
MMN and functionality measures are correlated in healthy controls24, demonstrating that MMN is indepen-
dently related to social f unctioning24. This also suggests that an attenuated MMN amplitude to duration devi-
ants may therefore not be specific to schizophrenia, but rather to deficits in cognitive f unction25. However, the
association between MMN and functional levels in subjects with mood disorders has yet to be further examined.
Patients with BD and MDD experience decreased neurological and social cognitive functioning during illness
periods. Given the importance of functional outcomes in BD and MDD, studies to evaluate the relationship
between MMN and functional outcomes should be conducted. However, no studies have explored the correla-
tions between MMN and functionality in both psychiatric conditions.
In general, MMN is generated in the primary auditory cortex and in adjacent areas of the superior temporal
lobe26,27. The prefrontal areas, including the anterior cingulate cortex, inferior frontal gyrus, and middle fron-
tal gyrus, are also considered MMN g enerators7,27–30. The prefrontal generators have been associated with the
involuntary switching of attention towards changes in the auditory e nvironment31. In particular, the prefrontal
generators have been related to a cognitive role or comparator-based mechanism of M MN32–34. Additionally,
previous studies have demonstrated the roles of the prefrontal cortex in distinguishing between unipolar and
bipolar depression35. Moreover, the prefrontal cortex may also play a critical role in the functional outcomes of
psychiatric diseases36,37. Therefore, it is meaningful to investigate MMN activity in the prefrontal regions and
the correlation between MMN activity and functional outcomes in BD and MDD patients.
The aim of the study was to assess the association between MMN and functional outcomes in mood disor-
dered and healthy populations. We hypothesized that the amplitude of MMN, reflecting neuro-social cognition,
would differ in patients with BD and MDD and healthy populations. Additionally, the functionality measures
would be correlate with the amplitude of MMN in both mood disordered and healthy populations. Consider-
ing that functional decline is more severe in patients with BD than in those with MDD38, we also hypothesized
that abnormalities in MMN would be more prominent in patients with BD than in those with MDD. Moreo-
ver, previous studies have suggested that age of onset and illness duration may affect functional outcomes in
mood disorders39,40. Considering previous studies that showed no MMN change in the first episode of affective
disorders41,42, we also hypothesized that the age of onset and illness duration might correlate the MMN activity
as well as functional outcome measures. Finally, we explored the regional activity of the brain through a source
activity analysis of the MMN. To support our hypothesis, we verified that brain regions known to be related to
functional outcomes were activated in conjunction with changes in MMN.
Results
Participants. Table 1 represents the baseline demographic and clinical characteristics in patients with MDD
and BD and healthy controls. There were no significant differences in the groups according to age or sex. The
healthy control group had significantly more education years than the patient groups (p < 0.001). The MDD and
BD groups showed no significant differences in terms of years of education. Patients with BD were significantly
younger at disease onset (p = 0.016) and had longer durations of illness (p < 0.001) than the patients with MDD.
Clinical characteristics. Results revealed no significant differences in the State-Trait Anxiety Inventory
(STAI) state, STAI trait, or Beck Depression Inventory (BDI) between patients with MDD and patients with BD.
Patients with BD showed significantly higher Mood Disorder Questionnaire (MDQ) scores than patients with
MDD (p < 0.001). In addition, patients with BD showed significantly lower Global Assessment of Functioning
(GAF) scores than patients with MDD (p = 0.009). Patients with BD showed significantly higher scores on the
Korean version of the Social Adjustment Scale (K-SAS) (p = 0.002) and Social Functioning Questionnaire (SFQ)
(p < 0.001) than did patients with MDD. These results indicate that patients with MDD had better functional
outcomes than patients with BD.
Mismatch negativity. The grand-averaged MMN waveforms and topographical maps for each group are
shown in Fig. 1. A repeated-measures ANOVA assessed MMN amplitudes revealed no significant electrode
main effect or group-by-electrode interaction. However, there was a significant main effect of group with mid-
dle electrodes (F = 4.367 df = 2, p = 0.016). Post-hoc tests revealed that the patients with BD showed significantly
lower MMN amplitudes than the healthy controls at the middle electrodes (Fz and FCz). A comparison of the
peak amplitude of the MMN among the study participants is shown in Table 2.
Scientific Reports | (2020) 10:12831 | https://doi.org/10.1038/s41598-020-69776-4 2
Vol:.(1234567890)www.nature.com/scientificreports/
MDDa (N = 27) BDb (N = 29) Healthy controlsc (N = 33) P Post-hoc (Bonferroni)
Age (years) 34.67 ± 17.44 33.86 ± 14.71 29.85 ± 5.80 0.313
Sex 0.849
Male 11 (40.7) 14 (48.3) 15 (45.5)
Female 16 (59.3) 15 (51.7) 18 (54.5)
Education (years) 10.48 ± 3.17 11.45 ± 2.60 15.82 ± 1.90 < 0.001 a < c, b < c
Onset age (years) 32.67 ± 16.26 23.66 ± 10.29 0.016
Duration of illness (months) 26.63 ± 38.70 118.72 ± 123.25 < 0.001
STAI state 65.33 ± 9.03 59.34 ± 10.69 30.91 ± 8.79 < 0.001 a > c, b > c
STAI trait 64.96 ± 6.33 59.38 ± 11.52 33.85 ± 8.35 < 0.001 a > c, b > c
BDI 55.93 ± 7.05 53.48 ± 11.98 21.33 ± 0.60 < 0.001 a > c, b > c
MDQ 0.41 ± 0.75 8.72 ± 1.73 0.06 ± 0.24 < 0.001 a < b, c < b
GAF 88.89 ± 7.76 83.28 ± 8.27 96.21 ± 4.34 < 0.001 a > b, a < c, b < c
SAS 35.63 ± 8.19 43.14 ± 9.99 25.73 ± 4.79 < 0.001 a < b, a > c, b > c
SFQ 14.11 ± 3.93 23.03 ± 4.14 8.45 ± 0.62 < 0.001 a < b, a > c, b > c
Table 1. Demographic and clinical characteristics of all study participants. MDD major depressive disorder,
BD bipolar disorder, STAI State-Trait Anxiety Inventory, BDI Beck Depression Inventory, MDQ Mood
Disorder Questionnaire, GAF Global Assessment of Functioning, SAS: Social Adjustment Scale, SFQ: Social
Functioning Questionnaire.
Figure 1. (A) Topographic maps of mismatch negativity (MMN), and (B) MMN waveforms at the Fz electrode
site in patients with major depressive disorder (MDD) and bipolar disorder (BD) and healthy controls.
Source analysis. A repeated-measures ANOVA on MMN source activities revealed no significant region
main effect or group-by-region interaction. However, there was a significant main effect of group with left regions
(F = 3.925, df = 2, p = 0.023). Post-hoc tests revealed that the patients with BD showed significantly stronger acti-
vation compared to the MDD patients in the left regions (ACC, IFG, and MFG). Detailed information on the
source activities of the MMN among the three groups is provided in Table 3.
Correlation analysis of MMN activity with clinical symptoms and functions. In the correlation
analyses, functional outcome measures such as the SAS scores were found to be significantly correlated with age
of onset (r = 0.270, p = 0.044) and illness duration (r = 0.476, p < 0.001). The SFQ scores were also significantly
correlated with illness duration (r = 0.476, p < 0.001). However, there was no significant correlation between age
of onset, illness duration and MMN amplitudes in the patient group. Significant correlations were detected
between the psychological measures, including functional outcome measures, and MMN amplitudes at the fron-
Scientific Reports | (2020) 10:12831 | https://doi.org/10.1038/s41598-020-69776-4 3
Vol.:(0123456789)www.nature.com/scientificreports/
Site MDDa (N = 27) BDb (N = 29) Healthy controlsc (N = 33) F P Post-hoc (Bonferroni)
Left 2.762 0.069
F3 − 3.21 ± 1.51 − 2.83 ± 1.27 − 3.63 ± 1.15
F4 − 3.29 ± 1.61 − 3.23 ± 1.77 − 3.41 ± 2.21
Middle 4.367 0.016 b>c
Fz − 3.25 ± 1.66 − 2.72 ± 0.97 − 3.81 ± 1.57
FCz − 3.25 ± 1.76 − 2.73 ± 1.31 − 3.76 ± 1.58
Right 0.321 0.726
F4 − 3.29 ± 1.61 − 3.23 ± 1.77 − 3.41 ± 2.21
FC4 − 3.04 ± 1.69 − 2.87 ± 1.54 − 3.41 ± 1.57
Table 2. Comparison of the mismatch negativity peak amplitudes (µV) among participants. Significant value
is indicated in bold (p < 0.05) MDD major depressive disorder, BD bipolar disorder.
Region of interest MDDa (N = 27) BDb (N = 29) Healthy controlsc (N = 33) F P Post-hoc (Bonferroni)
Left 3.925 0.023 awww.nature.com/scientificreports/
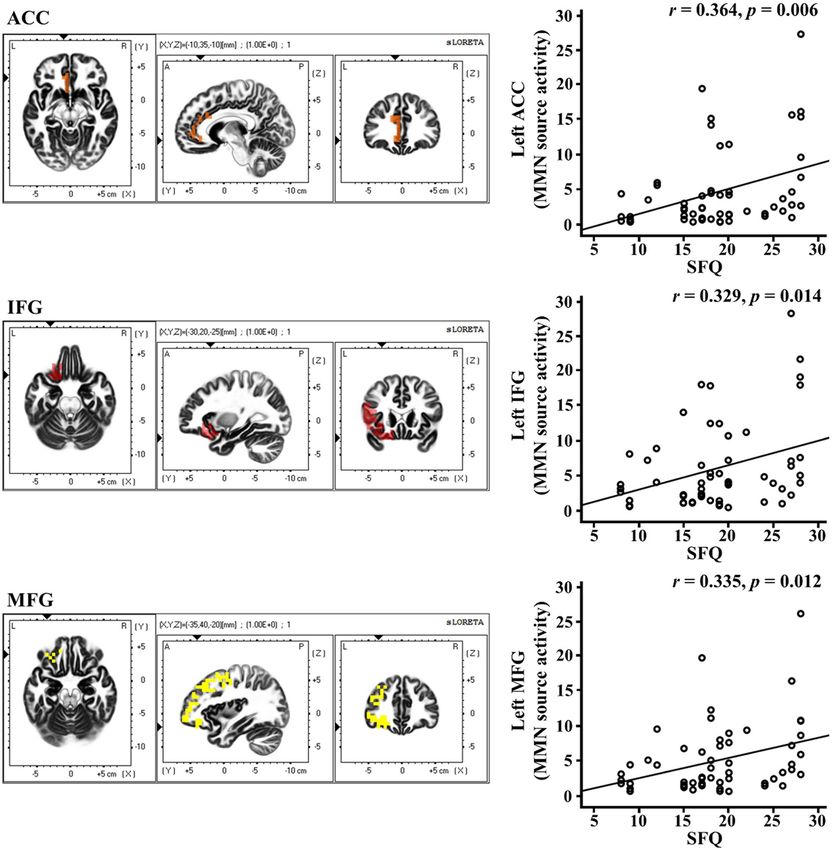
Figure 3. Correlations between MMN source activities and psychological measure in patient groups. MMN
mismatch negativity, SFQ social functioning questionnaire, ACCanterior cingulate cortex, IFG inferior frontal
gyrus, MFG middle frontal gyrus.
correlated with the SFQ scores (left ACC: r = 0.364, p = 0.006; left inferior frontal gyrus: r = 0.329, p = 0.014; left
middle frontal gyrus: r = 0.335, p = 0.012) (Fig. 3). There were no significant correlations between age of onset
and activity in the left ACC and middle frontal gyrus (left ACC: r = − 0.262, p = 0.054; left middle frontal gyrus:
r = − 0.244, p = 0.073). In addition, there was no significant correlation between duration of illness and activity
in the left ACC (r = 0.323, p = 0.016). Furthermore, there were no significant correlations between GAF scores
and activity in the left ACC, inferior frontal gyrus, and middle frontal gyrus (left ACC: r = − 0.146, p = 0.287; left
inferior frontal gyrus: r = − 0.165, p = 0.228; left middle frontal gyrus: r = − 0.184, p = 0.179). Finally, there were
no significant correlations between SAS scores and activity in the left ACC, inferior frontal gyrus, and middle
frontal gyrus (left ACC: r = 0.192, p = 0.160; left inferior frontal gyrus: r = 0.195, p = 0.154; left middle frontal
gyrus: r = 0.229, p = 0.093).
Scientific Reports | (2020) 10:12831 | https://doi.org/10.1038/s41598-020-69776-4 5
Vol.:(0123456789)www.nature.com/scientificreports/
Discussion
This study sought to determine the relationship between MMN activity and functional decline in patients with
MDD and BD and healthy populations. To this end, we evaluated the association of MMN amplitude and source
activity with functional outcomes in the study participants. As hypothesized, the MMN amplitudes differed
between patients and healthy populations. Compared to the previous studies which included patients with
psychotic symptoms and various mixed mood states, the present study focused on depressed patients without
psychotic symptoms.
As expected, patients with mood disorders showed worse functional outcomes than healthy controls. Those
with BD had particularly worse functional outcomes than those with MDD. The duration of illness may affect
functional outcomes as well, however, consistently with previous study findings39. These results were compara-
ble to those of previous studies whereby impaired MMNs have been shown to be significantly associated with
functional impairments, even in healthy populations as well as a range of psychiatric samples24,43. Impairments
in deviance detection phenomena, even at early stages of processing, may induce significant disturbances in
higher-order cognitive functioning and could affect functional outcomes44. Moreover, our results also confirmed
the previous reports that MMN is independently associated with social functioning, regardless of population
characteristics.
This association between MMN peak amplitude and functional outcome was significant in patients with
MDD and BD. In particular, the association was mainly detected at frontal and frontocentral electrodes. Simi-
larly, previous neurophysiological studies utilizing MMN as an index of NMDA receptor function displayed
impairments in MDD and BD22,45,46. Recently, changes in the glutamate system were shown to play a significant
role in the evolution of mood disorders47. Specifically, abnormal levels of glutamate have been shown in the
cerebrospinal fluid, serum, and plasma of patients with MDD and B D48,49. Post-mortem studies have reported
elevated brain glutamate levels and decreased levels of the glutamatergic NMDA receptor subunits in the frontal
cortex of patients with d epression22,50. Previous meta-analyses revealed that BD was associated with increased
glutamine concentrations and decreased MMN, particularly in frontal regions22. This finding suggests that the
MMN amplitudes in frontal electrodes could serve as a potential marker of the functional decline observed in
mood disorders.
Meanwhile, patients with BD showed lower MMN amplitudes at the frontal and frontocentral electrodes com-
pared to healthy controls. There was no difference in MMN amplitude between patients with MDD and healthy
controls in the present study. Previous neurophysiological studies utilizing MMN as an index of NMDA receptor
function displayed impairments in BD p atients22,45,46. Our results may reflect impaired pre-attentive informa-
tion processing in patients with BD, but not in patients with MDD, compared to healthy controls. However, in
light of our correlations between MMN and functional outcomes, this may be due to the relatively preserved
functional levels of subjects with MDD and healthy population in our study. MMN deficits appear robust in
patients with schizophrenia51. However, MMN deficits were also discovered in many other severe and persistent
mental illnesses such as bipolar, major depressive51,52, and obsessive–compulsive disorders53. Remarkably, MMN
deficits in schizophrenic patients are highly associated with patients’ impairments in daily functioning, level of
independence in their community living situation, and functional outcomes54–56. Across studies, schizophrenic
patients with more severe functional impairments had relatively smaller MMNs than did higher functioning
patients24. Although patients undergoing first episode psychosis also showed significantly reduced MMN ampli-
tudes compared with controls57, the first episode psychosis group also showed significant deficits in attention
and verbal learning/memory and strong associations between frontocentral MMN amplitudes and cognitive/
psychosocial functioning57. Therefore, the results of the present study demonstrate that MMN amplitudes may
not be disease-specific marker, but rather markers for functional outcomes related to higher order cognitive
and psychosocial functioning. However, previous studies revealed frontal lobe dysfunction in patients with
MDD58,59 and previous studies showed mixed results with regard to MMN activity in M DD51,60. Differences in
task designs and in participant characteristics may partly explain these different results. Therefore, changes in
MMN amplitudes in MDD patients need to be re-assessed in a future study.
In addition, the age of onset and illness duration were significantly associated with functional outcome
measures in the present study. However, the age of onset and illness duration were not related to MMN activity
in this study. This may be due to differences within the population of individuals with no psychotic symptoms
in this study. In addition, due to the relatively small sample size, there may be no correlation between the above
clinical characteristics and MMN amplitudes.
In the source activity of MMN, the left ACC, left IFG, and left MFG showed a stronger activation in BD
patients than in MDD patients. The ACC is known to be important in fundamental cognitive processes, includ-
ing decision-making processes, motivation and problem-solving capacity61,62. It contributes, along with other
cortical and subcortical neural structures, to the processing of complex emotional behaviours and responses, as
well as mood regulation63. In addition, disorders of social cognition have long been linked to the structure and
function of the ACC64. The IFG is involved in the modulation or inhibition of a range of impulsive behaviours65.
The IFG has also been reported in previous studies on socioeconomic decision making and reappraising social
emotions66,67. Our results showed that the ACC and IFG activity in BD patients were greater than in MDD
patients. Although direct comparisons remain difficult since no previous study has yet evaluated MMN source
activity in BD patients, a considerable number of previous studies have been conducted. In the neural model of
emotional circuitry in a study by Phillips et al.68, patients with BD showed increased activity in the ventral system,
including the amygdala, insula, ventral striatum, and ventral ACC68, and prefrontal cortex, used to identify the
emotional significance of a stimulus, produce affective states, and automatically regulate emotional responses.
Phillips et al. explained that over-activation in the ventral system, including the ACC and ventrolateral prefrontal
cortex, which is located on the IFG, may underlie the neurobiology of B D68. These results were comparable to
Scientific Reports | (2020) 10:12831 | https://doi.org/10.1038/s41598-020-69776-4 6
Vol:.(1234567890)www.nature.com/scientificreports/
the results of our source activity analyses. Furthermore, left MFG response to inhibitory errors could predict
impulsive behaviours related to substance abuse69, and the left MFC is involved in a task that requires executive
attention70. Since MMN can reflect difficulties in pre-attentive emotional processing in the case of d epression71,
decreased MMN amplitudes and increased activation of the ACC and IFG in patients with BD could be inter-
preted as reflective of the decreased efficiency of automatically regulated emotional processes and increased
demand for more emotionally regulatory efforts and resources. This suggests that patients with BD require more
effortful emotional control than patients with MDD, which may result in poorer functional outcomes in BD. In
other words, unnecessary excessive activation of the ACC or IFG in pre-attentive processing may prevent proper
cognitive responses or problem-solving behaviours in social scenes. Moreover, patients with BD were younger at
disease onset than the MDD patients in this study. At the time of the research, BD patients had a longer illness
duration than MDD patients did. Interestingly, the left IFG was also inversely correlated with age of onset in the
patients in the study. BD symptoms, namely those linked to affective instability, typically emerge in late adoles-
cence and early adulthood72. It may be that attempts to regulate emotions resulted in smaller left IFG activation
early on in the course of the illness. If this process is repeated, patients with BD will experience greater left IFG
activation later in the course of the illness to compensate for this lack of resources. However, the lack of any source
activity information in the early phases of BD in the present study limits any further speculation in this regard.
Functional outcomes are closely associated with cognitive function and cognitive impairments, especially
poorer executive function, which is, therefore, an important feature of the illness affecting patients’ occupational
and academic o utcomes7,38. More interestingly, the higher the SFQ scores (poorer function), the higher the activ-
ity of the prefrontal cortex (left ACC, left IFG, and left MFG) in our results. Increased activity in the prefrontal
region of interest reflected the decreased efficiency of the automatically regulated emotional processes. Thus,
poor emotional regulation in BD patients could result in poor functional outcomes. Although direct comparisons
between both patient groups within a single study are l acking38, people with BD generally appear to have a greater
degree of cognitive impairment, especially in the frontal lobe, as related to executive function, than those with
MDD38,73. As such, it is quite plausible that BD patients are more likely to experience poorer functional outcomes.
Although there remains little research on the changes in MMN in affective disorders, whether MMN is con-
ceptualized as a trait marker or a state marker is a critical question to understand its clinical u tility74. A previous
study found that MMN could be a potential trait marker reflecting the global severity of mood d isorders75.
Additionally, remitted patients with depression demonstrated reduced MMN amplitudes which were not related
to depressive symptom severity. However, a reduced MMN amplitude was associated with reduced cognitive
function and functional outcomes76. Therefore, previous studies suggested that MMN may provide a more
isorders76. However, other studies
robust trait-marker that has predictive utility for cognitive decline in affective d
revealed no statistically significant MMN changes in patients with affective disorder41,77 and the contribution of
depressive symptom state on MMN cannot be concluded yet. Further studies to conclude the role of MMN as a
biomarker of affective disorder will be needed.
There were a few limitations to this study. First, the relatively small sample size of this study should be con-
sidered when interpreting the results. Further studies will be needed to confirm the results with larger samples.
Second, the patients with MDD and BD were taking medications at the time of testing. Although neither typical
nor atypical antipsychotics appear to affect MMN amplitudes in patients with schizophrenia 52,78, the benzodiaz-
epine and antidepressants which are frequently used in patients with mood disorders have been known to affect
MMN amplitudes in previous studies79–81. Therefore, a further study controlling for these medication effects
will be needed. Next, the present study was based on a single cross-sectional test to assess functional outcomes
and was thus unable to assess changes in functional status. Lastly, this study enrolled depressed patients without
psychotic symptoms, meaning that ours results cannot be generalized to entire populations of individuals with
MDD and BD.
Despite these limitations, to the best of our knowledge, this study was the first to explore the association
between the MMN amplitude and functional outcomes in patients with MDD and BD without psychotic symp-
toms, as well as the correlates between MMN and functional outcomes in these two psychiatric conditions. These
results point to the possibility of MMN as an independent marker of social functioning. Detecting an electro-
physiological marker of functional outcomes may support the efforts of clinicians to provide proper treatment
for patients who are experiencing depressive symptoms for the first time.
Methods
Participants. Participants were recruited from the Psychiatry Department of Soonchunhyang University
Cheonan Hospital in Korea. The patients with MDD and BD were diagnosed according to the Structured Clini-
cal Interview for Diagnostic and Statistical Manual of Mental Disorders, 4th edition (DSM-IV) Axis I Psychiat-
ric Disorders82. The study was performed on 27 patients with MDD (11 men and 16 women) of a mean age of
34.67 ± 17.44-years-old, and 29 patients with BD (14 men and 15 women) of a mean age of 33.86 ± 14.71-years-
old. Among the 29 patients with BD, 11 patients were diagnosed with BD type I and 18 patients with BD type
II. Participants with any history of neurological or other severe medical disease were excluded from the study
in the initial screening interviews. None of the patients had mental retardation or suffered from alcohol abuse,
were undergoing electroconvulsive therapy, or had any head injuries. Thirty-three healthy controls (15 men and
18 women) of a mean age of 29.85 ± 5.80-years-old were recruited through posters displayed in the hospital and
advertisements in local newspapers. An initial screening interview was conducted by a board-certified psychia-
trist to exclude any subjects with identifiable psychiatric disorders or histories of head injuries or neurological
disorders. Each participant had a normal hearing ability, confirmed by the 512-Hz tuning fork test83 and all were
identified as being right-handed. Nineteen of the patients with MDD were taking medications, such as selec-
tive serotonin reuptake inhibitors (fluoxetine, escitalopram, and sertraline) or a serotonin and norepinephrine
Scientific Reports | (2020) 10:12831 | https://doi.org/10.1038/s41598-020-69776-4 7
Vol.:(0123456789)www.nature.com/scientificreports/
reuptake inhibitor (duloxetine), or others (mirtazapine). Seventeen of the patients with bipolar disorder were
taking mood-stabilizing agents (lithium, valproate, and lamotrigine) with or without atypical antipsychotics
(risperidone, quetiapine, aripiprazole, and olanzapine). This study was approved by the Institutional Review
Board and Ethics Committee of Soonchunhyang University Cheonan Hospital and all experimental protocols
were approved by the committee (2018-10-032). The study was performed in accordance with the approved
guidelines. Informed consent was obtained from all study participants.
Assessment. Depressive and anxiety symptoms were evaluated using the Beck Depression Inventory
(BDI)84 and the State-Trait Anxiety Inventory (STAI)85. The STAI is a commonly used measure of trait and state
anxiety and consists of a state anxiety inventory (SAI) and trait anxiety inventory (TAI), comprised of 20 items
each85. The Korean version of the Mood Disorder Questionnaire (K-MDQ) was used to assess bipolarity. The
validity of the K-MDQ, a screening instrument for bipolar disorder, has been tested by Korean researchers, who
revealed its high Cronbach’s alpha (0.88)86. A total K-MDQ score of at least 7 (excluding further two questions)
was chosen as the optimal cutoff because it showed good sensitivity (0.75) and specificity (0.69)86.
Functional outcomes were measured using the Global Assessment of Functioning (GAF) scale, the Korean
version of the Social Adjustment Scale (K-SAS) and the Social Functioning Questionnaire (SFQ). The GAF scale
evaluates a subject’s functioning in everyday l ife87. Scores on this scale range from 0 to 100. It subjectively meas-
ures social, occupational, and psychological functioning in adults. The Social Adjustment Scale was originally
developed by Weissman et al.88. The validity and reliability of the Korean version of SAS were confirmed by Kim
et al.89. It contains 70 questions in total, distributed across nine subtypes (instrumental role, chores, finances,
family relationships, social leisure, friend relationships, romantic involvement, sexual adjustment, and personal
well-being), and provides a global judgment of the patient’s social adjustment over the past two months. A higher
score indicates worse performance. SFQ is an eight-item self-reported scale developed for the quick assessment of
perceived social f unctioning90. Scores range from 0 to 24 points, with higher scores indicating worse performance.
Data acquisition and analysis. EEG data were collected in a sound-attenuated EEG room while each
participant performed a passive auditory oddball paradigm. EEG signals were recorded using a NeuroScan Syn-
Amps2 amplifier (Compumedics USA, Charlotte, NC, USA) with 64 Ag–AgCl electrodes mounted on a Quik
Cap, using an extended 10–20 placement scheme. The ground electrode was placed on the forehead and the
physically linked reference electrode was attached to both mastoids. Vertical electrooculogram (EOG) channels
were recorded above and below the left eye. Horizontal EOG channels were acquired at the outer canthus of
each eye. The impedance was maintained below 5 kΩ. EEG data were acquired with a band pass filter with cutoff
frequencies of 0.1 and 100 Hz at a sampling rate of 1,000 Hz. The procedure for the EEG acquisition followed
that of our previous study91.
Recorded EEG data were preprocessed using CURRY 8 (Compumedics USA, Charlotte, NC, USA). EEG
data were re-referenced to an average reference. Gross artifacts were rejected through visual inspection of an
experienced person without any prior information regarding the origin of the data. Artifacts regarding eye blinks
or eye movements were removed by a mathematical procedure implemented in the preprocessing s oftware92.
The data were filtered using a 0.1–30 Hz band-pass filter and epoched from 100 ms pre-stimulus to 600 ms post-
stimulus. The epochs were subtracted from the average value of the pre-stimulus interval for baseline correction.
If any remaining epochs contained significant physiological artifacts (amplitude exceeding ± 75 μV) in any of
the 62 electrode sites, they were excluded from further analysis. Only artifact-free epochs were averaged across
the trials and participants for the ERP analysis. The procedure for the preprocessing of EEG followed that of
our previous study91.
Stimulus presentation onset and EEG recordings were synchronized by E-prime (Psychology Software Tools,
Pittsburgh, PA, USA). The auditory stimuli consisted of sounds at 85 dB SPL and 1,000 Hz. Subjects were asked
to concentrate on a “Where’s Wally?” picture book without paying attention to the sounds. The MMN wave was
extracted by subtracting the ERP wave elicited by standard stimuli from that elicited by deviant stimuli for each
subject. Deviant tones lasting 100 ms were presented randomly, interspersed with standard tones lasting 50 ms
(10% and 90% probabilities, respectively). Auditory stimulation included 750 stimuli with an inter-stimulus
interval of 500 ms. These stimuli were delivered through MDR-D777 headphones (Sony, Tokyo, Japan). The
MMN peak amplitude was determined as the most negative peak between 130 and 280 ms at six electrode sites
(Fz, F3, F4, FCz, FC3, and FC4)91.
Source imaging. Standardized low-resolution brain electromagnetic tomography (sLORETA) was used to
compute the cortical distribution of the standardized source current density of MMN activity. sLORETA is a
representative source-imaging method for solving the EEG inverse problem93, which assumes that the source
activation of a voxel is similar to that of the surrounding voxels when calculating a particular solution, and
applies an appropriate standardization of current density. The lead field matrix was computed using a realistic
head model segmented based on the Montreal Neurological Institute (MNI) 152 standard template, wherein
the three-dimensional solution space was restricted only to the cortical grey matter and h ippocampus94. The
solution space was composed of 6,239 voxels with a 5-mm resolution. Anatomical labels, such as the Brodmann
areas, were provided using an appropriate transformation from the MNI to Talairach s pace95.
The MMN source image was analysed between 130 and 280 ms after stimulus onset. We focused on the pre-
frontal regions as ROIs. The regions of interest (ROIs) related to MMN generators were selected based on the
previous neuroimaging and ERP source-localization studies and included the prefrontal areas (ACC, IFG, and
MFG)7,27–30. The MNI coordinates of the voxels, including the ACC, IFG, and MFG, were provided by sLORETA.
The MNI coordinates averaged across voxels belonging to each region were as follows: left ACC: − 7.41, 34.22,
Scientific Reports | (2020) 10:12831 | https://doi.org/10.1038/s41598-020-69776-4 8
Vol:.(1234567890)www.nature.com/scientificreports/
8.79; right ACC: 7.65, 34.02, 7.65; left IFG: − 39.89, 22.14, − 0.28; right IFG: 41.36, 22.04, 0.41; left MFG: − 34.01,
25.19, 29.41; right MFG: 35.98, 24.92, 29.37.
Statistical analysis. A chi-squared test and one-way analysis of variance (ANOVA) were used to examine
differences in the demographic variables and psychological scores between the three groups. A repeated-meas-
ures ANOVA was performed to assess MMN amplitudes and source activities. At the sensor level, two electrodes
at frontal and frontocentral regions as the within-subject variables with three measures (left, middle, and right)
were used. The between-subject variable was the group (MDD, BD, and healthy controls). At the source level,
three regions (ACC, IFG, and MFG) as the within-subject variables with two measures (left and right) were
used. In addition, the three groups were the between-subjects variable. If any significant main effects were found,
post-hoc pairwise comparisons using Bonferroni corrections were conducted between the groups to assess the
patterns of MMN activity. Since years of education were significantly different in three groups, these were con-
sidered as a covariate in the repeated-measures ANOVA.
A partial Pearson’s correlation was conducted between MMN sensors and source activities and psychological
measures, including symptom severity and functionality measures, with a 5,000-bootstrap resampling technique
to correct for multiple correlations. The bootstrap test is a weaker method than the Bonferroni test for solving
the problem of multiple comparisons. However, the robustness and stability of the bootstrap test have been
recognized by previous studies96–98. Furthermore, the bootstrap test has been widely used in EEG analyses99,100.
A partial Pearson’s correlation was performed to control for education as a covariate. The significance level was
set to P < 0.05 (2-tailed). Statistical analyses were performed using SPSS 21 (SPSS, Inc.).
Received: 20 December 2019; Accepted: 17 July 2020
References
1. Demyttenaere, K. et al. Prevalence, severity, and unmet need for treatment of mental disorders in the World Health Organization
World Mental Health Surveys. JAMA 291, 2581–2590. https://doi.org/10.1001/jama.291.21.2581 (2004).
2. Patella, A. M. et al. Clinical features of differential diagnosis between unipolar and bipolar depression in a drug-free sample of
young adults. J. Affect. Disord. 243, 103–107. https://doi.org/10.1016/j.jad.2018.09.007 (2019).
3. Chang, H. H. & Chen, P. S. C-reactive protein as a differential biomarker of bipolar versus unipolar depression: response. World
J. Biol. Psychiatry 18, 73–74. https://doi.org/10.1080/15622975.2016.1208845 (2017).
4. Chang, H. A., Chang, C. C., Kuo, T. B. & Huang, S. Y. Distinguishing bipolar II depression from unipolar major depressive
disorder: differences in heart rate variability. World J. Biol. Psychiatry 16, 351–360. https: //doi.org/10.3109/156229 75.2015.10176
06 (2015).
5. Tas, C. et al. EEG power, cordance and coherence differences between unipolar and bipolar depression. J. Affect. Disord. 172,
184–190. https://doi.org/10.1016/j.jad.2014.10.001 (2015).
6. Sanchez-Moreno, J. et al. Functioning and disability in bipolar disorder: an extensive review. Psychother. Psychosom. 78, 285–297.
https://doi.org/10.1159/000228249 (2009).
7. Alho, K., Woods, D. L., Algazi, A., Knight, R. T. & Naatanen, R. Lesions of frontal cortex diminish the auditory mismatch
negativity. Electroencephalogr. Clin. Neurophysiol. 91, 353–362. https://doi.org/10.1016/0013-4694(94)00173-1 (1994).
8. Tohen, M. et al. Two-year syndromal and functional recovery in 219 cases of first-episode major affective disorder with psychotic
features. Am. J. Psychiatry 157, 220–228. https://doi.org/10.1176/appi.ajp.157.2.220 (2000).
9. Rosa, A. R. et al. Functional impairment and disability across mood states in bipolar disorder. Value Health 13, 984–988. https
://doi.org/10.1111/j.1524-4733.2010.00768.x (2010).
10. Knight, M. J. & Baune, B. T. Social cognitive abilities predict psychosocial dysfunction in major depressive disorder. Depress.
Anxiety 36, 54–62. https://doi.org/10.1002/da.22844 (2019).
11. Ochsner, K. N. & Lieberman, M. D. The emergence of social cognitive neuroscience. Am. Psychol. 56, 717–734 (2001).
12. Vlad, M., Raucher-Chene, D., Henry, A. & Kaladjian, A. Functional outcome and social cognition in bipolar disorder: is there
a connection?. Eur. Psychiatry 52, 116–125. https://doi.org/10.1016/j.eurpsy.2018.05.002 (2018).
13. Knight, M. J. & Baune, B. T. Psychosocial dysfunction in major depressive disorder-rationale, design, and characteristics of the
cognitive and emotional recovery training program for depression (CERT-D). Front. Psychiatry 8, 280. https://doi.org/10.3389/
fpsyt.2017.00280 (2017).
14. Bora, E., Bartholomeusz, C. & Pantelis, C. Meta-analysis of theory of mind (ToM) impairment in bipolar disorder. Psychol. Med.
46, 253–264. https://doi.org/10.1017/s0033291715001993 (2016).
15. Persad, S. M. & Polivy, J. Differences between depressed and nondepressed individuals in the recognition of and response to
facial emotional cues. J. Abnorm. Psychol. 102, 358–368. https://doi.org/10.1037//0021-843x.102.3.358 (1993).
16. LeMoult, J., Joormann, J., Sherdell, L., Wright, Y. & Gotlib, I. H. Identification of emotional facial expressions following recovery
from depression. J. Abnorm. Psychol. 118, 828–833. https://doi.org/10.1037/a0016944 (2009).
17. Naatanen, R., Gaillard, A. W. & Mantysalo, S. Early selective-attention effect on evoked potential reinterpreted. Acta Psychol.
42, 313–329 (1978).
18. Javitt, D. C., Zukin, S. R., Heresco-Levy, U. & Umbricht, D. Has an angel shown the way? Etiological and therapeutic implications
of the PCP/NMDA model of schizophrenia. Schizophr. Bull. 38, 958–966. https://doi.org/10.1093/schbul/sbs069 (2012).
19. Naatanen, R. et al. The mismatch negativity (MMN)–a unique window to disturbed central auditory processing in ageing and
different clinical conditions. Clin. Neurophysiol. 123, 424–458. https://doi.org/10.1016/j.clinph.2011.09.020 (2012).
20. Wynn, J. K., Sugar, C., Horan, W. P., Kern, R. & Green, M. F. Mismatch negativity, social cognition, and functioning in schizo-
phrenia patients. Biol. Psychiatry 67, 940–947. https://doi.org/10.1016/j.biopsych.2009.11.024 (2010).
21. Lee, S. H., Sung, K., Lee, K. S., Moon, E. & Kim, C. G. Mismatch negativity is a stronger indicator of functional outcomes than
neurocognition or theory of mind in patients with schizophrenia. Prog. Neuropsychopharmacol. Biol. Psychiatry 48, 213–219.
https://doi.org/10.1016/j.pnpbp.2013.10.010 (2014).
22. Chitty, K. M., Lagopoulos, J., Lee, R. S., Hickie, I. B. & Hermens, D. F. A systematic review and meta-analysis of proton magnetic
resonance spectroscopy and mismatch negativity in bipolar disorder. Eur. Neuropsychopharam. 23, 1348–1363. https://doi.
org/10.1016/j.euroneuro.2013.07.007 (2013).
23. Javitt, D. C., Doneshka, P., Grochowski, S. & Ritter, W. Impaired mismatch negativity generation reflects widespread dysfunction
of working memory in schizophrenia. Arch. Gen. Psychiatry 52, 550–558 (1995).
Scientific Reports | (2020) 10:12831 | https://doi.org/10.1038/s41598-020-69776-4 9
Vol.:(0123456789)www.nature.com/scientificreports/
24. Light, G. A., Swerdlow, N. R. & Braff, D. L. Preattentive sensory processing as indexed by the MMN and P3a brain responses
is associated with cognitive and psychosocial functioning in healthy adults. J. Cogn. Neurosci. 19, 1624–1632. https://doi.
org/10.1162/jocn.2007.19.10.1624 (2007).
25. Kargel, C., Sartory, G., Kariofillis, D., Wiltfang, J. & Muller, B. W. Mismatch negativity latency and cognitive function in schizo-
phrenia. PLoS ONE 9, e84536. https://doi.org/10.1371/journal.pone.0084536 (2014).
26. Levanen, S., Ahonen, A., Hari, R., McEvoy, L. & Sams, M. (1996) Deviant auditory stimuli activate human left and right auditory
cortex differently. Cereb. Cortex (New York, N.Y.: 1991) 6, 288–296. https://doi.org/10.1093/cercor/6.2.288 (1996).
27. Oknina, L. B. et al. Frontal and temporal sources of mismatch negativity in healthy controls, patients at onset of schizophrenia
in adolescence and others at 15 years after onset. Schizophr. Res. 76, 25–41. https://doi.org/10.1016/j.schres.2004.10.003 (2005).
28. Garrido, M. I., Kilner, J. M., Stephan, K. E. & Friston, K. J. The mismatch negativity: a review of underlying mechanisms. Clin.
Neurophysiol. 120, 453–463. https://doi.org/10.1016/j.clinph.2008.11.029 (2009).
29. Jemel, B., Achenbach, C., Muller, B. W., Ropcke, B. & Oades, R. D. Mismatch negativity results from bilateral asymmetric dipole
sources in the frontal and temporal lobes. Brain Topogr. 15, 13–27 (2002).
30. Waberski, T. D. et al. Spatio-temporal source imaging reveals subcomponents of the human auditory mismatch negativity in
the cingulum and right inferior temporal gyrus. Neurosci. Lett. 308, 107–110. https://doi.org/10.1016/s0304-3940(01)01988-7
(2001).
31. Paavilainen, P. et al. Evidence for the different additivity of the temporal and frontal generators of mismatch negativity: a human
auditory event-related potential study. Neurosci. Lett. 349, 79–82. https://doi.org/10.1016/s0304-3940(03)00787-0 (2003).
32. Giard, M. H., Perrin, F., Pernier, J. & Bouchet, P. Brain generators implicated in the processing of auditory stimulus deviance: a
topographic event-related potential study. Psychophysiology 27, 627–640 (1990).
33. Gomot, M., Giard, M. H., Roux, S., Barthelemy, C. & Bruneau, N. Maturation of frontal and temporal components of mismatch
negativity (MMN) in children. NeuroReport 11, 3109–3112. https://doi.org/10.1097/00001756-200009280-00014 (2000).
34. Maess, B., Jacobsen, T., Schroger, E. & Friederici, A. D. Localizing pre-attentive auditory memory-based comparison: magnetic
mismatch negativity to pitch change. Neuroimage 37, 561–571. https://doi.org/10.1016/j.neuroimage.2007.05.040 (2007).
35. Lan, M. J. et al. Cortical thickness differences between bipolar depression and major depressive disorder. Bipolar Disord. 16,
378–388. https://doi.org/10.1111/bdi.12175 (2014).
36. Fields, E. C., Weber, K., Stillerman, B., Delaney-Busch, N. & Kuperberg, G. R. Functional MRI reveals evidence of a self-positivity
bias in the medial prefrontal cortex during the comprehension of social vignettes. Soc. Cogn. Affect. Neurosci. 14, 613–621. https
://doi.org/10.1093/scan/nsz035 (2019).
37. Koike, S. et al. Association between rostral prefrontal cortical activity and functional outcome in first-episode psychosis: a longi-
tudinal functional near-infrared spectroscopy study. Schizophr. Res. 170, 304–310. https://doi.org/10.1016/j.schres.2016.01.003
(2016).
38. MacQueen, G. M. & Memedovich, K. A. Cognitive dysfunction in major depression and bipolar disorder: assessment and treat-
ment options. Psychiatry Clin. Neurosci. 71, 18–27. https://doi.org/10.1111/pcn.12463 (2017).
39. Chen, M., Fitzgerald, H. M., Madera, J. J. & Tohen, M. Functional outcome assessment in bipolar disorder: a systematic literature
review. Bipolar Disord. 21, 194–214. https://doi.org/10.1111/bdi.12775 (2019).
40. Kraus, C., Kadriu, B., Lanzenberger, R., Zarate, C. A. Jr. & Kasper, S. Prognosis and improved outcomes in major depression: a
review. Transl. Psychiatry 9, 127. https://doi.org/10.1038/s41398-019-0460-3 (2019).
41. Salisbury, D. F., Kuroki, N., Kasai, K., Shenton, M. E. & McCarley, R. W. Progressive and interrelated functional and structural
evidence of post-onset brain reduction in schizophrenia. Arch. Gen. Psychiatry 64, 521–529. https://doi.org/10.1001/archp
syc.64.5.521 (2007).
42. Umbricht, D. S., Bates, J. A., Lieberman, J. A., Kane, J. M. & Javitt, D. C. Electrophysiological indices of automatic and controlled
auditory information processing in first-episode, recent-onset and chronic schizophrenia. Biol. Psychiatry 59, 762–772. https://
doi.org/10.1016/j.biopsych.2005.08.030 (2006).
43. Baldeweg, T. & Hirsch, S. R. Mismatch negativity indexes illness-specific impairments of cortical plasticity in schizophrenia:
a comparison with bipolar disorder and Alzheimer’s disease. Int. J. Psychophysiol. 95, 145–155. https://doi.org/10.1016/j.ijpsy
cho.2014.03.008 (2015).
44. Schmidt, A. et al. Modeling ketamine effects on synaptic plasticity during the mismatch negativity. Cereb. Cortex (New York,
N.Y.: 1991) 23, 2394–2406. https://doi.org/10.1093/cercor/bhs238 (2013).
45. Jahshan, C. et al. Cross-diagnostic comparison of duration mismatch negativity and P3a in bipolar disorder and schizophrenia.
Bipolar Disord. 14, 239–248. https://doi.org/10.1111/j.1399-5618.2012.01008.x (2012).
46. Kaur, M. et al. Neurophysiological biomarkers support bipolar-spectrum disorders within psychosis cluster. J. Psychiatry Neurosci.
JPN 37, 313–321. https://doi.org/10.1503/jpn.110081 (2012).
47. Kugaya, A. & Sanacora, G. Beyond monoamines: glutamatergic function in mood disorders. CNS Spectr. 10, 808–819 (2005).
48. Sanacora, G., Zarate, C. A., Krystal, J. H. & Manji, H. K. Targeting the glutamatergic system to develop novel, improved thera-
peutics for mood disorders. Nat. Rev. Drug Discov. 7, 426–437. https://doi.org/10.1038/nrd2462 (2008).
49. Inoshita, M. et al. Elevated peripheral blood glutamate levels in major depressive disorder. Neuropsychiatr. Dis. Treat. 14, 945–953.
https://doi.org/10.2147/ndt.S159855 (2018).
50. Rao, J. S., Harry, G. J., Rapoport, S. I. & Kim, H. W. Increased excitotoxicity and neuroinflammatory markers in postmortem
frontal cortex from bipolar disorder patients. Mol. Psychiatry 15, 384–392. https://doi.org/10.1038/mp.2009.47 (2010).
51. Umbricht, D. et al. How specific are deficits in mismatch negativity generation to schizophrenia?. Biol. Psychiatry 53, 1120–1131
(2003).
52. Catts, S. V. et al. Brain potential evidence for an auditory sensory memory deficit in schizophrenia. Am. J. Psychiatry 152,
213–219. https://doi.org/10.1176/ajp.152.2.213 (1995).
53. Oades, R. D., Dittmann-Balcar, A., Zerbin, D. & Grzella, I. Impaired attention-dependent augmentation of MMN in nonparanoid
vs paranoid schizophrenic patients: a comparison with obsessive-compulsive disorder and healthy subjects. Biol. Psychiatry 41,
1196–1210. https://doi.org/10.1016/s0006-3223(96)00214-4 (1997).
54. Kawakubo, Y. & Kasai, K. Support for an association between mismatch negativity and social functioning in schizophrenia.
Prog. Neuropsychopharmacol. Biol. Psychiatry 30, 1367–1368. https://doi.org/10.1016/j.pnpbp.2006.03.003 (2006).
55. Light, G. A. & Braff, D. L. Mismatch negativity deficits are associated with poor functioning in schizophrenia patients. Arch.
Gen. Psychiatry 62, 127–136. https://doi.org/10.1001/archpsyc.62.2.127 (2005).
56. Light, G. A. & Braff, D. L. Stability of mismatch negativity deficits and their relationship to functional impairments in chronic
schizophrenia. Am. J. Psychiatry 162, 1741–1743. https://doi.org/10.1176/appi.ajp.162.9.1741 (2005).
57. Hermens, D. F. et al. Impaired MMN/P3a complex in first-episode psychosis: cognitive and psychosocial associations. Prog.
Neuropsychopharmacol. Biol. Psychiatry 34, 822–829. https://doi.org/10.1016/j.pnpbp.2010.03.019 (2010).
58. Murray, E. A., Wise, S. P. & Drevets, W. C. Localization of dysfunction in major depressive disorder: prefrontal cortex and
amygdala. Biol. Psychiatry 69, e43-54. https://doi.org/10.1016/j.biopsych.2010.09.041 (2011).
59. Nejad, A. B. et al. Medial prefrontal disengagement during self-focus in formerly depressed patients prone to rumination. J.
Affect. Disord. 247, 36–44. https://doi.org/10.1016/j.jad.2019.01.004 (2019).
60. Takei, Y. et al. Preattentive dysfunction in major depression: a magnetoencephalography study using auditory mismatch negativ-
ity. Psychophysiology 46, 52–61. https://doi.org/10.1111/j.1469-8986.2008.00748.x (2009).
Scientific Reports | (2020) 10:12831 | https://doi.org/10.1038/s41598-020-69776-4 10
Vol:.(1234567890)www.nature.com/scientificreports/
61. Holroyd, C. B. & Yeung, N. Motivation of extended behaviors by anterior cingulate cortex. Trends Cogn. Sci. 16, 122–128. https
://doi.org/10.1016/j.tics.2011.12.008 (2012).
62. Malhi, G. S. et al. Neuropsychological deficits and functional impairment in bipolar depression, hypomania and euthymia.
Bipolar Disord. 9, 114–125. https://doi.org/10.1111/j.1399-5618.2007.00324.x (2007).
63. Allman, J. M., Hakeem, A., Erwin, J. M., Nimchinsky, E. & Hof, P. The anterior cingulate cortex. The evolution of an interface
between emotion and cognition. Ann. N. Y. Acad. Sci. 935, 107–117 (2001).
64. Apps, M. A., Lockwood, P. L. & Balsters, J. H. The role of the midcingulate cortex in monitoring others’ decisions. Front. Neurosci.
7, 251. https://doi.org/10.3389/fnins.2013.00251 (2013).
65. Townsend, J. D. et al. Deficits in inferior frontal cortex activation in euthymic bipolar disorder patients during a response inhibi-
tion task. Bipolar Disord. 14, 442–450. https://doi.org/10.1111/j.1399-5618.2012.01020.x (2012).
66. Grecucci, A., Giorgetta, C., Bonini, N. & Sanfey, A. G. Reappraising social emotions: the role of inferior frontal gyrus, temporo-
parietal junction and insula in interpersonal emotion regulation. Front. Hum. Neurosci. 7, 523. https://doi.org/10.3389/fnhum
.2013.00523(2013).
67. Grecucci, A., Giorgetta, C., Van’t Wout, M., Bonini, N. & Sanfey, A. G. Reappraising the ultimatum: an fMRI study of emotion
regulation and decision making. Cereb. Cortex (New York, N.Y.: 1991) 23, 399–410. https: //doi.org/10.1093/cercor /bhs028 (2013).
68. Phillips, M. L., Drevets, W. C., Rauch, S. L. & Lane, R. Neurobiology of emotion perception II: Implications for major psychiatric
disorders. Biol. Psychiatry 54, 515–528. https://doi.org/10.1016/s0006-3223(03)00171-9 (2003).
69. Heitzeg, M. M. et al. Left middle frontal gyrus response to inhibitory errors in children prospectively predicts early problem
substance use. Drug Alcohol. Depend. 141, 51–57. https://doi.org/10.1016/j.drugalcdep.2014.05.002 (2014).
70. Andersson, M., Ystad, M., Lundervold, A. & Lundervold, A. J. Correlations between measures of executive attention and
cortical thickness of left posterior middle frontal gyrus—a dichotic listening study. Behav. Brain Funct. 5, 41. https://doi.
org/10.1186/1744-9081-5-41 (2009).
71. Vanhatalo, H. Brief Psychological Intervention for Depression—An ERP Study. Master’s thesis thesis, University of Jyväskylä (2009).
72. Javadapour, A. et al. Increased anterior cingulate cortex volume in bipolar I disorder. Aust. N. Z. J. Psychiatry 41, 910–916. https
://doi.org/10.1080/00048670701634978 (2007).
73. Cotrena, C., Branco, L. D., Shansis, F. M. & Fonseca, R. P. Executive function impairments in depression and bipolar dis-
order: association with functional impairment and quality of life. J. Affect. Disord. 190, 744–753. https://doi.org/10.1016/j.
jad.2015.11.007 (2016).
74. Hermens, D. F., Chitty, K. M. & Kaur, M. Mismatch negativity in bipolar disorder: a neurophysiological biomarker of intermedi-
ate effect?. Schizophr. Res. 191, 132–139. https://doi.org/10.1016/j.schres.2017.04.026 (2018).
75. Shimano, S. et al. Preattentive dysfunction in patients with bipolar disorder as revealed by the pitch-mismatch negativity: a
magnetoencephalography (MEG) study. Bipolar Disord. 16, 592–599. https://doi.org/10.1111/bdi.12208 (2014).
76. Naismith, S. L. et al. Reduced temporal mismatch negativity in late-life depression: an event-related potential index of cognitive
deficit and functional disability?. J. Affect. Disord. 138, 71–78. https://doi.org/10.1016/j.jad.2011.12.028 (2012).
77. Domjan, N., Csifcsak, G., Drotos, G., Janka, Z. & Szendi, I. Different patterns of auditory information processing deficits in
chronic schizophrenia and bipolar disorder with psychotic features. Schizophr. Res. 139, 253–259. https: //doi.org/10.1016/j.schre
s.2012.06.002 (2012).
78. Umbricht, D. et al. Effects of risperidone on auditory event-related potentials in schizophrenia. Int. J. Neuropsychopharmacol.
2, 299–304. https://doi.org/10.1017/s1461145799001595 (1999).
79. Kuang, W., Tian, L., Yue, L. & Li, J. Effects of escitalopram with a Chinese traditional compound Jiuweizhenxin-keli on mismatch
negativity and P50 in patients with major depressive disorders. Neuropsychiatr. Dis. Treat. 12, 1935–1941 (2016).
80. Nakagome, K. et al. overnight effects of triazolam on cognitive function: an event-related potentials study. Neuropsychobiology
38, 232–240. https://doi.org/10.1159/000026547 (1998).
81. Pan, W. et al. Attenuation of auditory mismatch negativity in serotonin transporter knockout mice with anxiety-related behaviors.
Behav. Brain Res. 379, 112387. https://doi.org/10.1016/j.bbr.2019.112387 (2020).
82. First, M. B. et al. User’s Guide for the Structured Clinical Interview for DSM-IV Axis II Personality Disorders: SCID-II (American
Psychiatric Press, Washington, 1997).
83. Burkey, J. M., Lippy, W. H., Schuring, A. G. & Rizer, F. M. Clinical utility of the 512-Hz Rinne tuning fork test. Am. J. Otol. 19,
59–62 (1998).
84. Rhee, M. K. A standardization study of Beck depression inventory I; Korean version (K-BDI): reliability and factor analysis.
Korean J. Psychopathol. 4, 77–95 (1995).
85. Kim, J. T. & Shin, D. K. A study based on the standardization of the STAI for Korea. New Med. J. 2, 69–75 (1978).
86. Jon, D. I. et al. Validity and reliability of the Korean version of the Mood Disorder Questionnaire. Compr. Psychiatry 50, 286–291.
https://doi.org/10.1016/j.comppsych.2008.07.008 (2009).
87. American Psychiatric Association. Diagnostic and Statistical Manual of Mental Disorders: DSM-IV-TR 4th, Text Revision edn
(American Psychiatric Association, Washington, 2000).
88. Weissman, M. M., Paykel, E. S., Siegel, R. & Klerman, G. L. The social role performance of depressed women: comparisons with
a normal group. Am. J. Orthopsychiatr. 41, 390–405 (1971).
89. Kim, C. K. et al. Development of the Korean version of the Social Adjustment Scale in the schizophrenics: a study on the reli-
ability and validity. J Korean Neuropsychiatry Assoc. 38, 1351–1364 (1999).
90. Tyrer, P. et al. The Social Functioning Questionnaire: a rapid and robust measure of perceived functioning. Int. J. Soc. Psychiatry
51, 265–275 (2005).
91. Kim, S. et al. Mismatch negativity and cortical thickness in patients with schizophrenia and bipolar disorder. Schizophr. Bull.
45, 425–435. https://doi.org/10.1093/schbul/sby041 (2019).
92. Semlitsch, H. V., Anderer, P., Schuster, P. & Presslich, O. A solution for reliable and valid reduction of ocular artifacts, applied
to the P300 ERP. Psychophysiology 23, 695–703. https://doi.org/10.1111/j.1469-8986.1986.tb00696.x (1986).
93. Pascual-Marqui, R. D. Standardized low-resolution brain electromagnetic tomography (sLORETA): technical details. Methods
Find. Exp. Clin. Pharmacol. 24, 5–12 (2002).
94. Fuchs, M., Kastner, J., Wagner, M., Hawes, S. & Ebersole, J. S. A standardized boundary element method volume conductor
model. Clin. Neurophysiol. 113, 702–712 (2002).
95. Brett, M., Johnsrude, I. S. & Owen, A. M. The problem of functional localization in the human brain. Nat. Rev. Neurosci. 3, 243
(2002).
96. Haukoos, J. S. & Lewis, R. J. Advanced statistics: bootstrapping confidence intervals for statistics with “difficult” distributions.
Acad. Emerg. Med. 12, 360–365. https://doi.org/10.1197/j.aem.2004.11.018 (2005).
97. Ruscio, J. Constructing confidence intervals for Spearman’s rank correlation with ordinal data: a simulation study comparing
analytic and bootstrap methods. J. Mod. Appl. Stat. 7, 7 (2008).
98. Pernet, C. R., Wilcox, R. & Rousselet, G. A. Robust correlation analyses: false positive and power validation using a new open
source matlab toolbox. Front. Psychol. 3, 606. https://doi.org/10.3389/fpsyg.2012.00606 (2012).
99. Kim, J. S., Kim, S., Jung, W., Im, C. H. & Lee, S. H. Auditory evoked potential could reflect emotional sensitivity and impulsivity.
Sci. Rep. 6, 37683. https://doi.org/10.1038/srep37683 (2016).
Scientific Reports | (2020) 10:12831 | https://doi.org/10.1038/s41598-020-69776-4 11
Vol.:(0123456789)You can also read


