Lawrence Berkeley National Laboratory - Recent Work - eScholarship
←
→
Page content transcription
If your browser does not render page correctly, please read the page content below
Lawrence Berkeley National Laboratory
Recent Work

Title
Physiological characterization and transcriptome analysis of Pichia pastoris reveals its
response to lignocellulose-derived inhibitors.

Permalink
https://escholarship.org/uc/item/3pn9d7w0

Journal
AMB Express, 11(1)

ISSN
2191-0855

Authors
Paes, Barbara G
Steindorff, Andrei Stecca
Formighieri, Eduardo F
et al.

Publication Date
2021-01-03

DOI
10.1186/s13568-020-01170-9

Peer reviewed

 eScholarship.org                                Powered by the California Digital Library
                                                                 University of California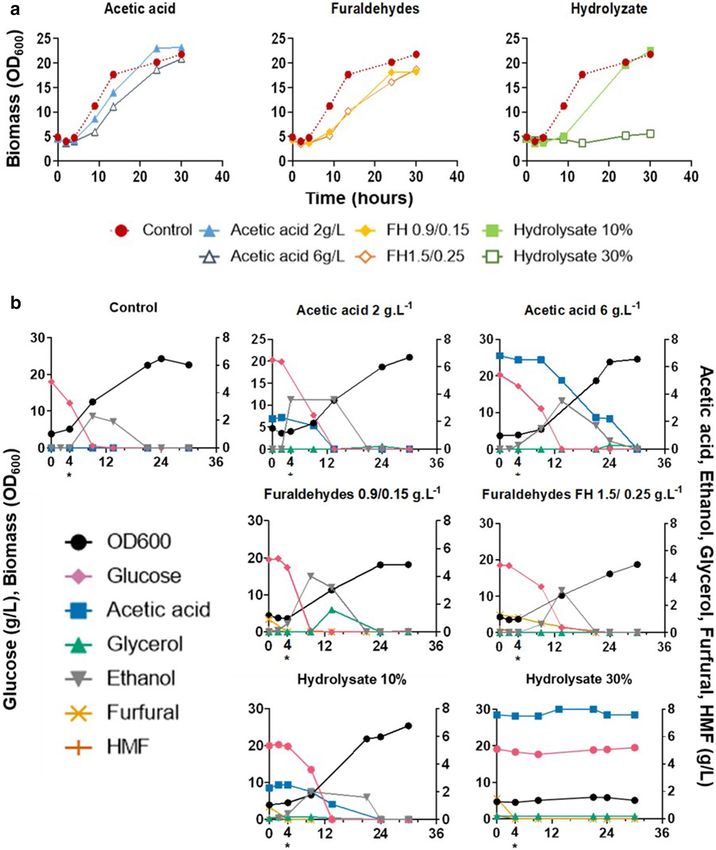
Paes et al. AMB Expr (2021) 11:2
https://doi.org/10.1186/s13568-020-01170-9
ORIGINAL ARTICLE Open Access
Physiological characterization
and transcriptome analysis of Pichia pastoris
reveals its response to lignocellulose‑derived
inhibitors
Barbara G. Paes1,2, Andrei Stecca Steindorff1, Eduardo F. Formighieri1, Ildinete Silva Pereira1,2
and João Ricardo M. Almeida1,3*
Abstract
The negative effects of lignocellulose-derived inhibitors such as acetic acid and furaldehydes on microbial metabo-
lism constitute a significant drawback to the usage of biomass feedstocks for the production of fuels and chemicals.
The yeast Pichia pastoris has shown a great biotechnological potential for producing heterologous proteins and
renewable chemicals. Despite its relevance, the performance of P. pastoris in presence of lignocellulose-derived inhibi-
tors remains unclear. In this work, our results show for the first time the dose-dependent response of P. pastoris to
acetic acid, furaldehydes (HMF and furfural), and sugarcane biomass hydrolysate, both at physiological and transcrip-
tional levels. The yeast was able to grow in synthetic media with up to 6 g.L−1 acetic acid, 1.75 g.L−1 furaldehydes or
hydrolysate diluted to 10% (v/v). However, its metabolism was completely hindered in presence of hydrolysate diluted
to 30% (v/v). Additionally, the yeast was capable to co-consume acetic acid and glucose. At the transcriptional level, P.
pastoris response to lignocellulose-derived inhibitors relays on the up-regulation of genes related to transmembrane
transport, oxidoreductase activities, RNA processing, and the repression of pathways related to biosynthetic processes
and central carbon metabolism. These results demonstrate a polygenetic response that involves detoxification activi-
ties, and maintenance of energy and cellular homeostasis. In this context, ALD4, OYE3, QOR2, NTL100, YCT1, and PPR1
were identified as target genes to improve P. pastoris tolerance. Altogether, this work provides valuable insights into
the P. pastoris stress tolerance, which can be useful to expand its use in different bioprocesses.
Keywords: Komagataella phaffii, Pichia pastoris, Inhibitors, Lignocellulosic hydrolysate, Acetic acid, Furaldehydes
Introduction microbial fermentation, the biomass needs to undergo
Lignocellulosic biomass is an abundant raw material pretreatment and hydrolysis to release the monosac-
that can be converted by physicochemical and micro- charides present in the biomass. During pretreatment,
bial processes into different products, such as biofuels, compounds that inhibit microbial metabolism are also
building-block chemicals, and high added-value chemi- released or formed during dehydration of pentoses and
cals (Anwar et al. 2014; Paes and Almeida 2014). Before hexoses, hemicellulose deacetylation, or lignin break-
down (Almeida et al. 2007; Jönsson and Martín 2016).
These inhibitors can be classified into three main
*Correspondence: joao.almeida@embrapa.br groups: furaldehydes, such as 2-furaldeyde (furfural) and
1
Laboratory of Genetics and Biotechnology, Embrapa Agroenergia, 5-hydroxymethyl-2-furaldehyde (HMF), weak acids (ace-
Parque Estação Biológica, PqEB – W3 Norte Final s/no, Brasília, DF
70.770‑901, Brazil
tic acid, formic acid, and levulinic acid), and phenolic
Full list of author information is available at the end of the article compounds (vanillin, syringaldehyde, coniferyl aldehyde,
© The Author(s) 2021. This article is licensed under a Creative Commons Attribution 4.0 International License, which permits use, sharing,
adaptation, distribution and reproduction in any medium or format, as long as you give appropriate credit to the original author(s) and
the source, provide a link to the Creative Commons licence, and indicate if changes were made. The images or other third party material
in this article are included in the article’s Creative Commons licence, unless indicated otherwise in a credit line to the material. If material
is not included in the article’s Creative Commons licence and your intended use is not permitted by statutory regulation or exceeds the
permitted use, you will need to obtain permission directly from the copyright holder. To view a copy of this licence, visit http://creativeco
mmons.org/licenses/by/4.0/.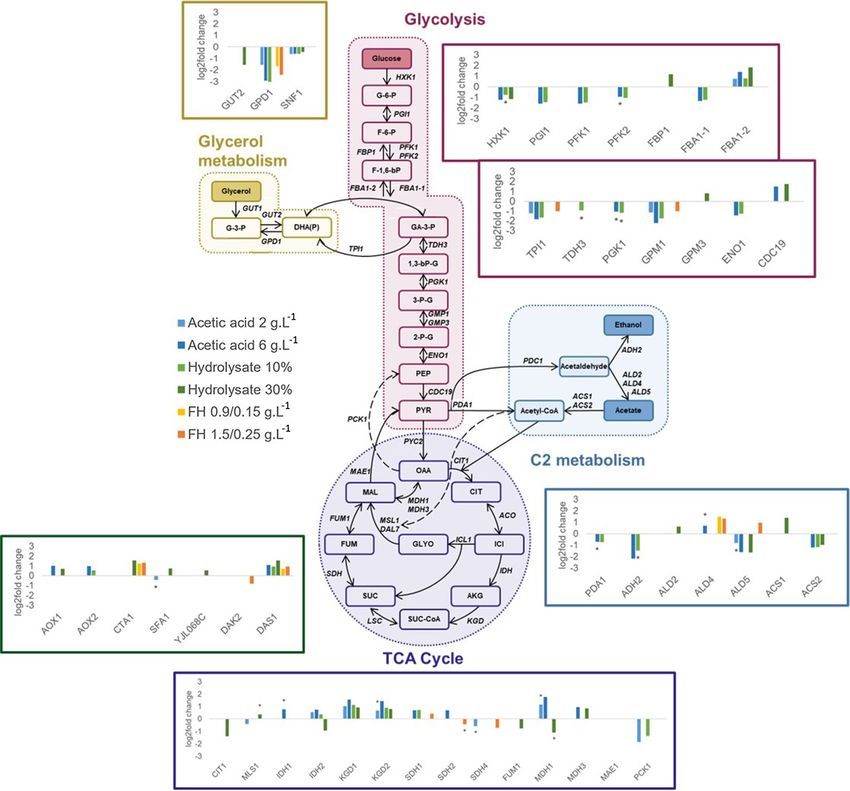
Paes et al. AMB Expr   (2021) 11:2                                                                              Page 2 of 15

and othersAlmeida et al. 2007; Hasunuma and Kondo              yeast extensively used in the production of heterologous
2012). The pretreatment and hydrolysis procresses, as          proteins and metabolites both in industry and academia
well as biomass source influence the formation and con-        (Zahrl et al. 2017). To this date, more than five thousand
centrations of the aforementioned compounds in ligno-          different proteins have been heterologously expressed in
cellulosic hydrolysates (Almeida et al. 2011; Hasunuma         this yeast (Schwarzhans et al. 2017). The biotechnologi-
and Kondo 2012; Jönsson and Martín 2016).                      cal potential of P. pastoris has been amplified by its use
   Effects of lignocellulose-derived inhibitors on yeast       in metabolic engineering programs (Nocon et al. 2014;
physiology and resistance mechanisms have been exten-          Peña et al. 2018), and the production of many other com-
sively investigated for Saccharomyces cerevisiae (Rum-         pounds besides proteins have been considered, including
bold et al. 2009; Almeida et al. 2011; Zha et al. 2013; Yang   alcohols, acids, vitamins, and others (Siripong et al. 2018)
et al. 2018) and to a minor extent for other yeasts, like      (Vogl et al. 2013; Almeida et al. 2018; Gasser and Mat-
Zygosaccharomyces (Martín and Jönsson 2003), Spathas-          tanovich 2018; Melo et al. 2018). The increasing interest
pora passalidarum (Hou and Yao 2012), Candida spp              in P. pastoris has led to the construction of recombinant
(Cottier et al. 2015; Moreno et al. 2019) and others (Del-     strains capable of metabolizing carbon sources derived
genes et al. 1996; Zha et al. 2013; Yamakawa et al. 2020).     from lignocellulose, including cellulose (Kickenweiz et al.
Inhibitory effects and mechanisms vary depending on            2018), glucose (Siripong et al. 2018) and xylose (Li et al.
the chemical structure of the specific inhibitor and its       2015; Almeida et al. 2018). Acetic acid has also been
concentration. Generally, they are cytotoxic and hinder        studied as an alternative carbon source for this yeast (Xie
microbial growth, reduce cell vitality and fermentation        et al. 2005; Xu et al. 2019).
efficiency. Their main mechanisms of action involve inhi-        Here we unveil the potential of P. pastoris for the con-
bition of essential enzymes related to cell metabolism,        version of sugars present in lignocellulosic hydrolysates.
DNA replication, RNA, and protein synthesis and redox          More specifically, we evaluate the yeast’s physiological
imbalance, and damaging cellular membranes (Modig              response to acetic acid, furaldehydes, and sugarcane bio-
et al. 2002, 2008; Liu et al. 2004; Almeida et al. 2007;       mass hydrolysate. RNA-seq based transcriptome analysis
Skerker et al. 2013; Sitepu et al. 2015).                      was employed to investigate the global response of P. pas-
   The S. cerevisiae response to inhibitors is complex and     toris in the presence of different concentrations of those
involves a polygenetic modulation of various metabolic         compounds. Lastly, the physiological and transcriptional
pathways, such as carbon, lipid, amino acid metabolism,        dose-dependent response of P. pastoris to the inhibitors
and regulatory pathways, among others. The differen-           are presented and discussed.
tial gene expression redirects the yeast’s metabolism
to allow repair of damages caused by the inhibitors and        Methods
increase the innate detoxification activities (Petersson       Strain and media
et al. 2006; Almeida et al. 2009; Mira et al. 2010; Ade-       The yeast P. pastoris X33 was used in this work (Inv-
boye et al. 2015; Brandt et al. 2019). The understanding       itrogen, USA). Stock cultures of yeast grown in YPD
of such complex mechanisms in yeasts of industrial inter-      medium (1% w/v yeast extract, 2% w/v peptone, 2% w/v
est is, therefore, crucial. Among those, methylotrophic        glucose) were preserved in 30% glycerol and maintained
yeasts, such as Ogatae polymorpha and Pichia pastoris,         at − 80 °C.
can be highlighted given their role in the production of          In order to evaluate the effect of inhibitors on yeast
fuels and chemicals (Radecka et al. 2015). On this matter,     metabolism, the medium employed was composed of
recent observations pointed to O. polymorpha tolerance         (w/v): YNB (yeast nitrogen base)(Sigma Aldrich Y0626)
to wheat straw hydrolysate when containing different           without amino acids (0.68% YNB, 2% ammonium sul-
concentrations of acetic acid, formic acid, furaldehydes,      fate), 2% glucose, 4% xylose, buffered to pH 5.5 with
and phenolic compounds. The results demonstrated that          phthalate buffer (5.1% potassium hydrogen phthalate
the sugar uptake by the yeast was reduced in the pres-         with 1,1% potassium hydroxide w/v). For each culture
ence of inhibitors. The yeast was still able to consume        condition, inhibitory compounds were added to the
some xylose and produce xylitol in presence of 12.24 g.        media in the following concentrations 2 and 6 g.L−1 of
L−1 of acetic acid and 4.17 g.L−1 of total phenolics (Yam-     acetic acid; a mixture of 0.9 g.L−1 furfural and 0.15 g.
akawa et al. 2020). However, the methylotrophic yeast          L−1 HMF (FH 0.9/0.15 g.L−1) and 1.5 g.L−1 furfural and
response mechanisms to the inhibitors were not previ-          0.25 g.L−1 HMF (FH 1.5/0.25 g.L−1) for furaldehydes;
ously reported.                                                and sugarcane bagasse hydrolysate diluted to 10% and
   As previously mentioned, the yeast Komagataella phaf-       30% of the initial concentration. The sugarcane bagasse
fii, previously known and here referred to as Pichia pas-      hydrolysate was obtained by steam explosion of sugar-
toris (Gasser & Mattanovich, 2018) is a methylotrophic         cane bagasse, than for the breakdown of the oligomers in
Paes et al. AMB Expr (2021) 11:2 Page 3 of 15
the hemicellulose-rich fraction, the liquid fraction of the (Bolger et al. 2014), and once again analyzed for the
steam explosion was subjected to hydrolysis with 0.5% quality of clean sequences on FastQC. Sequences were
H2SO4 (w/w) at 130 °C for 100 min (Morais Junior et al. aligned using STAR (Dobin et al. 2013). HTSeq-count
2019). The final composition of the sugarcane bagasse version 0.9.1 tool (Anders et al. 2015) was used for count-
hydrolysate was: 5.4 g.L−1 glucose, 90.3 g.L−1 xylose, ing the number of aligned sequences for each sample in
19.4 g.L−1 acetic acid, 2.9 g.L−1 furfural, 0.55 g.L−1 HMF. each gene and estimate gene expression. Differentially
In the media containing diluted hydrolysate, the amount expressed genes were detected by entering the count data
of glucose and xylose present in the hydrolysate was into the R program (R Core Team 2020) and using the
accounted to keep the final glucose and xylose concentra- DESeq2 package (Love et al. 2014).
tion at 2% and 4%, respectively. Genes were considered significantly differentially
expressed with an adjusted P-values limit < 0.05 both for
increasing and decreasing expression. The differentially
Culture conditions expressed genes (DEG) overlap between conditions was
Cells plated in YPD medium were initially inoculated assessed using Venn diagrams built with the Venn online
in 5 mL YPD and grown overnight (28 °C, 200 rpm on platform (http://bioinformatics.psb.ugent.be/webtools/
a rotary shaker). Then cells were transferred to 200 mL Venn/). The list of DEGs in the DESeq2 package was
YPD in a 1 L shake flasks and grown overnight at the used for functional analysis to identify which genes and
same conditions. The culture was washed twice with dis- metabolic pathways are being activated or repressed in
tilled water and diluted down to an initial optical den- response to acetic acid, furaldehydes and hydrolyzed. For
sity (OD) at 600 nm of 5 in 50 mL of medium in 250 mL this, the induced and the repressed genes were separated
shake flasks. The culture was incubated for 30 h at 28 °C into different files. The individual lists were subjected to
and 200 rpm. Samples for transcriptome were withdrawn functional enrichment analysis using Fisher’s Exact Test
after 4 h of incubation and samples for metabolite analy- with a false discovery rate (FDR) < 0.05 in the GO_MWU
sis were withdrawn regularly. All experiments were car- tool (https://github.com/z0on/GO_MWU). This analysis
ried out in biological triplicate. assesses the significance of the representativeness of the
GO (Gene Ontology) categories among DEG.
RNA extraction and quality analysis For the heatmap, the expression values of 630 genes
RNA was extracted using TRIZOL (Thermo Fisher Sci- differentially expressed in all conditions (adjusted
entific, USA) reagent following the manufacturer´s pro- P-value ≤ 0.05) were hierarchically clustered using MeV
tocol with few modifications. A culture of 5 mL was 4.9.0 program (http://mev.tm4.org) with Pearson corre-
harvested for 1 min at 14.000 × g at 4 °C. The superna- lation metric and average linkage clustering. A distance
tant was discarded and 1 mL of TRIZOL was added to threshold of 0.75 was used to split the gene tree into 7
the pellet. Cells were transferred to a 2 mL microtube clusters. Gene ontology annotation from each cluster
containing approximately 200 μL of sterile 0.02 mm glass was used as input to REVIGO (Supek et al. 2011) analy-
beads and then disrupted by four cycles of 1 min at Mini- sis to reduce redundancy and build the network. We used
Beadbeater-96 (Biospec Products, USA), resting the tube GO terms database from S. cerevisiae and SimRel as the
on ice between cycles. Finally, RNA extraction followed semantic similarity measure.
manufacturer’s instructions by performing chloroform The transcriptome datasets generated during the cur-
and ethanol washings. The RNA integrity was evaluated rent study are available in the NCBI with the accession
via Agilent Bioanalyzer 2100 system (Agilent Technolo- number PRJNA666642.
gies, USA), Nanodrop 1000 Spectrophotometer (Thermo
Fisher Scientific, USA) and in 1% agarose gels. Quantification of metabolites
Carbon sources (xylose and glucose) and extracellular
RNA sequencing and data analysis metabolites xylitol, glycerol, acetate, HMF, and furfural
RNA-seq was performed by Centro de Genômica, the concentrations were determined by High-Performance
University of São Paulo on Illumina HiSeq 2500 system Liquid Chromatography (HPLC) (Veras et al. 2017) in
v4 using HiSeq SBS Kit v4, and 100 bp (2x) paired-end samples withdrawn on different time points. Samples
reads. Libraries for RNA-Seq were prepared with TruSeq were centrifuged, and the supernatant was analyzed by
Stranded mRNA Sample Prep LT Protocol (Illumina, HPLC (Acquity UPLC H Class, Waters, USA) equipped
USA) from RNA extractions of 21 independent samples. with a refractive index and a PDA detector. Metabolites
FastQC software was used to evaluate base quality dis- were separated on an HPX-87 H column (Bio-Rad Labo-
tributions based on phred value (Andrews et al. 2012). ratories, USA), using a 5 mM sulfuric acid mobile phase
Raw reads were processed with Trimmomatic software at a flow rate of 0.6 mL/min and temperature of 45 °C.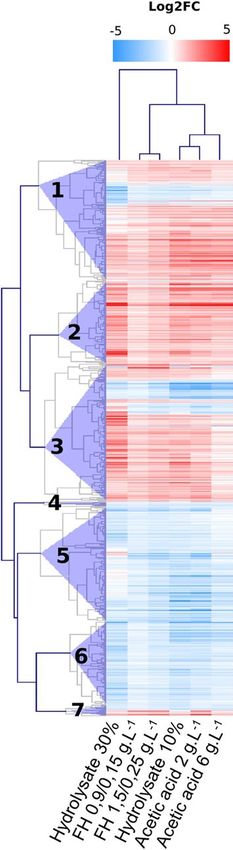
Paes et al. AMB Expr (2021) 11:2 Page 4 of 15
Biomass was measured through O
D600 using a spectro- final growth in the presence of the hydrolysate 10% and
photometer (SpectraMax M3, Molecular Devices, USA). in the control media. It was also able to consume the ace-
tic acid present in the hydrolysate. Hydrolysate 30% com-
Results pletely impaired the yeast metabolism (Fig. 1b), and no
Fermentative performance of P. pastoris in presence growth was detected even after 72 h of incubation (data
of lignocellulose‑derived inhibitors not shown). Of note, in the evaluated conditions, Pichia
To gain insight of the physiological response of P. pas- was not able to consume xylose.
toris to lignocellulose-derived inhibitors, the yeast was
cultivated in the presence of acetic acid, furaldehydes, Transcriptional response of P. pastoris
and sugarcane bagasse hydrolysate. As the yeast growth towards lignocellulose‑derived inhibitors
was completely abolished in hydrolysate concentrations A genome-wide RNA-seq transcriptional profiling was
above 30% (data not shown), the sugarcane biomass used to understand the overall cellular response of P. pas-
hydrolysate employed in this study was diluted in defined toris toward lignocellulose-derived inhibitors. For this,
medium to 10% and 30% concentrations. The concentra- the yeast was cultivated in YNB medium supplemented
tions of acetic acid (2 g.L−1 and 6 g.L−1) and furaldehydes or not with two different concentrations of acetic acid,
(FH 0.9/0.15 g.L−1 and FH 1.5/0.25 g.L−1) were similar furaldehydes (HMF and furfural) or sugarcane bagasse
to the ones found in the hydrolysate 10% and 30%. Simi- hydrolysate. Glucose and xylose concentrations were
lar concentrations were always observed in the range of normalized to 2% and 4%, respectively, in all cultivation
inhibitors found in lignocellulosic hydrolysates from dif- conditions (Fig. 1). To identify differentially expressed
ferent sources after physicochemical pretreatment (Kim genes (DEGs), the experimental data from cultivations
2018). in presence of inhibitors were normalized to the control
The growth profile of P. pastoris varied drastically condition (no inhibitor). A total of 429,738 sequence
according to the conditions evaluated (Fig. 1a). In the reads were obtained after quality trimming. Samples
absence of inhibitors, the lag phase of growth ended were aligned to the K. phaffii str. WT (GenBank acces-
after 4 h, the yeast consumed 97% of the available glu- sion no. GCA_001708085) reference genome. Princi-
cose after 9 h of cultivation reaching O D600 around 18 pal component analysis based on expression patterns
(Fig. 1a). Acetic acid did not extend the lag phase, but it showed a good reproducibility of the biological replicates
reduced the yeast growth and sugar consumption rate in and distinct isolation of hydrolysate 30% replicates from
the first hours of cultivation. Indeed, the yeast consumed the other conditions (Fig. 2).
81% and 60.6% of available glucose in the presence of 2 g. The inhibitors incited a significant transcriptional
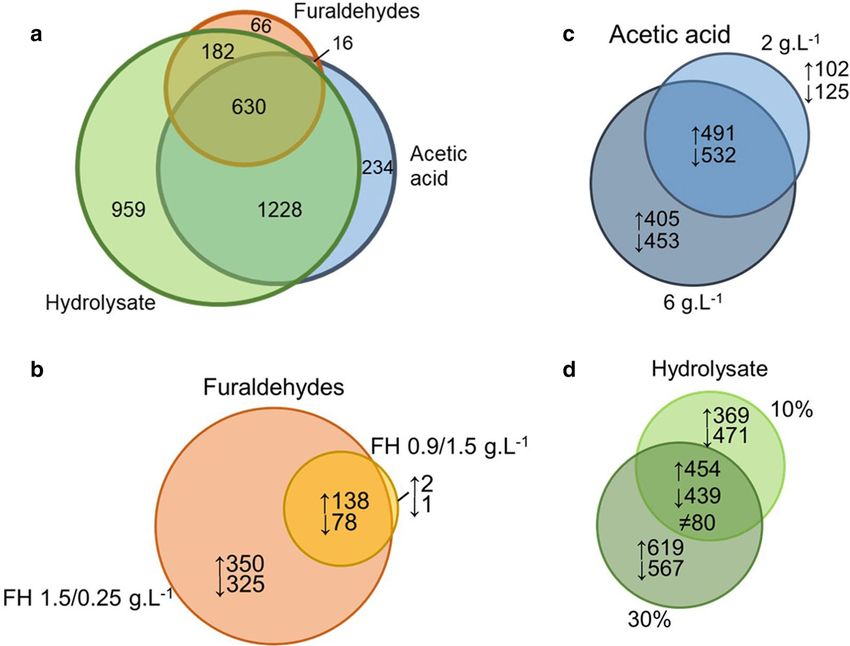
L−1 and 6 g.L−1 of acetic acid, respectively, compared to response of P. pastoris. Out of 5040 genes found, a total
the control (Fig. 1b). However, the final yeast growth in of 3315 were differentially expressed (Fig. 3a). For this
2 g.L−1 of acetic acid was slightly higher than in control analysis, the threshold for statistical significance was
(OD = 22,8 ± 1 compared to 25,3 ± 2). In that case, the considered an adjusted P-value of < 0.05 both for increas-
yeast was able to fully consume all the acetic acid present ing and decreasing expression (Fig. 3a). Most genes were
in the medium. differentially expressed in the presence of more than one
In the presence of furaldehydes, the yeast showed an inhibitor evaluated, with the biggest differences in pat-
extended lag phase, with its final growth reduced in in tern found between furaldehydes and acetic acid than
approximately 14% when compared to the control con- hydrolysate to the two other conditions. From the total
dition (Fig. 1a). The prolonged lag phase correlated with of DEGs, 234, 66, and 959 genes were exclusively differ-
reduced sugar consumption in both concentrations of entially expressed in the presence of acetic acid, furalde-
furaldehydes (Fig. 1b). Indeed, the yeast consumed only hydes, or hydrolysate, respectively. Moreover, 630 genes
61% and 47% of the available glucose in the first 9 h of are common to all three inhibitors (Fig. 3a). Acetic acid
fermentation, respectively. induced the differential expression of 2108 (64%) genes,
The hydrolysate had the most negative impact on the sharing 1228 and 16 of them exclusively with hydro-
yeast metabolism (Fig. 1a). Even at the lowest concen- lysate and furaldehydes, respectively. In the presence
tration of hydrolysate, the yeast showed an extended lag of furaldehydes, the yeast showed the smallest amount
phase and reduced sugar consumption rate when com- of DEGs, summing up to 894 (27%) genes, whereas the
pared to the control. Upon inhibition P. pastoris con- most amount of DEGs was found in hydrolysate condi-
sumed only 57.1% of glucose after 9 h when cultivated in tions with 2999 (90%). Out of all DEGs found, 1194 had
the medium with 10% hydrolysate compared to 97% in no annotation in the reference genome.
the medium without inhibitors (Fig. 1b). However, after The yeast transcriptional response to the inhibitors
30 h of cultivation, the yeast was able to reach similar was observed to be dose dependent. More specifically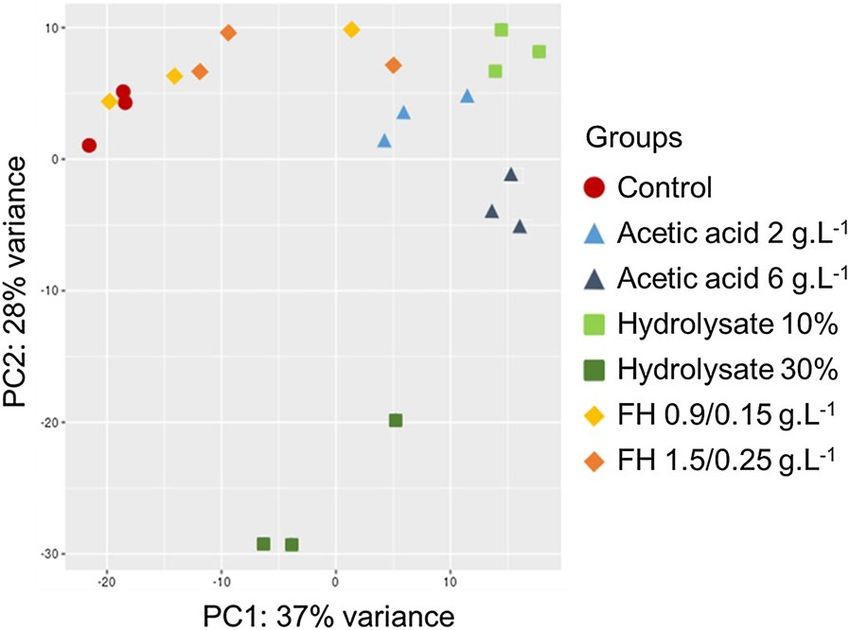
Paes et al. AMB Expr     (2021) 11:2                                                                                                            Page 5 of 15

 Fig. 1 P. pastoris growth profile in the presence of different inhibitors. a growth curves of: acetic acid (2 g.L−1—closed triangle, and 6 g.L−1 open
 triangle), furaldehydes (0.15 g.L−1 HMF, 0.9 g.L−1 furfural—closed diamond and 0.25 g.L−1 HMF, 1.5 g.L−1 furfural—open diamond), and hydrolysate
 (10%—closed square, and hydrolysate 30% open square) against control (closed circle with dotted lines). b substrate consumption and product
 formation in different conditions: control, acetic acid 2 g.L−1, acetic acid 6 g.L−1, FH 0.9/ 0.15 g.L−1, FH 1.5/ 0.25 g.L−1, hydrolysate 10%, hydrolysate
 30%. Biomass (OD600, black circle), glucose (pink diamond), acetic acid (blue square), glycerol (green triangle), ethanol (gray upside-down triangle),
 furfural (yellow star), HMF (orange cross). Timepoint 4* highlights the timepoint where samples were taken. Xylose concentration was constant
 through the cultivation. The experiments were performed in triplicate and the figure represents the profile of one replicate

our results show an increase in the number of DEGs in                           respectively (Fig. 3c). Similar responses were seen for
the higher concentrations of the evaluated inhibitors                           furaldehydes and hydrolysate, where 0.3% (3 genes) and
(Fig. 3b–d). In the presence of acetic acid, the yeast had                      28% of DEG was exclusively for the lower concentration
2108 DEGs, with 11% and 41% of those found exclusively                          of inhibitor and 75% and 40% for the highest concentra-
at either the lowest or highest concentration of the acid,                      tions, respectively (Fig. 3b and d). However, a significant
Paes et al. AMB Expr     (2021) 11:2                                                                                                      Page 6 of 15

                                                                             amount of common DEGs was found in both concentra-
                                                                             tions of inhibitors (Fig. 3). The number of DEGs showed
                                                                             that hydrolysate challenged the yeast the most, inducing
                                                                             the biggest change in gene expression (Fig. 3a). A total
                                                                             of 2999 different genes were either up or down-regu-
                                                                             lated in the presence of hydrolysate (1522 up and 1557
                                                                             down-regulated) in at least one of the two concentrations
                                                                             employed. From 10 to 30%, a total of 80 genes changed
                                                                             their pattern of expression: 30 were from up- to down-
                                                                             regulated and 50 from down- to up-regulated, in the
                                                                             respective concentrations (Fig. 3d). Furaldehydes induced
                                                                             the smallest response in terms of the number of DEGs,
                                                                             summing up to 891, followed by acetic acid, with 2108
                                                                             (Fig. 3).
 Fig. 2 Principal component analysis (PCA) of RNA-seq data of P.
 pastoris cultivated in different inhibitors. Dots represent samples         Central carbon metabolism
 and are colored according to the different conditions investigated:
                                                                             The expression of glycolysis pathway encoding genes was
 red circle: Control—minimal medium without inhibitor, light blue
 triangle: acetic acid 2 g.L−1, dark blue triangle: acetic acid 6 g.L−1,     overall strongly down-regulated in the presence of ace-
 light green square: hydrolysate 10%, dark green square: hydrolysate         tic acid and hydrolysate, with the exception of the genes
 30%, yellow diamond: FH 0.9/ 0.15 g.L−1, and orange diamond: FH             FBA1-2 (fructose 1,6-bisphosphate aldolase) and CDC19
 1.5/ 0.25 g.L−1                                                             (pyruvate kinase) that were overexpressed (Fig. 4). Fural-
                                                                             dehydes did not increase or reduce the expression of

  Fig. 3 Venn diagrams representing P. pastoris differentially expressed genes (DEGs) in response to lignocellulose-derived inhibitors. a three
  inhibitors, no concentration differentiation; b acetic acid 2 g.L−1 and 6 g.L−1; c furaldehydes FH 0.9/ 0.15 g.L−1, and FH 1.5/ 0.25 g.L−1; d
  lignocellulosic hydrolysate 10% and 30%. Numbers account for DEGs that were differentially expressed in at least one of the two concentrations.
  The symbol ≠ stands for the 80 genes in which behavior changes depending on the hydrolysate concentration
Paes et al. AMB Expr (2021) 11:2 Page 7 of 15
most glycolysis encoding genes (Fig. 4). On the other process and transmembrane transport GO term cat-
hand, genes encoding for glycerol metabolism enzymes egory were induced. Among the 5 oxidoreductases with
were all inhibited, with expression levels of GPD1 (glyc- higher increased expression (OYE3-2, QOR2, OYE3-
erol-3-phosphate dehydrogenase) being down-regulated 1, NTL100, and NTL101, log twofold around 3), only
in presence of acetic acid, furaldehydes and hydrolysate. QOR2 was not flavin mononucleotide (FMN)-depend-
The C2 metabolism, i.e. acetic acid and ethanol, that ent (Table 1). Genes ZWF1 (glucose-6-phosphate
integrate into the glycolysis showed a mixed pattern of dehydrogenase) and ALD4 (mitochondrial aldehyde
expression. In general, genes encoding enzymes involved dehydrogenase) reported previously as important for
in the production of acetate and ethanol did not show furaldehydes tolerance, were also found overexpressed
differential expression or were down-regulated, such as in P. pastoris (Table 1).
PDA1 (pyruvate dehydrogenase), ADH2 (alcohol dehy- Most identified GO terms found for lignocellulosic
drogenase), and ALD5 (mitochondrial aldehyde dehy- hydrolysate were down-regulated, being RNA process-
drogenase) (Fig. 4). Contrarily, the ACS1 gene, which ing, regulation of metabolic processes, and transmem-
encodes an acetyl-CoA synthetase that can directly con- brane transport the only up-regulated-related terms
vert acetate to acetyl-CoA, and the tricarboxylic acid (Fig. 5c). A total of 25 DEGs within the transmembrane
cycle (TCA) did not show significant differences in gene transport GO group were up-regulated in both hydro-
expression or were up-regulated. The most up-regulated lysate conditions (Additional file 1: Table S6), with 6
genes from the tricarboxylic acid cycle (TCA) were found genes at least five times up-regulated in at least one of
when the yeast was cultivated in presence of acetic acid, the two concentrations. (Table 1).
what may be related with the consumption of acetic acid To get a better insight of the yeast typical response
seen during the cultivations (Figs. 1 and 4). to the different inhibitors, a heat map was constructed
with the 630 DEGs found for all three inhibitors
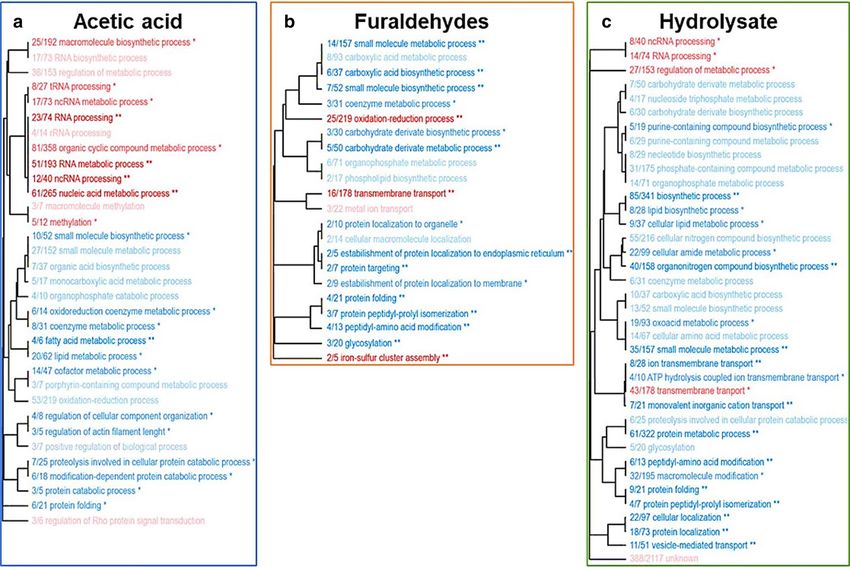
Gene ontology analysis (Fig. 3a) in at least one of the two concentrations evalu-
The enrichment of gene ontology (GO) categories in ated (Fig. 6). The gene expression profiles from the cells
response to acetic acid, furaldehydes, and hydrolysate grown in the presence of 2 g.L−1 and 6 g.L−1 acetic
were evaluated using differentially expressed genes for acid and hydrolysate 10% are more like to each other
each inhibitor. Acetic acid resulted in the up-regulation than to cells grown in hydrolysate 30%. This difference
of DEGs in the GO categories related to nucleic acid is consistent with the physiological (Fig. 1) and PCA
processing, especially RNA, methylation and Rho pro- analysis results (Fig. 2). Additionally, seven distinct
tein signal transduction regulation (Additional file 1: clusters of differentially expressed genes and enriched
Tables S1 and S2), and downregulation of oxi-reduction GO annotations are found in the heat map (Fig. 6).
and macromolecules metabolic processes (Fig. 5a). Cluster 2 and most of 7 involve up-regulated catego-
From the eight genes present in the GO category meth- ries mainly related to regulation of transcription from
ylation (GCD10, GCD14, HSL7, MRM2, PPM1, PPM2, RNA pol II promoter, intracellular signal transduction,
TGS1, PPR1), only GCD10 and MRM2 were not up- and nucleobase-containing compound metabolism.
regulated also in the presence of the other inhibitors Most genes on cluster 7 were up-regulated, but a small
evaluated (Additional file 1: Table S1). All Rho related part, especially in presence of acetic acid 6 g.L−1 was
genes were up-regulated except in the hydrolysate 30% down-regulated. Cluster 4, 5, and 6 include down-reg-
condition (Additional file 1: Table S2). ulated GO categories (except hydrolysate 30%) mostly
In the presence of furaldehydes, the oxi-reduction GO related to transport, especially vesicle-mediated trans-
category was up-regulated (Fig. 5b), as well as the GO port, regulation, initiation of transcription, and tRNA
categories transmembrane transport, metal-ion, and aminoacylation for protein translation. Clusters 1 and 3
iron-sulfur cluster assembly (Additional file 1: Tables showed both up and down-regulated categories, those
S3, S4 and S5). Protein-related processes, biosynthesis related to nucleotides biosynthesis and oxidation–
of small molecules (carboxylic acid), organophosphates, reduction processes.
coenzymes, and phospholipids were expressively down- The 10 genes most up-regulated in each condition, i.e.
regulated (Fig. 5b). Being one of the groups found up- acetic acid, furaldehydes, and hydrolysate, in the two dif-
regulated in furaldehydes, and for its previous extensive ferent concentrations, were identified (Additional file 1:
description in literature as being relevant for tolerance Table S7). From those 60 genes, 26 were present in more
to this group of inhibitors, we sought to investigate oxi- than one condition, usually in the lower and higher con-
dation–reduction processes. We observed that DEGs centration of the same inhibitor. Thus, a total of 34 unique
found in furaldehyde conditions (FH 0.9/ 0.15 g.L−1 genes were identified. Among those genes, 19 (DUR3-
and FH 1.5/ 0.25 g.L-1) related to oxidation–reduction 2, GQ6705065, GQ6702974, RPH1, QOR2, OYE3-2,Paes et al. AMB Expr (2021) 11:2 Page 8 of 15 Fig. 4 Gene expression of central carbon metabolism pathways for P. pastoris. Possible carbon sources are presented in colored squares: glucose; glycerol, ethanol, acetate. Bar charts represent the transcriptional changes (log2 fold) of genes in acetic acid 2 g.L−1 (light blue), 6 g. L−1 (dark blue), FH 0.9/0.15 g.L−1 (yellow), FH 1.5/0.25 g.L−1 (orange), hydrolysate 10% (light green) and 30% (dark green) with P-values < 0.05 or 0.1 (*on top of bar chart). Metabolites: G-6-P glucose 6-phosphate, F-6-P fructose-6-phosphate, F-1,6-P fructose 1,6-phosphate, G-3-P glycerol 3-phosphate, GA-3-P glyceraldehyde 3-phopshate, 1,3-bPG 1,3-bisphosphoglycerate, 3-PG 3-phosphoglycerate, 2-PG 2-phosphoglycerate, PEP phosphoenolpyruvate, PYR pyruvate, DHA(P) dihydroxy acetone (phosphate), OAA oxaloacetate, CIT citrate, ICI isocitrate, AKG alpha-keto glutarate, SUC succinate, SUC-CoA succinyl-Coenzyme A, FUM fumarate, MAL malate, GLYO glyoxylate. Enzymes: HXK1 hexokinase, PGI1 phosphoglucose isomerase, PFK1/2 phosphofructokinase, FBP1 fructose-1,6-bisphosphatase, FBA1-1/1-2 fructose 1,6-bisphosphate aldolase, TPI1 triose phosphate isomerase, TDH3 glyceraldehyde-3-phosphate dehydrogenase, PGK1 3-phosphoglycerate kinase, GPM1/3 phosphoglycerate mutase, ENO1 enolase I, phosphopyruvate hydratase, CDC19 pyruvate kinase, GUT1 glycerolkinase, GUT2 glycerol-3-phosphate dehydrogenase, GPD1 glycerol-3-phosphate dehydrogenase, SNF1 central kinase, PYC2 pyruvate carboxylase, CIT1 citrate synthase, ACO1/2 aconitase, ICL1 isocitrate lyase, DAL7 malate synthase, IDH1/2 isocitrate dehydrogenase, KGD1 alpha-ketoglutarate dehydrogenase complex, KGD2 dihydrolipoyl transsuccinylase, LSC1 succinyl-CoA ligase, SDH1/2/4 succinate dehydrogenase, FUM1 fumarase, MDH1 mitochondrial malate dehydrogenase, MDH3 malate dehydrogenase, MAE1 mitochondrial malic enzyme, PDC1 pyruvate decarboxylase, PDA1 pyruvate dehydrogenase (subunit from PDH complex), ALD2 cytoplasmic aldehyde dehydrogenase, ALD4-1/4-2/5 mitochondrial aldehyde dehydrogenase, ADH2 alcohol dehydrogenase, ACS1/2 acetyl-coA synthetase, PCK1 phosphoenolpyruvate carboxykinase. Genes or conditions with P-values out of the threshold were not depicted
Paes et al. AMB Expr (2021) 11:2 Page 9 of 15
Fig. 5 Representativeness of GO categories for the DEGs of P. pastoris in presence of different inhibitors. The genes with differential expression in
at least one concentration of acetic acid (a), furaldehydes (b), and hydrolysate (c) were used in the analysis. Up and down-regulated categories are
shown in red and blue, respectively. P-values are equal to: (**) 0.01, (*) 0.05, (no symbol) 0.1. The numbers X/Y represent the number DEGs with that
GO term found in the sample by the total number of genes with that GO term in the genome
NTL100, CAO1, DAL1, GQ6705251, SOA1-6, AMD2, cerevisiae strains have shown sensibility to as few as 1 g.
CAR1, NCS6, PIC2, PST2, SOR1, STP3, and YCT1) were L−1 of furaldehydes (Almeida et al. 2007) and 4,8 g.L−1
up-regulated in all tested conditions (Table 1). acetic acid (Ludovico et al. 2001), others have shown to
be tolerant to concentrations as high as 10 g.L−1 (Strat-
Discussion ford et al. 2013). O. polymorpha, a methylotrophic yeast,
The P. pastoris performance in the presence of acetic showed the capacity to grow and produce xylitol in wheat
acid, furaldehydes, and sugarcane hydrolysate shown straw hydrolysate containing up to 12.24 g.L−1 of acetic
here for the first time demonstrates its relatively high acid and 4.17 g.L−1 of total phenolics (Yamakawa et al.
tolerance to lignocellulose-derived inhibitors, especially 2020). Although direct comparison of the yeasts is not
to acetic acid. Higher concentrations of furaldehydes possible due to the diversity of experimental conditions
(0.25 g.L−1 HMF, 1.5 g.L−1 furfural) or acetic acid 6 g.L−1 employed, the results reported here demonstrated that P.
hampered but did not impair P. pastoris growth. The total pastoris can withstand lignocellulose-derived inhibitors
inhibition of yeast metabolism was only observed in the even when inoculated at low cell density (DO600 5).
presence hydrolysate 30%, which contains 6 g.L−1 of ace- P. pastoris showed a dose-dependent response to acetic
tic acid and FH 1.5/ 0.25 g.L−1 besides other compounds. acid, furaldehydes, and hydrolysate at the physiological
These synergistic effects of lignocellulose-derived inhibi- and transcriptional levels. Increased concentrations of
tors have also been shown for S. cerevisiae and other acetic acid, furaldehydes, and hydrolysate lead to stronger
yeasts (Modig et al. 2002; Liu et al. 2004; Almeida et al. inhibitory effects on yeast metabolism, increasing the
2007; Skerker et al. 2013). Yeast tolerance to the inhibi- time for the yeast to complete sugar consumption and
tors has been shown to be species and strain-specific grow. A similar response has been shown for S. cerevisiae
(Modig et al. 2008; Sitepu et al. 2015). While some S. (Pampulha and Loureiro-Dias 1990; Larsson et al. 1999;Table 1 Selected differentially expressed genes (log twofold) of P. pastoris cultivated in presence of acetic acid, furaldehydes (HMF and furfural) and sugarcane
biomass hydrolysate. In the case of P value > 0.05, the log2fold is not shown
Gene ID Gene Name Description Acetic Acetic FH 0.9/ FH 1.5/ Hydrolysate Hydrolysate Go term associated
acid 2 g. acid 6 g. 0.15 g.L−1 0.25 g.L−1 10% 30%
Paes et al. AMB Expr
L−1 L−1
GQ6703442 OYE3-2* *Conserved NADPH oxidoreductase – – 3.12 3.47 3.30 – Oxidation–reduction process
containing flavin mononucleotide (FMN),
homologous to Oye2p with different
ligand binding and catalytic properties,
(2021) 11:2
has potential roles in oxidative stress
response and programmed cell death
GQ6700918 PPR1 Pyrimidine pathway regulatory protein 1 0.53 1.03 – 0.40 0.82 0.28 Macromolecule methylation, macromolecule
modification, RNA metabolic process,
GQ6703443 OYE3-1* *Conserved NADPH oxidoreductase – – 2.72 3.09 3.12 – Oxidation–reduction process
containing flavin mononucleotide (FMN),
homologous to Oye2p with different
ligand binding and catalytic properties,
has potential roles in oxidative stress
response and programmed cell death
GQ6701720 NTL101* *Putative nitrilotriacetate monooxygenase – – 2.45 2.94 2.20 – Oxidation–reduction process
family FMN-dependent oxidoreductase
GQ6702862 SOR1 *Unique sorbitol dehydrogenase in Pichia 2.26 3.77 – 1.32 3.01 2.36 Oxidation–reduction process
pastoris whose promoter has activity
similar to GAP promoter using different
carbon sources, expression in S. cerevisiae
is induced in the presence of sorbitol or
xylose
GQ6700554 ALD4 Mitochondrial aldehyde dehydrogenase; – – 1.51 1.32 – – Oxidation–reduction process
required for growth on ethanol and con-
version of acetaldehyde to acetate
GQ6702661 – – 2.74 2.12 0.81 0.91 2.48 2.63 Ion transport, cation transport, transmem-
brane transport, metal ion transport,
localization
GQ6702266 YCT1 High affinity cysteine transporter – 1.35 4.43 4.81 2.87 - Transmembrane transport, localization
GQ6703957 – – 2.36 2.51 – – 1.98 3.04 Transmembrane transport, localization
GQ6702465 VBA1 Vacuolar basic amino acid transporter 1 – 1.59 – – 0.97 2.69 Transmembrane transport, localization
GQ6702095 TPO3 Polyamine transporter 3 2.53 1.81 – – 1.98 2.63 Transmembrane transport, localization
GQ6703034 – – – 2.01 1.22 1.32 1.20 2.56 Transmembrane transport, localization
GQ6703337 *DUR3-2 *Plasma membrane transporter for both – 2.34 1.32 4.92 – 1.14 Transmembrane transport, localization,
urea and polyamines, expression in S. localization,
cerevisiae is highly sensitive to nitrogen
catabolite repression and induced by
allophanate, the last intermediate of the
allantoin degradative pathway
GQ6705065 – *Hypothetical protein not conserved 4.83 3.77 4.66 4.50 1.94 2.34 –
Page 10 of 15Table 1 (continued)
Gene ID Gene Name Description Acetic Acetic FH 0.9/ FH 1.5/ Hydrolysate Hydrolysate Go term associated
acid 2 g. acid 6 g. 0.15 g.L−1 0.25 g.L−1 10% 30%
L−1 L−1
Paes et al. AMB Expr
GQ6702974 – *Hypothetical protein not conserved 2.81 2.71 2.90 3.90 - 1.54 –
GQ6700086 *RPH1 *JmjC domain-containing histone dem- 2.80 2.85 2.84 2.43 0.97 1.15 –
ethylase
GQ6701722 *QOR2 *Putative quinone oxidoreductase – – 2.86 – 2.73 3.22 Oxidation–reduction process,
(2021) 11:2
(NADPH:quinone reductase), similar to
Scheffersomyces stipitis QOR2, and similar-
ity to Zinc-binding dehydrogenases
GQ6701721 *NTL100 *Putative nitrilotriacetate monooxygenase – – 2.52 – 2.69 2.96 Oxidation–reduction process
family FMN-dependent oxidoreductase
GQ6701716 *CAO1 *Copper amine oxidase similar to Schizosac- – 2.90 - 6.17 – – Amine metabolic process, oxidation–reduc-
charomyces pombe CAO1 tion process
GQ6702273 *DAL1 *Allantoinase, expression in S. cerevisiae 2.36 3.73 2.59 2.78 – – Oxidation–reduction process
sensitive to nitrogen catabolite repression
GQ6705251 - *Hypothetical protein conserved (domain: 2.75 3.12 2.81 2.56 – – Regulation of metabolic process, biological
GAL4) regulation
GQ6701500 *SOA1-6 *Putative protein with similarity to allan- – – 2.18 – 2.51 3.08 Transmembrane transport, localization,
toate permease, similar to the allantoate localization,
permease (Dal5p) subfamily of the major
facilitator superfamily
GQ6703338 AMD2 – – 2.65 1.89 4.47 – 1.66 –
GQ6701041 CAR1 – – 2.36 - 3.85 – 1.89 –
GQ6703874 NCS6 – 2.79 2.79 2.80 1.53 – 1.54 –
GQ6704853 PIC2 Mitochondrial phosphate carrier protein 2 2.75 3.38 2.88 2.67 – - –
(Phosphate transport protein 2) (PTP 2) (Pi
carrier isoform 2) (mPic 2)
GQ6702197 PST2 Protoplast secreted protein 2 - - 4.56 1.27 – 0.90 –
GQ6703286 STP3 Zinc finger protein STP3 4.84 3.91 4.40 3.90 – - –
GQ6700345 ZWF1 Glucose-6-phosphate dehydrogenase 0.74 0.67 Single-organism carbohydrate metabolic
(G6PD) process, small molecule metabolic process,
oxidation–reduction process, hexose meta-
bolic process,
*information manually annotated
Page 11 of 15Paes et al. AMB Expr (2021) 11:2 Page 12 of 15
Palmqvist et al. 1999; Liu et al. 2005; Dong et al. 2017).
The conversion of furaldehydes took place within few
hours of cultivation. When the inhibitory effects were
absent, the yeast exited lag phase, and started to consume
sugars and grow (Fig. 1). For all conditions, a positive
correlation was found between the increased concentra-
tion of the inhibitor, the physiological impairment of the
yeast’s growth and the number of DEGs (Figs. 1 and 3).
These results are supported by similar observations for S.
cerevisiae (Dong et al. 2017; Li et al. 2020).
P. pastoris responds to lignocellulose-derived inhibi-
tors by increasing oxidative stress response. Genes
related to methylation up-regulated in presence of acetic
acid were also up-regulated in other conditions but to a
lesser extent (Additional file 1: Table S1). Overexpression
of methyltransferases such as PPR1 has been shown to
improve S. cerevisiae growth and fermentation perfor-
mance in the presence of acetic acid, presumably due to
the reduced intracellular accumulation of reactive oxygen
species (Zhang et al. 2015). Since reactive oxygen species
are also generated in the presence of furaldehydes (Gor-
sich et al. 2006), PPR1 up-regulation in the presence of
such compounds may also be advantageous. Interest-
ingly, in this work, PPR1 was up-regulated in all condi-
tions evaluated, doubling its expression in acetic acid
6 g.L−1. Another up-regulated group was the regulation
Rho protein signal transduction. Rho is a family of pro-
teins which regulation affects numerous cell processes Fig. 6 Hierarchical clustering heat map of the 630 DEGs common
in all categories. Changes in the expression are shown on a color
(Etienne-Manneville and Hall 2002) and is essential for scale, where red represents up-regulation and blue represents
osmotic stress response (Annan et al. 2008) and low pH down-regulation. Each column relates to one inhibitory condition
survival in yeast (Fletcher et al. 2015). However, fur- and each row represents one DEG
ther evaluation of the Rho role in lignocellulose-derived
inhibitor tolerance must be performed.
The increased expression of oxidoreductases seen stress response to HMF and furfural (Fauchon et al. 2002;
when the yeast was cultivated in the presence of furalde- Ask et al. 2013). In fact, glutathione importance in detox-
hydes (Fig. 5) might be associated with the conversion of ification has also been related to the synthesis of sulfur
HMF and furfural to their less toxic forms, as reported amino acids and saving mechanisms in yeast (Fauchon
previously for other yeasts (Horváth et al. 2001; Liu et al. et al. 2002), which may explain the iron-sulfur GO cat-
2004; Petersson et al. 2006; Almeida et al. 2008). Among egory up-regulation in presence of furaldehydes. Thus,
relevant oxidoreductase encoding genes found up-regu- ZWF1, ALD4, OYE3, QOR2, NTL100 YCT1, and PPR1
lated in this work (Table 1), ZWF1 (Gorsich et al. 2006) are potential candidates for improving P. pastoris toler-
and ALD4 (Liu 2011) have been reported previously as ance to the lignocellulose-derived inhibitors.
capable of reducing HMF and furfural toxicity to the cell P. pastoris was able to co-consume glucose and acetic
(Heer et al. 2009; Ma and Liu 2010). Other oxidoreduc- acid (Fig. 1b), which is not observed in most strains of
tases potentially involved in the detoxification of fural- S. cerevisiae (Sousa et al. 2011). This could be correlated
dehydes, but previously not shown, are OYE3, QOR2 with the reduced glucose consumption rate and toxicity
and NTL100 (Table 1). Another gene possibly related to of acetate (Fig. 1b). Acetic acid may lead to the cytosol
furaldehydes tolerance is YCT1 (Table 1), which encodes acidification by its dissociation in the cytosol, affecting
a cysteine transporter found to be up-regulated in the cell metabolism and survival (Pampulha and Loureiro-
presence of many inhibitors in the yeast Kluyveromy- Dias 1989; Sousa et al. 2011; Rego et al. 2014). The over-
ces marxianus (Wang et al. 2018). Cysteine is related to expression of genes responsible for the consumption and
the synthesis of glutathione, which is an important anti- conversion of acetic acid may be a strategy to reduce its
oxidant molecule related to detoxification and oxidative toxicity. This is corroborated by the transcriptional dataPaes et al. AMB Expr (2021) 11:2 Page 13 of 15
that demonstrated that P. pastoris repressed glycolytic transmembrane transport (GO-Biological Process). Table S7. Compilation
pathway and up-regulated C2/C3 metabolism in presence of top 10 most overexpressed genes in each of the evaluated conditions
of inhibitors, especially in the presence of acetic acid and (GO-Biological Process).
hydrolysate (Fig. 4). These results are further supported
by the recent results of Xu and coworkers (Xu et al. 2019) Acknowledgements
who had recently demonstrated that P. pastoris is capable This work was supported by Embrapa Brazilian Agricultural Research Corpora-
tion (Embrapa) and National Council for Scientific and Technological Develop-
to metabolize acetate in presence of glucose. The experi- ment (CNPq). Barbara Paes received a scholarship from Coordination for The
mental data published by the authors does not explicitly Improvement of Higher Education (CAPES—Brasil).
demonstrate the co-consumption of glucose and acetate
Authors’ contributions
(as reported in here); however, metabolite analyses sug- BGP designed the study, performed the fermentations, RNA extraction, data
gest so. In addition, contrary to P. pastoris, S. cerevisiae analysis, and wrote the manuscript draft. ASS and EFF performed the RNA
shows a Crabtree effect positive metabolism i.e. presents sequence analysis. ISP designed the study and contributed to the project
funding. JRMA designed the study, revised the manuscript, supervised the
a fermentative metabolism even when it is cultivated in project and contributed to the project funding. All authors read and approved
aerobiosis when glucose is present in high concentrations the final manuscript.
in the medium (Crabtree effect). Thus, S. cerevisiae show
Funding
a diauxic shift, where it switches from rapid fermentative This research was funded by the Brazilian Agricultural Research Corporation
growth once the preferred carbon source (glucose) has (Embrapa) and the National Council for Scientific and Technological Develop-
been exhausted to slower exponential growth by aerobic ment (CNPq). Barbara Paes received a scholarship from Coordination for The
Improvement of Higher Education (CAPES—Brasil).
respiration using ethanol/acetate as carbon sources.
In conclusion, our study presents the first physiological Availability of data and materials
and genome-wide transcriptome analysis of P. pastoris The transcriptome datasets generated during the current study are available
in the NCBI with the accession number PRJNA666642.
under the effect of major inhibitors found in the ligno-
cellulosic hydrolysate. The results reveal that acetic acid, Ethics approval and consent to participate
furaldehydes, and sugarcane hydrolysate inhibit the cell Not applicable.
metabolism in a dose-dependent manner, and the yeast Consent for publication
transcriptional response increases with the increased Not applicable.
concentrations of the inhibitors. Acetic acid can be co-
Competing interests
consumed by the yeast as an alternative carbon source, The authors declare that they have no competing interests.
although it affects yeast’s growth. Even though P. pasto-
ris is a well-known and one of the favorite host organ- Author details
1
Laboratory of Genetics and Biotechnology, Embrapa Agroenergia, Parque
isms used as a tool in both academia and industry, little Estação Biológica, PqEB – W3 Norte Final s/no, Brasília, DF 70.770‑901, Brazil.
is known about its response to toxic compounds, and 2
Graduate Program of Molecular Biology, Department of Cell Biology, Institute
especially those present in lignocellulosic hydrolysate. of Biology, University of Brasilia, Brasília, Brazil. 3 Graduate Program of Microbial
Biology, Department of Cell Biology, Institute of Biology, University of Brasilia,
Therefore, the results reported here are useful to expand Brasília, Brazil.
the use of cheap carbon sources (like lignocellulosic
hydrolysate) in bioprocesses employing this yeast. Gene Received: 13 December 2020 Accepted: 16 December 2020
clusters related to the response of P. pastoris to lignocel-
lulose-derived inhibitors are described here for the first
time, and candidate genes to improve yeast tolerance
References
were identified. Adeboye PT, Bettiga M, Aldaeus F, Larsson PT, Olsson L (2015) Catabolism of
coniferyl aldehyde, ferulic acid and p-coumaric acid by Saccharomyces
Supplementary Information cerevisiae yields less toxic products. Microb Cell Fact 14:1–14. https://doi.
org/10.1186/s12934-015-0338-x
The online version contains supplementary material available at https://doi.
Almeida JR, Modig T, Petersson A, Hähn-Hägerdal B, Lidén G, Gorwa-Grauslund
org/10.1186/s13568-020-01170-9.
MF (2007) Increased tolerance and conversion of inhibitors in lignocel-
lulosic hydrolysates by Saccharomyces cerevisiae. J Chem Technol Biotech-
Additional file 1: Table S1. DEGs found in acetic acid containing condi- nol 82:340–349. https://doi.org/10.1002/jctb.1676
tions related to methylation processes (GO-Biological Process). Table S2. Almeida JR, Modig T, Röder A, Lidén G, Gorwa-Grauslund M-F (2008) Pichia
DEGs found in acetic acid containing conditions related to regulation of stipitis xylose reductase helps detoxifying lignocellulosic hydrolysate by
Rho protein signal transduction (GO-Biological Process). Table S3. DEGs reducing 5-hydroxymethyl-furfural (HMF). Biotechnol Biofuels 1:12. https
found in furaldehydes containing conditions related to transmembrane ://doi.org/10.1186/1754-6834-1-12
transpor transport (GO-Biological Process). Table S4. DEGs found in Almeida JRM, Bertilsson M, Gorwa-Grauslund MF, Gorsich S, Lidén G (2009)
furaldehydes containing conditions related to metal-ion transport (GO- Metabolic effects of furaldehydes and impacts on biotechnological pro-
Biological Process). Table S5. DEGs found in furaldehydes containing cesses. Appl Microbiol Biotechnol 82:625–638. https://doi.org/10.1007/
conditions related to iron-sulfur cluster assembly (GO-Biological Process). s00253-009-1875-1
Table S6. DEGs found in hydrolysate containing conditions related to Almeida JRM, Runquist D, Sànchez i Nogué V, Lidén G, Gorwa-Grauslund MF
(2011) Stress-related challenges in pentose fermentation to ethanol byPaes et al. AMB Expr (2021) 11:2 Page 14 of 15
the yeast Saccharomyces cerevisiae. Biotechnol J 6:286–299. https://doi. Horváth IS, Taherzadeh MJ, Niklasson C, Lidén G (2001) Effects of furfural on
org/10.1002/biot.201000301 anaerobic continuous cultivation of Saccharomyces cerevisiae. Biotechnol
Almeida JRM, Rodrigues CM, Justen F, Ramos TGS (2018) Komagataella phaffii Bioeng 75:540–549. https://doi.org/10.1002/bit.10090
recombinante produtora de ácido xilônico e método para a produção de Hou X, Yao S (2012) Improved inhibitor tolerance in xylose-fermenting yeast
ácido xilônico a partir de xilose. IBR Patent INPI - BR102018001359 Spathaspora passalidarum by mutagenesis and protoplast fusion. Appl
Anders S, Pyl PT, Huber W (2015) HTSeq–a Python framework to work with Microbiol Biotechnol 93:2591–2601. https://doi.org/10.1007/s0025
high-throughput sequencing data. Bioinformatics 31:166–169. https:// 3-011-3693-5
doi.org/10.1093/bioinformatics/btu638 Jönsson LJ, Martín C (2016) Pretreatment of lignocellulose: formation of inhibi-
Andrews S, Krueger F, Segonds-Pichon A, Biggins L, Christel K, Wingett S tory by-products and strategies for minimizing their effects. Bioresour
(2012) FastQC: a quality control tool for high throughput sequence data. Technol 199:103–112. https://doi.org/10.1016/j.biortech.2015.10.009
Babraham Institute. Available online at: http://www.bioinformatics.babra Kickenweiz T, Glieder A, Wu JC (2018) Construction of a cellulose-metabolizing
ham.ac.uk/projects/fastqc Komagataella phaffii (Pichia pastoris) by co-expressing glucanases and
Annan RB, Wu C, Waller DD, Whiteway M, Thomas DY (2008) Rho5p is involved β-glucosidase. Appl Microbiol Biotechnol 102:1297–1306. https://doi.
in mediating the osmotic stress response in Saccharomyces cerevisiae, org/10.1007/s00253-017-8656-z
and its activity is regulated via Msi1p and Npr1p by phosphorylation Kim D (2018) Physico-chemical conversion of lignocellulose: Inhibitor effects
and ubiquitination. Eukaryot Cell 7:1441–1449. https://doi.org/10.1128/ and detoxification strategies: a mini review. Molecules. https://doi.
EC.00120-08 org/10.3390/molecules23020309
Anwar Z, Gulfraz M, Irshad M (2014) Agro-industrial lignocellulosic biomass a Larsson S, Palmqvist E, Hahn-Hägerdal B, Tengborg C, Stenberg K, Zacchi G,
key to unlock the future bio-energy: A brief review. J Radiat Res Appl Sci Nilvebrant NO (1999) The generation of fermentation inhibitors during
7:163–173. https://doi.org/10.1016/j.jrras.2014.02.003 dilute acid hydrolysis of softwood. Enzyme Microb Technol 24:151–159.
Ask M, Bettiga M, Mapelli V, Olsson L (2013) The influence of HMF and furfural https://doi.org/10.1016/S0141-0229(98)00101-X
on redox-balance and energy-state of xylose-utilizing Saccharomyces cer- Li P, Sun H, Chen Z, Li Y, Zhu T (2015) Construction of efficient xylose utiliz-
evisiae. Biotechnol Biofuels 6:22. https://doi.org/10.1186/1754-6834-6-22 ing pichia pastoris for industrial enzyme production. Microb Cell Fact
Bolger AM, Lohse M, Usadel B (2014) Trimmomatic: A flexible trimmer for 14:1–10. https://doi.org/10.1186/s12934-015-0206-8
Illumina sequence data. Bioinformatics 30:2114–2120. https://doi. Li J, Zhu K, Zhao H (2020) Transcriptome analysis reveals the protection
org/10.1093/bioinformatics/btu170 mechanism of proanthocyanidins for Saccharomyces cerevisiae during
Brandt BA, Jansen T, Görgens JF, van Zyl WH (2019) Overcoming lignocellu- wine fermentation. Sci Rep 10:1–12. https://doi.org/10.1038/s41598-020-
lose-derived microbial inhibitors: advancing the Saccharomyces cerevisiae 63631-2
resistance toolbox. Biofuels, Bioprod Biorefining 13:1520–1536. https:// Liu ZL (2011) Molecular mechanisms of yeast tolerance and in situ detoxifica-
doi.org/10.1002/bbb.2042 tion of lignocellulose hydrolysates. Appl Microbiol Biotechnol 90:809–
Cottier F, Tan ASM, Chen J, Lum J, Zolezzi F, Poidinger M, Pavelka N (2015) 825. https://doi.org/10.1007/s00253-011-3167-9
The transcriptional stress response of Candida albicans to weak organic Liu ZL, Slininger PJ, Dien BS, Berhow MA, Kurtzman CP, Gorsich SW (2004)
acids . G3 Genes Genomes Genet 5:497–505. https://doi.org/10.1534/ Adaptive response of yeasts to furfural and 5-hydroxymethylfurfural and
g3.114.015941 new chemical evidence for HMF conversion to 2,5-bis-hydroxymethyl-
Delgenes JP, Moletta R, Navarro JM (1996) Effects of lignocellulose degradation furan. J Ind Microbiol Biotechnol 31:345–352. https://doi.org/10.1007/
products on ethanol fermentations of glucose and xylose by Saccharo- s10295-004-0148-3
myces cerevisiae, Zymomonas mobilis, Pichia stipitis, and Candida shehatae. Liu ZL, Slininger PJ, Gorsich SW (2005) Enhanced biotransformation of
Enzyme Microb Technol 19:220–225. https://doi.org/10.1016/0141- furfural and hydroxymethylfurfural by newly developed ethanologenic
0229(95)00237-5 yeast strains. Appl Biochem Biotechnol 121:0451–0460. https://doi.
Dobin A, Davis CA, Schlesinger F, Drenkow J, Zaleski C, Jha S, Batut P, Chaisson org/10.1385/ABAB:121:1-3:0451
M, Gingeras TR (2013) STAR: Ultrafast universal RNA-seq aligner. Bioinfor- Love MI, Huber W, Anders S (2014) Moderated estimation of fold change and
matics 29:15–21. https://doi.org/10.1093/bioinformatics/bts635 dispersion for RNA-seq data with DESeq2. Genome Biol 15:1–21. https://
Dong Y, Hu J, Fan L, Chen Q (2017) RNA-Seq-based transcriptomic and doi.org/10.1186/s13059-014-0550-8
metabolomic analysis reveal stress responses and programmed cell Ludovico P, Sousa MJ, Silva MT, Leão C, Côrte-Real M (2001) Saccharomyces
death induced by acetic acid in Saccharomyces cerevisiae. Sci Rep 7:1–16. cerevisiae commits to a programmed cell death process in response to
https://doi.org/10.1038/srep42659 acetic acid. Microbiology 147:2409–2415. https://doi.org/10.1099/00221
Etienne-Manneville S, Hall A (2002) Rho GTPases in cell biology. Nature 287-147-9-2409
420:629–635. https://doi.org/10.1038/nature01148 Ma M, Liu ZL (2010) Comparative transcriptome profiling analyses during the
Fauchon M, Lagniel G, Aude JC, Lombardia L, Soularue P, Petat C, Marguerie lag phase uncover YAP1, PDR1, PDR3, RPN4, and HSF1 as key regulatory
G, Sentenac A, Werner M, Labarre J (2002) Sulfur sparing in the yeast genes in genomic adaptation to the lignocellulose derived inhibitor
proteome in response to sulfur demand. Mol Cell 9:713–723. https://doi. HMF for Saccharomyces cerevisiae. BMC Genomics 11:12–14. https://doi.
org/10.1016/S1097-2765(02)00500-2 org/10.1186/1471-2164-11-660
Fletcher E, Feizi A, Kim SS, Siewers V, Nielsen J (2015) RNA-seq analysis of Pichia Martín C, Jönsson LJ (2003) Comparison of the resistance of industrial
anomala reveals important mechanisms required for survival at low pH. and laboratory strains of Saccharomyces and Zygosaccharomyces to
Microb Cell Fact 14:1–11. https://doi.org/10.1186/s12934-015-0331-4 lignocellulose-derived fermentation inhibitors. Enzyme Microb Technol
Gasser B, Mattanovich D (2018) A yeast for all seasons—is Pichia pastoris a 32:386–395. https://doi.org/10.1016/S0141-0229(02)00310-1
suitable chassis organism for future bioproduction? FEMS Microbiol Lett Melo NTM, Mulder KCL, Nicola AM, Carvalho LS, Menino GS, Mulinari E, Para-
365:1–4. https://doi.org/10.1093/femsle/fny181 chin NS (2018) Effect of pyruvate decarboxylase knockout on product
Gorsich SW, Dien BS, Nichols NN, Slininger PJ, Liu ZL, Skory CD (2006) Toler- distribution using Pichia pastoris (Komagataella phaffii) engineered for
ance to furfural-induced stress is associated with pentose phosphate lactic acid production. Bioengineering 5:17. https://doi.org/10.3390/
pathway genes ZWF1, GND1, RPE1, and TKL1 in Saccharomyces cerevisiae. bioengineering5010017
Appl Microbiol Biotechnol 71:339–349. https://doi.org/10.1007/s0025 Mira NP, Palma M, Guerreiro JF, Sá-Correia I (2010) Genome-wide identification
3-005-0142-3 of Saccharomyces cerevisiae genes required for tolerance to acetic acid.
Hasunuma T, Kondo A (2012) Development of yeast cell factories for consoli- Microb Cell Fact 9:1–13. https://doi.org/10.1186/1475-2859-9-79
dated bioprocessing of lignocellulose to bioethanol through cell surface Modig T, Lidén G, Taherzadeh MJ (2002) Inhibition effects of furfural on alcohol
engineering. Biotechnol Adv 30:1207–1218. https://doi.org/10.1016/j. dehydrogenase, aldehyde dehydrogenase and pyruvate dehydrogenase.
biotechadv.2011.10.011 Biochem J 363:769–776. https://doi.org/10.1042/0264-6021:3630769
Heer D, Heine D, Sauer U (2009) Resistance of Saccharomyces cerevisiae to high Modig T, Almeida JRM, Gorwa-Grauslund MF, Lidén G (2008) Variability of the
concentrations of furfural is based on NADPH-dependent reduction by response of Saccharomyces cerevisiae strains to lignocellulose hydrolysate.
at least two oxireductases. Appl Environ Microbiol 75:7631–7638. https:// Biotechnol Bioeng 100:423–429. https://doi.org/10.1002/bit.21789
doi.org/10.1128/AEM.01649-09You can also read


