The important roles of surface tension and growth rate in the contribution of new particle formation (NPF) to cloud condensation nuclei (CCN) ...
←
→
Page content transcription
If your browser does not render page correctly, please read the page content below
Atmos. Chem. Phys., 21, 8575–8592, 2021
https://doi.org/10.5194/acp-21-8575-2021
© Author(s) 2021. This work is distributed under
the Creative Commons Attribution 4.0 License.

The important roles of surface tension and growth rate in the
contribution of new particle formation (NPF) to cloud
condensation nuclei (CCN) number concentration:
evidence from field measurements in southern China
Mingfu Cai1,2,3,4 , Baoling Liang3 , Qibin Sun3 , Li Liu4 , Bin Yuan1,2 , Min Shao1,2 , Shan Huang1,2 , Yuwen Peng1,2 ,
Zelong Wang1,2 , Haobo Tan4 , Fei Li4,6 , Hanbin Xu3 , Duohong Chen7 , and Jun Zhao3,5,8
1 Institute for Environmental and Climate Research, Jinan University, Guangzhou, Guangdong 511443, China
2 Guangdong-Hongkong-Macau       Joint Laboratory of Collaborative Innovation for Environmental Quality,
Guangzhou, Guangdong 511443, China
3 School of Atmospheric Sciences, Guangdong Province Key Laboratory for Climate Change and Natural Disaster Studies,

and Institute of Earth Climate and Environment System, Sun Yat-sen University, Zhuhai, Guangdong 519082, China
4 Institute of Tropical and Marine Meteorology and Guangdong Provincial Key Laboratory of Regional Numerical Weather

Prediction, China Meteorological Administration, Guangzhou 510640, China
5 Southern Marine Science and Engineering Guangdong Laboratory (Zhuhai), Zhuhai, Guangdong 519082, China
6 Laboratory of Straits Meteorology, Xiamen, Guangdong 361012, China
7 Guangdong Environmental Monitoring Center, Guangzhou 510308, China
8 Guangdong Provincial Observation and Research Station for Climate Environment and Air Quality Change in the Pearl

River Estuary, Guangzhou, Guangdong 510275, China

Correspondence: Bin Yuan (byuan@jnu.edu.cn) and Jun Zhao (zhaojun23@mail.sysu.edu.cn)

Received: 22 November 2020 – Discussion started: 17 December 2020
Revised: 17 March 2021 – Accepted: 28 March 2021 – Published: 7 June 2021

Abstract. The contribution of new particle formation (NPF)       eral supersaturation (SS) ratios. Two particle properties (hy-
to cloud condensation nuclei (CCN) number concentration          groscopicity and surface tension) affect CCN activation with
(NCCN ) varies largely under different environments and de-      the latter being more important in terms of the CCN con-
pends on several key factors such as formation rate (J ),        centration (NCCN ). A lower value of surface tension (i.e.,
growth rate (GR), distribution of preexisting particles, and     0.06 N m−1 ) than the pure-water assumption (0.073 N m−1 )
properties of new particles during NPF events. This study        could increase the NCCN at SS = 1.0 % by about 20 % dur-
investigates the contribution of NPF to the NCCN and its con-    ing the nonevent period and by about 40 % during the event.
trolling factors based on measurements conducted at the Hes-     In addition, an earlier peak time corresponding to a lower
han supersite, in the Pearl River Delta (PRD) region of China    critical diameter (D50 ) was also observed. The results show
during fall 2019. The size-resolved cloud condensation nu-       that high formation rate, growth rate, and low background
clei activity and size-resolved particle hygroscopicity were     particle concentration lead to high number concentrations of
measured by a cloud condensation nuclei counter (CCNc)           newly formed particles. The high growth rate was found to
and a hygroscopic tandem differential mobility analyzer (HT-     have the most significant impact on the NCCN , which can
DMA), respectively, along with a scanning mobility particle      be attributed to the fact that a higher growth rate can grow
sizer (SMPS) and a diethylene glycol scanning mobility par-      particles to the CCN size in a shorter time before they are
ticle sizer (DEG-SMPS) for particle number size distribution     scavenged by preexisting particles. Two other NPF events
(PNSD). A typical NPF event on 29 October was chosen to          (an event on 18 October in this campaign and an event on
investigate the contribution of the NPF to NCCN under sev-       12 December 2014 in Panyu) were chosen to perform sen-

Published by Copernicus Publications on behalf of the European Geosciences Union.
8576                   Mingfu Cai et al.: The important role of surface tension and growth rate in the CCN contribution

sitivity tests under different scenarios (growth rate, forma-       on the particle surface which could lead to an increase of the
tion rate, and background particle concentration). The calcu-       CCN activity (Ovadnevaite et al., 2017; Cai et al., 2018; Liu
lated NCCN at SS = 1.0 % on 12 December 2014 was sig-               et al., 2018). The contribution of NPF to NCCN is difficult to
nificantly lower than that from the other two events. The           be quantitatively evaluated, and currently the major impact
event on 12 December was re-simulated using the growth              factors are not fully understood, which becomes a challenge
rate taken from the event on 18 October which resulted in           for quantification of the climatic forcing of NPF events.
similar CCN concentrations between the two events (12 De-              NPF events are well known to have an important contribu-
cember and 18 October), implying that the growth rate is the        tion to the NCCN , while a wide range of NCCN during NPF
major impact factor for CCN activation. Our results highlight       events was reported in the literature. Yue et al. (2011) showed
the importance of growth rate and surface tension when eval-        that the NCCN during NPF events was increased by a factor
uating the contribution of NPF to the NCCN .                        of 0.4–6 in Beijing. However, a much smaller (a factor of
                                                                    1.17–1.88) increase of the NCCN was observed during NPF
                                                                    events in Shanghai (Leng et al., 2014). The results from Ma et
                                                                    al. (2016) showed that the NCCN was significantly impacted
1   Introduction                                                    by the hygroscopicity of newly formed particles during NPF
                                                                    events in the North China Plain (NCP). Yu et al. (2014) re-
Atmospheric particles have direct effects on the global cli-        ported an average factor of 4.7 increase of the NCCN during
mate by adsorbing and scattering solar radiation while they         NPF events from growth of new particles to the CCN sizes
can also act as cloud condensation nuclei (CCN) and ex-             in Ozark forest. Rose et al. (2017) showed that NPF could
ert influences on cloud formation, life cycle, and albedo and       be a larger contributor to NCCN compared to transport in free
hence indirectly affect the global radiation balance. In gen-       troposphere. A long-term field measurement in urban Vienna
eral, atmospheric particles have a cooling effect on the global     conducted by Dameto de España et al. (2017) reported that
climate with the highest uncertainty among all the climatic         the NCCN (at 0.5 % SS) could increase up to 143 % during
forcings (Stocker et al., 2013). The relationship between the       NPF events. Kalkavouras er al. (2017) found that the NPF
CCN number concentration (NCCN ) and its climatic effect            could double the NCCN (at 0.1 % SS) but could augment the
represents one of the major uncertainties. It is hence essen-       potential droplet number only by 12 %.
tial to carry out field measurements to investigate the CCN            Factors that control the CCN activity of newly formed
activity and its major impact factor.                               particles (formation rate, growth rate, and particle proper-
   New particle formation (NPF), as an important source of          ties) were investigated worldwide. These parameters varied
global atmospheric particles, is frequently observed in vari-       substantially at large temporal and spatial scales. For exam-
ous atmospheric environments, including forest, urban, ma-          ple, the mean formation rate of 10 nm particles (J10 ) was
rine, and agricultural regions (Kulmala et al., 2004). Once         3.7 cm−3 s−1 in Nanjing (An et al., 2015), which was much
formed, the particles can grow to the CCN sizes (50–100 nm)         higher than that (0.40 cm−3 s−1 ) reported in Shanghai (Leng
within a few hours and contribute significantly to the NCCN         et al., 2014). A value of 3.3–81.4 cm−3 s−1 was reported
(Leng et al., 2014; Spracklen et al., 2008; Dameto de España        for the mean formation rate of 3 nm particles (J3 ) based
et al., 2017). The extent to which newly formed particles can       on 1-year-long measurements in Beijing (Wu et al., 2007).
contribute to the NCCN is controlled by many factors, includ-       In the NCP region, a long-term measurement conducted by
ing formation rate (J ), growth rate (GR), background particle      Shen et al. (2011) reported that the J3 ranged from 0.7 to
number size distribution (PNSD), and properties of the parti-       72.7 cm−3 s−1 , with a mean value of 8.0 cm−3 s−1 . Shen et
cles. The formation rate is defined as a flux of newly formed       al. (2019) reported an average J3 value of 1.30 cm−3 s−1 at
particles at a threshold diameter and is usually used to de-        Mount Tai, which was much lower than urban regions. The
scribe how many particles are produced in the atmosphere            growth of newly formed particles can be characterized by
during an event. The growth rate (GR) represents the diame-         the particle growth rates. Kulmala et al. (2004) summarized
ter change of the particles in a certain time period, and parti-    a wide range of growth rates (1 to 20 nm h−1 ) from more
cles with a higher GR will grow to the CCN sizes in a shorter       than 100 filed measurements of NPF in mid-latitudes. On the
time. The background PNSD controls the scavenging of the            one hand, the growth rates are usually high in polluted re-
newly formed particles, and the high concentration of preex-        gions; for example, a growth rate of 11.6–18.1 nm h−1 was
isting particles will efficiently scavenge these particles before   reported in New Delhi, India (Kulmala et al., 2005; Mönkkö-
they can grow to the CCN sizes. The properties of the parti-        nen et al., 2005). On the other hand, the growth rates are in
cles (e.g., chemical composition, hygroscopicity, and surface       general low in forest regions; for example, a median value
tension) affect their ability to act as CCN. In general, parti-     of 2.5 nm h−1 was reported from long-term measurements
cles containing a higher fraction of inorganic matter or water-     (Nieminen et al., 2014). Furthermore, large uncertainties ex-
soluble organics are more hygroscopic and more easily acti-         ist for the measured growth rates even in the same region. For
vated due to a lower critical diameter (D50 ). Recent studies       example, the growth rates under sulfur-poor conditions were
showed that surfactant effects of organic matter were found         about 80 % higher than those under sulfur-rich conditions in

Atmos. Chem. Phys., 21, 8575–8592, 2021                                              https://doi.org/10.5194/acp-21-8575-2021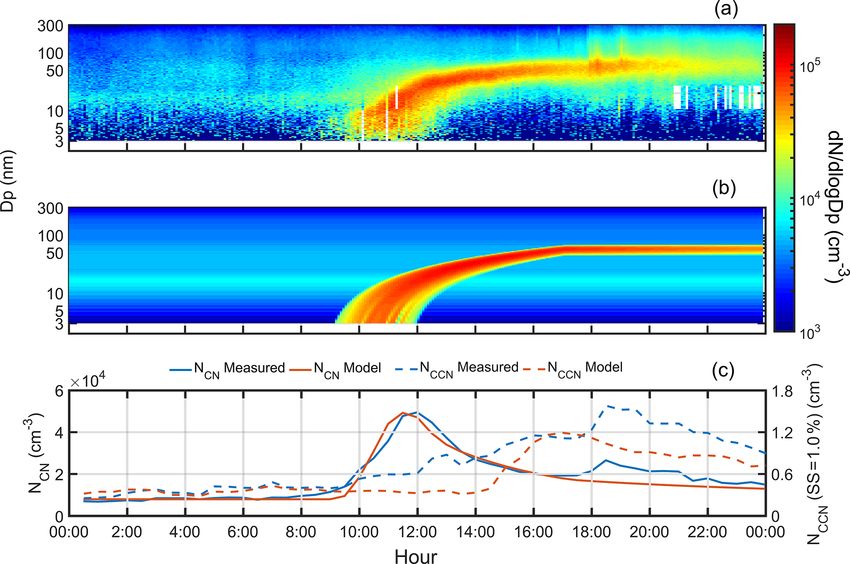
Mingfu Cai et al.: The important role of surface tension and growth rate in the CCN contribution                                8577

Beijing (Yue et al., 2011). The condensable vapors not only           west of the PRD region (about 70 km away from megacity
control the growth rate but also decide the hygroscopicity            Guangzhou) with an altitude of about 40 m a.s.l. (above sea
of newly formed particle, which can vary in a large range             level) and the site is surrounded by several farms and vil-
from event to event. Wu et al. (2013) reported a hygroscopic          lages. All the instruments were placed in an air-conditioned
growth factor of 1.2 to 1.55 during NPF events in a mountain          room (T = 298 K) on the top floor of the building at the
region, Germany. Asmi et al. (2010) found a significant con-          supersite, administrated by Guangdong Provincial Envi-
tribution of organic vapors to particle formation and growth,         ronmental Monitoring Center. Two aerosol sampling ports
leading to a low hygroscopicity of newly formed particles in          equipped, respectively, with a PM10 impactor and a PM2.5
the Antarctica region. The above studies show large tempo-            impactor were made of a 6 m long 3/8 in. o.d. stainless-steel
ral and spatial variations of characteristics in the properties       tube. The schematic diagram of the inlet system and instru-
of newly formed particles (i.e., the formation rate, growth           ment setup is shown in Fig. S1. The sampling air was dried to
rate, and hygroscopicity) during NPF events. However, how             a relative humidity (RH) lower than 30 % by passing through
these parameters contribute to the variation of the NCCN dur-         a Nafion dryer (model MD-700, Perma Pure, Inc., USA) be-
ing NPF events in various regions is yet to be investigated.          fore the air entered into the individual instruments.
   Although the Pearl River Delta region (PRD), one of the
most economically developed areas in China, has made sub-             2.2     Instrumentation
stantial progress in mitigating haze pollution, especially in
achieving PM2.5 national level II standard (an average an-            2.2.1    Particle number size distribution and
nual mass concentration of less than 35 µg m−3 for PM2.5 ),                    size-resolved CCN activity measurements
the intensive human activities and photochemistry lead to
emissions and production of a large amount of condensable             The particle number size distribution (PNSD) in a complete
air pollutants for initiating formation of atmospheric particles      size range of 1 nm–10 µm (an upper cutoff size of 10 µm)
and promoting their subsequent growth. Several studies have           was measured by a diethylene glycol scanning mobility par-
reported the frequent occurrence of NPF events in urban and           ticle sizer (DEG-SMPS, model 3938E77, TSI Inc., USA),
rural areas of the PRD which provide a large amount of par-           a SMPS (model 3938L75, TSI Inc., USA), and an aerody-
ticles to the local atmosphere (Yue et al., 2013, 2016; Liu et        namic particle sizer (APS, model 3321, TSI Inc., USA). The
al., 2008; Wang et al., 2013). However, these studies focused         DEG-SMPS was applied to measure particles with a size
primarily on the characteristics of the NPF events, the con-          range of 1–30 nm, consisting of a nano differential mobility
tribution to the NCCN , and the controlling factors were still        analyzer (nDMA, model 3086, TSI Inc., USA), a nano en-
unknown, hindering an accurate assessment of NPF in CCN               hancer (model 3777, TSI Inc., USA), and a condensation par-
formation and eventually global climate change.                       ticle counter (CPC, model 3772, TSI Inc., USA). The SMPS,
   In this study, we analyzed the contribution of NPF to              which was composed of a DMA (model 3081A, TSI Inc.,
the NCCN based on a rural field campaign conducted at the             USA) and a CPC (model 3775, TSI Inc., USA), was em-
Heshan supersite in the PRD region during fall (October               ployed to measure particles in the size range of 10–800 nm.
and November, 2019). A suite of advanced analytical in-               The APS was used to measure submicron particles ranging
struments was employed to measure particle hygroscopic-               from 0.5 to 10 µm. The data inversion processes for the mea-
ity, size-resolved CCN activity, and particle number size dis-        sured PNSD were done by Aerosol Instrument Manager (ver-
tribution (1 nm–10 µm). Here, we select three representative          sion 10, TSI Inc., USA). However, accurate inversion for par-
NPF events (two from this measurement and the other one               ticles smaller than 3 nm is currently still lacking due to large
from a previous measurement in Panyu; Guangzhou, 2014)                uncertainties from corrections for multiple charges and dif-
to quantitatively investigate the contribution of NPF to the          fusion losses. Thus, we only discussed PNSD for particles
NCCN and impact factors (i.e., formation rate, growth rate,           larger than 3 nm in this study.
background particle concentration, and particle properties)              Size-resolved CCN activity was measured with a combi-
that affect the contribution.                                         nation of a cloud condensation nuclei counter (CCNc, model
                                                                      200, DMT Inc., USA) and another SMPS. The CCNc-200
                                                                      has two parallel cloud columns, which can be used to mea-
2     Measurement site, instrumentation, and                          sure the CCN concentration (NCCN ) simultaneously. The su-
      methodology                                                     persaturation (SS) values were set to be 0.1 %, 0.2 % and
                                                                      0.4 % for the first column and 0.7 %, 0.9 % and 1.0 % for
2.1    Measurement site                                               the second column. The dry particles were firstly neutral-
                                                                      ized by an X-ray neutralizer (model 3088, TSI Inc., USA)
The field campaign was conducted at the Heshan supersite              and were then classified by a DMA (model 3081A, TSI
in the Guangdong Province of China during the fall sea-               Inc., USA). The monodisperse particles were split into three
son (from 27 September to 17 November, 2019). This rural              streams: two to the CCNc for measurement of the NCCN
site (22◦ 420 39.100 N, 112◦ 550 35.900 E) is located at the south-   (with a flow rate of 0.6 L min−1 ) and one to the CPC for

https://doi.org/10.5194/acp-21-8575-2021                                               Atmos. Chem. Phys., 21, 8575–8592, 2021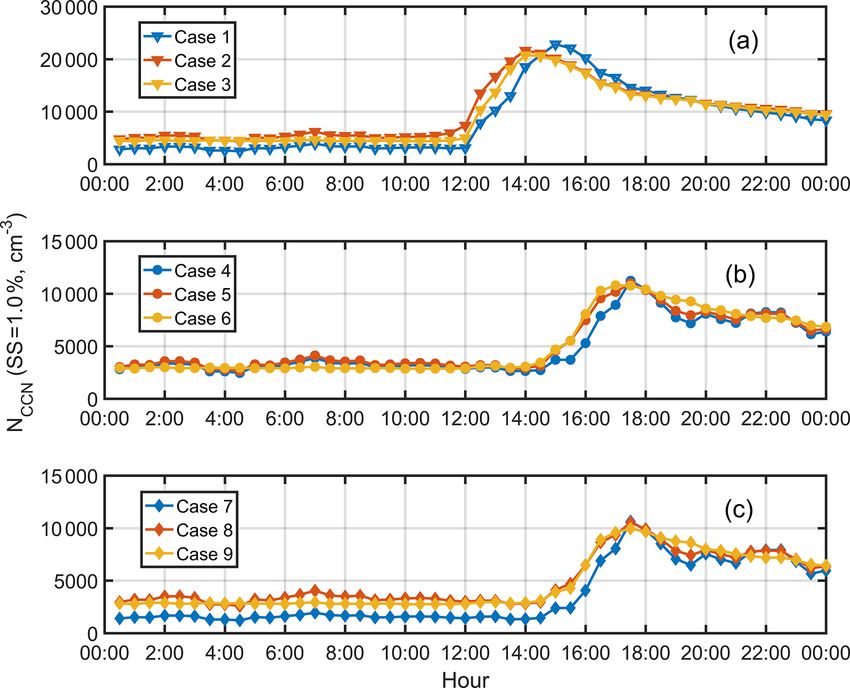
8578                    Mingfu Cai et al.: The important role of surface tension and growth rate in the CCN contribution

measurement of total particle number concentration (NCN ,            The growth factor (GF) of selected particles can be calcu-
with a flow rate of 0.3 L min−1 ). Prior to the campaign, the     lated according to the following equation:
SMPS instruments were calibrated with standard polystyrene
                                                                          Dwet
latex spheres (PSL, with sizes of 20, 50, and 200 nm),            GF =         .                                              (3)
and the CCNc-200 was calibrated with ammonium sulfate                     D0
((NH4 )2 SO4 ) particles at the six SS values (0.1 %, 0.2 %,      In addition to the hygroscopic parameter calculated based on
0.4 %, 0.7 %, 0.9 %, and 1.0 %).                                  the SMPS and CCNc-200 system, κ can also be calculated
                                                                  from HTDMA measurement based on the growth factor:
2.2.2    Aerosol hygroscopicity measurement
                                                                                     1       4σs/a Mw
                                                                  κ = (GF3 − 1)        exp            −1 .                 (4)
Hygroscopicity of atmospheric particle at various size ranges                       RH       RT ρw D0
was measured by a hygroscopic tandem differential mobil-
                                                                  Due to the effect of the DMA diffusing transfer function, the
ity analyzer (HTDMA), consisting of two DMA instruments
                                                                  TDMAfit algorithm (Stolzenburg and McMurry, 2008) was
(model 3081L, TSI Inc., USA), a Nafion humidifier (model
                                                                  applied to narrow the uncertainty and fit the growth factor
MD-700, Perma Pure Inc., USA), a heated tube, and a con-
                                                                  probability density function (GF-PDF). The detailed data in-
densation particle counter (model 3788, TSI Inc., USA). The
                                                                  version process can be found elsewhere in Tan et al. (2013).
dry particles were firstly neutralizer by an X-ray neutralizer
(model 3088, TSI Inc., USA) and subsequently were classi-         2.3.2   Estimation of H2 SO4 concentration and its
fied by a DMA for six sizes in this study (30, 50, 80, 100,               contribution to particle growth
150, and 200 nm). The selected particles at a specific diame-
ter (D0 ) were then introduced into a humidifier under a fixed    The daytime gas-phase H2 SO4 concentration is estimated ac-
RH (90 % in this study). Another DMA and a CPC were used          cording to the proxy proposed by Lu et al. (2019),
to measure the size distribution of humified particles (Dwet ).
                                                                  [H2 SO4 ] = 0.0013 × UVB0.13 × [SO2 ]0.40
2.3     Methodology
                                                                  × CS−0.17 × [O3 ]0.44 + [NOx ]0.41 ,                        (5)
2.3.1    Estimation of hygroscopicity based on the
         measurements                                             where UVB is the ultraviolet radiation B intensity (in
                                                                  W m−2 ), [SO2 ] is the concentration of SO2 in molec. cm−3 ,
The size-resolved activation ratio (AR) could be obtained         [O3 ] is the concentration of O3 in molec. cm−3 , [NOx ] is the
from the measured NCN and NCCN by the SMPS and CCNc-              concentration of NOx in molec. cm−3 , and CS is the conden-
200 system and was inverted based on the method described         sation sink; it can be calculated from following equation:
by Moore et al. (2010). The AR was then fitted with the sig-                   X+∞
moidal function with respect to particle diameter Dp ,            CS = 2π D D =D             βm , N i ,                       (6)
                                                                                   p,i   p, min

NCCN       B                                                      where D is the diffusion coefficient of the H2 SO4 vapor (as-
     =     c ,                                           (1)    sumed to be 0.8 × 10⁻⁵ m2 s−1 in this study), βm,i is the
NCN         D
       1 + D50p                                                   transitional regime correction factor which can be calculated
                                                                  from the Knudsen number (Fuchs and Sutugin, 1971), and
where B, C, and D50 are fitting coefficients. The D50 coef-       Ni represents the particle number concentration at Dpi .
ficient represents the critical diameter at which half of the        This proxy is derived based on measurements from a win-
particles are activated at a specific SS.                         ter field measurement in urban Beijing, where the atmo-
   The hygroscopic parameter κ can be obtained from the           spheric environment is similar to the locations of our mea-
critical supersaturation (Sc ) and D50 (Petters and Kreiden-      surements. A relative error of about 20 % for the proxy pro-
weis, 2007) by                                                    posed by Lu et al. (2019) was estimated based on compari-
                                                                  son of the estimated [H2 SO4 ] with the measured one. How-
           4A3                     4σs/a Mw                       ever, accurate quantification of the uncertainty is not feasible
κ=       3 (lnS )2
                     , where A =                           (2)
      27D50    c                    RT ρw                         since this proxy has not been tested in the PRD region. For
                                                                  simplicity, we adopted a relative error of about 20 % for the
and where σs/a is the surface tension of the solution/air in-     estimation of sulfuric acid concentration and ignored the un-
terface, and here it is temporarily assumed to be that of         certainties in measuring UVB, [SO2 ], CS, [O3 ], and [NOx ].
pure water (0.0728 N m−1 at 298.15 K); Mw is the molecu-          However, further investigation is still needed, since the rel-
lar weight of water (0.018 kg mol−1 ), R is the universal gas     ative error of the estimation could vary temporally and spa-
constant (8.31 J mol−1 K−1 ), T is the thermodynamic tem-         tially (Mikkonen et al., 2011).
perature in kelvin (298.15 K), and ρw is the density of water        Framework for 0-D Atmospheric Modeling (F0AM) v3.1
(about 997.04 kg m−3 at 298.15 K).                                (Wolfe et al., 2016) is a zero-dimensional atmospheric box

Atmos. Chem. Phys., 21, 8575–8592, 2021                                             https://doi.org/10.5194/acp-21-8575-2021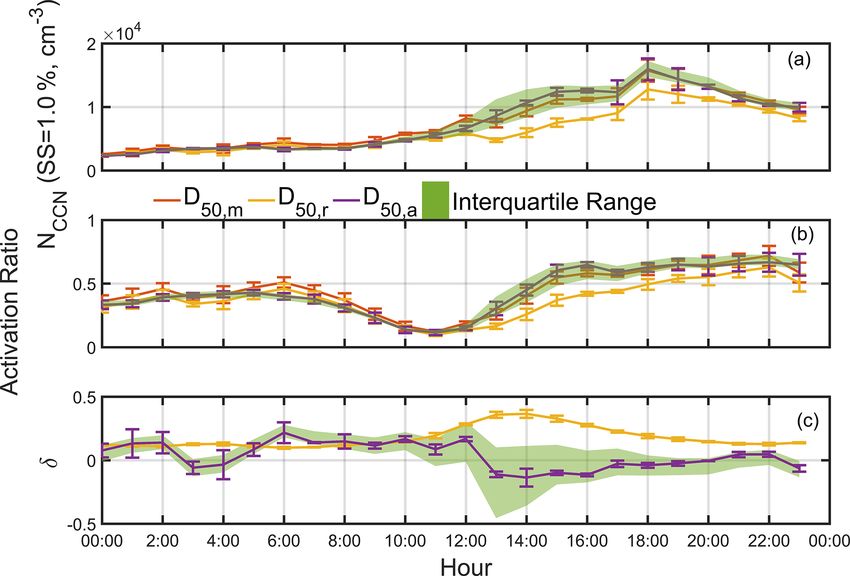
Mingfu Cai et al.: The important role of surface tension and growth rate in the CCN contribution 8579
model which was used to simulate the concentration of where Dp is particle diameter, N is total particle number con-
OH radical in the atmosphere. The model was constrained centration, and Dpgmd is the geometric mean particle diam-
with a set of online-measured trace gases, volatile or- eter that was also used as the representative particle size in
ganic compounds (VOCs), and meteorological data. The em- Eq. (9). In this study, the PNSD was found to have a signifi-
ployed chemical mechanism is Master Chemical Mechanism cant mode in a size range of 3–60 nm during NPF events, and
(MCM) v3.3.1. A more detailed description of model setup we hence applied one lognormal mode fitting. At each time
can be found in Wang et al. (2020). step, the PNSD was fitted using Eq. (10) and the Dpgmd as
The required vapor concentration of H2 SO4 a function of time; that is, the growth rate was determined
(Cv,GR=1 nm h−1 ) for a growth rate of 1 nm h−1 in a cer- according to Eq. (9).
tain particle size range (Dp,initial to Dp,final ) can be calculated The formation rate (Jk ) described the flux through a cer-
from the following equation, tain diameter (k) during NPF events, and it is calculated
r based on the formula given in Cai and Jiang (2017),
2ρv dv π mv
Cv,GR=1 nm h−1 = ×
αm mv 1t 8kT dN[Dpk ,Dpu )
Dp
Xu−1 +∞
X
2x1 + 1 2x0 + 1
x1 (x0 + 1)
Jk = +
× − + 2 ln (7) dt Dp =Dp Dpi =Dpmin
g k
x1 (x1 + 1) x0 (x0 + 1) x0 (x1 + 1)
where ρv , mv , and Dv are the density, mass, and diameter β(i,g) N[Dpi ,Dpi+1 ) N[Dpg ,Dpg+1 )
of H2 SO4 , which were assumed to be 1830 kg m−3 , 98 amu, Dp
u−1
3 +Dp 3 ≤Dp 3
Dpi+1 g+1 u
and 0.55 nm, respectively (Nieminen et al., 2010; Jiang et 1 X X
−
al., 2011); αm is the mass accommodation coefficient (as- 2 Dp =Dp
min Dp 3 =max 3 ,Dp 3 −Dp 3
g
i Dpmin k min
sumed to be unity in this study); x1 and x0 are the ratios
of Dv to Dp,final (10 nm in this study) and to Dp,initial (3 nm β(i,g) N[Dpi ,Dpi+1 ) N[Dpg ,Dpg+1 ) + nu × GRu , (11)
in this study), respectively; 1t (in s) is the time for parti-
d −d where N[Dpk ,Dpu ) is particle number concentration in a size
cle growth from dp,initial to dp,final (1t = p,finalGRp,initial ) with range from Dpk to Dpu (excluding particles with diameter
−1
a growth rate of 1 nm h , and k is the Boltzmann constant Dpu ); Dpk and Dpu are the lower- and upper-bound diam-
(1.38 × 10²³ J K−1 ). eters, respectively (here 3 and 30 nm); β(i,g) is the coagula-
Thus, the growth rate contributed from condensation of tion coefficient for collisions between particles with diame-
H2 SO4 vapor can be obtained: ter Dpi and particles with diameter Dpg ; nu is the particle
[H2 SO4 ] distribution function at Dpu ; and GRu is the growth rate cal-
GRH2 SO4 = . (8)
Cv,GR=1 nm h−1 culated using Eq. (9) at Dpu . Note that the calculation of
formation rate using Eq. (11) is based on two assumptions:
The average calculated H2 SO4 concentration during parti-
(1) dilution and other particles sources and losses except for
cle growth can be calculated using Eq. (5). The resultant
coagulation loss in the size range from Dpk to Dpu are neg-
GRH2 SO4 can be overestimated as the assumption of unity
ligible, and (2) net coagulation of particles is negligible.
for αm in Eq. (7) is not necessarily the case, because not all
H2 SO4 molecules will be captured when colliding with the 2.3.4 Measurement-based NPF simulations
particles.
For a regional NPF event, the evolution of particle size dis-
2.3.3 Estimation of growth rate (GR) and formation tribution is governed by the population balance equations
rate (J ) (Lehtinen et al., 2003; Kuang et al., 2012):
The observed particle growth rate (GR) is defined as the di- dNk ∗ X+∞
ameter change of nucleated particles (dDpnuc ) for a time pe- = Jk ∗ − GR × nk ∗ − Nk ∗ β ∗ N , (12a)
Dpi =Dpmin (k ,i) i
dt
riod (dt),
dDpnuc
GR = . (9) dNk 1 Xk−1
dt = GR × nk−1 − GR × nk +
dt 2 Dpi =Dpmin
Here the lognormal distribution function method was X+∞
adopted, and the PNSD was fitted to obtain the representative β(i,ϕ) Ni Nϕ − Nk Dp =Dp β(k,i) Ni , (12b)
i min
diameter for nucleated particles during NPF events (Kulmala
et al., 2012),
Dpϕ3 = Dpk3 − Dpi3 .
2 Dp (12c)
ln Dp
dN N gmd
=√ exp − , (10) In the equations, class k ∗ represents the smallest detectable
d log Dp 2π σ 2σ
particle size (here 3 nm particles), Jk ∗ is the formation rate
https://doi.org/10.5194/acp-21-8575-2021 Atmos. Chem. Phys., 21, 8575–8592, 2021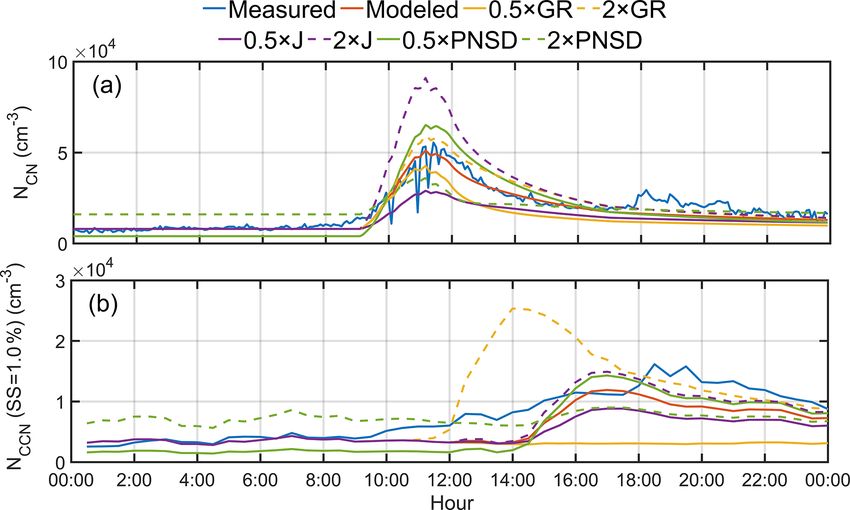
8580 Mingfu Cai et al.: The important role of surface tension and growth rate in the CCN contribution
calculated using Eq. (11). Class k represents the particles was apparently the smallest critical diameter among all the
with diameter Dpk . The first, second, and third terms on the SS values, which was the size that was easily reached dur-
right-hand side (RHS) of Eq. (12a) represent the formation, ing NPF and was significantly affected by the newly formed
condensation, the coagulation sink terms, respectively. The particles; we thus only discussed the variation of the NCCN
first and second terms, the third term, and the fourth term at 1.0 % SS in the following section. The sudden increase
on the RHS of Eq. (12b) represent the condensation growth of NCCN at 18:00 LT could be attributed to change of the air
terms, a coagulation source (CoagSrc) term, and the coagu- mass due to transportation, consistent with the changes of the
lation sink (CoagSnk) term, respectively. PNSD, the NCN , and wind direction (Fig. 1a–c). The activa-
For a specific NPF event, the evolution of PNSD with a tion ratio (AR) was about 0.5 before dawn and dropped to
size range of 3–1000 nm was simulated based on Eq. (12) about 0.2 just prior to the event (Fig. 1b). This ratio con-
using MATLAB (version 2016a, MathWorks, Inc.). In the tinued to decrease to its trough at the time corresponding
simulation, the background particle distribution was assumed to the maximum of NCN and then increased again to about
to be the average PNSD before 06:00 LT; the growth rate 0.6 at 15:00 LT during particle growth slightly higher than
and formation rate were the measured values obtained from the value before dawn. Clearly, NPF can not only add a
Eqs. (9) and (12), respectively; and the time step was set to large number of particles to the atmosphere but also increase
be 10 s. The simulation is based on following assumptions. the NCCN and AR after particles are formed and grow. The
(1) The dynamics of newly formed particles are driven by wind speeds were about 3 m s−1 during initial formation and
coagulation and condensation. The influences of transporta- growth, and decreased to about 1.5 m s−1 during most of the
tion, primary emissions, dilution, and particle evaporation particle growth periods.
are negligible. (2) The influence of coagulation on the pre- Formation of gaseous H2 SO4 was favored by intensive
existing particles is negligible. (3) The particle growth rate photochemistry. Significant JO(1 D) values of (in s−1 ) were
for all particle sizes is assumed to be the same at a time dur- observed during the day (from about 07:00 to 17:00 LT) with
ing NPF events. a maximum value of 2×10⁻⁵ s−1 at noon and symmetri-
cally distributed before and after noon. The average calcu-
lated H2 SO4 concentration during particle formation periods
3 Results and discussion (10:00–12:00 LT) was about 1.4 × 107 cm−3 , about an order
higher than that (about 7–12 × 106 cm−3 ) in a mountain re-
3.1 New particle formation (NPF) events at the Heshan gion in Germany (Wu et al., 2013) and close to that (about
site 2–5 × 107 cm−3 ) in a rural region of Sichuan in China (Chen
et al., 2014). Considering a relative error of about 20 %, the
A total of 20 NPF events were observed during this 7- growth rate contributed by condensation of gaseous H2 SO4
week-long field campaign. Here we selected a typical event was about 0.61–1.09 nm h−1 or about 7.6 %–13.6 % of the
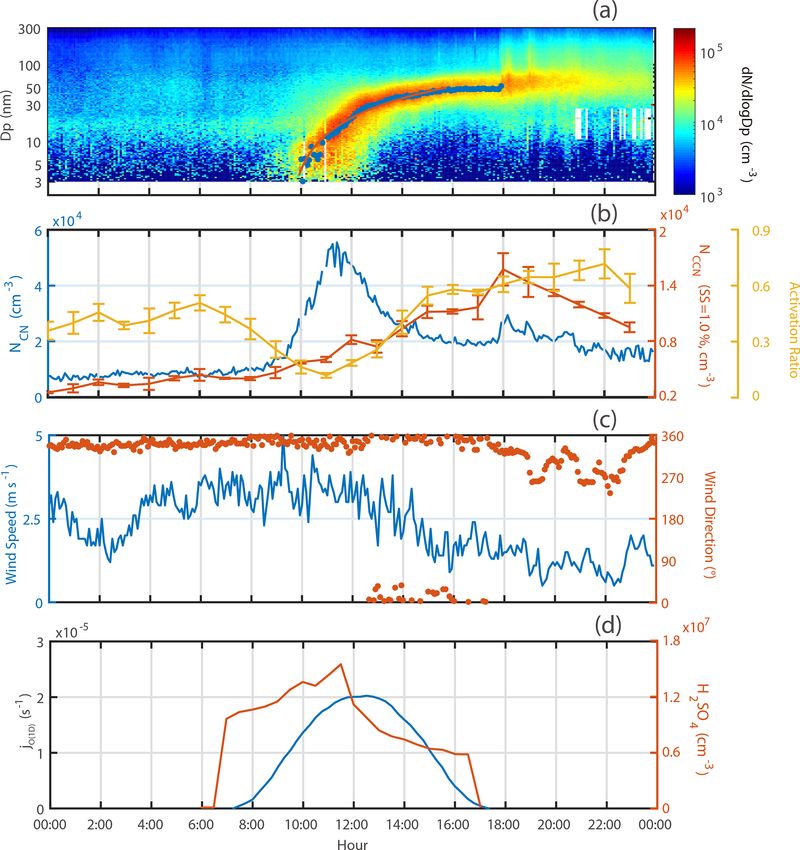
(29 October 2019) for further investigation. As shown in observed growth rates for 3–10 nm particles. It should be
Fig. 1a, new particle formation occurred at about 09:50 LT pointed out that the above estimates for the growth rates are
(local time) when a significant concentration of 3–10 nm par- subject to large uncertainties due to uncertainties for the es-
ticles were observed. Subsequently, continuous and steady timation of sulfuric acid concentration using Eq. (5) as the
growth of the newly formed particles was observed until the proxy, and here unity for sticking coefficients was assumed
particles grew to about 70–80 nm at about 20:00 LT. The when gaseous H2 SO4 molecules collide with preexisting par-
blue dots in Fig. 1a represent the Dpgmd of nucleated par- ticles. This implies that compounds other than H2 SO4 (e.g.,
ticles, and the red line represents the linear fitting, lead- organic vapors) play significant roles in the growth process
ing to an estimated growth rate of 8.0 nm h−1 . Prior to the of newly formed particles, which was widely reported in the
event (around 09:50 LT), the total particle number concen- literature (Boy et al., 2005; Casquero-Vera et al., 2020; Paa-
tration (NCN ) remained low (a concentration slightly be- sonen et al., 2010).
low 10 000 cm−3 ), rapidly increased when NPF event oc-
curred, and then reached its peak (about 56 000 cm−3 ) at 3.2 The impact of hygroscopicity and surfactants on
11:15 LT and subsequently decreased to 20 000 cm−3 at NCCN
about 15:00 LT; it remained at this concentration for the
rest of the day. A steady north wind was observed before The ability that atmospheric particles can serve as CCN is
18:00 LT and shifted to northwest afterwards (Fig. 1c). The determined by several factors including sizes, chemical com-
shift of wind direction led to a change of air mass as seen position, surface tension, and water saturation ratio of the
from the PNSD, leading to a sudden increase of the NCN at particles (Farmer et al., 2015). The organic matter in par-
18:00 LT (Fig. 1a and b). The CCN concentration (NCCN ) ticles can act as surfactants to lower the surface tension of
at 1.0 % SS increased from 5000 cm−3 at around 10:00 LT the particles and hence can increase the CCN activity (Ovad-
to 11 000 cm−3 at about 15:00 LT, when the nucleated parti- nevaite et al., 2017). Previous studies showed that surfactants
cles grew to the CCN size (Fig. S2). The D50 at 1.0 % SS could modify the ability of water uptake, leading to discrep-
Atmos. Chem. Phys., 21, 8575–8592, 2021 https://doi.org/10.5194/acp-21-8575-2021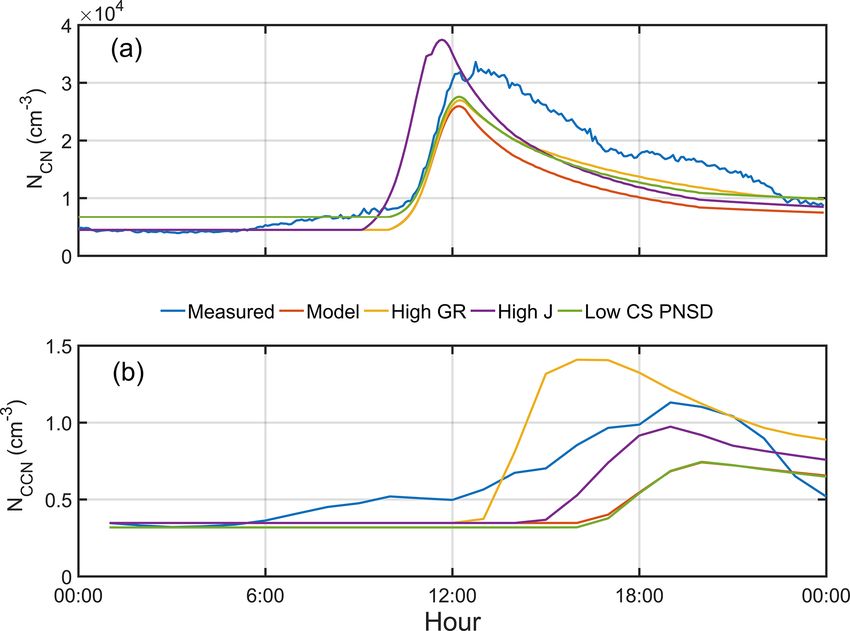
Mingfu Cai et al.: The important role of surface tension and growth rate in the CCN contribution                                 8581

Figure 1. The PNSD (a); NCN , NCCN , and AR (b); wind speed and wind direction (c); jO(1 D) ; and concentration of calculated H2 SO4
(d) during the NPF event on 29 October 2019. The blue dots in (a) represents the geometric mean particle diameter (Dpgmd ), and the red
line represents the linear fit.

ancies in κ values between measurements using techniques              compounds from traffic and industry emissions. The κ val-
under different water saturation conditions, e.g., subsatu-           ues measured using CCNc (κCCN ) fall in a range from 0.19 to
ration (HTDMA measurements) or supersaturation (CCNc                  0.46, which are much higher than those from measurements
measurements) (Cai et al., 2018; Wex et al., 2009; Rastak             using HTDMA in this study. The discrepancy of the κHTDMA
et al., 2017; Ruehl and Wilson, 2014). Figure 2 compares the          and κCCN values suggests that surfactant effects could play
κ values measured from several locations including Heshan             an important role in CCN activation under subsaturation and
(this study, rural), Panyu (urban PRD, Cai et al., 2018), North       supersaturation environments. Previous studies have shown
China Plain (Liu et al., 2011), and South China Sea (Cai et           that the organics in particles could lower surface tension by
al., 2020). The median κ values measured by HTDMA in this             about 0.01–0.032 N m−1 (Ovadnevaite et al., 2017; Liu et al.,
study ranged from 0.1 to 0.18 in a size range of 30–200 nm,           2018; Engelhart et al., 2008; Cai et al., 2018), leading to the
similar to those of particles primarily composed of organics          decrease of the D50 and higher κ values. This effect was
(Deng et al., 2019; Liu et al., 2018; Pajunoja et al., 2015),         closely related to the presence of liquid–liquid phase sepa-
implying that chemical composition of the measured parti-             ration (LLPS) (Renbaum-Wolff et al., 2016), which was ob-
cles was dominated by organics. In particular, the κ values           served in organic-containing particles under high relative hu-
measured using HTDMA (κHTDMA ) in this study were sig-                midity. LLPS is mainly dependent on the chemical composi-
nificantly lower than those from other studies. The κ values          tion of organics (e.g., functional groups and oxidation state)
in a range of 0.21–0.31 were reported for urban PRD and               and inorganic–organic mixing ratio (Ruehl et al., 2016; Ma
suburban North China Plain, which were likely attributed to           et al., 2021; Bertram et al., 2011). Once LLPS occurred, the
high fractions of water-soluble organic matter and inorganic          organic-rich phase on the droplet surface would reduce sur-

https://doi.org/10.5194/acp-21-8575-2021                                               Atmos. Chem. Phys., 21, 8575–8592, 2021
8582                     Mingfu Cai et al.: The important role of surface tension and growth rate in the CCN contribution

Figure 2. Comparison of the median and interquartile κ values obtained from HTDMA and CCN measurements during this campaign
at Heshan, at Panyu (urban Guangzhou), and from South China Sea. The κ was pointed against the corresponding median D50 (CCN
measurement) or selected diameter (HTDMA measurement). Dots represent the median values, and bars represent the interquartile ranges.
The κ values in this measurement were obtained from HTDMA measurement (in black) and CCNc measurement (SS = 0.1 %, 0.2 %, 0.4 %,
0.7 %, 0.9 %, and 1.0 %, in red and yellow for different surface tensions). The yellow lines and dots represent the κ values recalculated based
      ∗ . The κ values at Panyu were obtained from HTDMA measurement (in purple) and CCNc measurement (SS = 0.1 %, 0.2 %, 0.4 %,
on σs/a
and 0.7 %, in green). The κ values from the South China Sea were obtained from CCNc measurement (SS = 0.18 %, 0.34 %, and 0.59 %, in
light blue). The κ values from the North China Plain were obtained from HTDMA measurement.

                                                                                                        ∗ = 0.060 N m−1 ) was adopted
                                                                             A surface tension value (σs/a
                                                                                                                         ∗ ) and κ
                                                                          to calculate both the κCCN (denoted as κCCN σs/a         HTDMA
                                                                                      ∗
                                                                          (κHTDMA σs/a ) using Eqs. (2) and (4), respectively. No signif-
                                                                          icant changes of κ values (i.e., from 0.11 to 0.10 for 30 nm
                                                                          particles) were found from TDMA measurements (Fig. S3),
                                                                          while the κ values from CCNc measurements using this sur-
                                                                          face tension value (σs/a∗ ) were still lower than those using

                                                                          pure-water assumption, and the differences became larger
                                                                          with increasing particle sizes, implying that the surface ten-
                                                                          sion is dependent on particle diameter. It also implies that
                                                                          the κ value was more susceptible to surfactants under su-
                                                                          persaturation condition, which can lower the D50 of the par-
                                                                          ticle for facilitating CCN activation. For particles with the
                                                                          same κ value, the measured D50 (denoted as D50,m ) by fit-
                                                                          ting of NCCN / NCN using Eq. (1) was lower than the calcu-
Figure 3. The variation of Dpgmd (blue dots), D50,m (yellow dots)         lated value based on pure-water surface tension using Eq. (2)
and D50,r (red dots) based on pure-water surface tension.                 due to the surfactant effect. In order to estimate the impact
                                                                          of surfactant on particle activation, the D50 was recalcu-
                                                                          lated using the surface tension of pure water (0.072 N m−1 )
face tension and further enhance water uptake (Rastak et al.,             by Eq. (2) based on the κ value from the CCN measure-
2017; Freedman, 2017). Surface tension is expected to in-                 ments with a surface tension correction (refer to κCCN σs/a  ∗
crease with droplet growth, since the organic-rich phase be-                     ∗               −1
                                                                          and σs/a = 0.060 N m in Fig. 2). We termed the above re-
comes thinner and shifted to the water-rich phase (Liu et al.,            calculated D50 as the D50,r to illustrate the surfactant ef-
2018; Renbaum-Wolff et al., 2016; Ovadnevaite et al., 2017).              fects on the CCN activity during NPF events. Figure 3 shows
Further laboratory and field studies are needed for better un-            the variation of the D50,r (here σs/a = 0.072 N m−1 ) and the
derstanding the occurrence of LLPS in particles, its variation            D50,m , along with the Dpgmd of the nucleated particles dur-
with different chemical composition, and its impact on the                ing the NPF event. The D50,m was lower than the D50,r by
surface tension.                                                          about 10 nm. As a result, the Dpgmd reached the D50,m at
                                                                          about 15:00 LT, about 2 h earlier than it arrived at the D50,r ,

Atmos. Chem. Phys., 21, 8575–8592, 2021                                                      https://doi.org/10.5194/acp-21-8575-2021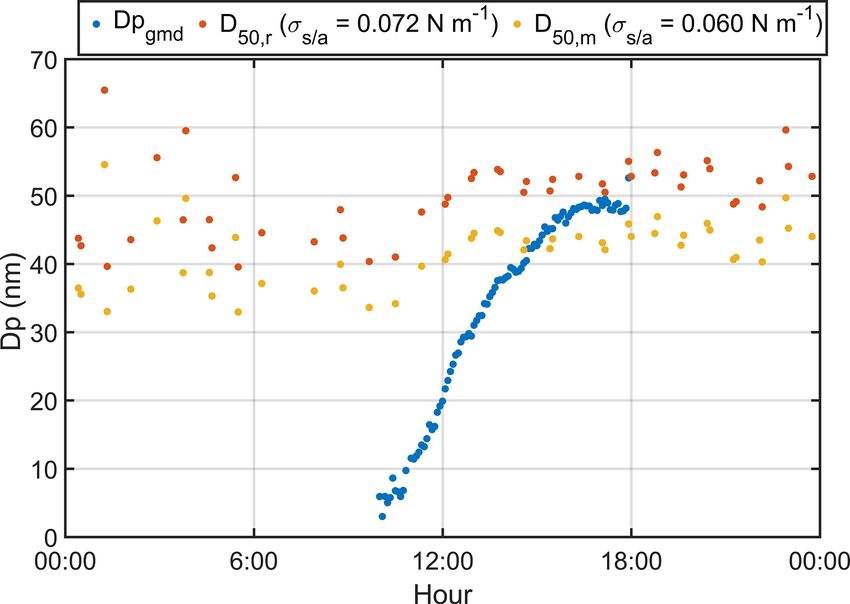
Mingfu Cai et al.: The important role of surface tension and growth rate in the CCN contribution                                  8583

                                                                         until 22:00 LT and subsequently decreased. The AR based on
                                                                         the D50,m reached its minimal during the same period as the
                                                                         AR from the D50,r ; however, it then rapidly increased until
                                                                         16:00 LT, and the continuing increase of the AR was much
                                                                         slower until 22:00 LT and also subsequently decrease for the
                                                                         last hour of the measurement (Fig. 4b). This different trend
                                                                         was likely attributed to the continuing growth of the nucle-
                                                                         ated particles to the CCN size prior to 16:00 LT. Here, we
                                                                         define the deviation of NCCN based on the D50,r from that
                                                                         based on the D50,m to evaluate the impacts of the surface
                                                                         tension (primarily due to the surfactant effects) on the NCCN ,
                                                                                   NCCN,m − NCCN,r(or   a)
                                                                         δNCCN =                             ,                     (14)
                                                                                         NCCN,m
                                                                         where the NCCN,m and NCCN,r represent the NCCN based on
Figure 4. The variation of NCCN (a), activation ratio (b), and δCCN
                                                                         the D50,m and the D50,r or D50,a . The δNCCN of the D50,r was
(c) based on D50,m , D50,r , and the average D50 . The red line repre-
                                                                         about 0.1 prior to the NPF event, reached a peak value of 0.4
sents the measured values. The yellow line represents the values cal-
culated based on the surface tension of pure water (0.072 N m−1 ).       at 14:00 LT, and then decreased steadily to 0.1 at 22:00 LT
The purple line represents the values calculated from the average        and remained unchanged for the last hour of the measure-
D50 . The green region represents the interquartile values calculated    ment (Fig. 4c). The results suggest that the decrease of the
from the interquartile D50 .                                             surface tension due to the surfactant effects could lead to
                                                                         about 10 % increase of the NCCN at 1.0 % SS for nonevent pe-
                                                                         riod and about 40 % increase during the NPF event (Fig. 4c).
which indicates that the surfactant effects could lead to ear-           Apparently, the surfactants have more significant effects on
lier activation of the newly formed particles as CCN. The ear-           NCCN during the NPF event period than during nonevent pe-
lier the Dpgmd reaches the critical diameter D50 , the higher            riod, as the difference between the δNCCN based on the D50,r
the NCCN is, because more particles can survive from be-                 and the D50,a was significant only during the event period
ing scavenged by preexisting particles. The differences in the           (12:00–18:00 LT).
PNSD at the time when the Dpgmd reached D50,m and D50,r                     The hygroscopicity of newly grown particles can have a
are shown in Fig. S2. The peak value of PNSD at 15:00 LT                 significant impact on the NCCN during the NPF event. Dur-
was about 20 000 cm−3 higher than the value at 17:15 LT.                 ing the campaign, the minimum particle size of CCN activ-
The NCCN also shows a difference between D50,r and D50,m                 ity measurement was about 40–45 nm (at 1.0 % SS); thus,
(Fig. 4a).                                                               the hygroscopicity of this size range was used to present
   We also investigate the effect of the surface tension on the          the property of the newly grown particles, when they grow
NCCN at SS = 1.0 % by varying the value of the surface ten-              up to this size range. In general, the κCCN values for 40–
sion. As we mentioned in the beginning of this section, a                45 nm particles were significantly higher (corresponding to
surface tension of 0.060 N m−1 (σs/a∗ ) was adopted when dis-            much higher hygroscopicity) during early event period than
cussing the CCN activation at 1.0 % SS, and we assume that               during nonevent and other event periods (Fig. S4a). Hence,
the D50,r was based on this surface tension value. The av-               we adopted a minimum size range of 40–45 nm particles for
erage D50 (denoted as D50,a ) was the mean of the D50,m .                CCN activity measurements (at about 1.0 % SS) to represent
The NCCN is calculated by integrating particle concentrations            typically growth of newly formed particles to this size range
above D50 using the following equation:                                  during the campaign. It should be pointed out that the high
                                                                         κ values during 10:00–12:00 LT did not represent the hygro-
          Z∞                                                             scopicity of the newly grown particles which were primarily
NCCN =         ni d log Dpi ,                                    (13)    composed of particles much smaller than 30–40 nm. Those
         D50                                                             new particles grew to about 40–50 nm at 14:00–16:00 LT
                                                                         (Figs. 1a and 3), and their κ values were obviously lower
where ni is the particle distribution function at Dpi . The              than the average ones, implying that the organic vapors could
D50 can be the measured or recalculated one. It was shown                play an important role during growth of new particles as dis-
that the NCCN at SS = 1.0 % from integration of particles                cussed in Sect. 3.1. The decrease of hygroscopicity due to
above D50,r was significantly lower than that above D50,m                condensation of organic vapors can lead to an increase of
after 12:00 LT (2 h after the occurrence of the NPF event),              about 3–4 nm for the D50 , which is much smaller than the in-
with concentration differences of about 3000–4000 cm−3                   crease of about 10 nm induced by the surfactant effect which
(Fig. 4a). The AR based on the D50,r reached its minimal val-            reduces the surface tension as discussed before. The results
ues between 10:00 and 12:00 LT and then steadily increased               indicate that the surfactant effect may play a more important

https://doi.org/10.5194/acp-21-8575-2021                                                  Atmos. Chem. Phys., 21, 8575–8592, 2021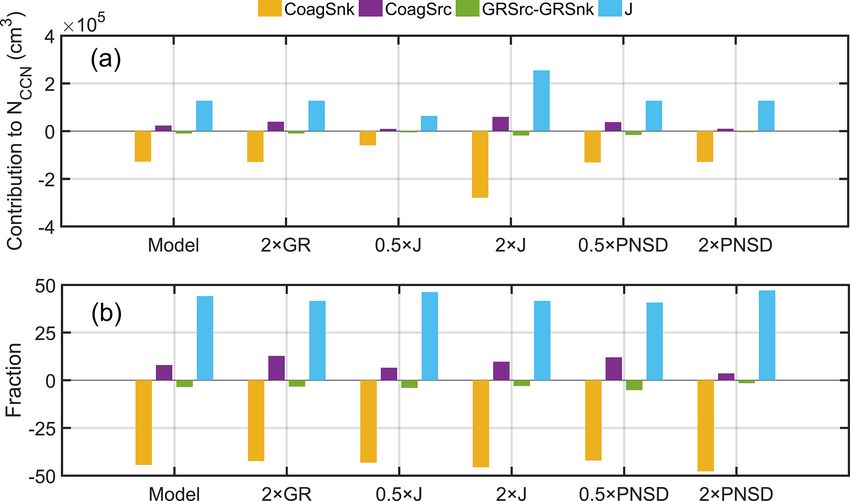
8584                   Mingfu Cai et al.: The important role of surface tension and growth rate in the CCN contribution

role than hygroscopicity in the NCCN , because the surfactant      more new particles in the simulation. Doubling of the GR re-
effect can largely decrease the D50 during the NPF event           sulted in a higher concentration of particles, probably due to
when the number concentration of particles is dominant by          the significant increases of the coagulation source (Fig. S5b),
Aitken mode.                                                       while small decreases for both of the coagulation sink and
                                                                   growth term were found (Figs. S5a and S5d). Coagulation
3.3    The impact of the dynamic processes on NCCN                 source means that two smaller particles collide with each
                                                                   other and become a larger particle, which can also increase
As discussed in Sect. 2.3.4, the dynamical processes for new       the population of new particles. Since the newly formed par-
particles during nucleation events are governed by the pop-        ticles can grow to larger sizes under a higher GR, the PNSD
ulation balance equation (Eq. 12). Here, we build a MAT-           of new particles would be broader (Fig. S6), which provides
LAB program to model the NPF event using Eq. (12), with            a wider “region” for the coagulation sources, i.e., the “k − 1”
input parameters including background particle distribution,       in Eq. (12b) is higher. Doubling of the FR (J ) resulted in the
growth rate and formation rate. Notice that the simulation         highest modeled NCN (about 90 000 cm−3 ) among all simu-
is based on the aforementioned three assumptions. Figure 5         lated cases; however, the modeled NCCN based on a double J
shows the measured and modeled PNSD, NCN , and NCCN                was only the second highest value (about 15 000 cm−3 ). The
at 1.0 % SS. To be simplified, the background particle dis-        highest modeled NCCN (about 25 000 cm−3 ) was found to
tribution was assumed to be the average particle distribution      double the GR; moreover, it peaked earlier at about 14:00 LT
before 06:00 LT. The modeled PNSD and NCN agree very               (2 h earlier than the other cases). Similarly, the highest mod-
well with the measured ones, except the model fails to repro-      eled AR (about 0.82) was from doubling the GR and an ear-
duce the abrupt change of PNSD and NCN between 18:00 and           lier peak time was also found (Fig. S7). The above results can
22:00 LT. As discussed in Sect. 3.1, this discrepancy was at-      be attributed to the following two possible reasons: (1) dou-
tributed to the change of the air mass by wind direction which     bling of the GR made newly formed particles grow faster
was not considered in the model. However, there are consid-        to the D50 , which facilitated the survival of more particles
erable discrepancies between the modeled and the measured          from coagulation scavenging; (2) the NCN became higher by
NCCN . The measured NCCN at 1.0 % SS increased steadily af-        doubling the GR. If newly formed particles grew slowly, for
ter the occurrence of the NPF event (at around 09:00 LT) due       example, the decrease of the GR to a half value would result
to formation of high concentration particles at a size range of    in growth of most particles to diameters below that of the
10–60 nm until around 19:00 LT and subsequently the NCCN           D50 , leading to the smallest change of the NCCN compared
dropped for the rest of the day. The model NCCN started to         to other cases (Fig. S7). The preexisting background particles
increase at about 14:15 LT and reached its maximum level           can serve as the coagulation sinks for newly formed particles
at about 17:00 LT. The model failed to reproduce the in-           and hence can prevent them from growing to the CCN sizes.
crease of the measured NCCN before 16:00 LT, although the          For example, under the double background PNSD condi-
reasons corresponding to the discrepancy are still unknown.        tion, the NCN reached its peak of about 38 000 cm−3 at about
The modeled peak value of the NCCN at 1.0 % SS was about           11:00 LT and quickly dropped afterward. The newly formed
12 000 cm−3 , which agreed very well with the measured one         particles contributed about 3000 cm−3 to the NCCN or an AR
(11 000 cm−3 ). Again, the model failed to reproduce the in-       of about 0.45 at about 17:30 LT, which is an insignificant
crease of NCCN due to the change of the air mass between           change compared to the value for the nonevent period, im-
18:00 and 22:00 LT.                                                plying that under a high background particle concentration,
   As discussed in Sect. 3.2, the contribution of NCCN was af-     NPF events have a minor contribution to the NCCN . Doubling
fected by the properties of newly grown particles. However,        or halving of the FR resulted, respectively, in contributions of
the characteristics of NPF, including growth rate, formation       about 11 000 and 5000 cm−3 to the NCCN ; however, the mag-
rate, and the background PNSD, also affect NCCN . The ef-          nitude of contribution from variation of the FR was relatively
fects of variation (halving or doubling) of the growth rate,       lower than that from the GR and the background PNSD.
formation rate, and the background PNSD on the NCN and                Figure 7 shows the comparison of the itemized absolute
NCCN were investigated to test the sensitivity of those pa-        and fractional contribution of coagulation sink, coagulation
rameters. Figure 6 shows the comparison of the measured            source, GR, and J to the NCCN for the above several scenar-
NCN and NCCN with their respective modeled values based            ios (model, double GR, half or double J , and half or dou-
on the half or doubling of each tested parameter, respectively.    ble PNSD). Here, the individual contribution was integrated
As can be seen from Fig. 6a, the modeled NCN values based          from the corresponding term in Eq. (12) for all particle sizes
on the double GR, the double formation rate, and the half          from the initial time of the NPF event to the time when the
background PNSD were higher than the corresponding mea-            NCCN reached the peak concentration. As clearly shown in
sured values, respectively, and vice versa. Doubling of the        Fig. 7, the coagulation source term plays a more important
formation rate led to formation of more new particles, and         role in the NCCN (with a fraction of about 13 %) for the dou-
the half background PNSD corresponds to a low coagula-             ble GR case than any other cases. As discussed above, dou-
tion loss with preexisting particles, resulting in production of   bling of FR (J ) and halving of PNSD led to similar NCCN

Atmos. Chem. Phys., 21, 8575–8592, 2021                                              https://doi.org/10.5194/acp-21-8575-2021
Mingfu Cai et al.: The important role of surface tension and growth rate in the CCN contribution 8585 Figure 5. The measured and modeled PNSD (a, b), NCN (c), and NCCN (c). The blue lines in (c) represent the measured values, and the red lines represent the model values. Figure 6. The variation of measured and modeled NCN (a) and NCCN (b) at 1.0 % SS. The simulation was based on standard characteristic (red solid line); halving of GR, formation rate, and background particle distribution (orange, purple, and green solid lines, respectively); and doubling of GR, formation rate, and background particle distribution (orange, purple, and green dashed lines, respectively). peak values (about 15 000 and 13 500 cm−3 , respectively); than the half PNSD case, indicating a more significant co- however, the dynamic processes for the two scenarios were agulation scavenging with preexisting particles. As a result, significantly different. For the double J case, the formation the NCN quickly dropped from its peak value to a concentra- term contributed about 240 000 cm−3 to the NCCN , which tion level similar to the half PNSD case within 1 h (Fig. 6a). was much higher than the half PNSD case, and the CoagSnk Based on the above reasons, the contribution of the newly and CoagSrc terms were much higher (about −260 000 and formed particles to the NCCN was relatively smaller for the 50 000 cm−3 , respectively) than any other cases due to for- double J case than the double GR or half PNSD cases, al- mation of high concentration of newly formed particles. though its coagulation source term and J term were the high- Moreover, under the double J scenario, the fraction of the est among all the cases. CoagSnk term was higher, while the CoagSrc term was lower https://doi.org/10.5194/acp-21-8575-2021 Atmos. Chem. Phys., 21, 8575–8592, 2021
8586 Mingfu Cai et al.: The important role of surface tension and growth rate in the CCN contribution
Figure 7. The number contribution (a) and its fraction (b) of Co-
agSnk term, CoagSrc term, GR term, and formation (J ) term to the
NCCN when it reached its peak value based on different case sce-
narios.
Figure 8. The model NCCN based on different characteristics (dou-
To compare different impacts of the characteristics and bling growth rate and formation rate and halving background parti-
cle distribution) and particle properties. Different colors and mark-
properties of newly formed particles, the NCCN was simu-
ers represent cases 1–9.
lated through varying parameters of different characteristics
(cases 1, 4, and 7) and properties (cases 2, 3, 5, 6, 8, and
9). The input parameters for different cases are shown in son among all the cases, all the modeled PNSDs were based
Table S1. For case 2, 3, 5, 6, 8, and 9 scenarios, the sur- on the measured formation rate (J10 ) due to a lack of mea-
face tension or hygroscopicity was adjusted to match similar surement data for particles below 10 nm in the Panyu cam-
NCCN values based on different NPF characteristics (cases 1, paign. The background particle distributions were assumed
4, and 7). The results show that doubling GR produces the to be the average values before 07:00 LT. In addition, since
most significant impact on the NCCN , and the surface tension no measurement data were available for the CCN activity at
(κ value) was adjusted to 0.030 N m−1 (1.2) to have the same 1.0 % SS during the Panyu campaign, the NCCN for this cam-
impact (Fig. 8a). Obviously, a κ value of 1.2 for hygroscopic- paign was calculated from the average CCN activation curve
ity is much higher than that of many inorganics, e.g., H2 SO4 at 1.0 % SS in the two Heshan events and the PNSD of the
(κ = 0.90; Topping et al., 2005) and NH4 NO3 (0.58; Topping Panyu event using following equation,
et al., 2005). Meanwhile, the surface tension was lower than
the values (0.049–0.060) reported previously (Ovadnevaite et Z∞
al., 2017; Engelhart et al., 2008; Cai et al., 2018). However, NCCN = ARi ni d log Dpi , (1)
doubling GR value (16.0 nm h−1 ) was reasonable and con- Dpi =Dpmin
sistent with previous studies (Mönkkönen et al., 2005; Fou-
cart et al., 2018; O’Dowd et al., 1999), suggesting significant where ARi is the average activation ratio (in Heshan) at Dpi ,
contribution of GR to the growth. For doubling formation and ni is the particle distribution function (in Panyu) at Dpi .
rate and halving PNSD, the modified surface tension and κ In general, the modeled PNSDs agreed well with the mea-
values were minor (Fig. 8b and c). sured ones for the NPF events under investigation (Fig. 9a–f).
The NCN values were excellently predicted during the initial
3.4 Modeling of the impact factors on the NCCN during particle formation period before the maximum values were
NPF events reached (Fig. 9g–i). In particular, the NCN was well pre-
dicted for the study case (the 29 October event) except for
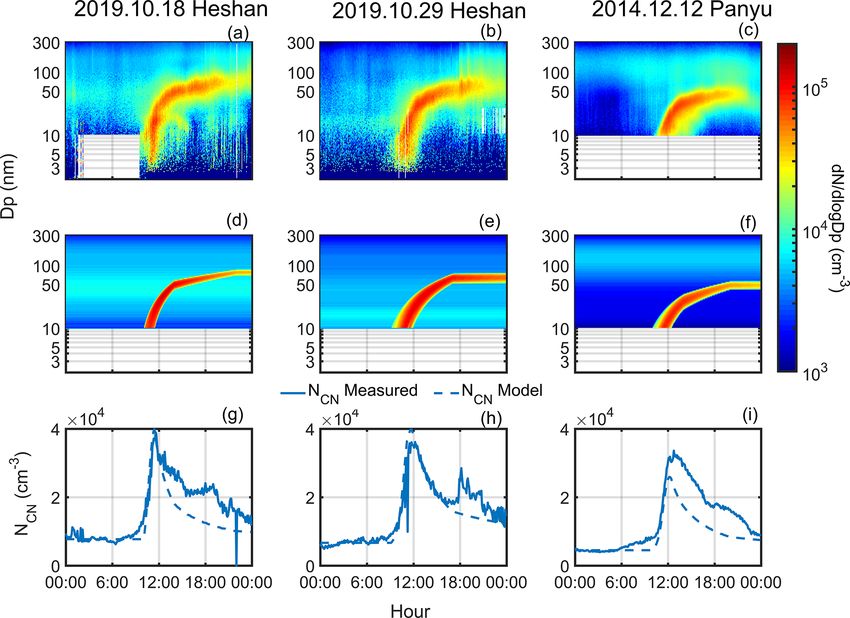
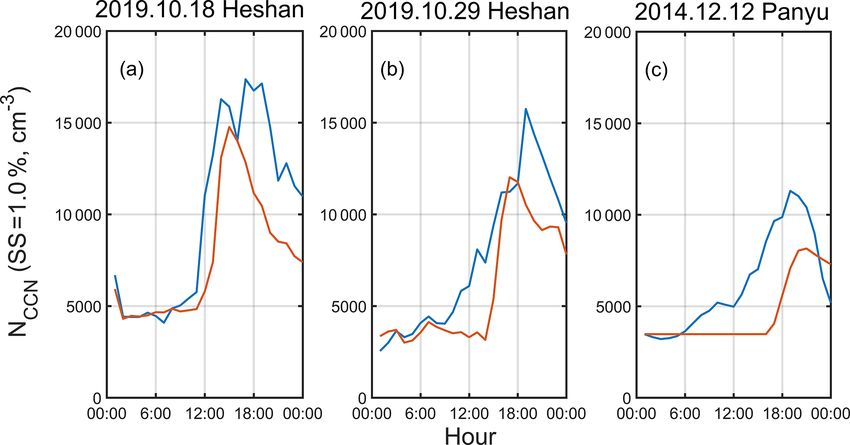
Here we include two more NPF events to investigate the the period when the air mass changed as has been discussed
influence of several important impact factors (growth rate, in the previous section. For the 18 October event, however,
formation rate, and background particles) on the NCCN : one the model underpredicted the NCN shortly after it reached the
from this campaign (18 October 2019) and another from the peak value which can be attributed to significant variation of
field campaign in Panyu (12 December 2014). Both cam- Aitken mode during the event. For example, the model failed
paigns were conducted in the PRD region, details of the field to reproduce concentration trend of 10–60 nm particle at the
campaign in Panyu can be found in Cai et al. (2018). We ap- early event stage (Fig. 10a–b). For the 12 December event,
plied the same model to simulate NPF as discussed in the the model underpredicted a significantly lower peak concen-
previous section. Figure 9 shows the measured (a), modeled tration (about 4100 cm−3 lower) at about 12:00 LT (midday)
PNSD (b), along with the NCN (c). For a better compari- than the measured one, due probably to the presence of a sig-
Atmos. Chem. Phys., 21, 8575–8592, 2021 https://doi.org/10.5194/acp-21-8575-2021Mingfu Cai et al.: The important role of surface tension and growth rate in the CCN contribution 8587 Figure 9. The measured PNSD (a, b, c), modeled PNSD (d, e, f), and measured NCN and modeled NCN (g, h, i) during different NPF events. Solid and dashed lines represent the measured and modeled NCN trends, respectively. nificant amount of larger background particles (100–200 nm) the background PNSD for the 29 October event (mainly dis- which were not taken into account in the model (Figs. 9c and tributed in Aitken mode, denoted as low CS PNSD scenario). 10c). As a result, the NCCN was underpredicted in two He- The results show that all the new modeled NCN value were shan events (Fig. 10a–b), owing to the fluctuation of back- higher than the initial modeled NCN value. The NCN was sig- ground particle distribution and unexplained increase in con- nificantly increased and peaked earlier (with a peak value centration of particles at a size range of 10–60 nm at the be- about 38 000 cm−3 ) under the high formation rate scenario, ginning of the event. While for the Panyu event (the 12 De- while the NCCN was mainly affected and also peaked ear- cember event), a significant underestimate (about 4100 cm−3 lier under the high growth rate scenario. The peak value of lower than the measured NCN ) for the peak concentration NCCN increased from 6000 to 14 000 cm−3 and the peak time was made at about 12:00 LT (midday), due probably to the varied from 20:00 to 16:00 LT. The NCN value increased un- presence of a significant amount of other bigger background der the low CS PNSD scenario; however, the NCCN barely particles (100–200 nm) after 12:00 LT (midday), which was changed, implying that larger size particles in the preexisting not able to be taken into account in the model (Fig. 9c). Thus, background play a more important role in scavenging newly the predicted NCCN value was substantially lower than the formed particles. We hence conclude that the newly formed measured one for the 12 December event (Fig. 10c). This particles with a higher growth rate would grow faster to the also indicates that the NCCN was primarily contributed to CCN size by avoiding higher number concentration losses in from the background preexisting particles rather than newly the atmosphere (Fig. S9a). Our results highlight the impor- formed particles from the NPF event on the 12 December tance of particle growth rate in modulating the NCCN during event case. The maximum modeled peak NCCN value (about NPF events. 7000 cm−3 ) is significantly lower that of the other two events It should be noted that the three NPF events discussed (about 15 000 and 12 000 cm−3 , respectively), which could in this study were generally “Class I” regional NPF events, be attributed to the lower growth rates, formation rate, and for which the growth rate and formation rate could be ob- the high CS value (Fig. S8 for J10 and Table S2 for GR and tained with high confidence (Dal Maso et al., 2005). Other CS). We further simulate the 12 December event to inves- types (i.e., Class II proposed by Dal Maso et al., 2005) were tigate the most important impact factor that influences the not considered since their growth rates and formation rates NCCN using different characteristics from the two other NPF are extremely difficult to be determined, leading to high un- events (Fig. 11), including the growth rate for the 18 Oc- certainties in model simulation of these events. In addition, tober event (high growth rate scenario), the formation rate we did not include the “transport” type of NPF events, for for the 29 October event (high formation rate scenario), and which new particles were formed somewhere else and then https://doi.org/10.5194/acp-21-8575-2021 Atmos. Chem. Phys., 21, 8575–8592, 2021
You can also read


