NATIONAL CEO SURVEY Business Prospects for 2019 - Leadership needed as economy softens January 2019
←
→
Page content transcription
If your browser does not render page correctly, please read the page content below

The Australian Industry Group

                                  NATIONAL CEO SURVEY
                                 Business Prospects for 2019
                              Leadership needed as economy softens

                                                        January 2019

Business prospects

          JANUARY 2019
          The Australian Industry Group
ABOUT Ai GROUP

The Australian Industry Group (Ai Group) is a peak employer association which together with
partner organisations, represents the interests of 60,000 businesses employing more than 1 million
Australians.
Ai Group members are from a broad range of industry sectors including manufacturing;
engineering; construction; food and beverage processing; transport and logistics; information and
technology; telecommunications; labour hire; and defence.
Ai Group is a leading advocate for government policies that are in the best interests of business
and the community.
With more than 250 staff in offices across Australia, we are recognised leaders in policy research
and advocacy in areas such as workplace relations, education and training, energy, trade, taxation
and regulation.
We promote industry development, employment and stronger Australian communities.

www.aigroup.com.au

AUSTRALIAN INDUSTRY GROUP CONTACT

Peter Burn
Head of Influence and Policy
Australian Industry Group
51 Walker Street
North Sydney, NSW 2060
Australia Tel: 02 9466 5566

The Australian Industry Group, 2019
The copyright in this work is owned by the publisher, The Australian Industry Group,
51 Walker Street, North Sydney NSW 2060. All rights reserved.

This work is covered by copyright. No part may be reproduced or copied in any form or by any means (graphic,
electronic or mechanical) without the written permission of Ai Group (except as legally allowed for media purposes,
personal and educational use).

 Australian Industry Group                                                                 CEO Business Prospects 2019
CONTENTS
FOREWORD……………….........................................................................................................................2

KEY FINDINGS……………………………………………………………………………………………………..3

1. Australian Economy and Business Conditions in 2018……………………………………………...…5
     1.1 Australian economy in 2018…………………………………………………………………...……….5

     1.2 Business conditions in 2018…………………………………………………………………………...11

2. Australian Economy and Business Outlook in 2019……………………………………………………15
     2.1 Australian economic outlook in 2019……………………………………….............................…….15

     2.2 Business expectations in 2019………………………………………………………………………...17

3. Opportunities and Challenges for Business in 2019…………………………………………………....23

4. Global Competitiveness of Australia’s Business Environment in 2019……………………………..25
     4.1 Global outlook, challenges and risks in 2019………………………………………………………...25

     4.2 Australian dollar and Australian global competitiveness in 2019…………………………………..28

     4.3 Recent trends in Australian trade………………………………………………………………...……32

     4.4 Australian business expectations for trade in 2019………………………………………………….35

5. Planning and Strategies for Australian Businesses in 2019…………………………………………..37
     5.1 Business investment priorities in Australia…………………………………………………………...38

APPENDIX: CEO Business Prospects Survey 2019 Participants and Questionnaire………………...39

   Australian Industry Group                                                                          CEO Business Prospects 2019          1
LEADERSHIP NEEDED AS
ECONOMY SOFTENS
Ai Group’s 2019 Business Prospects survey reads like a report card comment for a weak student: “Could
do better”. In this election year, the serious challenge for Australia is that to do better we have to lift our
ambitions and not settle for good enough, which currently seems to be the case. We need more decisive
action from Canberra in a range of areas including workplace relations; energy policy and delivering a
better trained and more fit for purpose workforce.

The Business Prospects report finds that Australian Chief Executive Officers (CEOs) expect further growth
in the year ahead, but for the slowing of activity that began late last year to continue in 2019 due to a mix
of local and global factors.

The report identifies key risks for businesses inside Australia including: uncertainties surrounding the
Federal election; concerns over the workings and direction of our workplace relations arrangements; the
threat of rising barriers to global trade; the impacts of the housing market downturn; consumer caution;
high energy prices; and the continuation of drought conditions in many parts of the country.

Expectations for 2019 point to moderate lifts in production, sales and employment and for a modest pick-
up in inflation and wages. The 2019 slowdown is anticipated to see activity drift downwards rather than fall
precipitously.

This outlook is far from inspiring. While a healthy proportion of the anticipated slowing can be attributed to
global factors including heightened trade tensions, geopolitical risks, the slowing of the European recovery
and an easing of industrial activity in China, there are a range of factors that are well within our own control
that are not attracting the policy attention they deserve.

Rather than simply drift with the international tide, Australia should be proactively building on our relative
strengths to lift our economic potential and our domestic living standards. Key policy areas ripe for action
include:

     ➢    developing the skills of the current and future workforce;

     ➢    developing a stable, effective and bipartisan approach to energy policy to secure the investment
          needed to reduce price pressures and uncertainties over supply;

     ➢    removing the administrative obstructions that are preventing the approval of the enterprise
          bargaining agreements that were once the foundation of strong productivity and sustainable
          wages growth;

     ➢    investing in developing the domestic business capabilities needed to build more world-class
          enterprises invested in trade, innovation and high-performance workplaces; and

     ➢    committing to improving the effectiveness, fairness and competitiveness of our national taxation
          arrangements.

Words like modest, soft and flat should be ringing alarm bells for policy makers. The coming election is a
real opportunity for our political leaders to lay out an agenda for the future which focuses on strong growth
and targeted investments that will deliver long-term benefits to our community.

Innes Willox

Chief Executive, Australian Industry Group
    Australian Industry Group                                                       CEO Business Prospects 2019    2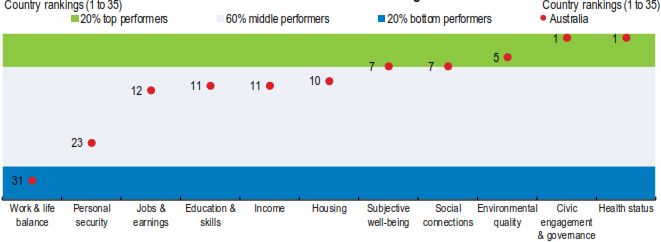
KEY FINDINGS
2018

CEOs viewed 2018 as a year of two distinct halves. The first half of the year saw a welcome acceleration
in business-output, sales, employment and investment in response to improving global and local
conditions. The second half of 2018 saw some of the shine come off as the pace of improvement eased
and as the global and domestic outlook become more uncertain.

Notwithstanding the relative health of the US economy, global growth decelerated over the course of 2018
under the weight of heightened trade tensions, geopolitical risks, the slowing of the European recovery and
an easing of industrial activity in China.

For the year as a whole, Australia’s growth looked relatively resilient and more broad-based than in the
past, with a greater range of locations and industries growing their output and employment in 2018. This
was supported by strong export earnings, high levels of public sector spending and investment (e.g. for
large long-term programs such as the National Disability Insurance Scheme and urban transport
infrastructure expansion and renewal) and relatively robust population growth. As the year wore on
however these positive factors were countered somewhat by ongoing weakness in consumer spending
and business investment, long-term weakness in productivity growth and, more recently, by a shift
downwards in residential property prices and residential and commercial construction activity.

While 2018 was a better year for many Australian businesses, it was not the stellar year for which they had
hoped. One third of CEOs said their general business conditions improved in 2018 versus one quarter who
saw a deterioration, relative to the previous year. For many businesses, higher input costs - and especially
higher energy costs - ate into margins in 2018, detracting from the benefits of the increases in output and
turnover they were able to generate, and reducing their ability to invest. Thus, this year’s annual Ai Group
survey of Australian CEOs indicates that although 57% of CEOs reported an increase in turnover in 2018,
non-mining profits were flat with only 41% of businesses surveyed improving their profit margins and 39%
reporting a fall in margins in 2018.

2019

CEOs expect 2019 to be a touch slower for Australian businesses than was experienced in 2018. This
reflects the very recent deceleration that is evident across local and global indicators in recent months plus
the increasing range of risks on the horizon. This moderation in the outlook is apparent in the economic
forecasts as well as in business leaders’ expectations, plans and strategies.

Heading into 2019, Ai Group’s annual CEO survey reveals fewer business leaders are feeling optimistic
about their general business conditions in 2019 than was the case one year ago. Indeed, on a net balance
basis (optimists minus pessimists), fewer CEOs expect an improvement in business conditions in 2019
than in any year since 2015. This largely reflects their experiences in 2018 and especially the second half
of the year.

In this year’s Ai Group CEO survey of Business Prospects:

    ➢   General business conditions are expected to be better in 2019 for one third of CEOs, which is a
        lower proportion than had expected an improvement for 2018 (42%) but similar to the proportions
        of CEOs who had expected better business conditions for 2017 (33%).

    ➢   One quarter of CEOs expect their business conditions to deteriorate in 2019, which is the highest
        such proportion since 2014 (35% of CEOs surveyed at the end of 2014 had expected worse
        conditions for 2015). On a ‘net balance’ basis (optimists minus pessimists), 7% of CEOs expect
        better conditions in 2019, which is the lowest such net balance number since 2015.

   Australian Industry Group                                                      CEO Business Prospects 2019    3
➢ Business turnover is expected to increase for 58% of businesses in 2019, with 24% expecting no
change from 2018 levels and 18% expecting a decline in sales in 2019. Although the majority of
CEOs expect their total turnover to grow in 2019, most (72%) expect no growth in their export
revenue. This suggests that much of the turnover growth will be sought within Australian domestic
markets rather than offshore in 2019.
➢ Profit margins are expected to grow in 46% of businesses in 2019 and fall in 24% of businesses
(giving a net balance of +22%), suggesting that businesses are less optimistic about profit
margins for 2019 than they were for 2018.
➢ The majority of CEOs expect prices to rise for both their inputs (63% of CEOs) and their outputs
(52% of CEOs). On the selling side, a higher proportion of businesses plan to implement price
rises for their own goods and services in 2019 than in any of the preceding six years. Just 10% of
businesses plan to cut their selling prices in 2019, which is a lower proportion than had planned to
cut prices in the past six years. This suggests a mild pickup in inflation is likely.
➢ On the input costs side, a higher proportion of businesses expect their input costs to rise in 2019
(63%) than in any of the previous six years, but there is also a higher proportion (6%) who expect
their input prices to fall in 2019. This increase in input price volatility adds an additional layer of
uncertainty to business planning that may not have been present previously.
➢ This concern about input price changes relates largely (but not solely) to energy pricing. Over two-
thirds of CEOs (68%) expect their energy input costs to rise further in 2019. This will be on top of
energy price increases reported by 63% of businesses in 2018. Higher energy prices and
reliability of energy supply have become key risks for Australian business across an increasing
range of industries and locations.
➢ Employment (headcount) is expected to increase for 42% of businesses in 2019, with 40%
expecting no change and 18% expecting to reduce their business headcount. On a net balance
basis, employment expectations are lower than for 2018 but are higher than in previous years.
This suggests slower aggregate employment growth is likely in Australia’s private-sector in 2019
than was experienced in 2018 or 2017, but higher than in previous years.
➢ Most CEOs plan to maintain or increase their spending on various types of business investment in
2019. A majority (57%) of CEOs expect to spend more on technology, while 39% also expect to
spend more on staff training, 33% expect to spend more on physical capital (buildings, plant and
equipment) and 23% expect to spend more on R&D. Very few CEOs intend to spend less on
investment in 2019 than they did in 2018, with lower proportions of businesses planning to cut
back on various types of investment in 2019 than in the previous six years. The strong focus on
investing in technology is a long-term trend, with expectations of spending on new technologies
rising at a faster pace than other forms of investment since 2013.
➢ When asked which factors would provide the biggest inhibitors to business in 2019, 31% of CEOs
identified a ‘lack of customer demand’ as their most significant constraint, down from 45% of
CEOs who said the same for 2018 (and down from most previous years, since 2013). Labour
market concerns feature prominently for businesses in 2019. The second most pressing concern
for CEOs is skill shortages, with 21% of businesses nominating this as their top concern. This is
up from 17% of leaders that identified skill shortages as an impediment for 2018 and triple the
proportion in 2017 (7%). A further 7% of CEOs said the flexibility of industrial relations is their top
concern in 2019, up from 4% in 2018.
➢ In response to these challenges, 30% of CEOs plan to concentrate on improving sales of current
products and services to their customers in 2019, down from 34% who ranked this as their top
planning priority in 2018. Around 23% of CEOs will focus on introducing new products to the
market in 2019 down from 40% in 2018 and 33% in 2017. This switch in focus from ‘new’ to
‘existing’ products and services suggests that those who introduced new products and services in
recent years, will now progress from the development phase to focus on consolidating their
markets.
Australian Industry Group CEO Business Prospects 2019 41. Australian Economy and
Business Conditions in 2018
2018 was a year of two distinct halves for the Australian economy. The first half of 2018 saw a mild but
welcome acceleration in activity, employment, business incomes and investment, in response to improving
global and local conditions. In early 2018 commodity prices recovered but the Australian dollar stayed low,
supporting growth in exports; population growth supported residential development and major
infrastructure projects; output increased across all industries except agriculture; and a solid run of
employment growth pushed participation up and unemployment down, including in regional locations and
among older Australians and Australian youth.
Agriculture and other industries in many regional locations however, were adversely affected by protracted
drought conditions through New South Wales and Queensland. Towards the end of 2018 global conditions
decelerated under the weight of heightened trade tensions and geopolitical risk; locally the beginnings of a
downturn in residential property markets spread across east coast metropolitan areas. These trends and
emerging risks during the latter half of 2018 were evident across key data and information sources
including the Australian Bureau of Statistics (ABS) regular economic indicators (gross domestic product,
business investment, employment growth), Ai Group’s monthly business surveys and the Ai Group annual
CEO Business Prospects survey for 2018-19.
1.1 Australian economy in 2018
The Australian economy performed relatively well on many but not all major economic indicators in 2018.
2018 marked 27 years since Australia last experienced a recession (1991), setting a modern record
among OECD countries. Australia’s real GDP grew at around its long-term average in the first half of 2018
(3.1% p.a. to June 2018) but then slowed in the second half, to 2.8% p.a. to September 2018 (Chart 1.1).
On the expenditure (demand) side of the economy, growth in 2018 was mainly driven by net exports,
government spending and government investment. An early boost to demand from the residential
construction boom had faded by mid-year, supplanted by major infrastructure projects. Household
spending was the weak link throughout 2018, constrained by slow income growth and high housing debt.
CHART 1.1 Real GDP growth, annual and quarterly rates since the last recession, 1990 to Q3 2018
Source: ABS, National Accounts, Sep 2018.
Australian Industry Group CEO Business Prospects 2019 5The two-speed nature of 2018 is more evident in the monthly surveys of private-sector business conditions
conducted by Ai Group and the National Australia Bank (NAB). Both data series clearly show business
conditions (reflecting a composite of sales, profitability, forward orders and employment) improving
through 2017 and into early 2018. Both series also show a peak during Q2 of 2018, with decelerating –
but not yet net-negative – conditions through Q3 and Q4 of 2018 (Chart 1.2).
CHART 1.2 Australian business conditions: Ai Group and NAB monthly surveys, to Nov 2018
Sources: Ai Group Australian PMI, Australian PSI and Australian PCI; NAB Monthly Business Survey, to Nov 2018.
All industries except agriculture grew their output in the year to June 2018, but industrial sectors lost
some ground in the second half of the calendar year. Growth was strongest in 2018 in healthcare
(reflecting growth in the National Disability Insurance Scheme and other public-sector programs) and in
services industries linked to real estate and/or large infrastructure projects. Output stumbled in Q3
however, across all of the industrial-related sectors including construction, manufacturing, mining, utilities,
agriculture, transport and telecommunications. Agricultural output was clearly affected by drought in 2018
(down by 1.6% q/q and 7.9% p.a. in Q3), due to reduced grains and other crops (see Chart 1.3).
Some states performed better than others in 2018. Population growth, housing demand and
government infrastructure projects all supported stronger activity in the populous eastern states. New
South Wales and Victoria enjoyed stronger jobs growth and lower unemployment rates than other states
throughout 2018. A recovery in global commodity prices benefited Western Australia and, to a lesser
extent, Queensland.
National income is influenced by more than just output volumes; the terms of trade are also a key factor.
As of September 2018, recovering commodity prices had lifted Australia’s terms of trade by 2.7% p.a. This
helped push up real gross domestic income (GDI) by more than just output alone; real GDI rose by 0.4%
q/q and 3.4% p.a., compared to 0.3% q/q and 2.8% p.a. for real GDP.
Nominal income growth was spread across all categories of income, including employees, financial
corporations (banks, building societies, superannuation funds and related entities), non-financial private
corporations and dwellings owned by individuals in 2018. The share of total income derived from each
type of income remained relatively stable over the year, at 52% for employees, 20% for private-sector
non-financial corporations, 7% for private-sector financial corporations, 10% to small businesses and self-
employed individuals and 8% in rents earned from dwellings owned by individuals.
Australian Industry Group CEO Business Prospects 2019 6That said, income growth is extremely uneven across major industries, with most of the growth in
aggregate company profits accruing to the mining sector. Nominal gross operating profits (GOP) in mining
grew by 27% in the year to Q3 2018, accounting for 64% of all increase in profits and rising to 37% of all
GOP earned in that year. Nominal GOP in the non-mining sectors grew by a modest 1.0% q/q and 6.8%
p.a. in Q3. In contrast, nominal GOP in manufacturing fell by 5.1% q/q to $8.1 billion in Q3 2018, well
below the industry’s high point of $10.1bn it reached just before the GFC in June 2008 (see Chart 1.4).
CHART 1.3 Real output size and growth, by industry, Q3 2018
Source: ABS, National Accounts, Sep 2018.
CHART 1.4 Nominal aggregate company profits in industrial & related sectors, to Q3 2018
Source: ABS, Business Indicators, Sep 2018.
Australian Industry Group CEO Business Prospects 2019 7Productivity growth remained weak and patchy in 2018 and within the current ‘productivity cycle’.
Across all of the industries for which productivity estimates are available, labour productivity fell by 1.3% in
2017-18 and multifactor productivity fell by 0.3%, on a quality-adjusted hours worked basis. Over the latest
(incomplete) productivity cycle since the previous peak in 2011-12, labour productivity growth has
averaged 1.0% p.a. and multifactor productivity has averaged 0.3% p.a. (Chart 1.5).
Reflecting this weakness in recent productivity growth, GDP growth per capita fell by 0.1% in Q3 2018 (to
be up by just 1.2% p.a.) and gross value-added output per hour worked dropped by 0.1%, to be up by just
0.6% over the year to Q3. This failure to generate meaningful productivity growth has weighed on real
incomes over an extended period and continues to do so. It implies a greater reliance on export prices,
population growth and labour participation as drivers of Australia’s output and income growth.
CHART 1.5 Productivity growth, all selected industries*, 1988-89 to 2017-18
* Quality-adjusted hours worked basis, for all industries for which estimates are available. Source: ABS, Estimates of Industry
Multifactor Productivity, Dec 2018.
The labour market tightened somewhat in 2018. Full-time employment has grown for two years, with an
average increase of 21,600 jobs per month (trend). Part-time employment accounted for 31.5% of the
workforce in November 2018, down from a record high in 2016. In trend terms, the national unemployment
rate fell to 5.1% by November 2018, its lowest level since June 2011. Most positively, the youth
unemployment rate (for those aged 15-24 years) fell to 11.4% as of November 2018, from a recent peak of
14.1% in November 2014. This is near the lowest youth unemployment rate since the GFC began in 2008.
The underemployment rate (that is, the proportion of the labour force who are working but willing and
available to work more hours) remains relatively elevated by historical standards at 8.4% in November.
This indicates a greater degree of ‘spare capacity’ in the labour market than is evident from the
unemployment rate alone. This spare capacity continues to weigh on wage growth, albeit more lightly than
in recent years.
Stronger employment growth is attracting more people into the labour market and pushing up the national
participation rate (those that are working or looking for work). As of November, Australia’s participation
rate was at a record high 65.68%, just above the previous record of 65.64% in December 2010 (trend). A
strong rise in female participation has more than offset a long-term fall in male participation. This has
occurred despite the long-term ageing of our population, which more typically sees participation rates
decline.
Australian Industry Group CEO Business Prospects 2019 8Wage growth accelerated in 2018, from record slow rates in 2016 and 2017. The ABS Wage Price Index (WPI) for the September quarter (Q3) of 2018 grew by 0.6% q/q and 2.3% p.a. This was its fastest annual growth rate since Q3 2015. The ABS noted that “September quarter wages growth was mainly influenced by increases to the national minimum wage [3.5% in 2018], regularly scheduled enterprise agreement increases, modern awards and salary reviews timed to coincide with the financial year.” All wage-setting methods contributed to wage growth over the year to Q3 2018, suggesting wage growth has lifted from its slowest point in this cycle after reaching a recent low of 1.9% p.a. in 2016. Public sector wages grew by 0.6% q/q and 2.5% p.a. in Q3 2018 and have been stronger than wage increases in the private-sector since 2014. Private-sector wages excluding bonuses, grew by 0.5% q/q and 2.1% p.a., their fastest annual growth rate since Q2 2015 (Chart 1.6). Private-sector wages including bonuses rose by 2.7% p.a. in Q3, which suggests that more firms are now paying higher bonuses instead of raising base rates. Some businesses might be doing this in order to retain flexibility and reward stronger performances. CHART 1.6 Australian wage growth indicators, 1998 to 2018 Sources: ABS, Wage Price Index, Sep 2018; Fair Work Commission; Department of Jobs and Small Business, Trends in Federal Enterprise Bargaining, June 2018. Inflation remained weak in 2018, with the headline consumer price index (CPI) slowing to 1.9% p.a. in the September quarter of 2018 (Q3), just below the Reserve Bank of Australia’s (RBA) target band of 2 to 3% over the cycle. Underlying inflation was slightly lower, easing to its slowest rate since early 2017, at 1.8% p.a., but up from its lowest point in 2016. This deceleration in 2018 reflected modest price rises for housing-related costs such as utilities, rents, property rates and charges, as well as price falls for out-of- pocket childcare services expenses, communications and household equipment and services. On the upside, weak national inflation means that relatively weak wages growth is still enough to generate (very modest) real income growth. Inflation is not quite so benign however, for all businesses. Input costs are, on average, rising more strongly than output prices for producers of Australian goods and services. Price growth in preliminary (+5.2% p.a.) and intermediate (4.7% p.a.) producer inputs outpaced price growth in producer outputs (+2.1% p.a.) in Q3 of 2018. This ‘growth gap’ between price rises for final products versus preliminary and intermediate inputs indicates that business margins were further compressed in Q3 2018. In response to this mixed picture – and more particularly, in response to the glacial pace of change in prices and wages - the RBA left the cash rate on hold at a record low of 1.50% for all of 2018, where it had been since August 2016 (a record length of time with no movement). Australian Industry Group CEO Business Prospects 2019 9
Despite this mixed scorecard of economic factors, the OECD was strongly positive in its latest assessment
of Australia’s economic, personal and community well-being (Chart 1.7). In December 20181 it concluded:

     “Australia's long span of positive output growth continues, demonstrating the economy's resilience to
     shocks. The labour market has been equally resilient, with rising employment and labour-force
     participation. Life is good, with high levels of well being, including health, and education.

     … During the global financial crisis, comparatively limited exposure, but also good economic
     management, saw output growth hold up well. Also, the economy's adjustment in the wake of the
     commodity super-cycle has been reasonably smooth. This good macroeconomic performance has
     strengthened the country's standing in terms of GDP per capita.

     …scores are favourable on many other indicators of well-being. Australia scores particularly well in
     health status, ranking first among OECD countries with life expectancy of 82.5 years compared with an
     OECD average of 80.1 years and a high score in self-reported health. It also scores well in terms of air
     pollution, ranking 5th in the OECD, subjective well being and social connections (both 7th place in the
     rankings). Immigration has played a fundamental role in the demographic, economic and cultural
     development of Australia, and continues to do so with broadly successful integration.”

CHART 1.7 Australia’s ranking on OECD indicators of national well-being, 2018

Source: OECD 2018, OECD Economic Surveys: Australia. December 2018.

 1
     Organisation for Economic Cooperation and Development, OECD Economic Surveys, Australia, December 2018, pp 9-14.
     Australian Industry Group                                                              CEO Business Prospects 2019   10
1.2 Business conditions in 2018 In line with improving local economic conditions in 2018, Australian CEOs participating in this year’s Ai Group survey reported a broadly positive year. In 2018, a greater proportion of Australian CEOs reported improved performance and higher spending on investment (see Chart 1.8). More than half of respondents noted higher turnover in 2018 (57%) but only 41% of respondents reported improving profit margins, with almost the same amount reporting falling profit margins (39%). This can be at least partially explained by a high proportion of respondents reporting increased inputs costs, especially for energy. Market prices for gas and electricity increased to record highs in 2017, before easing slightly in 2018. Most businesses commit to energy contracts of more than one year, and market price increases take time to filter through, so many businesses may find themselves negotiating energy contracts that are substantially higher than their previous contract. Rising energy price costs are proving difficult to pass on as price increases to customers and are squeezing margins across a wide range of industries. On the spending side, almost half of respondents increased their spending on new technology in 2018 (47%). In other areas of business investment, most businesses did not alter their spending on staff training, physical capital expenditure or research and development (R&D) in 2018, relative to one year earlier. CHART 1.8 BUSINESS INDICATORS IN 2018: PERFORMANCE, INVESTMENT AND PRICING Conditions in 2018: Business Performance Indicators Looking at the performance indicators over time, 2018 appears to have been good year for more businesses, but not quite as good as in 2017 (see Charts 1.9 and 1.10). The ‘net balance’ of businesses reporting an improvement in turnover was about the same as in 2017 (+34%), but the ‘net balance’ fell across other key indicators in 2018 compared to 2017, including profit margins (+2%), business conditions (+7%), employment (+17%) and labour productivity (+16%). Export revenue was the only indicator to show an improvement (see chapter 4). Regarding employment, 37% of CEOs reported employing more people in 2018 than they had in 2017, but 20% reported falling employment in their businesses, giving a ‘net balance’ of +17%. This ‘net balance’ is slightly below the record high in 2017 of +23%, which also coincided with an Australian record for calendar year employment growth, at 412,000 jobs added nationally. Employment growth averaged 22,900 per month in 2018 (up 2.3% p.a. to November). Although weaker than in 2017 (34,400 per month and up 3.4% p.a. to Dec), 2018 was still a relatively strong year for jobs growth by recent Australian standards. Australian Industry Group CEO Business Prospects 2019 11
Consistent with national productivity performance (as estimated by the ABS and reported in section 1.1
above), labour productivity improved for fewer businesses in 2018 than it had in 2017, with the ‘net
balance’ of labour productivity improvement falling from +26% in 2017 to +16% in 2018 (Chart 1.9).

CHART 1.9 BUSINESS PERFORMANCE INDICATORS, 2012-2018

‘Net balance’ is the proportion of all survey respondents that reported an improvement minus the proportion that reported a deterioration in each
indicator. Aggregate results include respondents from all surveyed industries and are weighted by ABS estimates of output from each industry

CHART 1.10 BUSINESS PERFORMANCE INDICATORS, 2012-2018

‘Net balance’ is the proportion of all survey respondents that reported an improvement minus the proportion that reported a deterioration in each
indicator. Aggregate results include respondents from all surveyed industries and are weighted by ABS estimates of output from each industry

   Australian Industry Group                                                                                    CEO Business Prospects 2019         12
Conditions in 2018: Business Investment Indicators

Ai Group’s annual CEO survey has indicated an upward trend in annual spending on technology, R&D and
physical CAPEX since at least 2012 (see Chart 1.11). A greater proportion of CEOs have reported growth
in spending on technology than other investment options consistently since 2012. Looking back at
previous surveys, it is clear that this focus on investing in technology has increased over time. This
suggests the nature of investment in the Australian economy is changing, with a greater focus on
information technology and a shift towards increased investment in the services industries.

Looking at just 2018 however, the only investment indicator to improve in net terms was spending on
physical CAPEX such as buildings and equipment. Capacity utilisation in Ai Group’s monthly performance
indices across the manufacturing, services and construction sectors were consistently above their long-run
averages in 2018. This suggests that an increasing number of businesses in these sectors have low spare
capacity and need to invest further to meet future growth requirements. Increased spending on physical
CAPEX, such as buildings and equipment, was stronger than originally forecast by the RBA in 2017. Net
spending on R&D was only slightly weaker than in 2017 (+24% in 2017 vs +21% in 2018), however like
previous years, more than two-thirds of businesses indicated they would not change their level of R&D
investment. Spending on staff training has only been included as a question since 2016 but this indicator
appears to have pulled back in 2018 after jumping in 2017.

CHART 1.11 BUSINESS INVESTMENT INDICATORS, 2012-2018

‘Net balance’ is the proportion of all survey respondents that reported an improvement minus the proportion that reported a deterioration in each
indicator. Aggregate results include respondents from all surveyed industries and are weighted by ABS estimates of output from each industry

Conditions in 2018: Business Pricing Indicators
As discussed above, market prices for gas and electricity increased to extraordinary levels in 2017, before
recovering in 2018. These price decreases were not experienced by those participating in the survey, as
businesses commit to energy contracts of more than one year, and market price changes take time to
eventuate. Therefore, many businesses are negotiating new energy contracts at rates far above what they
have paid in the past. Consistent with rising energy costs and increasing costs of some raw materials in
2018, more CEOs reported rising input prices. There was an improvement in selling prices in 2018 with
48% of respondents noting an increase in their selling prices and only 12% noting falling selling prices (net
balance of +36%).

   Australian Industry Group                                                                                    CEO Business Prospects 2019         13
CHART 1.12 BUSINESS PRICING INDICATORS, 2012-2018

‘Net balance’ is the proportion of all survey respondents that reported an improvement minus the proportion that reported a deterioration in each
indicator. Aggregate results include respondents from all surveyed industries and are weighted by ABS estimates of output from each industry

Industry Conditions in 2018

Australian manufacturing CEOs reported a better year in 2018 than in the previous six years. Australian
manufacturing experienced a strong year despite high energy prices and growing skills shortages. For the
second year in the survey’s history, more manufacturing CEOs reported that business conditions improved
instead of deteriorated (53% reported improving conditions while 19% reported deteriorating conditions).
Manufacturing accounted for 5.8% of GDP (value-added output) and 8.3% of employment in 2018 (most
recent data).

While still positive, services businesses reported a moderation in conditions in 2018 compared to 2017.
Results across services industries were mixed with a divergence in results between the business-oriented
sectors and consumer-oriented sectors as shown in Ai Group’s Australian PSI®. In 2018, 55% of CEOs
reported an improvement in business conditions compared to 20% who reported a decline in business
conditions.

As with the manufacturing sector, construction and mining businesses reported a better year in 2018
than in the previous six years. More than two-thirds of construction and mining CEOs reported improving
turnover and profit margins in 2018. Record numbers of new homes being built and high levels of
infrastructure activity lead to strong improvement in employment and turnover for the construction sector.
Rising global commodity prices and a rebound in the mining sector improved profit margins for mining
businesses (and those servicing miners) in 2018 compared to 2017. Levels of construction activity remain
respectable by historical standards with infrastructure work accounting for a significant proportion of total
activity. However, house building respondents to the Australian PCI® reported slower market activity due
to tighter lending conditions, falling house prices and generally increased caution by prospective buyers at
the close of 2018. Apartment builders also indicated that activity continued to be driven lower by soft
investor demand, project completions and over supplied markets.

   Australian Industry Group                                                                                    CEO Business Prospects 2019         14
2. Australian Economy and
   Business Outlook in 2019
After a stronger period of activity during 2017-18, the Australian economy looked to be slowing again by
the end of 2018. Reflecting this deceleration, the latest expectations for growth in 2019 remain cautiously
positive but are slightly slower than was experienced in 2018. The risk profile has risen, locally (see below)
and globally (see chapter 4).

This moderation in the outlook is apparent in economic forecasts as well as in business leaders’
expectations, plans and strategies. Compared to one year earlier, fewer CEOs are expecting an
improvement in general business conditions in 2019 and more are expecting a deterioration in conditions.
Fewer businesses are expecting growth in turnover, employment, profit margins and in most types of
investment in 2019, but more businesses are expecting increases in their input prices and energy costs.

2.1 Australian economic outlook in 2019
GDP grew by 2.8% p.a. to Q3 2018 and looks to have decelerated through 2018 (see chapter 1 above). In
its latest quarterly Statement on Monetary Policy (published in November 2018, before the latest GDP
estimates for Q3 2018 had been released), the RBA slightly upgraded its forecasts for GDP growth to
3.5% for the end of 2018. This seems optimistic given the latest data for 2018 to date, despite quarterly
volatility and recent revisions to the published estimates. The RBA expects GDP growth to then moderate
to 3.25% in 2018-19 and 3.0% by the end of 2020, as production volumes of new resource commodities
(mainly LNG exports) come on stream, stabilise and then cease to contribute to growth, albeit at a new,
significantly higher levels of production (see Table 2.1).

As of the end of 2018, the federal Treasury was feeling more circumspect than the RBA about headline
GDP growth rates for Australia in 2019, as was the OECD. Treasury forecasts GDP growth of 2.75% in
2018-19 and 3.0% in 2019-20 (and the OECD forecasts 3.0% for the 2019 calendar year), significantly
slower than the RBA’s forecast of 3.25% in both years (Table 2.1). Both central government agencies
expect growth of around 3.0% in 2020 and beyond, which is around the long-run average for Australian
GDP growth, but rather faster than our average annual growth rate of 2.7% achieved since 2010 (or 2.9%
since 2000).

During 2019, the RBA and Treasury expect GDP growth to be supported by large-scale public spending
programs that are already under way, particularly for infrastructure projects and the implementation of the
National Disability Insurance Scheme (NDIS). They also expect better non-mining business investment,
after many years of weak spending. This should help to counter falls in residential investment and building
activity after the recent boom of 2018, when construction of new apartments hit an all-time peak.

Strong jobs growth in 2018 may moderate in 2019, but it is still likely to push the unemployment rate
lower than the recent rate of 5.1% recorded in November 2018. Indeed, unemployment is well on track to
fall below the RBA and Treasury’s expectation of 5.0% by the end of 2018-19. It had already outperformed
the OECDs’ estimate of 5.4% by December 2018. This recent tightening in the labour market is already
feeding through into wages growth, which bottomed out during 2018 and is now accelerating gently.
Ongoing long-term weakness in productivity growth (see chapter 1) plus slow background inflation
however, means nominal wages growth seems unlikely to accelerate from the current rate of around
2.3% p.a. (WPI, Q3 2018) to reach official expectations of 3.0% in 2019-20 and 3.5% in 2020-21.

A cautious mood among households (stemming from slow wages growth, high household debt and
falling house prices in Sydney, Melbourne and some other cities and regions), means that the key
uncertainty in the local economy for 2019 is the outlook for discretionary household spending. Treasury
hopes that household spending growth will pick-up to 3.0% by 2020 as the labour market tightens and
household incomes rise more strongly, but the OECD is expecting growth in real household spending to

  Australian Industry Group                                                      CEO Business Prospects 2019     15
slow to just 2.0% over the next two years (in line with its less positive assessment of the labour market).

More positively, exports of services and manufactured goods are expected to keep growing in 2019 and
beyond, supported by solid trading-partner growth (mainly in Asia) and the depreciation of the exchange
rate since the start of 2018. Globally, growth has slowed in some economies but is expected to remain
above trend in major advanced economies (see chapter 4). The risks of trade disruption and protectionism
are increasing however, which could slow global GDP, trade, business confidence and investment. In its
latest assessment of the “resilient” Australian economy, the OECD identifies three key risks for 2019:

•      Disruptions to the local housing market and residential construction sector, led by falling residential
       dwelling prices in Melbourne and Sydney. The OECD says “The housing market poses
       macroeconomic risks. Australia's housing market is a source of vulnerabilities due to elevated prices
       and related household debt. House prices have fallen, although only gradually since late last year; the
       current trajectory would suggest a soft landing, but some risk of a hard landing remains”;

•      Disruptions to export markets due to rebalancing policies inside China (see chapter 4). The OECD
       says “Australia’s concentration of exports in commodities is a key element in Australia's risk profile.
       Most critical are developments in demand and prices for iron ore and coal, particularly the impact of
       China's economy on these. China is also of growing importance for Australia’s trade in services,
       notably in tourism”; and

•      Disruptions to export markets due to an escalation of international trade disputes (see chapter 4).
       The OECD says “the impacts on Australia of higher US tariffs on imports from China and Mexico are
       probably not large but a widespread increase in tariffs globally could have substantial impact”.2

Drought conditions are exerting additional, short-term drag on output growth in Australia during 2018-19.
The Federal election to be held during 2019, may also temporarily weaken business and consumer
sentiment and delay some spending.

TABLE 2.1 AUSTRALIAN ECONOMY: LATEST ANNUAL GROWTH RATES AND FORECASTS
                                                      2016-17     2017-18      2018-19     2019-20        2020
    RBA SoMP (Nov 2018)
                                                         e           e             f           f             f
    GDP, % change p.a., year end                        1.8         3.1          3.25        3.25           3.0
    Unemployment rate, %, year end                      5.6         5.4           5.0        4.75          4.75
    Inflation (CPI), % change p.a., year end            1.9         2.1           2.0        2.25          2.25
                                                      2016-17     2017-18      2018-19     2019-20       2020-21     2021-22
    Treasury MYEFO (Dec 2018)
                                                         e           e             f           f             p          p
    GDP, % change p.a., year average                    2.1         2.8          2.75         3.0           3.0        3.0
    Household consumption, % p.a., yr ave.              2.6         2.8           2.5         3.0
    Dwelling investment, % p.a., yr ave.                2.8         0.1           1.0        -4.0
    Business investment, % p.a., yr ave.                -4.0        6.0           1.0         5.0
    Employment growth, % p.a., year end                 1.9          2.7         1.75           1.75        1.5        1.5
    Unemployment rate, %, year end                      5.6          5.4         5.0            5.0         5.0        5.0
    Inflation (CPI), % change p.a., year end            1.9          2.1         2.0            2.25        2.5        2.5
    Wages (WPI), % change p.a., year end                1.9          2.1         2.5            3.0         3.5        3.5
    Terms of trade, % change p.a., yr end               14.4         1.9         1.25           -6.0
    OECD (Dec 2018), calendar years                   2016 e       2017 e       2018 f      2019 f
    GDP, % change p.a., year end                        2.6          2.2         2.9            3.0
    Household consumption, % p.a., yr end               2.9          2.7         2.0            2.0
    Dwelling investment, % p.a., year end               8.7         -2.2         -2.1           -2.2
    Business investment, % p.a., year end               -9.5         2.6         3.8            5.3
    Employment growth, % p.a., year end                 1.7          2.3         2.0            1.8
    Unemployment rate, %, year end                      5.7          5.6         5.4            5.3
    Inflation (CPI), % change p.a., year end            1.3          2.0         2.1            2.3
e = estimates, at December 2018. f = forecast p = projection. Sources: ABS various data; RBA Nov 2018 Statement on Monetary
Policy; Australian Treasury, Mid-Year Economic and Financial Outlook, 2018; OECD Economic Surveys of Australia, 2018.

2
    Organisation for Economic Cooperation and Development, Economic Survey of Australia, 2018
     Australian Industry Group                                                                   CEO Business Prospects 2019   16
2.2 Business expectations in 2019 Business expectations for 2019 are generally positive, although less positive than the expectations they had a year ago for the 2018 year. 2019 expectations are broadly similar to initial expectations for 2016 and 2017. For 2019, one third of CEOs expect better general business conditions and a further 41% expect no change in 2019. Around one quarter expect a deterioration in general business conditions. The single biggest caveat to this mildly positive outlook for most businesses is concern about rising input costs and especially rising energy costs in 2019; 63% of CEOs expect their input prices to rise and 68% expect their energy input costs to rise in 2019. These rises are denting an otherwise positive outlook for sales and margins. Nevertheless (and possibly in response), the great majority of CEOs plan to maintain or grow their employment and investment in 2019, albeit in fewer numbers than one year earlier. CHART 2.1 EXPECTED CHANGE IN BUSINESS INDICATORS, 2019 Expectations for 2019: Performance Indicators General business conditions are expected to be mildly positive in 2019, but not as strong as expected one year earlier for 2018. One third of businesses expect an improvement, which is lower than the proportion that had expected an improvement for 2018 (42%). One quarter of respondents expect their business conditions to deteriorate in 2019, which is the highest proportion expecting worse business conditions since 2014 (35% expected of CEOs surveyed at the end of 2014 had expected worse conditions for 2015). The remainder of CEOs expect no change to conditions for 2019. This produces a ‘net balance’ of 7% of CEOs expecting better conditions for 2019, which is the lowest such number since 2015 (see Chart 2.2). CEOs are generally expecting improving conditions, turnover and profits in 2019 but are not as optimistic as they were for 2018. In ‘net balance’ terms, businesses are less optimistic about their own conditions, turnover and profits. Business turnover (sales) is expected to increase for 58% of businesses in 2019, with 24% expecting no change from 2018 levels and 18% expecting a decline in sales in 2019. Although the majority of CEOs expect their total turnover to grow in 2018, most expect no growth in their own export revenue. This suggests that much of the turnover growth will be sought within Australian domestic markets rather than offshore in 2019. Profit margins are expected to grow in 46% of businesses in 2019 and fall in 24% of businesses (giving a net balance of +22%). This lower expectation of margin growth, despite higher turnover, appears to be related to rising input prices. Australian Industry Group CEO Business Prospects 2019 17
Employment (headcount) is expected to increase in 42% of businesses in 2018, with 40% expecting no
change and 18% expecting falling employment. In net terms, employment expectations are lower than last
year but higher than in previous years (see Chart 2.3). Most CEOs anticipate no change in labour
productivity in their businesses (61%) and 38% expect labour productivity to improve. This ‘net balance’
(+37%) is about the same as expectations in 2017 and 2018.

CHART 2.2 EXPECTED BUSINESS CONDITIONS*, 2013-2019

* ‘Net balance’ is the proportion of all survey respondents that improved minus the proportion that deteriorated. Aggregate results
include respondents from all surveyed industries and are weighted by ABS estimates of output from each industry.

CHART 2.3 EXPECTED BUSINESS PERFORMANCE INDICATORS*, 2013-2019

* ‘Net balance’ is the proportion of all survey respondents that improved minus the proportion that deteriorated. Aggregate results
include respondents from all surveyed industries and are weighted by ABS estimates of output from each industry.

  Australian Industry Group                                                                        CEO Business Prospects 2019        18
Expectations for 2019: Business Investment Indicators

The survey results indicate that most CEOs plan to maintain or increase their spending on various types of
business investment in 2019. The proportions of businesses planning to reduce various types of
investment are similar to results seen in 2018 but are much lower than from 2013 to 2017.

The majority of Australian CEOs plan to maintain the same level of spending on staff training, physical
CAPEX and R&D in 2019 as they did in 2018. Under half (39%) plan to increase spending on staff training,
33% expect to spend more on physical CAPEX and 23% foresee increased expenditure on R&D. Very few
CEOs plan to reduce business investment in 2019.

Expectations of spending on new technologies has risen at a faster pace than other forms of investment
since 2013. This suggests that the nature of Australia’s investment environment will continue to change in
2019; with a greater focus on investment in new technologies. In ‘net’ terms, investment spending on new
technologies was the only investment indicator to rise (+42% in 2018 vs +53% in 2019).

CHART 2.4 EXPECTED BUSINESS INVESTMENT INDICATORS*, 2013-2019

* ‘Net balance’ is the proportion of all survey respondents that improved minus the proportion that deteriorated. Aggregate results
include respondents from all surveyed industries and are weighted by ABS estimates of output from each industry.

These expectations for business investment are in line with the latest estimates of non-mining business
investment collected by the ABS. As of Q3 2018, the ABS’s fourth estimate of annual Private New Capital
Expenditure and Expected Expenditure (CAPEX) for 2018-19 indicated total CAPEX is anticipated to fall
by 2.1% from the previous year, due to a 14% fall in mining CAPEX. Mining CAPEX accounted for 29% of
all CAPEX in 2018, down from a peak of 59.4% at the height of the mining investment super-cycle (see
Chart 2.5).

Outside of mining, CAPEX is expected to grow by around 9% p.a. (in nominal dollars), including a rise of
6% among manufacturing businesses and 9.3% among other selected industries. Manufacturing
accounted for 8.3% of total CAPEX in 2018, down from around 20% in the early 2000s and a record high
of 27% during the last recession of 1991. CAPEX by selected industries outside mining and manufacturing
was back up to 62.5% of total CAPEX in 2018, after falling to an all-time low of 34% during the mining
super-cycle. In 2019 it will rise further in absolute terms and as a share of CAPEX, as mining recedes.

  Australian Industry Group                                                                        CEO Business Prospects 2019        19
CHART 2.5 PRIVATE BUSINESS CAPITAL EXPENDITURE (CAPEX),
ACTUAL ANNUAL VALUE 2000 TO 2017-18 AND EXPECTED ANNUAL VALUE* IN 2018-19

* five-year average realisation ratio applied. Source: ABS, Private New Capital Expenditure and Expected Expenditure, Sep 2018

Expectations for 2019: Business Pricing Indicators

The majority of Australian CEOs expect prices to rise for both their inputs (63% of CEOs) and their outputs
(52% of CEOs) in 2019. Indeed, a higher proportion of businesses plan to implement price rises for their
own goods and services in 2019 than in any of the preceding six years. Just 10% of businesses plan to cut
their selling prices in 2019, which is a lower proportion than had planned to cut prices from 2013 to 2017
(see Chart 2.6).

At the same time, more businesses are expecting price pressure on the input side in 2019. A higher
proportion of businesses expect their input costs to rise in 2019 (63%) than in any of the previous six
years, but there is also a higher proportion (6%) who expect their input prices to fall in 2019. As a result, a
smaller proportion of businesses (31%) expect their input costs to remain unchanged in 2019, compared to
CEOs’ pricing expectations for the previous six years (2013-18). This increase in input price pressure adds
an additional layer of uncertainty to business planning, that may not have been present previously.

This concern about input price changes largely (but not solely) relates to energy pricing. Over two-thirds of
CEOs (68%) expect energy input costs for their business to rise further in 2019 (see Charts 2.6 and 2.7).
This comes on top of reported energy price increases for 63% of businesses in 2018. Rising energy prices
(and reliability of energy supply) are becoming a key risk for an increasing number of Australian
businesses, and across an increasing range of industries.

At the start of 2017, 50% of businesses expected their energy prices to increase, while at the end of 2017
64% reported experiencing higher energy prices. Energy costs were expected to rise further in 2018, with
almost three quarter of CEOs (71%) expecting energy costs for their business to increase; at the end of
2018, 63% of CEOs reported higher energy prices. In 2019, 68% of CEOs expect further increases to
energy prices, 5% expect lower energy prices (+63% net balance) and 27% expect no change in energy
prices3.

3
    Australian Industry Group, Eastern Australian Energy Prices- From Worse to Bad, 2018.
     Australian Industry Group                                                                  CEO Business Prospects 2019      20
You can also read