House prices, ownership and affordability: trends in New South Wales - Briefing Paper No 1/2014 by Andrew Haylen
←
→
Page content transcription
If your browser does not render page correctly, please read the page content below
House prices, ownership and
affordability: trends in New South Wales
                   Briefing Paper No 1/2014
                          by Andrew Haylen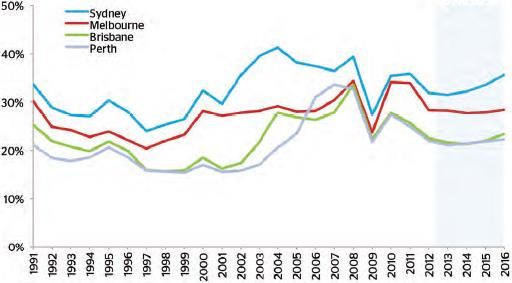
RELATED PUBLICATIONS
Economic Indicators NSW (October 2013). Statistical
Indicators 09/2013 by Andrew Haylen
Social Housing. E-brief 8/2011 by Louise O’Flynn
Housing Affordability. Briefing Paper 04/2011 by Louise
O’Flynn
Affordable Housing in NSW: Past to Present. Briefing Paper
No. 14/2005 by John Wilkinson
CORRIGENDUM
A new Figure 14 has been inserted in this publication; Figure 13 has been
revised, as has Figure 28 (formerly Figure 27).
ISSN 1325-5142
ISBN 978-0-7313-1911-4
January 2014
© 2014
Except to the extent of the uses permitted under the Copyright Act 1968, no part of this
document may be reproduced or transmitted in any form or by any means including information
storage and retrieval systems, without the prior consent from the Manager, NSW Parliamentary
Research Service, other than by Members of the New South Wales Parliament in the course of
their official duties.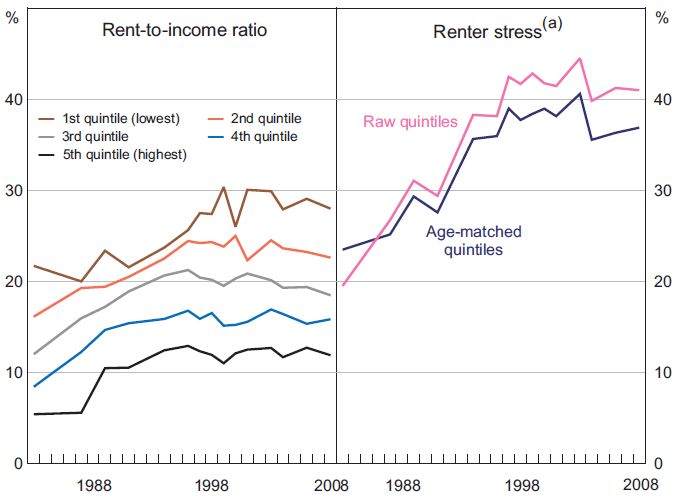
House prices, ownership and
affordability: trends in New South
                Wales

                 by

            Andrew Haylen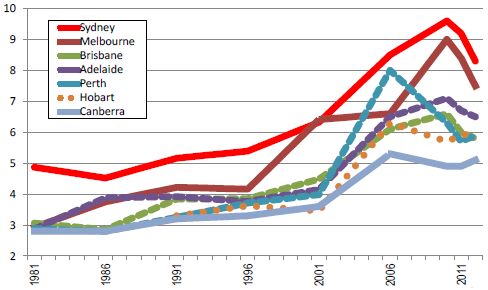
NSW PARLIAMENTARY RESEARCH SERVICE

Gareth Griffith (BSc (Econ) (Hons), LLB (Hons), PhD),
Manager, Politics & Government/Law .......................................... (02) 9230 2356

Lenny Roth (BCom, LLB),
Senior Research Officer, Law....................................................... (02) 9230 2768

Lynsey Blayden (BA, LLB (Hons), GradDipLaw),
Research Officer, Law ................................................................. (02) 9230 3085

Jack Finegan (BA (Hons), MSc),
Research Officer, Environment/Planning ..................................... (02) 9230 2906

Andrew Haylen (BResEc (Hons)),
Research Officer, Public Policy/Statistical Indicators .................. (02) 9230 2484

Daniel Montoya (BEnvSc (Hons), PhD),
Research Officer, Environment/Planning ..................................... (02) 9230 2003

John Wilkinson (MA, PhD),
Research Officer, Economics ...................................................... (02) 9230 2006

Should Members or their staff require further information about
this publication please contact the author.

Information about Research Publications can be found on the
Internet at:
http://www.parliament.nsw.gov.au/prod/parlment/publications.nsf/V3LIstRPSubject

Advice on legislation or legal policy issues contained in this paper is
provided for use in parliamentary debate and for related parliamentary
purposes. This paper is not professional legal opinion.
CONTENTS

LIST OF FIGURES AND TABLES .................................................................... iii

SUMMARY ........................................................................................................ vi

1.         INTRODUCTION ..................................................................................... 1

2.         TRENDS IN HOUSE PRICES ................................................................. 2

     2.1     Capital city house prices ....................................................................... 2

     2.2     NSW house prices................................................................................. 4

       2.2.1      Sydney price outlook ...................................................................... 7

     2.3     Housing bubble? ................................................................................... 7

3.         HOUSING DEMAND ............................................................................... 9

     3.1     General demand drivers ........................................................................ 9

       3.1.1      Population growth ......................................................................... 10

       3.1.2      Economic and income growth ....................................................... 11

       3.1.3      Employment .................................................................................. 13

       3.1.4      Interest rates ................................................................................. 14

     3.2     Structural changes in demand ............................................................ 15

     3.3     Composition of housing demand ........................................................ 16

       3.3.1 Owner occupier demand – Non-first home buyers ........................... 17

       3.3.2      First home buyer demand ............................................................. 19

       3.3.3      Investor demand ........................................................................... 23

       3.3.4      Foreign investor demand .............................................................. 26

4.         HOUSING SUPPLY............................................................................... 31

     4.1     Building approvals ............................................................................... 33

       4.1.1      Australia ........................................................................................ 33

       4.1.2      New South Wales ......................................................................... 35

     4.2     Housing supply responsiveness .......................................................... 37
5. HOME OWNERSHIP AFFORDABILITY INDICATORS ........................ 39
5.1 Rental prices and housing costs ......................................................... 39
5.2 Household income to house price ratio ............................................... 43
5.2.1 Comparison within Australia ......................................................... 44
5.3 Mortgage repayments ......................................................................... 46
5.4 Household debt ................................................................................... 46
5.5 Affordability indexes ............................................................................ 47
5.5.1 Real Estate Institute of Australia Affordability Index ..................... 48
5.5.2 Commonwealth Bank of Australia–Housing Industry Association
Housing Affordability Index........................................................................ 49
5.5.3 BIS Shrapnel Home Loan Affordability Index ................................ 51
5.5.4 Demographia International Housing Affordability Survey .............. 52
6. OUTCOMES OF REDUCED AFFORDABILITY ................................... 54
6.1 Home ownership rates ........................................................................ 54
6.2 Wealth distribution ............................................................................... 56
7. CONCLUSION ...................................................................................... 59LIST OF FIGURES AND TABLES Value of residential purchases by buyer type, Australia .................................... vii Figure 1: Real house prices, GDP per capita and weekly earnings .................... 2 Figure 2: Selected capital city house price indexes ............................................ 3 Figure 3: Selected capital city median established house prices........................ 4 Figure 4: NSW quarterly regional house prices, nominal, all dwellings .............. 5 Figure 5: Sydney inner-ring dwelling prices, by strata type ............................... 6 Figure 6: Inner ring prices relative to average NSW prices, by strata type ......... 7 Figure 7: NSW population and annual change in Sydney population ............... 10 Figure 8: Quarterly change in NSW population ................................................ 11 Figure 9: NSW full time adult weekly earnings ................................................. 12 Figure 10: Change in NSW gross state product and median dwelling price ..... 12 Figure 11: Unemployment rate, all persons, NSW ........................................... 13 Figure 12: Cash rate and standard variable rate .............................................. 14 Figure 13: Value of residential purchases by buyer type, Australia .................. 16 Figure 14: Distribution of residential home buyers, by type .............................. 17 Figure 15: Non-first home buyer owner-occupier dwellings financed, NSW and NSW median dwelling price.............................................................................. 18 Figure 16: Proportion of owner-occupier non-first home buyers, NSW and Australia ........................................................................................................... 19 Figure 17: Owner-occupier first home buyer dwellings financed, NSW ............ 20 Figure 18: Number of first home buyer grants, NSW ........................................ 21 Figure 19: First home buyer proportion of owner-occupier dwellings financed, NSW and Australia ........................................................................................... 22 Figure 20: Owner-occupier and investor finance, Australia .............................. 24 Figure 21: Value of household financial and non-financial assets, by type, Australia ........................................................................................................... 25 Figure 22: Ratio of dwelling to share asset values ........................................... 26 Figure 23: Residential foreign investment approvals, nominal, Australia ......... 27
Figure 24: Value of residential foreign investment, nominal, by stage of
development ..................................................................................................... 27

Figure 25: Value of residential real estate foreign investment, nominal, by state
......................................................................................................................... 28

Figure 26: Value of residential real estate foreign investment, nominal, by
country ............................................................................................................. 29

Figure 27: Value of foreign investment, nominal, by industry ........................... 29

Figure 28: Foreign investment approvals as a proportion of total purchase
values, Australia ............................................................................................... 30

Figure 29: Real house price and construction cost indexes, Australia ............. 32

Table 1: Cumulative demand-supply gap, Australia ......................................... 32

Figure 30: Annual dwelling approvals, by type, Australia ................................. 34

Figure 31: Annual value of residential work, by type, Australia, original ........... 35

Figure 32: Annual dwelling approvals, by type, NSW ....................................... 36

Figure 33: Annual value of residential work, by type, NSW, original ................ 36

Figure 34: Median rent for all dwellings, by area, NSW .................................... 40

Figure 35: Rent-to-income ratios, by quintile and renter stress ........................ 41

Figure 36: Weekly housing costs, by tenure and landlord types, Australia ....... 42

Figure 37: Housing costs for renter with private landlord, by state, 2011-12 .... 42

Figure 38: National dwelling price-to-income-ratio, by measurement type ....... 43

Figure 39: Dwelling price-to-income-ratio, by area, nationwide medians ......... 45

Figure 40: Dwelling price-to-income-ratio, by capital city, nationwide medians 45

Figure 41: Housing interest payments as a proportion of disposable income,
Australia ........................................................................................................... 46

Figure 42: Household debt as a proportion of household assets, Australia ...... 47

Figure 43: Real Estate Institute of Australia Housing Affordability Index .......... 49

Figure 44: CBA-HIA Housing Affordability Index, Methodology 1 ..................... 50

Figure 45: CBA-HIA Housing Affordability Index, Methodology 2 ..................... 51

Figure 46: BIS Shrapnel Home Loan Affordability Index .................................. 52

Figure 47: Demographia Median Multiple ......................................................... 53
Figure 48: Home ownership rates, by age and income quintile ........................ 54

Figure 49: Home ownership rates, by age group, Australia .............................. 55

Figure 50: Income required to service an average FHB loan, Australia ........... 56

Figure 51: Net household worth by age and tenure.......................................... 57

Figure 52: Change in wealth, by home owner group, 2002 to 2010 ................. 57

Figure 53: Change in wealth, by age group, 2002 to 2010 ............................... 58
SUMMARY

Capital city house prices

Between 1995 and 2005, real house prices in Australia increased by more than
6 per cent annually. This was well above the average annual increase in the 20
years to 1995 of just 1.1 per cent.

When compared with some other capital Australian cities, established house
prices in Sydney grew at a considerably slower pace through much of the
2000s; and most capital cities experienced flat or negative growth toward the
end of the 2000s. Since the end of 2012, capital city established house prices
have generally increased. The median established house price in Sydney has
increased by 15 per cent since December 2011. Perth (up by 9 per cent) also
experienced relatively strong median house price growth over this period. As of
March 2013, Sydney had the highest median established house price at
$605,000, followed by Perth ($528,000) and Melbourne ($480,000). [2.1]

NSW house prices

Between June 1990 and June 2013, the median NSW dwelling price (for all
dwellings) increased by $339,000 (262 per cent). Price growth has been most
pronounced in the Greater Sydney region where the median dwelling price in
the Inner Ring of Sydney increased by $555,000; prices in the Middle and Outer
Rings of Greater Sydney grew by $455,000 and $332,000 respectively.

The recent upturn in the Sydney market is being led by inner Sydney which has
outperformed Sydney’s overall median growth. Since the end of 2012, the
median Inner Sydney Ring dwelling price grew by $70,000. The median
dwelling price in the middle and outer Sydney rings also grew by $56,000 and
$38,000 respectively. [2.2]

According to BIS Shrapnel, growth in Sydney’s median house price is forecast
to continue rising by 6.5 per cent in 2013-14, 6.1 per cent in 2014-15, and 5.1
per cent in 2015-16. This growth is expected to be driven by improved State
economic conditions and also by the deficiency of dwelling stock into the middle
and outer suburbs. [2.2.1]

General demand drivers

On the demand side, a number of factors have contributed to the strong growth
in house prices over the last two decades: high population growth (primarily as
a result of high migration); real household income growth; nominal interest rates
have fallen; and financial deregulation has meant that housing finance is more
readily available. [3.1]

Between 1991 and 2011, NSW’s population increased by 1.3 million people,
with Sydney accounting for 71 per cent of this increase. New South Wales’
population increased by 92,827 persons through the year to March 2013 which
represents an increase of 1.8 per cent which was the highest level of growth
since the 12 months to March 2008. [3.1.1]
Between 1993 and 2000, Gross State Product (GSP) grew in NSW at an
average annual rate of 4 per cent. This strong period of economic growth also
corresponded with the rapid increase in real estate prices which grew at an
average rate of 7.5 per cent over the same period. [3.1.2]

The move to a low-inflation environment saw interest rates fall over much of the
1990s and remain at these relatively low levels throughout the 2000s. The
Productivity Commission (2004) and the Senate Select Committee on Housing
Affordability in Australia (2008) both concluded that cheaper and more
accessible housing finance underpinned demand and house price growth. The
current monetary easing cycle has seen the cash rate fall by 225 basis points to
2.5 per cent (its lowest level in more than 50 years), which has triggered strong
demand growth in the last 12 months. [3.1.4]

Composition of housing demand

Prior to the late 1980s, housing demand was largely accounted for by owner
occupiers. However, the rapid escalation of prices in the early 1990s, combined
with structural tax changes and improved access to credit, saw residential real
estate become a highly desirable form of investment. First home buyers and
owner-occupiers are now not only competing with domestic investors, but also
foreign investors. [3.3]

Value of residential purchases by buyer type, Australia

    350

    300

    250

    200                                                 First Home Buyers (FHB)

    150                                                 Non-FHB
                                                        Investor
    100
                                                        Foreign investor
     50

     $b
          2010-11
          1995-96
          1996-97
          1997-98
          1998-99
          1999-00
          2000-01
          2001-02
          2002-03
          2003-04
          2004-05
          2005-06
          2006-07
          2007-08
          2008-09
          2009-10

          2011-12
          2012-13

Upgraders and downsizers represent the largest component of residential real
estate demand in NSW. In November 2013, there were 16,140 non-first home
buyer (NFHB) owner occupier dwellings financed in NSW. This is above the
previous 6-year monthly high of 15,264 reached in October 2013. There have
been 156,751 NFHB owner occupier dwelling finance commitments over the 12
months to November 2013. This is well above the calendar average of 125,759
since 2007. NFHB demand as a proportion of owner occupier demand reached
a high of 93 per cent in NSW, around 6 per cent above the Australian average.
[3.3.1]
First home buyer (FHB) demand in NSW has varied over the last two decades, with the two notable periods of fluctuation corresponding directly with changes to first home owner incentive schemes in 2001 and 2009. FHB demand reached 34 per cent of all owner-occupier sales by mid-2009 (well above longer term trends and also well above the previous peak reached in 2001). With the exception of the brief upturns in 2011 and 2012, FHB demand has been in decline in NSW since peaking in 2009. In November 2013, there were 1,286 housing finance commitments to first home buyers in NSW. Over the past 12 months, there were 12,682 commitments by first home buyers, 51 per cent lower than over the same 12 month period in 2012 (25,627 commitments). First home buyer finance commitments have accounted for 7 per cent of all owner occupier finance commitments in NSW over the last 12 months. [3.3.2] Investor activity has been trending up since the late 1980s. In 1985, investors accounted for only 13 per cent of total housing finance in Australia; as at November 2013, investors accounted for 38.5 per cent of total housing finance. This increase in investor activity has contributed to the growth in housing prices over the last 12 months. At a national level, there was $10.2 billion worth of finance commitments for investment purposes in November 2013, which was 39 per cent higher than in November 2012. Investment finance commitments were 24 per cent higher over the year over the 12 months to November 2013. [3.3.3] Between 1995-96 and 2011-12, the value of foreign investment approvals in Australian real estate increased from $12.4 billion to $59.1 billion. In 2011-12, residential approvals accounted for $19.7 billion, with the remaining $39.4 billion tied to commercial approvals. Since 1995-96, the number of foreign residential investment approvals in Australia has increased from 3,181 to 9,768. Foreign investment growth in NSW residential real estate remained relatively subdued prior to 2008-09, varying between $2 and $4 billion. Foreign investment in NSW has more than tripled between 2009-10 and 2011-12 from $1.9 billion to $6.9 billion. Since 2007-08, real estate investment in Australia from China has increased by more than $2.7 billion. Real estate investment from Singapore has also increased significantly from $1.8 billion in 2007-08 to $5.7 billion in 2011-12. The US was the largest foreign investor in Australian real estate in 2011-12 at $8.1 billion. [3.3.4] Housing supply Over the longer term, dwelling commencements have generally failed to keep pace with increases in underlying demand despite rising house prices. Annual dwelling approvals (all property types) in Australia have declined by 15 per cent since 2002, and in 2012, were at their lowest level (90,438) since 1996. Nationally, dwelling approvals have been trending up in recent months; with monthly housing approvals for October 2013 up 9 per cent since January and other dwelling approvals are up by 30 per cent. This increase in approvals is most likely a response to the rapid price rises seen across the major capital
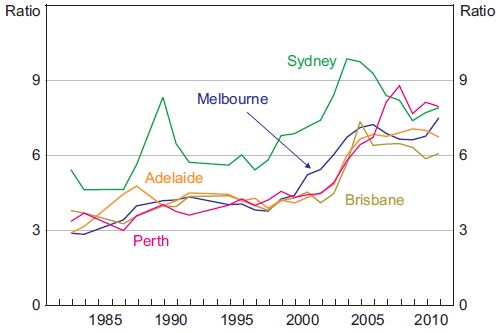
cities, including Sydney, at the end of 2012 and throughout 2013. [4.1.1]

In NSW, between 1995 and 2012, the annual number of dwelling approvals (all
property types) decreased by 22 per cent from 57,528 to 36,394. This decrease
was largely accounted for by the 40 per cent decline in housing approvals over
this period. The number of ‘other’ dwelling approvals has fluctuated over this
period, but recent downward growth has meant they remain around the 20-year
historical average. [4.1.2]

Home ownership affordability

Rental prices, which form a large component of a prospective home buyers
housing costs, have risen consistently in NSW over the last two decades, with
the growth most pronounced in the inner urban areas of Sydney. Between
March 1993 and March 2013, the median rent (for all properties) in the inner
ring of Sydney more than doubled from $195 to $560; while the median rent in
the middle ring of Sydney increased by $300. [5.1]

The ratio of dwelling prices to income in Australia was relatively stable over the
early to mid-1980s, but rose considerably during the late 1980s, the 1990s and
the early 2000s, driven by rising dwelling prices. Between 2003 and 2012, the
ratios flattened and then trended lower. Sydney’s house price to income ratio
has tended to be above those of the other State capitals. [5.2]

Housing interest repayments in Australia have increased over the last decade
as a proportion of disposable income. Throughout the 1990s, this figure
fluctuated between 4 and 6 per cent. Between December 2001 and June 2008,
this ratio increased from 5.1 to 10.9 per cent. This period reflected rising interest
rates and declining affordability for households. While this ratio has declined
following its peak in 2008, it still remains above the 20 year historical average of
6.7 per cent. [5.3]

Gearing (the ratio of the value of housing debt to housing assets) has nearly
tripled since the late 1980s, increasing from 10.6 per cent in September 1985 to
28.4 per cent in June 2010. This can expose borrowers and owner-occupiers to
financial risk and variation in interest rates which may undermine the long-term
affordability of home-ownership. [5.4]

The most widely reported measures of home loan affordability in Australia are
the Real Estate Institute of Australia Home Loan Affordability Indicator, the
Commonwealth Bank of Australia–Housing Industry Association Housing
Affordability Index, and the BIS Shrapnel Home Loan Affordability Index. All
three indexes show that home loan affordability has fluctuated considerably in
the last two decades; and while affordability improved between 2010 and 2012
following a decline in interest rates, affordability remains relatively weak on a
longer term historical basis. However, the methodological and data limitations
associated with these indexes prevent a complete and localised assessment of
affordability. Also, these indexes are not entirely up to date.

With interest rates at the bottom of the easing cycle and price growth expected
to continue, the affordability problem is unlikely to improve significantly in the
next few years. Sydney and Melbourne, which are the least affordable capital
cities in Australia, are also ranked 3rd and 6th globally in terms of unaffordability
by the Demographia International Housing Affordability Survey. [5.5]

Outcomes of reduced affordability

Home ownership rates for young households have declined steadily since the
mid-1980s and represent a negative outcome of the affordability problem in
Australia. According to Battellino (2012), it may be that this is driven by
demographic factors; but it is largely financially driven by unaffordability. [6.1]

There are wealth implications from not having affordable access to home
ownership. Owner-occupiers not only own all of the owner-occupied housing
wealth, they also own most of the wealth in investment housing and most non-
housing wealth. Baby boomer households (born from 1945 to 1960 and in
middle age in 2005-06) who were able to become home owners (most likely in
the 1970s or 1980s and no later than the 1990s) have the greatest holdings of
all forms of wealth. Households who have not been able to gain access to home
ownership have relatively little wealth of any sort. [6.2]
House prices, ownership and affordability: trends in New South Wales          1

1.        INTRODUCTION

In the last few decades, house prices in Australia have risen significantly faster
than average household incomes. Most of the increase in real house prices
occurred in two episodes, in the late 1980s boom and the subsequent boom in
the late 1990s and into the previous decade. While this growth has generally
been broad-based across Australia, Sydney has been especially susceptible to
rising house prices in recent years.

Because of these price outcomes, the Australian property market can be
characterised as a tale of the housing “haves” and the housing “have-nots”.
Typically, the “haves” purchased their home many years ago when prices were
far more affordable. This group of home owners have since experienced
significant capital gains, which over time and in certain instances, have been
used to purchase multiple properties. This created unprecedented wealth
accumulation through the 1990s and 2000s. The “have-nots” are typically
renters and prospective first home buyers who face the highest rates of housing
stress and the greatest affordability constraints.1

This briefing paper will present historical trends in housing prices, with a
particular focus on the supply and demand factors in NSW that have contributed
to the strong price growth over the past two decades. In doing so, it will
emphasise the combined effects of strong underlying demand drivers (such as
population, income and employment growth); a shifting composition of housing
demand; and a subdued housing supply response in contributing to the price
growth in Sydney and NSW. By assessing the key indicators of affordability,
the paper will discuss the implications of rising house prices for affordability,
and in turn, on wealth accumulation and home ownership rates across different
age and demographic segments in NSW and Australia.

It should be noted that the analysis in this paper will largely focus on trends in
house prices, ownership and affordability as it relates to NSW. Data limitations
in certain instances prevent analysis at a State level; where this is the case,
analysis is conducted at a national level. While this paper discusses certain
policies with reference to statistical trends, it does not conduct in depth policy
analysis in terms of potential causes and responses to housing affordability in
Australia; this is beyond the scope of the research.2

1
    AMP, The Great Australian Dream – Just a dream?, 2011
2
    For further policy analysis see O’Flynn, L., Housing Affordability, 2011, NSW Parliamentary
    Research Service, Briefing Paper No 04/2011
2 NSW Parliamentary Research Service
2. TRENDS IN HOUSE PRICES
Between 1995 and 2005, real house prices in Australia increased by more than
6 per cent annually, with an average annual increase of almost 15 per cent from
2001 to 2003. This was well above the average annual increase in the 20 years
to 1995 of just 1.1 per cent.3 Prices in most capital cities stabilised toward the
end of the late 2000s but record low interest rates have contributed to strong
growth in housing prices over the last 12 months.
Since the mid-1990s, real house prices have increased at a significantly higher
rate than real wages and income (Figure 1). Between 1995 and 2010, real GDP
per capita and average weekly earnings increased by an average annual rate of
2 and 3.9 per cent respectively.4 This would suggest that there are key
affordability issues resulting from this rapid price growth (Section 5).
Figure 1: Real house prices, GDP per capita and weekly earnings5
The distribution of this house price growth has varied between the capital cities
and the urban and regional areas of individual States. This section of the paper
will focus on the general trends in capital city housing prices in Australia and
house prices in NSW and Sydney. The purpose of which is to identify particular
areas of NSW that have been especially susceptible to this strong house price
growth.
2.1 Capital city house prices
When compared with some other capital Australian cities, established house
prices in Sydney have grown at a considerably slower pace over the last
3
Yates, J., Housing in Australia in the 2000s: On the agenda too late?, Reserve Bank of
Australia, 2011
4
ABS, Australian National Accounts: National Income, Expenditure and Product, Cat. No.
5602.0, Sep 2013; ABS, Average Weekly Earnings, Australia, May 2013
5
Source: Yates, J., Housing in Australia in the 2000s: On the agenda too late?, Reserve Bank
of Australia, 2011House prices, ownership and affordability: trends in New South Wales 3
decade or so (Figure 2). Since December 2003, dwelling prices have, on
average, risen by: 25 per cent in Sydney; 50 per cent in Brisbane; 71 per cent in
Melbourne; and 119 per cent in Perth.
Figure 2: Selected capital city house price indexes6
250
200
150
100
Sydney Melbourne Brisbane
50
Adelaide Perth
Index 2003-04
Sep-2003
Sep-2006
Sep-2009
Sep-2012
Dec-2002
Dec-2005
Dec-2008
Dec-2011
Mar-2002
Jun-2004
Mar-2005
Jun-2007
Mar-2008
Jun-2010
Mar-2011
Jun-2013
Price growth for the more populous capital cities (apart from Sydney) had been
relatively strong prior to the Global Financial Crisis. In its aftermath, prices fell
over the course of around one year before recovering in mid-2009 and reaching
a new peak in 2010. This recovery was, in part, due to the government stimulus
provided during this period in the form of first home owner’s grants. Between
2010 and 2012, however, price growth was either flat or negative across all of
these capital cities.
Since the end of 2012, capital city established house prices have generally
increased. The weighted Australian capital city house price index increased by
around 8 per cent between the September 2012 and 2013 quarters, driven by
strong price growth in Sydney (up by 11 per cent), Perth (9 per cent) and
Melbourne (8 per cent).
As of March 2013, Sydney still had the highest median established house price
at $605,000, followed by Perth ($528,000), Melbourne ($480,000) and Brisbane
($445,000). The median established house price in Sydney has increased by
around 15 per cent since December 2011. Perth (up by 9 per cent) also
experienced relatively strong median house price growth over this period
(Figure 3).
6
Source: ABS, House Price Indexes: Eight Capital Cities, Cat. No. 6416.0, September 20134 NSW Parliamentary Research Service
Figure 3: Selected capital city median established house prices7
700
600
500
400
300
Sydney Melbourne
200
Brisbane Adelaide
100
Perth
$'000
Nov-2010
Nov-2002
Jul-2003
Nov-2004
Jul-2005
Nov-2006
Jul-2007
Nov-2008
Jul-2009
Jul-2011
Nov-2012
Mar-2002
Mar-2004
Mar-2006
Mar-2008
Mar-2010
Mar-2012
The last few months have seen a significant shift in Australia’s housing markets
with a surge in auction activity. According to Westpac (2013), clearance rates
showed a big surge over the September quarter with a 70 per cent clearance
rate nationally and a rate of 78 per cent in Sydney. This is in the context of a
strong rise in the number of auctions, up about 30 per cent over three months.8
It should be noted that auction activity does have regular seasonal variations,
with spring a typically stronger period. Auction activity also only captures a
portion of the market and is heavily skewed towards Sydney and Melbourne.
Nationally, only about 10 to 15 per cent of property sales are conducted via
auction. That rises to between 15 and 20 per cent for Sydney and Melbourne
which account for around 80 per cent of auctions nationally. This auction data
mostly reflects conditions in Sydney and Melbourne rather than the nation as a
whole.9
2.2 NSW house prices
Based on nominal data from Housing NSW, State house prices have increased
significantly over the last two decades. Since June 1990, the median NSW
dwelling price (for all dwellings) has increased by $339,000 (262 per cent).
Dwelling price growth in NSW has been most pronounced in the Greater
Sydney region. For example, between June 1990 and June 2013, the median
dwelling price in the Inner Ring of Sydney increased by $555,000; prices in the
Middle and Outer Rings of Greater Sydney grew by $455,000 and
$332,000respectively.
7
Source: ABS, House Price Indexes: Eight Capital Cities, Cat. No. 6416.0, September 2013
8
Westpac, Market outlook, October 2013
9
Westpac, Market outlook, October 2013House prices, ownership and affordability: trends in New South Wales 5
A large share of this growth occurred between 1995 and 2003, when the
median dwelling price in the Greater Sydney region grew by $183,000, at an
average annual rate of 10.4 per cent. This contrasts with the subdued growth
between 2003 and 2009, in which NSW prices remained mostly unchanged.
Driven in part by government stimulus, this was followed by a brief period of
recovery in 2009 and then flat growth during most of 2011 and 2012.
Median dwelling prices in Sydney have since begun a period of strong growth.
The recent upturn in the Sydney market is being led by inner Sydney which has
outperformed Sydney’s overall median growth. Since the end of 2012, the
median Inner Sydney Ring dwelling price grew by $70,000. The median
dwelling price in the middle and outer Sydney rings also grew by $56,000 and
$38,000 respectively (Figure 4). This corresponds with data indicating a solid
pick up in upgrader and investor demand, and weakness in first home buyers
demand (Section 3.3).
Figure 4: NSW quarterly regional house prices, nominal, all dwellings10
800
700
600
500
400
300
200
100
$'000
Greater Sydney Inner Ring
Middle Ring Outer Ring
Rest of GMR Rest of New South Wales
According to the HIA Economics Group (2013), the recent fast pace of
appreciation in median house prices in Sydney reflects strong fundamentals
and a catch-up from years of under-performance. Rising house prices are
providing a positive signal to residential developers and builders and Sydney is
currently one of the few capital city markets where a recovery in new home
building is underway (Section 4.2).11
The Inner ring median dwelling price is now at a record high of $750,000 and
compares with the NSW median dwelling price of $468,000. The inner and
10
Source: Housing NSW, Rent and Sales Report, 2013
11
HIA Economics Group, Residential property prices in Sydney: some observations, October
20136 NSW Parliamentary Research Service
middle rings of Sydney are therefore at a considerable premium to other
residential areas in NSW.
Non-strata dwellings (houses) have historically been sold at a premium to strata
dwellings (apartments, units etc.) because they are generally larger properties.
Non-strata dwelling prices have, however, also increased at a higher rate than
strata dwelling prices, particularly since the early 2000s (Figure 5). There are a
couple of explanations for this trend. With constraints on land supply in inner
Sydney, houses are obviously in shorter supply, which places upward pressure
on prices. The average size of individual strata dwellings is also likely to have
decreased over time as developers opt for smaller one and two bedroom
dwellings in apartment complexes.
Figure 5: Sydney inner-ring dwelling prices, by strata type12
1400
1200
1000
800
Non-strata
600
400
Strata
200
$'000
Non-strata dwellings in Sydney have also increased at a higher rate than strata
dwellings when compared with the NSW average of each respective property
type. Since March 1993, the ratio of inner ring non-strata prices to the NSW
average has increased by 0.83, compared to that of strata prices which have
only increased by 0.11 (Figure 6).
12
Source: Housing NSW, Rent and Sales Report, 2013House prices, ownership and affordability: trends in New South Wales 7
Figure 6: Inner ring prices relative to average NSW prices, by strata type13
3
2.5
2
Ratio Non-strata Inner ring to NSW
1.5
1
Ratio strata inner ring to NSW
0.5
Ratio
2.2.1 Sydney price outlook
According to BIS Shrapnel (2013), growth in Sydney’s median house price is
forecast to continue rising by 6.5 per cent in 2013-14, 6.1 per cent in 2014-15,
and 5.1 per cent in 2015-16. This growth is expected to be driven by improved
State economic conditions and also by the deficiency of dwelling stock into the
middle and outer suburbs.
Median house price growth is expected to slow through 2015-16 as a
corresponding rise in dwelling construction begins to erode the dwelling
deficiency and forecast tightening interest rate policy begins to dampen
demand. This is forecast by BIS Shrapnel to take Sydney’s median house price
to $820,000 by June 2016.14
2.3 Housing bubble?
After initially failing to respond to rate cuts, house prices are now in a period of
strong growth, particularly in Sydney. Fears of a renewed bubble have also
been heightened by a surge in Sydney’s auction clearance rate above the 80
per cent level, well above its normal cyclical high of around 70 per cent.15
According to Westpac (2013), the current situation should be kept in
perspective. Prices nationally have only just regained their previous peak.
Westpac argued strongly that if there was a bubble in house prices it would
have been present in 2007-08 and would have been very unlikely to have
13
Source: Housing NSW, Rent and Sales Report, 2013
14
BIS Shrapnel, Australian Housing Outlook 2013 – 2016, October 2013
15
Oliver, S., Australian housing – economic saviour or just another bubble?, August 2013, AMP
Capital8 NSW Parliamentary Research Service
survived the ‘stress test’ of the GFC. While activity has strengthened in recent
months, current conditions are well below the booms that have seen
overheating in the past. In 2003, for example, the value of housing finance
approvals rose by 37 per cent per annum for 3 years and prices increased by
63 per cent.16 According to the Commonwealth Bank (2013), a true bubble
rising prices need to be backed up by an acceleration in housing credit growth
over a relatively short period; an easing in lending standards; and an
expectation that dwelling prices keep rising.17
Nevertheless, Oliver (2013) suggests Australian house prices still remain
overvalued which can be seen in a couple of key indicators:18
while real house prices have fallen from an extreme of 25 per cent above
their long term trend in 2010, they are still above it by around 7 per cent;
the ratio of house prices to incomes in Australia is 21 per cent above its
long term average, leaving it toward the higher end of OECD countries
(Section 5.2).19
At a national level, apart from overvaluation and strong Sydney auctions, there
is little evidence of a housing bubble at present. For example, house price
growth averaging around 5 per cent per annum is tame by past standards. At a
similar stage following interest rate easing cycles commencing in July 1996,
February 2001 and September 2008 capital city house prices were showing
annual growth of 8, 19 and 19 per cent respectively. At present, house price
strength is not broad based, with much of the growth occurring in Sydney and
Perth (Section 2.1). Growth in housing credit is also around a record low of just
4.6 per cent compared to 20 per cent in 2004.20
16
Westpac, Market outlook, October 2013
17
Commonwealth Bank, Housing bubbles – eight questions and some answers, October 2013,
Global Markets Research
18
Oliver, S., Australian housing – economic saviour or just another bubble?, August 2013, AMP
Capital
19 th
Demographia, 9 Annual International Housing Affordability Survey – Ratings for Metropolitan
Markets, 2013
20
Oliver, S., Australian housing – economic saviour or just another bubble?, August 2013, AMP
CapitalHouse prices, ownership and affordability: trends in New South Wales 9
3. HOUSING DEMAND
There is widespread agreement that real house prices in NSW have been
driven by demand fundamentals underpinned by supply constraints.
In housing, the “liquid” part of the market is quite small. About 4 to 6 per cent of
the dwelling stock is turned over each year and new construction adds around 1
or 2 per cent to the stock. The rest is locked up. The limited amount of stock in
play magnifies the price effect of changes in the supply-demand
fundamentals.21
On the demand side, a number of factors have contributed to the strong growth
in house prices over the last two decades: high population growth (primarily as
a result of high migration); real household income growth; nominal interest rates
have fallen; borrowing capacity has increased; deregulation and financial
innovation have meant that finance is more readily available; taxation systems
generally encouraged investment in housing; and increases in household
wealth have reinforced underlying demand pressures.22 These and other
demand factors are considered in this section of the paper, the aim of which is
to assess the general trends in these housing demand variables rather than
attempt to qualify the relative importance of each individual factor.
3.1 General demand drivers
Underlying demand for new dwellings is driven primarily by population growth
which comes from the combination of natural increase (births less deaths) and
overseas/interstate migration flows.
Despite relatively subdued income and employment growth since the GFC,
housing demand in NSW has remained strong as a consequence of rapid
population growth and rising affordability on the back of lower mortgage rates.
On the other side of the equation, housing supply growth has been limited
(Section 4). As a result, there is an excess demand for dwellings. 23
Going forward, underlying demand drivers and house price growth remains
uncertain, with unemployment predicted to rise and economic growth expected
to remain subdued. Wage growth also remains relatively weak in a low inflation
economy. According to Australian Property Monitors (2013), a weakening
economic outlook will keep a downward bias on interest rate settings, which will
provide further short-term stimulus to housing markets. Although lower interest
rates are generally positive for housing markets, declining economic activity and
rising unemployment is likely to have a dampening effect on home buyer activity
21
Commonwealth Bank, Housing bubbles – eight questions and some answers, October 2013,
Global Markets Research
22
Yates, J., Housing in Australia in the 2000s: On the agenda too late?, Reserve Bank of
Australia, 2011
23
Commonwealth Bank, Housing bubbles – eight questions and some answers, October 2013,
Global Markets Research10 NSW Parliamentary Research Service
over the longer-term.24
3.1.1 Population growth
Population growth underpins housing demand and has had a pivotal role in the
price increases experienced across NSW and Sydney.25
Over the last two decades, Australia’s population has increased by just over 5
million. That represents an average annual increase of 1.2 per cent. NSW
accounted for 26 per cent of this population increase and over this period
Sydney’s population increased by 936,000.
New South Wales’ population increased by 92,827 persons through the year to
March 2013; up from an increase of 83,499 persons over the previous year to
March 2012. This represents an increase of 1.8 per cent which was the highest
level of growth since the 12 months to March 2008 (Figure 7).
Figure 7: NSW population and annual change in Sydney population26
5 90000
4 72000
Total NSW Population (LHS)
3 54000
2 36000
1 18000
Annual Change (RHS)
million No.
1991
1992
1993
1994
1995
1996
1997
1998
1999
2000
2001
2002
2003
2004
2005
2006
2007
2008
2009
2010
2011
There are two components to population growth: net overseas migration and
natural increase (births minus deaths). Both measures remain elevated on a
historical basis (Figure 8), and in the year to March 2013, natural increase
contributed to 43 per cent of the State’s population growth (46,511) and net
overseas migration contributed the additional 57 per cent (62,891). Housing
demand from overseas and interstate migration is more immediate as this group
will require accommodation upon arriving, be it owner occupation or rental.27
24
Australian Property Monitors, Housing market report, August 2013
25
Senate Select Committee on Housing Affordability in Australia, A good house is hard to find:
Housing affordability in Australia, 2008, Commonwealth of Australia, Canberra; Productivity
Commission, First home ownership, 2004, Inquiry Report No. 28
26
Source: ABS, Australian Demographic Statistics, Cat. No. 3101.0, March 2013
27
BIS Shrapnel, Australian Housing Outlook 2013 – 2016, October 2013House prices, ownership and affordability: trends in New South Wales 11
Figure 8: Quarterly change in NSW population28
30000
Natural increase
Net overseas migration
20000
10000
No.
Jan-2003
Oct-1999
Oct-2012
Jul-1996
Sep-1998
Nov-2000
Feb-2004
Jul-2009
Sep-2011
Aug-1997
Apr-2006
Dec-2001
Mar-2005
May-2007
Aug-2010
Jun-1995
Jun-2008
The increase in population translates to higher demand for housing across
NSW, particularly in Sydney. According to BIS Shrapnel, population growth is
expected to remain strong in NSW.29 Based on the labour force data, however,
122,912 new jobs were created nationally over the 12 months to July 2013; in
the same period 306,500 net long-term overseas arrivals were recorded. If job
creation slows, the gap between job creation and overseas arrivals may widen;
if this occurs, employment prospects for those moving here from abroad will be
lower, which may result in lower levels of overseas migration.30
3.1.2 Economic and income growth
Strong economic growth over most of the last two decades has allowed for an
increase in household incomes in New South Wales (Figure 9). Together with
the population growth, this has provided the platform for increases in housing
demand and resulting increases in house prices.
28
Source: ABS, Regional Population Growth, Cat. No. 3218.0, 2012
29
BIS Shrapnel, Australian Housing Outlook 2013 – 2016, October 2013
30
RP Data, Capital markets report, 201312 NSW Parliamentary Research Service
Figure 9: NSW full time adult weekly earnings31
1600
1200
800
400
$
Feb-2006
Feb-1996
Feb-2001
Feb-2011
Nov-1994
Nov-1999
Nov-2004
Nov-2009
May-1997
May-2002
May-2007
May-2012
Aug-1998
Aug-2003
Aug-2008
Between 1993 and 2000, Gross State Product (GSP) grew in NSW at an
average annual rate of 4 per cent. This strong period of economic growth also
corresponded with the rapid increase in real estate prices which grew at an
average rate of 7.5 per cent over the same period (Figure 10).
Figure 10: Change in NSW gross state product and median dwelling
price32
6 20
5
15
4
10
3
5
2
Annual GSP change %
1
Annual NSW dwelling price change
% -5
This was followed by a period of more subdued economic growth for NSW in
31
Source: ABS, Average Weekly Earnings, Australia, Cat. No. 6302.0, May 2013
32
Source: ABS, Australian National Accounts: State Accounts, Cat. No. 5220.0, 2012-13House prices, ownership and affordability: trends in New South Wales 13
which GSP grew at an average rate of 2 per cent between 2001 and 2009. The
slowdown of the State’s economy was also accompanied by stagnant real
estate price growth in NSW between 2005 and 2009. With the exception of the
sharp upturn in prices in 2010, dwelling price growth remained relatively flat in
NSW from 2003 to 2012.
The median dwelling price in NSW increased by over 5 per cent in the year
ending June 2013; there are doubts as to whether this price rise can be
sustained because economic growth and wage fundamentals remain relatively
weak. For instance, New South Wales’ GSP increased by 1.84 per cent over
the 12 months to June 2013, with the value of the domestic economy’s output at
$471 billion. This increase remains below the long run average and is down on
the growth in the 12 months to June 2011 (2.36 per cent) and 2012 (2.32 per
cent).
3.1.3 Employment
At a national level, the rate of unemployment (5.8 per cent in November) is
currently at its highest level since September 2009. The rate of unemployment
in NSW (5.9 per cent) is also at its highest level since September 2009 (Figure
11).
Figure 11: Unemployment rate, all persons, NSW33
7
6
5
%
Jan-2000
Jan-2005
Jan-2010
Sep-2001
Jul-2002
Sep-2006
Jul-2007
Sep-2011
Jul-2012
Nov-2000
Nov-2005
Nov-2010
May-2003
May-2008
May-2013
Mar-2004
Mar-2009
Federal Treasury recently stated that they are forecasting national
unemployment to peak at 6.25 per cent in mid-2014. If unemployment does
reach this level nationally it would be the highest unemployment rate since
September 2002. According to RP Data (2013), this prospect of rising
unemployment in NSW may dampen consumer confidence and demand for
credit, and subsequently impact on the State’s housing market.34
33
Source: ABS, Labour Force, Australia, Cat. No. 6202.0, Nov 2013
34
RP Data, Capital markets report, 201314 NSW Parliamentary Research Service
3.1.4 Interest rates
The move to a low-inflation environment saw interest rates fall over much of the
1990s and remain at these relatively low levels throughout the 2000s. At the
same time, increased competition among housing lenders has made it easier
for many borrowers to obtain loans, and contributed to lower interest costs by
reducing lending margins.35 The Productivity Commission (2004) and the
Senate Select Committee on Housing Affordability in Australia (2008) both
concluded that cheaper and more accessible housing finance has underpinned
demand and house price growth.36
The current interest rate easing cycle, which began in November 2011 with a 25
basis point reduction, did not have the immediate impact that previous easing
cycles have had on the housing market. Since that time the cash rate has fallen
by 225 basis points to 2.5 per cent, its lowest level in more than 50 years
(Figure 12). BIS Shrapnel (2013) indicate that the relatively low level of
affordability at the start of this period dampened the impact of rate cuts on the
housing market.
Since the start of the easing cycle, the ratio of the standard variable rate to the
cash rate has increased from 1.5 to a historical high of 2.5. This confirms that
while the RBA has been decreasing the cash rate, the banks have not been
passing on the entirety of the rate cuts, a factor which may have contributed to
the slow market response.
Figure 12: Cash rate and standard variable rate37
18 3
15 2.5
12 2
9 1.5
6 1
3 0.5
% Ratio
Apr-96
Oct-04
Apr-13
Dec-01
Aug-90
May-03
Mar-06
Aug-07
Jan-92
Jun-93
Nov-94
Jan-09
Jun-10
Nov-11
Sep-97
Feb-99
Jul-00
Cash rate Standard variable rate Ratio SVR to CR
35
Worthington, A., The quarter century record on housing affordability, affordability drivers, and
government policy responses in Australia, 2011, Griffith Business School
36
Senate Select Committee on Housing Affordability in Australia, A good house is hard to find:
Housing affordability in Australia, 2008; Productivity Commission, First home ownership,
2004, Inquiry Report No. 28
37
Source: Reserve Bank of Australia, Monetary Policy Changes, 2013, Statistical Table A2House prices, ownership and affordability: trends in New South Wales 15
Nevertheless, standard variable mortgage rates have fallen by approximately
185 basis points in the current easing cycle, from 7.8 per cent to around 5.95
per cent. Considerable improvements in other aspects of affordability over 2012
(such as the relatively slow price growth in the 3 years previous),
complemented with these record low interest rates, catalysed an increase in
turnover throughout the housing market in 2013.38 The RBA still has scope to
cut rates further should the need arise. According to RP Data (2013), the
likelihood of further interest rate cuts seems fairly high given that Federal
Treasury is now forecasting that economic growth will slow to 2.5 per cent this
year and the unemployment rate will peak at 6.25 per cent.39
3.2 Structural changes in demand
According to Yates (2011), financial deregulation was a major source of
stimulus to the high rate of real house price inflation from the mid-1990s. This
was seen as a structural change that facilitated housing demand.40
Financial deregulation specifically promoted greater competition and product
innovation and, through reduced interest margins and increased finance
availability, increased borrowing capacity which boosted housing demand.
According to Ellis (2006) there are questions as to whether the increase in
demand represented a once-off shift to a new and higher equilibrium level of
effective demand for housing, arising from structural change in the housing
finance system, or whether it was the start of a house price bubble.41
The cost of housing services and the effective returns available from investment
in housing were also key economic drivers affecting housing demand. User
costs are affected by the way in which housing is treated by the tax system. In
the past decade the tax-privileged status accorded to owner-occupied housing
by its exemption from the capital gains tax in the mid-1980s has remained
unchanged.42 As highlighted in the Henry Report, changes to the treatment of
capital gains in 1999 affected returns available from investment in rental
property and particularly from highly geared investment.43 An increase in
investor demand arising from the 1999 changes to the tax system was identified
by the then Governor of the Reserve Bank of Australia as a key factor
contributing to the boom at the start of this period.
38
BIS Shrapnel, Australian Housing Outlook 2013 – 2016, October 2013
39
RP Data, Capital markets report, 2013
40
Yates, J., Housing in Australia in the 2000s: On the agenda too late?, Reserve Bank of
Australia, 2011
41
Ellis, L., Housing and Housing Finance: The View from Australia and Beyond, 2006, RBA
Research Discussion Paper No 2006-12.
42
Yates, J., Housing in Australia in the 2000s: On the agenda too late?, Reserve Bank of
Australia, 2011
43
Department of Treasury, Australia’s Future Tax System, December 2009, Report to the
Treasurer, Part Two Detailed Analysis, Volume 1, p 6916 NSW Parliamentary Research Service
3.3 Composition of housing demand
Prior to the late 1980s, housing demand was largely accounted for by owner
occupiers. However, the rapid escalation of prices in the early 1990s, combined
with structural tax changes and improved access to credit, saw residential real
estate become a highly desirable form of investment. Property owners were
able to use the equity in existing properties (which would have increased
significantly during this period) to obtain further finance for the purchase of
investment properties. This resulted in unprecedented wealth accumulation and
growth in market share for investors through the 1990s and early 2000s.
To illustrate, in 1985 investors accounted for only 13 per cent of total housing
finance in Australia; as at November 2013, investors accounted for 38.5 per
cent of total housing finance. Further, this figure represents only part of the
total market share of investors in Australian residential real estate.
First home buyers and owner-occupiers are now competing with domestic
investors, as well as foreign investors (Figure 13). Foreign investment in
Australian residential real estate has more than tripled since the mid-1990s,
increasing from $6.2 billion in 1995-96 to $19.7 billion in 2010-11. In the last two
years alone, foreign investment in NSW residential real estate has increased
from $2 billion in 2009-10 to $7 billion in 2011-12.
Figure 13: Value of residential purchases by buyer type, Australia44
350
300
First Home
250 Buyers (FHB)
200 Non-FHB
150
Investor
100
Foreign
50 investor
$b
2001-02
1995-96
1996-97
1997-98
1998-99
1999-00
2000-01
2002-03
2003-04
2004-05
2005-06
2006-07
2007-08
2008-09
2009-10
2010-11
2011-12
2012-13
44
Sources: ABS, Housing finance, Australia, Cat No. 5609.0, October 2013; Foreign Investment
Review Board, Annual Reports, 1995 to 2012. Data related to the total value of residential
purchases in Australia is not available; as such this figure has been calculated based on a
number of assumptions to give an indication of the composition of housing demand in
Australia. It should not be construed as actual purchase shares from these respective groups.
The investor shares of purchases, for example, have been calculated based on investor
finance shares for purchases in ABS 5609.0. The purchase share attributable to investors is
likely to be higher as investors usually have more equity than prospective owner-occupiers.You can also read