National Statement of Housing Supply and Demand 2016 and Outlook for 2017-18 - February 2017 - Housing Agency
←
→
Page content transcription
If your browser does not render page correctly, please read the page content below
National Statement
of Housing Supply
and Demand 2016
and Outlook for 2017-18

               February 2017
Published by: Housing Agency. Publication date: February 2017 ISBN: 978-1-903848-39-5 Contact Details Housing Agency, 53 Mount Street Upper, Dublin 2 D02 KT73 01 656 4100 info@housingagency.ie www.housingagency.ie @HousingAgencyIE
Contents
        Chairman’s Foreword                                                                                                                     3
        Executive Summary                                                                                                                       4
        Chapter 1: Introduction                                                                                                                 7
        Chapter 2: Housing Supply                                                                                                               8
                2.1 Completions                                                                                                                 8
                2.2 Residential sales trends                                                                                                    9
                2.3 Rental trends                                                                                                              12
                2.4 Indicators of Future Housing Supply                                                                                        13

        Chapter 3: Current and future housing demand                                                                                          16
                3.1 Population and household formation                                                                                         16
                3.2 Housing stock                                                                                                              19
                3.3 Tenure                                                                                                                     22
                3.4 Minimum Future Housing Requirements                                                                                        24
                3.5 Social Housing Requirements                                                                                                26

        Chapter 4: Affordability                                                                                                              29
                4.1 Housing costs as a percentage of income                                                                                    29
                4.2 Employment and household income                                                                                            34
                4.3 Mortgage arrears and repossessions                                                                                         36

        Appendix I Policy Developments                                                                                                        38
                Housing legislation                                                                                                            38
                Taxation                                                                                                                       40
                Mortgage Lending                                                                                                               42
                Social housing delivery mechanisms                                                                                             43

The Housing Agency is a statutory body set up to work with and support local authorities, approved housing bodies and the Department of
Housing, Planning, Community and Local Government in the delivery of housing and housing services. It also serves as the interim Regulator of
Approved Housing Bodies. It brings together a wealth of practical, research and technical expertise to offer a broad base of services. The Agency’s
vision is to enable everyone to live in good quality, affordable homes in sustainable communities. The Agency understands that housing plays a
key role in people’s quality of life and life chances.

The Housing Agency wishes to acknowledge the assistance of Future Analytics in the preparation of this report.

                                  National Statement of Housing Supply and Demand 2016 and Outlook for 2017-18                                        1
List of Tables
Table 2.1: Regional distribution of executed property market transactions as a %
of total annual activity, 2010 – 2016 10
Table 2.2 Number of planning permissions and total floor area granted 2007 – 2015 15
Table 3:1: Forecast change in the age profile of the population, 2016 – 2021 18
Table 3:2 Composition of the housing stock by occupancy status, 19
Table 3.3: Composition of permanent private households by tenure type in Ireland 22
Table 3.4: Breakdown of homeless persons in emergency accommodation December 2016 27
Table 4.1: Employment by sector, 2007 Q2 – 2016 Q2 34
Table 4.2 PDH and BTL Breakdown of Mortgages Held, Q3 2016 37
List of Figures
Figure 2.1: Estimate of housing completions, 1971–2016 8
Figure 2.2: Number of executed property market transactions, 2010 – 2016 10
Figure 2.3 Residential Property Price Index Jan 2005 to November 2016 11
Figure 2.4 Standardised monthly rent in Dublin, 2007-2016 12
Figure 2.5 Standardised monthly rent outside Dublin, 2007-2016 13
Figure 2.6 Planning permissions by number and type 2010 - 2015 15
Figure 3.1: Population Change by County 2011 to 2016 17
Figure 3.2: Age profile of the population in 2015 18
Figure 3.3: Number of persons per household across the state as a percentage of the total
number of households recorded by the Census, 1926 - 2016 19
Figure 3.4 The number of vacant homes on a county-by-county basis, 2016. 21
Figure 3.5 Change in the number of vacant units in each county, 2011 and 2016 22
Figure 3.6: Comparison on tenure type across countries in the EU 15, 2014 23
Figure 3.7: Housing Supply Requirements in Ireland’s Urban Settlements, 2016 - 2020 25
Figure 3.8 Number of Adult Individuals in Dublin who have moved to housing since January 2014 28
Figure 4.1: OECD standardised house price-to-income ratio, 1980 - 2016 30
Figure 4.2 Affordability index for a 2 earner household 2008 – 2016 (National) 31
Figure 4.3 Affordability index for a 2 earner household, 2008– 2016 (Dublin) 31
Figure 4.4 Regular monthly housing costs as percentage of disposable household income 33
Figure 4.5: Seasonally adjusted monthly unemployment rate and mortgage arrears (> 90 days)
on primary dwellings, 2007 – 2015 35
2 Housing AgencyChairman’s Foreword
The Housing Agency’s vision is to enable everyone to A house is many things, ranging from the deeply
live in good quality, affordable homes in sustainable personal and emotional issues surrounding the word
communities. We have come to realise that housing in ‘home’ - to practical considerations of a house as a
Ireland consists of many parts, and successful policies financial asset that also involves complex building and
and actions need to be well co-ordinated. planning regulations. Housing costs are a substantial
proportion of most people’s monthly expenditure, and
We see from recent years that a shortage of affordable
the lack of housing affordability has been highlighted
market housing in some areas has quickly transferred
as a key risk to our national competitiveness.
into pressure in other sectors, particularly the private
and social rental sectors, while in other areas housing We would very much welcome your feedback on
remains vacant for long periods. the Statement and any suggestions you may have
regarding additional data or information which would
This is why the Statement of Housing Supply
enhance future editions.
and Demand is so important – it brings together
information about the many strands that make up our
housing system and deepens our understanding.
Conor Skehan
Chair, Housing Agency
February 2017
National Statement of Housing Supply and Demand 2016 and Outlook for 2017-18 3Executive Summary
This is the second edition of the National Statement of Housing Supply and Demand. It brings together
up-to-date information on housing trends in 2015 and 2016 and looks ahead to future demand.
The Statement reports that while housing completions continue to rise, the rate of increase is still below
supply requirements, particularly in urban areas, where affordability is also most problematic.
Housing Supply The latest Summary of Social Housing Assessments
identified 91,600 households assessed as qualified
Construction statistics indicate sufficient development
and in need of social housing support. While the
land, a growth in construction activity and further
number of homeless has increased over the last two
progress in the completion of unfinished estates.
years, reaching over 7,000 people by the end of 2016,
Preliminary figures for 2016 indicate that close to
over that period over 5,000 sustainable exits from
15,000 completions were recorded last year, an
homelessness were recorded.
increase of 18% on the previous year. Residential sales
had increased year-on-year for the four years to 2015, Affordability
but fell back in 2016; prices continued to rise, but at a
Both international and domestic analysis of
slower pace. In the private rented sector, new rents in
affordability show that this is a problem in particular
Dublin reached a new high, while rents in other parts
parts of the country – urban areas and the East.
of the country continued to rise.
Renters tend to pay a higher proportion of their
Current and Future Housing Demand income on accommodation. While the number of
mortgages in arrears continues to drop, almost 50,000
A growing population and smaller household sizes
mortgages are in arrears of over two years and 147,000
have implications for the number, type and location
have been restructured.
of housing needed, as does our current age profile
(above EU average number of children) and projected Policy Developments
growth in the numbers aged over 75. The number of
A key feature of the last two years has been the
households is increasing, but they are smaller in size.
substantial policy and legislative changes introduced
Based on Census 2016, a minimum of 81,118 homes
aimed to improve planning, encourage development
are needed over the five-year period 2016 – 2020 to
and stabilise the residential rental sector. See
meet demand in our urban areas. Vacant homes offer
Appendix 1.
potential to respond to this demand.
4 Housing AgencyOur Key Messages
Future housing
supply needs
Construction to reflect
activity indicators demographic
are positive. changes.
15,000
completions in
2016, up 18%.
Vacant housing
needs more
attention.
Housing supply remains
below demand requirements,
particularly in urban areas.
81,000
homes needed by 2020.
Concern areas
91,600 50,000
Over Affordability
households qualified 7,000
people homeless,
a problem in cities
and for renters mortgages in
and in need of long-term arrears
housing support but people are exiting
homelessness too6 Housing Agency
Chapter 1

Introduction

This report is the second edition of the National Statement of Housing Supply and Demand.
It provides information relating to 2015-2016 with an outlook to 2020. It shows continued modest
growth in housing output, but still not to the levels required to match demand.

This Statement comes at a time when our economy                  Chapter 4 concentrates on the key issue of
shows continued signs of recovery. Growth rates                  affordability and brings together different measures of
remain positive and unemployment continues to fall.              affordability and also information on mortgage arrears.
This is positive news, but a strong and sustainable
                                                                 Over the last two years there has been considerable
housing system is an important component of
                                                                 housing related legislative and policy developments.
maintaining competitiveness. It is also vital to our
                                                                 These are summarised in an Appendix to this
quality of life.
                                                                 Statement.
Chapter 2 of the Statement examines current housing
supply – official statistics on house construction
activity, rental and sales data.

Chapter 3 then focuses on current and likely future
demand. This Chapter draws on information from the
recent Census.

                       National Statement of Housing Supply and Demand 2016 and Outlook for 2017-18                        7
Chapter 2
Housing supply
This Chapter examines trends in housing supply, with a particular focus on the last two years.
Drawing on a variety of data sources, it reports a trend of moderate increase in housing supply. An
increase in residential property sales in 2014 and 2015 was not sustained in 2016, however. Both
house prices and rents have continued to increase across the country, but the rate of increase has
evened off in some areas. Indicators of future supply are positive in terms of the availability of land for
residential construction, the reduction in the number of unfinished housing developments, increases
in planning permissions granted and reported commencement activity.
2.1 Completions
All housing sectors
Figure 2.1 shows the historic trend in housing
completions from 1971 to 2016. The trend shows an
average output of about 20,000 to 25,000 new homes
per year up to the mid-1990s when output increased
considerably for 15 years, before reducing to an average
of 10,000 homes per year for the last five years.
Figure 2.1: Estimated housing completions, 1971-2016
100,000
90,000
80,000
70,000
60,000
50,000 Source: Department of Housing, Planning, Community
and Local Government. *Direct comparisons cannot be
40,000
made between pre 2009 and post 2010 data onwards.
30,000 Up to 2010, completions relating to long term voids and
20,000 demountables were included as new build completions.
*Provisional figure for 2016.
10,000
0
'71 '73 '75 '77 '79 '81 '83 '85 '87 '89 '91 '93 '95 '97 '99 '01 '03 '05 '07 '09 '11 '13 '15 '16*
8 Housing AgencyThis completion data is based on the number of While end of year figures are not yet available for
dwellings connected to the ESB networks over the 2016, by the middle of 2016, local authorities and
period, and is therefore an estimate. In 2015, 12,666 Approved Housing Bodies had built or bought over
such new housing units were recorded, an increase 660 housing units.5 By the end of the third quarter
of 15 per cent on 2014. The majority of these homes of 2016 there were 13,607 active Housing Assistance
were private housing units, with 465 social houses.1 Payment (HAP) tenancies. A further 929 households
Preliminary figures for 2016, indicate that 14,932 transferred from Rent Supplement to the Rental
completions were recorded last year, an increase of Accommodation Scheme (RAS) during the first three
18% on the previous year. quarters of 2016. Under the Social Housing Current
Expenditure Programme (SHCEP)6 delivery of social
In both 2015 and 2016, the largest category of new
housing is supported by providing financial support
homes was detached houses, followed by scheme
to local authorities and Approved Housing Bodies
houses/group developments and then apartments.2
for the long term leasing of houses and apartments
In 2015, a little over one-fifth (23%) of recorded
from private owners and developers. 638 housing
completions were located in Dublin, while in 2016
units were supported by SHCEP during the first three
this had increased to 28%. The demand for housing is
quarters of 2016.7
particularly acute in Dublin. It has been estimated that
60 per cent of the additional housing will be needed
in Dublin and the remaining Dublin commuter belt,
2.2 Residential sales trends
Cork and Galway.3
Stock on the market
Social housing completions
Coming from a low base, 2015 represented the
2015 was the first full year of implementation of the
fourth successive year where the annual number of
government’s Social Housing Strategy. Exchequer
residential sales transactions increased compared to
Funding for Social Housing in 2015 was €800
the activity recorded in the previous twelve months
million, an increase of €210 million on 2014. In that
(see Figure 2.2). The total number of market-based
year, approximately 1,000 homes were acquired or
annual property transactions across the State in 2015
constructed by local authorities, and a further 350
was three times greater than the level of completed
were provided by Approved Housing Bodies under
sales recorded over the course of 2011, a low point
the Capital Assistance Scheme, 2,700 vacant social
in terms of property market activity. The recovery in
housing dwellings were also returned to use and
activity from 2011 to 2015 was broad based, with all
close to 9,000 extra units were provided through the
regions experiencing an increase in the number of
current expenditure programme, including 5,680
market sales (see Table 2.1).
homes provided through the new Housing Assistance
Payment.4 In addition, by the end of December 2015, The months to November 2016, however, saw
NAMA had facilitated the delivery of over 2,000 social a decline in the total number of market-based
housing properties. residential property transactions completed - down
1 | http://www.cso.ie/px/pxeirestat/Statire/SelectVarVal/Define.asp?Maintable=HSA01&Planguage=0
2 | Department of Housing, Planning, Community and Local Government– Construction Activity Statistics (http://www.housing.gov.ie/housing/social-
housing/social-housing-output-2015)
3 | Morgenroth, E. (2014a). ‘Modelling the Impact of Fundamentals on County Housing Markets in Ireland’, MPRA Paper No.57665
4 | Social Housing Output in 2015 (http://www.environ.ie/housing/social-housing/social-housing-output-2015)
5 | This includes units acquired under Part V, Planning and Development Act 2000-2008 for local authority rental purposes.
6 | Formerly known as the Social Housing Leasing Initiative
7 | http://www.housing.gov.ie/housing/social-housing/social-and-affordble/overall-social-housing-provision
National Statement of Housing Supply and Demand 2016 and Outlook for 2017-18 92,463 (-6.5%) compared to the opening 11 months Table 2.1: Regional distribution of executed property market
transactions as a % of total annual activity, 2010 – 2016
of 2015. A decline in the number of transactions
occurred in every region over this period. The 1,271
‘10 ‘11 ‘12 ‘13 ‘14 ‘15 ‘16
(-10.2%) fall in transactions across Dublin in 2016
Dublin 38 35 37 36 32 30 32
relative to the preceding year is notable, as sales in
South-West 13 14 14 13 14 15 14
the Dublin region typically account for around one-
third of the annual number of transactions across the Mid-East 14 13 13 14 14 14 13
country—see table 2.1 for details. South-East 8 9 9 9 9 9 9
West 7 8 8 9 9 10 9
The decrease in market activity may, in part, be due
Mid-West 8 9 8 8 8 9 9
to a decline in the supply of residential properties for
Border 6 7 6 7 7 8 8
sale. The most recent Daft.ie House Price Report8 for
Midland 5 5 5 5 6 6 6
the fourth quarter of 2016 shows a decrease in the
supply of properties advertised for sale in the market Source: Central Statistics Office, 2016 HPM02
and reports that this is the lowest recorded since
January 2007.
House price trends
Figure 2.2: Number of executed property market transactions,
2010 – 20169 Residential property prices continued to increase over
50,000
the last two years. Figure 2.3 shows trends in property
prices since 2005. At a national level it demonstrates
the peak in 2007, the decline to mid-2012 and the
40,000 increase since then. Following a steep fall, residential
property prices began to increase in Dublin over the
second half of 2012, with a price recovery apparent in
30,000 the regions outside Dublin from the second quarter of
2013 onward. In the early stages of the rebound, the
rate of increase in prices in Dublin was considerably
20,000 higher compared to areas outside of the capital.
However, for much of the past two years, price growth
has generally slowed in Dublin while outside of Dublin
10,000
has experienced double digit year-on-year price
growth. Meath, Galway, Kildare, Clare and Louth have
0 experienced particularly high rates of price rises over
‘10 ‘11 ‘12 ‘13 ‘14 ‘15 ‘16* this period.10
Source: Central Statistics Office, 2016 HPM06
The CSO Residential Property Price Index reported
that, in the year to November 2016, residential
property prices at national level increased by 8.6%.
This compares with an increase of 6.9% in the year to
October and an increase of 4.2% in the twelve months
to November 2015.
8 | http://www.daft.ie/report/q4-2016-daft-house-price-report-2016.pdf
9 | Central Statistics Office, 2016 HPM02
10 | myhome.ie Property Report Q4 2015 Pg 3 (http://media.myhome.ie/content/propertyreport/MyHome-Property-Report-Q4-2015.pdf )
10 Housing AgencyIn Dublin, residential property prices increased below
the national average - 5.9% in the year to November.
Dublin house prices increased 5.6%. Whereas
apartments increased 9.6% in the same period.
Residential property prices in the Rest of Ireland (i.e.
excluding Dublin) were 12.8% higher in the year to
November. Overall, the national index is approximately
one-third (31.5%) lower than its highest level in 2007.11
Figure 2.3: Residential Property Price Index Jan 2005 to November 2016
140
130 National
Max=135
120 Dublin
110 National excluding Dublin
100
90
80
Max=129.3
70
60
50
Min=55.2 Min=56.2
40
2005 2006 2007 2008 2009 2010 2011 2012 2013 2014 2015 2016
Source: CSO, Residential Property Price Index HPM06 (Chart covers the opening eleven months of 2016).
The average (mean) residential property sale price
across all counties for executed marked based
transactions was €244,874 in November 2016—an
increase of €22,903 (10.3%) compared to the same
month in 2015. The most recent data for November
2016 indicates average prices are highest in Dublin
(€393,649) and the mid-east, particularly Wicklow and
Kildare (€284,868 and €250,839 respectively). Over the
same period, average prices in Dublin were 4.6 times
greater than the mean sale price in Longford (the
county with the lowest average sale price).
11 | http://www.cso.ie/en/releasesandpublications/ep/p-rppi/residentialpropertypriceindexnovember2016/
National Statement of Housing Supply and Demand 2016 and Outlook for 2017-18 112.3 Rental trends
The private rental sector has an increasingly important
role to play in accommodating a diverse range of
households. Since 1991, the number of households
living in rented accommodation has increased from
17.9% to just under 28% by 2011.12
The Residential Tenancies Board Rent Index (see figure
2.4 and 2.5) shows the movement in standardised,
mix adjusted, rents since 2007. Rents for houses and
apartments fell considerably across all regions from
2007 to 2010. The decline in prices was particularly
sharp in Dublin during this time. However, the period
of decline in monthly rents was shorter lived in the
capital; prices started to increase in Dublin mid-way
through 2011, with prices outside Dublin continuing
to fall until the end of 2012. The latest data from the
Rent Index (Q3 2016) shows that rents in Dublin are
now 5 per cent above their previous peak at the end
of 2007, while outside Dublin rents are 7.3 per cent
below peak levels.
Figure 2.4 Standardised monthly rent in Dublin, 2007-2016
1,500
1,250
1,000
€ 750
500 Aggregate
Apartments
250 Houses
0
2007 2008 2009 2010 2011 2012 2013 2014 2015 2016
Source: RTB Rent Index, Quarter 3, 2016
12 | Norris, M (2013) Social Housing, Disadvantage and Neighbourhood Liveability
12 Housing AgencyFigure 2.5 Standardised monthly rent outside Dublin, 2007-2016
1,500
Aggregate
1,250
Apartments
1,000 Houses
€ 750
500
250
0
2007 2008 2009 2010 2011 2012 2013 2014 2015 2016
Source: RTB Rent Index, Quarter 3, 2016
Year-on-year, rents nationally were 8.6% higher in Q3 2.4 Indicators of Future Housing Supply
2016 compared to Q3, 2015; up from €897 to €973.
Residential land availability
Nationally, rents for houses were 7.4% higher over
the period, while apartment rents were 9.9% higher The Residential Land Availability Survey 2014 was
than in the same quarter of 2015. Annual growth in published in February 2015, and provides data in
the Dublin market was 7.1% between Q3 2015 and respect of residentially zoned land available for
Q3 2016 – apartment rents increased by 9.6%, while housing nationally as of 31st March 2014.14 The survey
house rents were up by 3.3%. examined the land in two stages.
The Daft.ie rental report for Q3 2016 highlighted the Stage 1 are undeveloped residentially zoned
issue of the lack of supply of rental properties – with lands, regardless of the sequence of the
less than 3,700 advertised on 1st October 2016 – development of those lands or phasing
12% fewer than 12 months earlier.13 The number of under local authority development plan core
tenancies registered with the RTB, however, has not strategies.
witnessed this downward trend. Over the last 6 years
approximately 100,000 new tenancies were registered Stage 2 are the lands identified in stage 1 that
by the RTB each year and by Q3 2016 (end August are potentially available for development in
2016) 75,116 new tenancies had been registered by relation to the order of priority or phasing
the Board. The total number of tenancies registered indicated under the relevant Development
now stands at 324,222, representing 174,158 landlords plan or Local Area Plan period.
and 705,183 occupants.
The Survey identified 27,363 hectares with the
There have been a number of recent policy and legal potential for 611,302 dwellings at stage 1 and a
developments in relation to the private rented sector, further 17,435 hectares with the potential for 414,712
which are summarised in the Appendix. dwellings at stage 2.
13 | Daft.ie Rental Report Q3 2016
14 | http://www.housing.gov.ie/planning/residential-land-availability/residential-land-availability-survey
National Statement of Housing Supply and Demand 2016 and Outlook for 2017-18 13Dublin Housing Supply Coordination Taskforce Within the unfinished 668 developments there were:
The Dublin Housing Supply Coordination Taskforce 19,118 dwellings which were complete and
(DHSCT), which was established to focus on occupied
addressing housing supply-related issues reported
2,542 dwellings which were complete and
that at the end of 2015, there were planning
vacant
permissions in place for 29,770 houses and
apartments in developments of ten or more units in 8,105 units which were in various stages of
the four Dublin local authority areas (Fingal, Dublin completion
City Council, South County Dublin and Dun-Laoghaire
Rathdown). This was made up of 13,670 houses and 18,376 units which had not been started.
16,100 apartments.
Planning permissions granted
The most recent data supplied by local authorities to
Data gathered by the Central Statistics Office show
the Dublin Housing Supply Coordination Taskforce
that there were a total of 4,269 planning permissions
shows the cumulative total of sites with planning
granted for a total of 13,044 dwelling units in 2015. This
permission granted, stood at 36,959 units by the third
was an increase of 76% on the number of dwelling
quarter of 2016, covering 17,651 houses and 19,308
units granted permission in 2014 (7,411).17 Based on
apartments.15
data for the first three quarters of 2016, the trend would
Unfinished housing appear to be continuing upwards. By end September
2016, planning permissions were granted for a total of
The Government’s Action Programme on Unfinished 12,046 new housing units, compared to 9,027 granted
Housing Developments was published in 2010 with a for the same period of 2015.18
commitment to publish a yearly progress report. The
2015 Annual Progress Report on Actions to Address The data in Figure 2.6 shows planning permissions
Unfinished Housing Developments, published in by housing type over the last six years. It shows
December 2015, contains the results of a survey a steady increase, over the last four years, in the
carried out in 2015 on unfinished developments.16 By number of planning permissions for houses in group
end 2015, the number of unfinished developments developments, and a substantial increase in the last
stood at 668, down from 3,000 in 2010. In 2015 there year in the number for apartments, while the number
were 324 housing developments removed from the of planning permissions for one-off houses is more
list as they were substantially complete. steady at about 3,000 per year.
15 | http://www.housing.gov.ie/sites/default/files/publications/files/housing_supply_coordination_task_force_returns_q3_2016.pdf
16 | Resolving Unfinished Housing Developments Annual Progress Report on Actions to Address Unfinished Housing Developments (Dec 2015) (https://
www.housing.ie/getattachment/Our-Services/Unfinished-Housing-Developments/2015-National-Housing-Survey/Progress-Report-on-UHDs-Dec-
2015-%28final%29.pdf )
17 | Table A Summary of Planning Permissions granted for New Dwelling Units( http://cso.ie/en/releasesandpublications/er/pp/
planningpermissionsquarter42015/)
18 | CSO Q1, Q2,Q3 2016 – Planning Permission Statistical Releases
14 Housing AgencyFigure 2.6 Planning permissions by number and type 2010 - 2015
8,000
7,000
6,000
No. Permissions
5,000
4,000
3,000
2,000
1,000
0
2010 2011 2012 2013 2014 2015
Houses in Group Developments One-Off Houses Apartments
Source: CSO (2016) Table 4 Summary of Planning Permissions Granted for new houses and apartments, Q1 2010 – Q4 201519
In 2015 there was a total floor area of 2,147,000 square Commencements
metres granted planning permission, an increase of
The Department of Housing, Planning, Community
57% on the floor area granted permission in 2014.
and Local Government publish data on residential
Table 2.2 provides a breakdown of permissions
commencements each year. A commencement notice
granted over the last nine years.
is a notification to a building control authority that a
Table 2.2 Number of planning permissions and total floor area person intends to carry out works to which Building
granted 2007 – 2015
Regulations apply. The notice must be given to the
authority not more than 28 days and not less than
Year Planning Total Floor
Permissions Area (000 Sq. 14 days before the commencement of work. It is an
Granted Metres) indicator of construction activity, but of its nature not
2007 22,253 12,206 definitive.
2008 17,491 9,837 In 2015, notification of commencement of building
2009 10,380 5,928 works on 8,088 residential units was recorded
2010 6,347 2,861 – up 5% on the previous year. The most recent
2011 4,767 1,981 commencement figures for 2016 show a continuation
2012 3,643 1,199 of this trend with the overall number of residential
commencements in the first eleven months of 2016
2013 3,316 1,305
being 11,320.21
2014 3,606 1,366
2015 4,269 2,147
Source: CSO, various years20
19 | Table 4 Summary of Planning Permissions Granted, Q1 2010 – Q4 2015 (http://cso.ie/en/releasesandpublications/er/pp/
planningpermissionsquarter42015/)
20 | CSO Table 1 Summary of Planning Permissions granted, Q1 2008 – 2015 (http://cso.ie/en/releasesandpublications/er/pp/
planningpermissionsquarter42015/)
21 | Department of Housing, Planning, Community and Local Government Statistics (http://www.housing.gov.ie/housing/statistics/
house-building-and-private-rented/construction-activity-starts )
National Statement of Housing Supply and Demand 2016 and Outlook for 2017-18 15Chapter 3
Current and future housing demand
This Chapter focuses on the underlying causes of housing demand. Using information from Census
2016, it shows population growth around our major cities and age profile changes – all of which have
implications for the location and type of housing needed. Other changes, such as the increase in the
number of households renting and statistics on vacant properties are presented. It is estimated that
a minimum of 81,118 homes are needed (45,000 of these are needed in the five major urban centres)
in the five-year period 2016 – 2020 to meet demand in our urban areas. This Chapter concludes by
reporting on trends in social housing need, and draws particular attention to the rise in the number of
homeless households.
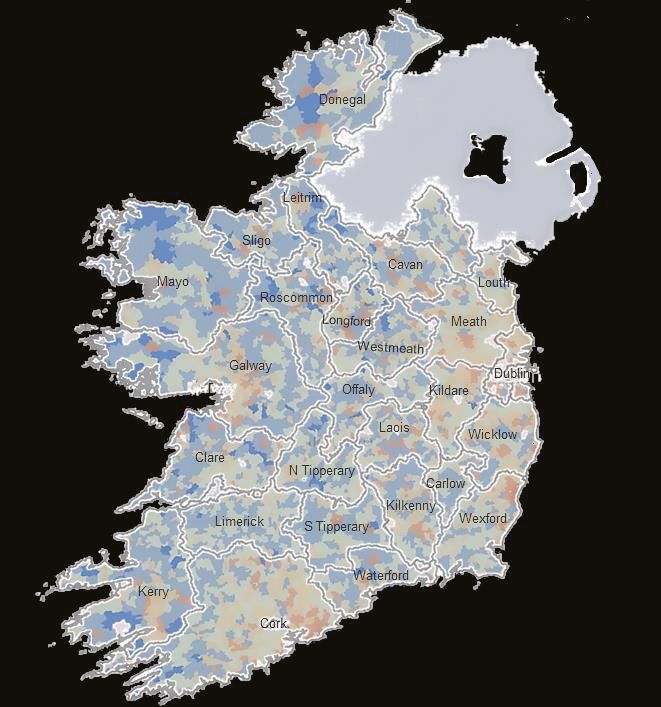
3.1 Population and household formation The population change by county over the last five
years illustrated by the map in Figure 3.1 shows
There are 4.76 million people living in Ireland, with
population growth in the east of the county and decline
initial figures from Census 2016 showing an increase
in parts of the midlands, counties along the border, and
of 169,724 people (3.7%) residing in the country
the west—with the exception of Cork and areas close to
over the last five years. Population change across
Galway city. This pattern is consistent with a longer-term
the country varied widely in the five-year period
trend decline in the share of the population living in the
between the Census 2011 and Census 2016. Dublin,
counties in the Border and West regions and a larger
the commuter belt counties of Meath, Kildare and
share of people living in Dublin and the Mid-East.
Laois, and the cities of Cork and Galway were among
the fastest growing areas in the state. Over the same These broad population trends have important
period counties in the West, Mid-West and Border implications for current and future housing demand.
regions had the highest level of estimated net outward
migration as a proportion of the total population in
each area—Donegal lost just over 8 people per 1,000
of the population to net migration, for instance—and
experienced the lowest level of overall population
growth.
16 Housing AgencyFigure 3.1: Population Change by County 2011 to 2016
10%
Source: Central Statistics Office (2016) Preliminary Results from Census 2016. Map taken from the All Island Research Observatory
Compared to many other countries in Western Europe, to the EU 15 average. Approximately 28.2% of the
Ireland has a relatively young population. Figure 3.2 population in Ireland is under the age of 19, compared
divides the total population into five age groups, to a weighted average of 21% in this age cohort across
comparing the age profile of Ireland’s population the EU 15 countries. The share of people in the 20-
in 2015 to the average age profile across the EU 15 34 age group and those between 35-55 years old is
countries weighted by each country’s share of the marginally higher in Ireland relative to the average age
overall population in the bloc. As is evident from the profile across the same group of countries.
Figure, Ireland has a higher proportion of younger
people (individuals aged 19 years old or less) compared
National Statement of Housing Supply and Demand 2016 and Outlook for 2017-18 17At the other end of the lifecycle, Ireland has a smaller Table 3:1: Forecast change in the age profile of the population,
2016 – 2021
proportion of people aged 75 or over compared
to the EU 15 average – approximately 5.4% of the
2016 2021 Change Change
population in Ireland are in this age group compared
(No) (%)
to an average of 9.5% across the comparator countries
in Europe. However, the coming years will see an 0-19 1,348.5 1,414.8 66.32 4.92
increasing proportion of the population in Ireland 20-34 870.2 873.7 3.47 0.40
move into the 55 and over age group. Approximately 35-54 1,357.4 1,404.1 46.70 3.44
55,000 more people in Ireland are forecast to be over 55+ 1,127.9 1,294.2 166.30 14.74
75 years of age by 2021, a 20.9% increase on the Of which 260.9 315.5 54.64 20.94
estimated 260,900 people currently in this age group. 75+
The CSO forecast the number of people aged 55 years
Source: CSO (2013) Population and Labour Force Projections 2016-2046
or older will be the fastest growing age group by 2021
– see Table 3.1 The tendency to form new households, along with
Figure 3.2: Age profile of the population in 2015 – Ireland & the trends in the size of households impacts on the
weighted average across the EU 15 number and type of homes required to meet demand.
The process of household formation is linked to,
among other things, the age profile of the population,
40
the degree of choice offered by the existing housing
EU
stock and the affordability of meeting housing costs.
Ireland Ireland has traditionally experienced lower rates of
30
household formation than is seen in the UK and the
rest of Northern and Western Europe; however, the
20 number of households in the State has increased
in each Census period since 1926 and this trend is
expected to continue. From 2006 to 2011 the number
10 of households in the country increased by 187,112.
However, more recently, household formation has
fallen behind population growth—from 2011 to 2016
0 the number of households increased by just 3%, while
0-19 20-34 35-54 55-74 75+ the population increased by 3.7%.22
Source: European Commission (2016) Population and Labour Force Average household size has decreased steadily since
Projections 2016-2046 1966, though the number of persons per household
in Ireland tends to be greater than the average
household size in many of the countries in Europe.
Figures from Census 2011, show approximately 7 out
of every 10 households in the state contain 3 people
or less. Data from the Quarterly National Household
Survey for the second quarter of 2016 indicates
the proportion of households with 3 people or less
remains at approximately 70% of all households, a
significant shift from the 1980s when just over half of
22 | Census of the Population 2016 – Preliminary Results
18 Housing Agencyall households in the state at that time contained 3
or fewer individuals. It is expected that the number
of smaller households will increase as a proportion
of all household composition types over the coming
five years. This increase in the proportion of smaller
households in towns and villages across the country
is behind much of the need for new homes over the
coming years and is discussed later in this chapter.
Figure 3.3: Number of persons per household across the state as a percentage of the total number of households
recorded by the Census, 1986 - 2016
40
1 person 2 persons 5 or more persons
35 3 persons 4 persons
30
25
% 20
15
10
5
0
1986 1991 1996 2002 2006 2011 2016
Source: CSO (2013) Private Permanent Households (Number) by Census Year, Number of Persons and Province County or City.
Figures for 2016 taken from QNHS, Q2 2016, CNA29
3.2 Housing stock
Preliminary results from Census 2016 record 2,022,895
dwellings in the state, an increase of just under
1% in the total stock of homes compared to the
figures recorded in Census 2011. The total number
of occupied households increased by 2.9% over the
same period, with the number of vacant dwellings
falling by 31,698, a 13.7% decrease, over the five-year
period (see Table 3.2).
Table 3:2 Composition of the housing stock by occupancy status, Census 2011 and Census 2016
2011 2016 Change 2011 Change 2011
- 2016 (No) - 2016 (%)
Occupied households 1,669,180 1,718,465 49,285 2.95
Other vacant dwellings 230,056 198,358 -31,698 -13.78
Temporarily absent 45,283 44,868 -415 -0.92
Vacant holiday homes 59,395 61,204 1,809 3.05
Total 2,003,914 2,022,895 18,981 0.95
National Statement of Housing Supply and Demand 2016 and Outlook for 2017-18 19A considerable proportion of the overall housing stock Figure 3.4 presents both the number of vacant units
is reasonably new; more than one in four occupied in each county and the proportion of the stock these
dwellings in Ireland were built in the decade leading up units represent in each area, known as the vacancy rate.
to Census 2011. Over two-thirds of housing was built in Many of the counties with the highest vacancy rates
the 40 years between 1971 and 2011. Just over a third are in areas around the western and border regions
of the occupied housing stock (567,602 homes) is based that have experienced some of the highest levels of net
in-or-around the five main urban areas in the country. outward migration over the past five years (see map
The number of people living in rural areas in Ireland 3.1). However, the issue of vacant homes goes beyond
is higher than in most EU 15 countries with 29% of oversupply of housing in particular parts of the country.
occupied dwellings in parts of the country where there While a degree of vacant stock is to be expected at
is less than 50 inhabited houses in the local area. That a given point in time due to, among other things,
a relatively large share of the total number of houses in transactions or refurbishments taking place, the vacancy
the state is located in rural areas may help explain why rate is above what is expected in areas around major
the number of rooms per person in homes in Ireland urban centres of high demand.23 Pillar Five of the Action
is, on average, greater than in many other countries in Plan for Housing and Homelessness establishes a goal
Europe and may partly account for the strong growth in of using the existing housing stock to the maximum
owner-occupied housing in Ireland up to the 1990s. degree possible and will be launched in the coming
months.
Vacant homes
A certain level of vacant properties is normal in a
healthy housing market, with houses often being
temporarily vacant between tenancies and when being
renovated. However, long-term vacant housing can
have negative impacts on local areas and communities
and represents an inefficient use of valuable resources.
Preliminary results from Census 2016 records the
number of vacant dwellings at 198,358 (excluding
holiday homes), a decrease of 31,698 vacant units
compared to the figures from Census 2011. This is
almost one-tenth of the total stock.
23 | In England, for example, the vacancy rate is 2.5%.
20 Housing AgencyFigure 3.4 The number of vacant homes on a county-by-county basis, 2016 (vacancy rate in brackets).
Carlow 9.1%
Offaly 8.9%
Longford 16.1%
Monaghan 12.0%
Laois 9.6%
Kilkenny 8.1%
Wicklow 6.6%
North Tipperary 12.0%
Leitrim 20.8%
Westmeath 10.9%
South Tipperary 10.9%
Louth 8.2%
Kildare 6.2%
Sligo 15.3%
Meath 7.1%
Cavan 15.3%
Roscommon 17.9%
Waterford 10.7%
Wexford 9.3%
Clare 11.5%
Limerick 10.2%
Kerry 13.7%
Mayo 18.1%
Donegal 14.8%
Galway 12.0%
Cork 9.2%
Dublin 6.6%
0 5,000 10,000 15,000 20,000 25,000 30,000 35,000 40,000
Source: CSO (2016) Housing Stock and Vacant Dwellings 2011 to 2016 by Province County or City, Census Year and Statistic, EP007
The number of vacant units decreased in all counties
over the last five-years, with the greatest reduction in
the number of vacant homes occurring in Dublin, Cork
and Galway (homes in these counties account for a
large proportion of the national stock) – see Figure 3.5.
National Statement of Housing Supply and Demand 2016 and Outlook for 2017-18 21Figure 3.5 Change in the number of vacant units in each county, 2011 and 2016
14,000
12,000
10,000
8,000
6,000
4,000
2,000
0
Dublin
Cork
Galway
Kildare
Meath
Louth
Wexford
Kerry
Wicklow
Limerick
Waterford
Kilkenny
Carlow
Cavan
Laois
Westmeath
Clare
Mayo
South Tipperary
Longford
Offaly
Donegal
Monaghan
North Tipperary
Sligo
Roscommon
Leitrim
Source: CSO (2016) Housing Stock and Vacant Dwellings 2011 to 2016 by Province County or City, Census Year and Statistic, EP007
3.3 Tenure
Owner occupation grew in popularity as the main
tenure from the middle of the last Century and, by
1991 was the main tenure type accommodating
four in every five households. More recently renting,
particularly in the private sector, has begun to
resurge.24 Figures from the CSO show that in 2011
just under 28% of all households were in rented
accommodation, an increase of 9.8 percentage points
compared to the corresponding figure from 1991 (see
table 3.3). The most recent data from the Survey on
Income and Living Conditions indicates this trend has
continued with 31.5% of all households in the rental
sector in 2014. This shift over the past 25 years has
brought Ireland broadly in line with the tenure mix
across the EU 15 countries (see Figure 3.5).
Table 3.3: Composition of permanent private households by tenure type in Ireland
1946 1961 1971 1981 1991 2002 2006 2011
Owner-Occupied 52.6 59.8 70.8 74.7 80.0 79.8 77.2 70.8
Renting 42.6 35.6 26.8 22.6 17.9 18.5 21.3 27.7
Other 4.7 4.6 2.4 2.6 2.1 1.7 1.5 1.6
Source: Norris *(2013)
24 | David Duffy, David Byrne, John FitzGerald (2014) Quarterly Economic Commentary – Spring 2014, Alternative Scenarios for New Household
Formation in Ireland
25 | CSO (various) and Norris, M (2013) Social Housing, Disadvantage and Neighbourhood Liveability
22 Housing AgencyFigure 3.6: Comparison on tenure type across countries in the EU 15, 2014 26
100
Owner Rented
80
60
40
20
0
ES PT EL FI IT LU BE SE IE NL FR UK DK AT DE
Source: European Commission, Eurostat, Survey on Income and Living Conditions 2014
The tenure mix has been relatively stable in rural areas
since the 1970s. Much of the overall shift towards
renting is being driven by a significant increase in the
proportion of households renting in the main urban
areas of the counties—Dublin, Cork, Galway and
Limerick. In Dublin city, for instance, roughly 48% of
those living in the area are renting. With this in mind,
it is possible that only half of any new stock added in
the capital will be purchased and lived in by owner-
occupiers with the remaining 50% rented either
privately or with state-support.
A significant change in the tenure mix is underway
and appears likely to continue over the coming years.
This change may be felt most acutely by those seeking
to live near centres of employment opportunity. Part
of the growth in the rented sector is also due to the
increasing role it plays in accommodating households
requiring state support with their housing costs.
Approximately half of households in the private rented
sector receive some state support with their rent, at an
annual cost to the Exchequer of approximately €500
million.27
26 | European Commission, Eurostat, Survey on Income and Living Conditions 2014
27 | Social Housing Strategy 2020 Support, Supply and Reform (http://www.merrionstreet.ie/en/ImageLibrary/Social_
Strategy_Document_20141126.pdf )
28 | Future Analytics (2016) Housing Supply Requirements in Ireland’s Urban Settlements 2016 – 2020.
National Statement of Housing Supply and Demand 2016 and Outlook for 2017-18 233.4 Minimum Future Housing Requirements It is important to note that while this research
models for housing supply, it does not consider the
Research recently carried out for the Housing Agency
full extent of housing delivery or ‘pent-up demand’.
on the projected demand for housing in urban
Identified minimum housing requirements are based
settlements (500 people or more) resulted in an
on projections of natural population growth and
estimate of a minimum requirement of 81,118 homes
migration utilising the cohort component model
between 2016 – 2020.28 This estimated demand of
methodology in addition to an assessment of trends
new homes is based on the existing housing supply,
in person-household size and changes in housing
current stock availability and demographic trends.
stock informed by Census 2016 data. Other studies
The model factors in expected changes in each of
have estimated the level of future demand for housing
these areas over the coming five-years to produce
on the basis of household formation rates and project
estimates of minimum need in settlements with a
that structural demand for housing is likely to increase
resident population of 500 persons or more. In total,
at a steady rate in the coming years before reaching
445 areas across Ireland were assessed, with previous
approximately 30,000 units per annum by 2024.29
housing demand projections updated on the basis of
the preliminary Census 2016 data released by the CSO A primary driver of the need for new homes comes
in July last year. from the projection that smaller households will
continue to make up an increasing share of the total
The study estimates 44,902, homes are needed in
occupancy composition in towns and cities across
the five major urban centres, accounting for 55.4%
the country. While the profile of occupancy shift
of the overall number of dwellings needed over the
varies between each urban settlement, with some
five-year period. There is a pronounced minimum
of those identified showing strong shifts to one and
requirement of 33,109 homes in Dublin City and the
two-person households, whereas others show a
surrounding suburbs during this time, or an average
resurgence in three-person households, an overall
annual requirement of 6,622 homes. While demand is
move towards a reduction in the number of larger
concentrated in the main urban areas of the county,
households and an increase in the number of homes
the report identifies 10 towns outside the major
containing one and two-persons is expected to
cities facing a minimum requirement of at least 800
continue. This dynamic is occurring incrementally in
homes from 2016 to 2021; and over 30 towns with a
many towns and villages across the county, and over
minimum requirement of more than 300 homes each
an extended period it can result in a considerable
(see Figure 3.7 for more details).
change in the housing type needed to satisfy demand.
29 | Duffy, D. et al (2016) “Demographic Change, Long-Run Housing Demand and the Related Challenges for the Irish Banking Sector” in Ireland’s
Economic Outlook: Perspectives and Policy Challenges
24 Housing AgencyFigure 3.7: Housing Supply Requirements in Ireland’s Urban Settlements, 2016 - 2020
Supply Requirements: Urban Settlements
Map Key
Urban Settlements
Local Authorities
Dublin City & Suburbs Minimum Requirement, 2016-2020
10k
8k
6.6k
6k 7.5k
6.7k 7.0k
Letterkenny 4k 5.7k
6.3k
Shortfall of 1,622 Homes 2k
0k
2016 2017 2018 2019 2020
Minimum Housing Requirement (MHR)
Annual Average MHR
Sligo
Shortfall of
1,111 Homes
Dublin City
Galway City Region
& Suburbs
Shortfall of 2,316 Homes Shortfall of 35,242 Homes
Ennis
Shortfall of 1,443 Homes
Limerick City & Suburbs
Shortfall of 3,436 Homes
Tralee
Waterford City & Suburbs
Shortfall of
1,491 Homes Shortfall of 713 Homes
Cork City
Region
Shortfall of 8,434 Homes
Cork City & Suburbs Minimum Requirement, 2016-2020
2.0k
1.5k
1.1k
1.0k
1.15k 1.25k
0.99k 1.07k
0.5k 0.87k
0.0k
2016 2017 2018 2019 2020
Minimum Housing Requirement (MHR)
Annual Average MHR
National Statement of Housing Supply and Demand 2016 and Outlook for 2017-18 253.5 Social Housing Requirements The number of families accessing emergency
accommodation rose from 884 in January 2016 to
The Summary of Social Housing Assessments brings
1,205 in December 2016 and the number of children
together information provided by local authorities on
in emergency accommodation increased from 1,830
households in their functional area qualified for social
to 2,505 over this period.32
housing support whose social housing need is not
being met.30 Table 3.4 provides a breakdown of the 4,643 adults
(aged 18+) in emergency accommodation during the
The Summary of Social Housing Assessments 2016,
week 19th to 25th December 2016, by gender and
identified 91,600 households assessed as qualified and
age. Though all regions have experienced an increase
in need of housing support as of 21 September 2016.
in the number of adults presenting as homeless in the
The 2016 figure is an increase of 1,728 (+1.9%) from the
recent months, the problem is concentrated in Dublin.
89,872 qualified households recorded in the previous
There were 3,162 adults, 68% of the total number
social housing assessment in 2013. A total of 35,572
of homeless persons over 18 years of age across
households that qualified for social housing support
the state, living in the capital towards the end of
were in one of the four Dublin local authorities.
December of this year. Over the same week Cork and
Of the households assessed as qualified and in need Limerick had the next highest incidences of adults in
of housing support, two-thirds (67%) were dependent emergency accommodation with 258 and 257 adults
on social welfare as their only source of income, while respectively.
13.3% had income from employment only. The top
The majority of people in local authority managed
three reasons for basis of need for social housing
emergency accommodation are aged between
support were: dependent on rent supplement
25 years and 44 years. In the week ending 25th
(43%), unsuitable accommodation due to particular
December 2016, 2,829 (61%) adults in emergency
household circumstances (23%) and involuntary
accommodation were in this age bracket. There were
sharing (13%).31
2,687 men and 1,956 women accessing emergency
Homelessness accommodation in December. Women made up 42%
of the homeless adult numbers in December.
Figures for the numbers of people presenting
as homeless increased over 2015 and into 2016 The breakdown by type of accommodation accessed
official data from the Department of Housing, in the week 19th to 25th December is split into 2,268
Planning, Community and Local Government is in Private Emergency Accommodation (PEA) which
produced by local authorities through the Pathway includes hotels and B&Bs and other residential facilities
Accommodation and Support System (PASS) and used on an emergency basis, 2,205 in Supported
captures details of individuals in state-funded Temporary Accommodation (STA), which includes
emergency accommodation, arrangements that are hostels and onsite professional support and 202 in
overseen by local authorities. The total number of Temporary Emergency Accommodation (TEA), which
people in emergency accommodation at the end is emergency accommodation with no (or minimal)
of December 2016 was 7,148 individuals, with 2,505 support.
(35%) of these individuals under 18 years of age.
30 | https://www.housingagency.ie/Housing/media/Media/Publications/Summary-of-Social-Housing-Assessment-Needs-2016.pdf
31 | https://www.housingagency.ie/Housing/media/Media/Publications/Summary-of-Social-Housing-Assessment-Needs-2016.pdf
32 | http://www.housing.gov.ie/sites/default/files/publications/files/homeless_report_-_december_2016.pdf
26 Housing AgencyTable 3.4: Breakdown of homeless persons (aged 18+) in emergency accommodation December 2016
Region Total Homeless Gender Age groups
in region
N. Male Female 18 - 24 25 - 44 45 - 64 65+
Dublin 3,162 1,713 1,449 533 1,987 599 43
Mid-East 210 123 87 28 127 48 7
Midlands 59 32 27 17 28 13 1
Mid-West 288 183 105 43 164 73 8
North-East 116 72 44 20 68 23 5
North-West 36 26 10 5 19 12 0
South-East 293 201 92 56 156 69 12
South-West 296 206 90 34 184 71 7
West 183 131 52 29 96 57 1
Total 4,643 2,687 1,956 765 2,829 965 84
Source: Department of Housing, Planning, Community and Local Government – Homelessness Report December 2016
The Dublin Region Homeless Executive carries out figure of €64.77 million, which was a 32% increase on
official counts on rough sleeping every six months. the amount provided in 2014.35
The street count confirms a minimum number of
A number of government departments and voluntary
people who are sleeping rough on the night in
bodies are working to enhance supports to individuals
question. A count of rough sleepers in the Dublin
experiencing homelessness or those at risk of
Region took place on the night of 22nd November
becoming homeless. For instance, the Department
2016. There was a total of 142 individuals recorded
of Social Protection exercises discretion on a case-
sleeping rough. This is a 15.5% decrease on the high
by-case basis for Rent Supplement clients that are at
point figure of 168 persons recorded as sleeping
risk of homelessness due to increasing rents. There
rough in the winter of 2014.33
were 4,500 households supported to remain in their
During the course of 2015, housing authorities assisted own homes in 2015 and a total of 6,000 households
in 2,322 sustainable exits from homelessness into since the protection of rent supplement tenancies
independent social housing or supported private began in 2014.36 The Tenancy Protection Service
rented tenancies. In the first three quarters of 2016, over operated by Threshold provides advice and support
2,000 such exits were recorded and estimates for the full to individuals, couples and families, living in either
year are for 2,700 sustainable exits from homelessness.34 the Dublin or Cork areas living in private rented
Funding for homeless services increased to €70 million accommodation experiencing tenancy problems and
in 2016, a rise of over €5 million on the 2015 exchequer whose tenancy is at risk.37 The service was contacted
33 | http://www.homelessdublin.ie/rough-sleeping-count
34 | http://www.housing.gov.ie/sites/default/files/publications/files/homeless_report_-_december_2016.pdf
35 | Social Housing Output 2015 (http://www.environ.ie/housing/social-housing/social-housing-output-2015)
36 | Social Housing Output 2015 (http://www.environ.ie/housing/social-housing/social-housing-output-2015)
37 | http://www.threshold.ie/housing-supports/dublin.html
National Statement of Housing Supply and Demand 2016 and Outlook for 2017-18 27by 9,028 households between its establishment in
June 2014 and end of September 2016 (27 months).
52% of these households were deemed to be at
risk of homelessness and progressed to active case
management. At end September 2016, 2,583 (or 29%
of all contacts) of these tenancies were protected.38
In Dublin the Dublin Region Homeless Executive
is responsible for the enumeration of people who
are homeless in Dublin. There were a total of 1,236
adults in Dublin taking up tenancies between January
1st 2016 and September 30th 2016. The Housing
Assistance Payment (HAP) accounted for 62% of the
moves. As can be seen in Figure 3.8 the number of
tenancies in the private sector exceeded the number
of tenancies in social housing in quarter two and three
of 2016.
Figure 3.8 Number of Adult Individuals in Dublin who have moved to housing since January 2014
450
413 412 411
400 Moves to Private Rented
Moves to Social Housing
350
Total Move-on to Tenancies 320
300
267
No. of Adult Moves
248 247 260
250 236 243 241 243
204 205 215
200 193 186
185
169
143 154 144
150 198
81
100 85 79
62 63
43 43 57 55
50 69
0
Q1 2014
Q2 2014
Q3 2014
Q4 2014
Q1 2015
Q2 2015
Q3 2015
Q4 2015
Q1 2016
Q2 2016
Q3 2016
Source: Dublin Region Homeless Executive39
38 | Dublin Region Homeless Executive 2016 Q3 Quarterly Report
39 | www.homelessdublin.ie
28 Housing AgencyChapter 4
Affordability
The First National Statement of Housing Supply and Demand highlighted the issue of affordability
as key to achieving a more balanced and sustainable housing system. This Chapter brings together
a number of indicators of affordability, some international and others based on domestic data.
International measures of home ownership affordability suggest that, with the exception of Dublin,
house prices in Ireland are, at worst, moderately unaffordable. This is borne out by domestic data
on average sales prices and net incomes and the proportion of disposable income used for housing
costs. This latter data shows that renters tend to have less disposable income and are more likely to
experience affordability problems. This Chapter also reports recent trends in relation to mortgage
arrears – while there has been a continuing reduction in the number of mortgages in arrears, almost
50,000 mortgages are in arrears of over two years and 147,000 have been restructured (principal
dwelling and buy-to-lets combined).
4.1 Housing costs as a percentage of income is due to the somewhat subjective nature of housing
need and difficulties associated with determining a
There is an obvious link between the amount of
level of housing cost that is sustainable for a household
income a household has and its likelihood of being
based on the level and degree of security of annual
able to afford its accommodation. Using income-to-
income, accumulated wealth and the household
expenditure ratios is a well-established method of
composition.
interpreting the financial challenge facing families in
meeting the cost of housing. Turning first to home ownership, ratios of household
income to house prices capture an element of the
This ratio approach can be used to assess challenges
affordability challenge facing individuals looking
facing households looking to purchase a home and
to buy. Based on transaction price data, the annual
to describe the financial burden involved in meeting
Demographia survey rates middle-income housing
the ongoing costs of renting or repaying a mortgage.
affordability using the ‘Median Multiple’—the
However, there is no universally accepted level of
ratio of the median house price to median gross
housing cost relative to household income. In part, this
40 | Demographia (2017) 13th Annual Demographia International Housing Affordability Survey: Rating Middle-Income Housing Affordability, Q3 2016
http://www.demographia.com/dhi.pdf
National Statement of Housing Supply and Demand 2016 and Outlook for 2017-18 29You can also read