The Feasibility of LED Lighting for Commercial Use - Worcester Polytechnic Institute
←
→
Page content transcription
If your browser does not render page correctly, please read the page content below
Project Number: HGV-2010-22090

The Feasibility of LED Lighting for Commercial Use

                 A Major Qualifying Project Report:
                      Submitted to the Faculty
                                of the
                  Worcester Polytechnic Institute
          In partial fulfillment of the requirements for the
                  Degree of Bachelor of Science in
                     Management Engineering
                                 by

                         Michael S. Horgan

                           Daniel J. Dwan
                        Date: April 1st, 2014

                             Approved:

                                          Professor Helen G. Vassallo, Major Advisor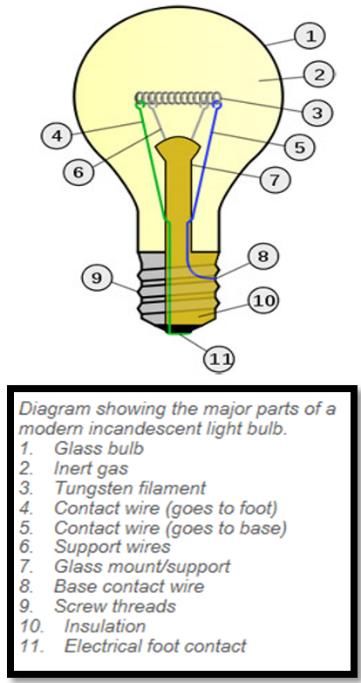
Table of Contents
Table of Figures ............................................................................................................................................. 2
List of Tables ................................................................................................................................................. 3
Abstract ......................................................................................................................................................... 4
Executive Summary....................................................................................................................................... 4
1.0 Introduction and Problem Statement ..................................................................................................... 5
2.0 Materials and Methods ........................................................................................................................... 6
   2.1 Literature Review ................................................................................................................................ 6
   2.2 Market Analysis ................................................................................................................................... 6
   2.3 Cost/Benefit Analysis .......................................................................................................................... 6
   2.4 Behavioral Analysis ............................................................................................................................. 7
3.0 Results ..................................................................................................................................................... 7
   3.1 Market Analysis ................................................................................................................................... 7
       3.1.1 Market Size and Segmentation .................................................................................................... 7
       3.1.2 Competition ................................................................................................................................. 9
       3.1.3 Growth and Recent Market Trends ............................................................................................. 9
       3.1.4 SWOT Analysis............................................................................................................................ 11
   3.2 Cost Benefit Analysis - LED vs. Incandescent, CFL, Linear Fluorescent ............................................. 12
       3.2.1 Incandescent Light Bulbs ........................................................................................................... 12
       3.2.2 Compact Fluorescent Bulbs ....................................................................................................... 14
       3.2.3 LED Light Bulbs ........................................................................................................................... 15
       3.2.4 Linear Tube Lighting – Fluorescent vs. LED ................................................................................ 15
   3.3 Cost-Benefit Analysis – Phi Gamma Delta Fraternity House............................................................. 16
   3.4 Survey Results ................................................................................................................................... 17
4.0 Discussion.............................................................................................................................................. 20
   4.1 Literature Review .............................................................................................................................. 20
       4.1.1 Brief History of Lighting ............................................................................................................. 20
       4.1.2 Mechanisms of Incandescent Lighting ....................................................................................... 21
       4.1.3 Mechanisms of Fluorescent Lights............................................................................................. 22
       4.1.4 Mechanisms of LED Lights.......................................................................................................... 22
       4.1.5 Current Trends in the lighting and LED market ......................................................................... 24
   4.2 Market Analysis ................................................................................................................................. 26
   4.3 Cost Benefit Analysis: LED vs. Incandescent, CFL, Linear Fluorescent .............................................. 26

                                                                                                                                                                  1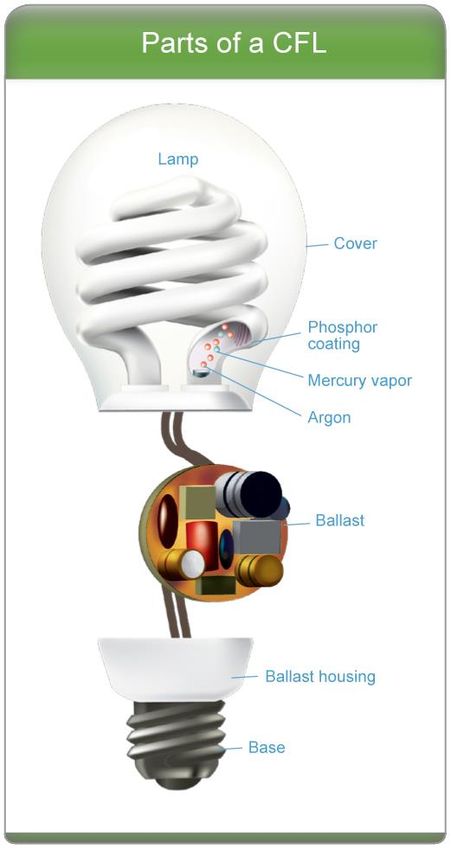
4.3.1 Standard Bulb Comparison: Incandescent, CFL, LED ................................................................. 27
4.3.2 Tube Lighting Comparison – T8 Linear Fluorescent, T8 Linear LED ........................................... 28
4.4 Cost Benefit Analysis - Phi Gamma Delta Fraternity House.............................................................. 28
4.5 Survey Discussion Table .................................................................................................................... 32
5.0 Conclusions and Recommendations ..................................................................................................... 33
5.1 Conclusions ....................................................................................................................................... 33
5.2 Recommendations ............................................................................................................................ 35
6.0 References ............................................................................................................................................ 36
7.0 Appendix ............................................................................................................................................... 38
7.1 Survey Appendices ............................................................................................................................ 38
7.1.1 Distributed survey and number of responses ............................................................................ 38
7.1.2 Survey Results ............................................................................................................................ 38
7.1.3 Graphs of Survey Questions ....................................................................................................... 41
7.2 Cost Benefit Analysis Appendices ..................................................................................................... 45
7.2.1 Energy Audit ............................................................................................................................... 45
7.2.2 Floor Plan of Phi Gamma Delta .................................................................................................. 45
7.3 Project Contributions ........................................................................................................................ 47
Table of Figures
Figure 1 Annual Electricity Consumption by Sector and Type of bulb.......................................................... 8
Figure 2 World Market for Lamps by Technology ...................................................................................... 10
Figure 3 Forecasted Retail price for all Replacement LED lamps................................................................ 11
Figure 4 SWOT analysis of LED lighting ....................................................................................................... 11
Figure 5 . Breakdown of Incandescent Bulb19 ............................................................................................. 21
Figure 6 Breakdown of Fluorescent bulb21 ................................................................................................. 22
Figure 7 Composition of LED Semiconductor22 ........................................................................................... 22
Figure 8 Sketch of output for typical laser diode as a function of drive current for three separate temps.22
.................................................................................................................................................................... 23
Figure 9 Sketch of Semiconductor laser light22 ........................................................................................... 23
Figure 10. Breakdown of components in a LED light bulb ......................................................................... 24
Figure 11 Newly Enforced Government Standards for Incandescent Lightin30 .......................................... 25
Figure 12 Advancements of different lighting technologies ....................................................................... 25
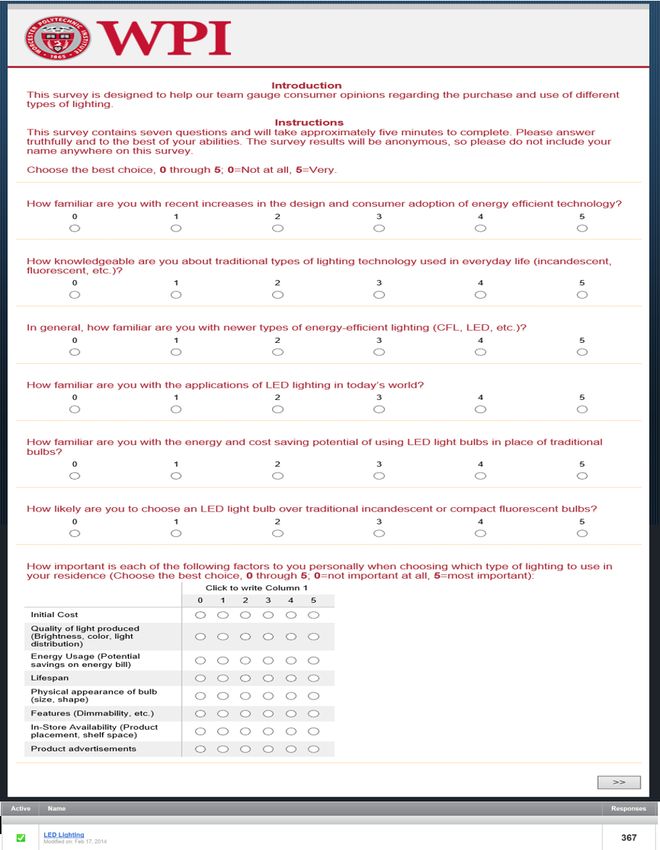
Figure 13 Survey taken by Respondents ..................................................................................................... 38
Figure 14 Survey Results with Statistical Analysis ...................................................................................... 39
Figure 15 Pie Chart of answers from Survey Question 1 ............................................................................ 41
Figure 16 Pie Chart of answers from Survey Question 2 ............................................................................ 42
Figure 17 Pie Chart of answers from Survey Question 3 ............................................................................ 42
2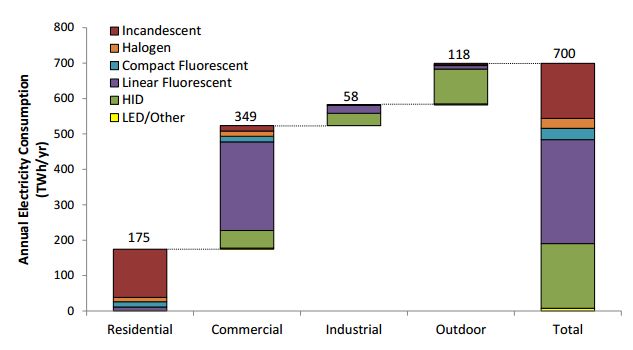
Figure 18 Pie Chart of answers from Survey Question 4 ............................................................................ 43
Figure 19 Pie Chart of answers from Survey Question 5 ............................................................................ 43
Figure 20 Pie Chart of answers from Survey Question 6 ............................................................................ 44
Figure 21 Average of Answers from Survey Question 7 and the variance of answers ............................... 44
Figure 22 Basic Floor plan of Basement ...................................................................................................... 45
Figure 23 Basic Floor plan of the first floor................................................................................................. 46
Figure 24 Basic Floor plan of the second floor............................................................................................ 46
Figure 25 Basic Floor plan of the third floor ............................................................................................... 47

List of Tables
Table 1 Summary of Energy Audit............................................................................................................... 16
Table 2 LED Lights replacing traditional light forms ................................................................................... 17
Table 3 Survey Results ................................................................................................................................ 19
Table 4 Cost of LED Lighting ........................................................................................................................ 28
Table 5 Replacement costs of LED light bulbs ............................................................................................ 29
Table 6 Total annual cost of bulbs .............................................................................................................. 30
Table 7 Potential Cost Savings of LED bulbs ............................................................................................... 30
Table 8 Survey Discussion Table ................................................................................................................. 32
Table 9 Table of the energy audit raw data used to perform calculations ................................................. 45

                                                                                                                                                        3
Abstract
Recent developments in light-emitting diode technology have allowed LED lighting products to
penetrate the commercial lighting market with enormous potential for growth. Our team developed
several conclusions forecasting the future of LED lighting in the commercial market and made
recommendations for a business’ strategic entry into the commercial lighting market with LED products.
Our team’s conclusions and recommendations were based on our own market, cost-benefit, and
behavioral analyses pertaining to the viability of LED lighting products for widespread adoption in the
commercial sector.
Executive Summary
Light Emitting Diodes (LEDs) have recently entered the lighting market as an energy efficient
alternative to traditional light sources such as incandescent and fluorescent bulbs. These lights still have
an enormous amount of room for technological growth and offer various advantages over all other
forms of lighting. Having just recently entered the lighting market, LEDs have faced many barriers to
entry and are struggling to obtain a market share over the traditional forms of lights.
A combination of a literature review and industry tests were performed to determine the
feasibility of LEDs for widespread use. The literature review and industry interviews were used to
determine the major differences in the major forms of lighting as well the future trends of LEDs. A
market analysis was conducted to define the current status of the lighting market and where LED lights
currently stand. A cost benefit analysis was performed on incandescent, compact fluorescent and LED
bulbs as well as fluorescent tubes to determine the cost saving potential of certain lights. An energy
audit was also conducted on a commercial building for a real world scenario on the effects of switching
to LED lights. Finally a survey was completed by nearly 400 respondents in order to gauge the public’s
knowledge of LED and other forms of lighting as well as the factors that influence a buyers purchasing
decisions.
The results revealed that LEDs are nearing the end of the introduction phase product life cycle,
ready to penetrate the growth phase. LEDs offer a variety of advantages over other bulbs as well as
major cost savings but the major barrier to being accepted into the market is the high price of the
product. Businesses who are looking to enter the LED market must ensure to not only have an
innovative product but more importantly offer it at a competitive price.
41.0 Introduction and Problem Statement
A universal trend toward the progressive development of an environmentally sustainable society
has brought about a substantial demand for innovative, energy-efficient technology. As these new
technologies are developed, they must be evaluated and compared to existing products in order to
determine whether the new technology will be more suitable to serve its intended purpose. This
evaluation must take into account a number of factors including, but not limited to, energy-efficiency,
cost-efficiency, ability to perform the intended task(s), and degree of innovation in the new technology.
One area in need of new technological advancement is the commercial lighting industry.
Commercial buildings, including stores, offices, restaurants, hospitals, and schools, account for
approximately twenty percent of the United States’ total energy consumption. Thirty-eight percent of
this energy consumption is in the form of lighting. Current widely-utilized lighting methods include
linear fluorescent, compact fluorescent, high-intensity discharge, and incandescent. Commercial
buildings primarily use fluorescent lighting1. These methods of lighting have been used for a number of
years without the emergence of any truly competitive alternatives. Generally, these traditional lighting
methods are considered “mature technologies,” meaning they are considered to have little room for
advancement in performance2.
The prospect of improving lighting technology is currently being investigated. Such improvements
may include energy-efficiency, light depreciation, lifetime, light output and distribution, color quality,
color shift, and dimmability3. Recent advancement in light-emitting diode (LED) technology has made
the widespread commercial use of LED lighting a very realistic possibility for the near future. New LED
lights offer many advantages when compared to fluorescent or incandescent lights. First, the latest LED
bulbs last up to five times longer than traditional fluorescent bulbs, and nearly 50 times longer than
incandescent bulbs. Additionally, new LED light bulbs use half the electricity that compact fluorescent
bulbs use in the same allotted time, and less than a quarter of the electricity used by incandescent
bulbs. The major drawback to buying the most current LED light bulbs is the price; LED light bulbs cost
nearly 10 times the price of a CFL bulb, and 30 times that of an incandescent bulb. However, users of
LED light bulbs can recover this high overhead cost in energy savings over time, saving money in the long
run4. The goal of this project was to address the need for an alternative commercial lighting method by
evaluating the prospect of LED lighting for widespread use.
52.0 Materials and Methods
In order to evaluate the feasibility of Light-Emitting Diode technology as an efficient and cost-
effective alternative to traditional technologies for commercial lighting, we conducted extensive
research, in the form of a literature review, market analysis, cost-benefit analysis, and a behavioral
analysis involving stakeholder interviews and a survey.
2.1 Literature Review
A comprehensive literature review of material relating to LED lighting technology was a vital
element of this project. This involved a research focus on the development of the commercial lighting
market, including traditional technologies and the emergence of new innovations in LED technology. We
reviewed applicable data provided by the U.S Department of Energy and the U.S. Census Bureau, and
research studies previously conducted by private organizations and consulting firms. This literature
review provided a strong background and factual basis for our market analysis and cost-benefit analysis.
2.2 Market Analysis
A market analysis studies the attractiveness and opportunity of a particular market within an
industry. In this analysis, our team was able to use data and market trends to project the near future of
LED lighting and the level of opportunity available for a business entering this market. Our project’s
focus was on the commercial lighting market, rather than residential or industrial lighting. In narrowing
our focus, we aimed to gain a more complete and detailed understanding of the commercial lighting
market as it pertains to LED lighting technologies. Research for our market analysis involved statistical
data provided by market research organizations, the U.S. Department of Energy, and the U.S. Census
Bureau. In addition to market size and segmentation, our analysis included the market’s overall trends, a
description of recent growth, projections for future growth, and a SWOT analysis, including strengths,
weaknesses, opportunities, and threats involved in venturing into the commercial lighting market with
innovative LED technologies.
2.3 Cost/Benefit Analysis
A cost-benefit analysis is a business process used to evaluate the benefits of a project or
decision against its’ financial costs. Our cost benefit analysis involved a comparison of LED lighting with
traditional forms of commercial lighting in terms of financial costs, energy usage, product lifetime, and
product performance. The necessary data and information came from our literature review and
research. Useful sources of data included the U.S. Department of Energy, private research and
consulting firms, and scholarly articles published in technical journals.
6Our team performed a case study of our residence building, the Phi Gamma Delta Fraternity
House (FIJI), which is considered a commercial building. This case study involved an analysis weighing
the costs and benefits of the possible decision to implement innovative LED lighting in place of the more
traditional fluorescent lighting currently being used. After collecting all necessary observational data and
calculating costs and benefits, we were able to draw conclusions regarding the decision of FIJI weather
to switch to LED lighting.
2.4 Behavioral Analysis
In order to gain a better perspective of LED technology’s emergence into the commercial
lighting market, we conducted a behavioral analysis, including a first-hand examination of stakeholders’
points-of-view in the form of interviews with informed individuals such as members of the construction
industry, commercial building owners, LED lighting manufacturers, scholars with an applicable area of
expertise, employees of electric companies, private consultants, and property managers. All interviews
were analyzed and used to draw conclusions regarding expert and stakeholder perspectives of the
commercial LED lighting market. We also used a survey to gauge the public’s general knowledge of the
current LED lighting market. This survey was useful in determining what factors influence consumers
into purchasing specific forms of lighting.
3.0 Results
Our team conducted a market analysis, a theoretical cost-benefit analysis, a practical cost-
benefit analysis, and a behavioral analysis (survey). In this section, we have displayed summarized our
data for each analysis, and displayed our calculations and major findings.
3.1 Market Analysis
The results of our analysis of the commercial lighting market as it relates to LEDs was based on
extensive research and existing statistical data. Our findings include information regarding the market’s
size and segmentation, level of existing competition, and growth and recent market trends. Our team
also performed a SWOT analysis to display the strengths, weaknesses, opportunities, and threats that
exist for a company planning on entering the commercial lighting market with innovative new LED
products.
3.1.1 Market Size and Segmentation
Energy consumption in the United States falls under four sectors; residential, commercial,
industrial, and transportation. Together, residential homes and commercial buildings comprise 40% of
the United States’ total energy consumption. Commercial buildings, including schools, stores, and
7businesses, make up 18.6% of this total energy consumption, mainly in the form of electricity1. As of
2010, approximately 5.5 million commercial buildings existed in the United States averaging nearly
15,000 square feet of floor area per building5. These buildings use 38% of their electricity specifically for
lighting. Annually, the U.S. consumes 700 TWh of electricity in the form of lighting, 19% of the country’s
total energy consumption. The commercial sector comprises 349 TWh, nearly half of the U.S.’ lighting
energy consumption5. From these facts, it is apparent that commercial lighting accounts for a huge
portion of United States’ energy consumption and encompasses a vast share of the lighting market.
Figure 1 Annual Electricity Consumption by Sector and Type of bulb
Compared to the other market sectors, LED lights have great potential to penetrate the
commercial market effectively. In 2010 a total of 67,015,000 LED lamps were used, over half of which
(38,029,000 lamps) for commercial purposes. It is important to note, however, that nearly 80% of these
LED lamps purchased by the commercial sector were merely used in exit signs. Despite this fact, LED
lighting has seen a significant increase in commercial non-exit sign applications. In 2001, only 37,000
non-exit sign lamps were being used for commercial purposes. By 2010, 7.5 million non-exit sign LED
bulbs were in use in the commercial sector5. The potential for widespread adoption of LED lighting is
arguably the highest in the commercial market segment not only because the commercial sector
accounts for nearly half of the U.S. total lighting energy consumption, but also because it represents the
sector in which the greatest number of lumens are produced. This can be attributed mainly to the long
operating hours of commercial building compared to, for example, a residential building5. The
commercial market segment is extremely poised for the increased adoption of LED lighting technology.
83.1.2 Competition
Within the commercial lighting market, there are several competing types of lighting
technology. Compact fluorescent, linear fluorescent and incandescent lighting are more traditional light
sources to be mass produced and optimized for widespread use. In 1997, white LED lights hit the
market and have since then begun to find their way into all sectors of the market. Figure 1 displays the
breakdown of the number of lamps used by each sector in 2010. The total commercial lamp inventory
for the U.S. in 2010 was 2,069,306,000 lamps. In comparison, only 38,029,000 commercial lamps used in
2010 were LED lights, a mere 1.8% market share in commercial lighting. Linear fluorescent lamps
dominated the commercial lighting market with nearly 80% of the market share, while compact
fluorescents (CFLs) accounted for 10% of commercial lighting. Incandescent lamps represented a 4%
market share in commercial lighting, while halogen and high-intensity discharge accounted for 2.3% and
1.8%, respectively5. Despite the fact that LEDs currently control a very small market share in commercial
lighting, as the technology evolves, its potential to gain a greater market share increases dramatically.
Today’s lighting industry is controlled by a handful of major competitors making it hard for new
companies to enter into the market. General Electric, Siemens and Philips Electronics control a
combined 84.8% of this market. With fluorescent and incandescent lighting reaching their efficiency and
life expectancy limits, these major players in the lighting industry are looking towards LED lights to
maintain a competitive edge over one another.
3.1.3 Growth and Recent Market Trends
Currently, LED light bulbs are enduring the early adoption phase of the product life cycle.
However, continued technological advancement in LED lighting have poised these products to enter and
excel through the growth phase. In recent years, the LED lighting market as a whole has been
undergoing significant growth. The LED lighting market, measured at $4.8 billion in 2012, is projected to
reach $42 billion by 2019, with a growth rate of 45% each year6. Figure 2 depicts IMS Research growth
projections for different segments of the overall world lighting market. The research firm predicts the
LED market begin to surpass all other lighting types in revenue in 20137. A 2012 report from Pike
Research predicted LED lighting’s share of the commercial lighting market to exceed 50% by 20218. Less
efficient incandescent and fluorescent bulbs will gradually be phased out, allowing innovative new LED
products to move in and capture the commercial lighting market.
9Figure 2 World Market for Lamps by Technology
There are several reasons behind these optimistic predictions. To understand the reasons for
these growth projections, we look back to the major drawbacks of LED lighting that have deterred
consumers in the past. First, LED light bulbs, regardless of their energy-saving potential, have been
significantly more expensive than traditional incandescent and fluorescent bulbs. High initial costs of
LED bulbs have scared away potential buyers for some time now. However, recent advancement in LED
lighting technology has vastly increased the potential for significantly more affordable LED bulbs to
reach the market. In 2009, LED bulbs could be purchased for upwards of $70. As of 2012, the price for a
40-watt equivalent LED light bulb averaged around $20, still nearly ten times the price of a CFL bulb at
the time. In the past year, technological advancements have given way to similar LED products only
costing about $109.
Following recent trends in LED light bulb innovation, the retail price of LED bulbs is expected to
decrease in the near future. Figure 3 depicts the forecasted price8 of a typical LED bulb (40-60 Watt
equivalent) for each year through 2020. These projections show an exponential decrease in the retail
price of LED bulbs. IMS Research projected in 2012 that by 2014 the average selling price of an LED bulb
(40-60 Watt equivalent) will fall below $10. A ban on incandescent bulbs in the United States, expected
to be imposed in the next year, is predicted to cause a major surge in LED light bulb sales. As LED
technology advances, manufacturers will be able to offer products at lower prices. Furthermore, as sales
increase, manufacturers will produce more, driving costs down, therefore lowering retail prices even
further. While it is necessary for manufacturers in emerging markets to strive to lower their prices, LED
manufacturers must also prioritize the quality of their products. As compact fluorescent bulbs emerged
10in the 1990’s, low price products that sacrificed products hindered the product’s uptake in the market. A
good balance of low price and high quality is essential for any product designed to enter the commercial
LED lighting market8.
Figure 3 Forecasted Retail price for all Replacement LED lamps
3.1.4 SWOT Analysis
When attempting to enter a new market, it is essential for a business to first gain a full
perspective of the market’s situation as it exists at that time. Figure 4 depicts a SWOT analysis which
identifies the strengths, weaknesses, opportunities, and threats involved in entering the commercial
lighting market with the latest LED products.
Strengths Weaknesses
•New, innovative technology •Technology is a long way from perfection
•Technology still progressing •Low market share
•Potential for increase in performance •Not very well-known
•Energy efficient design
•Offers consumers positive ROI, over time
SWOT
Analysis
Opportunities Threats
•Government regulations for energy efficiency •Cheaper technology
• Universal "Green Push" •New innovations/technologies
•Competing forms of lighting somewhat obsolete •Large well-established competitors
•RIsing energy prices
•Innovation
Figure 4 SWOT analysis of LED lighting
113.2 Cost Benefit Analysis - LED vs. Incandescent, CFL, Linear Fluorescent
The commercial lighting market is currently dominated by four major types of lighting: Linear
fluorescent, compact fluorescent, incandescent, and light-emitting diode. Incandescent, the oldest of
the four technologies, although popular for some time, is losing market share and well into its decline.
Linear fluorescent light bulbs dominate the commercial market, currently holding an 80% market share.
Compact fluorescents are also popular, with a 10% market share5. On the other hand, LED lighting is still
an emerging technology, leaving a strong potential for change in the market. In order to understand the
magnitude of this potential, we have conducted an analysis of LED lighting technology as it compares to
linear fluorescent, compact fluorescent, and incandescent lighting technology in terms of the costs and
benefits of each choice.
In order to properly compare these different types of light bulb, our team examined bulbs which
output equivalent amounts of light. Certain types of light bulbs are able to produce light of comparable
magnitude and quality to the light using significantly less power than other bulb types4. For this reason,
we were required to linearize our data in order to compare the different bulbs side by side. To do this,
we decided to evaluate each bulb type over a given time period of commercial use. Since certain light
bulb types last significantly longer than incandescent bulbs, we chose a long period of time, fifteen
years, which is quite realistic in a commercial setting. Collectively, light bulbs used in the commercial
sector operate for an average of 11 hours per day5. Under the assumption that commercial buildings
operate 300 days per year, accounting for holidays and certain weekend days, light bulbs are in use for
approximately 49,500 hours over fifteen years in a typical commercial setting.
3.2.1 Incandescent Light Bulbs
We began our cost benefit analysis by examining the oldest of the commercial lighting
technologies currently in widespread use, incandescent. We elected to analyze a typical 60-watt light
bulb (Sylvania), as this bulb is the most commonly used type of incandescent lighting in the commercial
sector5. First, we investigated the typical monetary costs of incandescent lighting. The overhead cost per
60W incandescent bulb is about $14. The cost of energy, which is measured in kilowatt hours, must also
be factored into our analysis. In 2013, the average energy cost for the commercial sector was 10.25
cents per kilowatt hour10. Cents per kilowatt hour (c/KWh) does not directly measure monetary cost,
rather cost per energy used over time. To measure the actual cost of running an incandescent bulb, we
took into account the typical lifespan of an incandescent bulb, 1,200 hours4. To calculate the total
energy cost of running one 60 W incandescent bulb for its lifespan, we multiplied 10.25 cents ($0.1025)
12by 60 watts (.06 KW) by 1,200 hours. The total energy cost of running this bulb is $7.38. After a $1.00
overhead cost of the bulb is factored in, the total cost of one incandescent bulb is $8.38.
After considering the total cost of purchasing and using one incandescent bulb, our team
determined the cost of using this type of bulb over a long period of time, fifteen years, or 49,500 hours
of usage. Bearing in mind the 1200-hour lifespan of the 60-watt incandescent bulb, a facility would need
to use 42 bulbs consecutively to last 49,500 hours. The total cost of purchasing and using 42 of these
bulbs equates to $351.96. However, commercial buildings use more than just one incandescent bulb at a
time; the average commercial building contains fourteen incandescent light bulbs in use5. To calculate
the average total cost of using fourteen 60-watt incandescent bulbs over a fifteen-year period in a
commercial facility, we multiplied the fifteen-year cost of using just one bulb at a time ($351.96) by
fourteen. The average total cost of using these incandescent bulbs in a typical commercial building over
a fifteen-year period is $4,927.44.
In addition to the monetary cost of an incandescent bulb, we also considered the non-monetary
costs of using this product. Incandescent bulbs are highly breakable, lowering their potential value4. This
fragility also entails danger for those required to clean up a broken bulb; when glass shatters and brings
about high potential for injury. Although it is impossible to determine the monetary cost of the
incandescent bulb’s breakability, it is important to consider this downside.
After considering the various costs involved in choosing incandescent lighting for commercial
use, we investigated the benefits of this technology. One positive attribute of incandescent bulbs is that
they do not contain any toxic material, e.g. mercury11. Additionally, the ability to mimic natural light is
very high. This attribute is measured by the color rendition rating, which for incandescent bulbs is
between 98 and 100 out of 100. This can be compared to some fluorescent bulbs which are rated
between 50 and 90 out of 10012.
It is clear that incandescent bulbs have distinct positive and negative attributes. Incandescent
bulbs have long since reached their innovative peak, as there have been no recent advancements in the
technology. Furthermore, although incandescent bulbs present the advantage of a high color rendition
rating, newer alternative products feature the same benefit12. While the overhead cost per bulb is
extremely low, the energy costs involved with running incandescent bulbs are less than ideal. U.S.
congress put forth a law in 2007 that called for the phasing out of light bulbs that use especially high
amounts of much energy. The restrictions have been executed in phases: a ban on 100-Watt bulbs went
into effect in 2012 and 75-Watt bulbs were banned in January of 2013. The third phase of the policy
goes into effect in 2014; 60-Watt bulbs will be outlawed. However, the policy has been strongly
13criticized by those who value the low cost of traditional incandescent bulbs over the potential savings of
energy efficient alternatives, and Congress has voted to defund the enforcement of the bans. Despite
this fact, societal trends favoring energy conservation and efficiency render the eradication of high-
wattage bulbs inevitable13.
3.2.2 Compact Fluorescent Bulbs
After evaluating the incandescent bulb, it was necessary for our team to understand the costs
and benefits of choosing a compact fluorescent light (CFL) bulb. Maintaining continuity, we evaluated
the CFL equivalent of a 60-Watt incandescent bulb. This means that the CFL bulb outputs an amount of
light equal to that of the 60-Watt CFL; however it typically only requires 14 Watts of electricity to
produce this light4. The average 14-Watt CFL bulb (Ecosmart) has an overhead cost of about $4.00 and a
typical lifespan of 10,000 hours4. Assuming again that electricity costs 10.25 cents per kilowatt hour, we
found the energy cost of one bulb to be $14.35 throughout its lifetime. The total cost of purchasing and
using a single 14-watt CFL bulb is $18.35.
As with our analysis of the incandescent bulb, we evaluated the costs of using CFL bulbs over a
fifteen year time period, during which the lights are on for a total of 49,500 hours. Since the 14-watt CFL
bulb lasts for approximately 10,000 hours, five bulbs used one after the other would be necessary over
fifteen years. Therefore, we multiplied the total cost of a single CFL bulb through its lifetime ($18.35) by
five to get the total cost of using only one bulb at a time for fifteen years, $91.75. The average
commercial building utilizes 39 CFL bulbs at one time5. Therefore, the average total cost of using these
CFL bulbs in a typical commercial building is $3,578.25 over a fifteen-year period.
Along with these monetary costs involved in utilizing CFL bulbs, this type of bulb presents
several unquantifiable costs. First, compact fluorescent bulbs contain mercury, presenting major
problems related to their disposal. Also, CFL bulbs are criticized for having a slightly lower color
rendition than incandescent bulbs, as the light that emanates from a CFL bulb typically has a slight
green-blue hue12.
There is no doubt that compact fluorescent light bulbs offer advantages over other types of bulb
that greatly outweigh the costs of CFLs. The most obvious benefit of CFL bulbs is their energy efficiency.
A CFL bulb requires 75% less energy input than an incandescent bulb requires to produce a comparable
amount of light. An organization that uses CFL bulbs instead of incandescent would undoubtedly
experience significant electric-bill savings. Even though the overhead cost of a 14-watt CFL bulb is higher
than that of a 60-watt incandescent bulb, this small price discrepancy would be overcome in time
through energy savings. Energy efficient products are becoming more and more attractive to
14commercial consumers who value sustainability. In this respect, the efficiency of CFLs provides a strong
benefit to choosing this product.
3.2.3 LED Light Bulbs
The next light bulb our team evaluated was a 10.5-watt LED bulb (Philips), which has an
equivalent light output to that of a 60-watt incandescent bulb. This LED bulb has an overhead cost
averaging $10, and a typical lifespan of 20,000 hours14. With an electricity cost of 10.25 cents per
kilowatt-hour, the cost of running one bulb for its entire lifetime is $21.53. The total cost of purchasing
and using this 10.5-watt LED bulb for its entire lifetime is $31.53.
Once again we evaluated the cost of this LED bulb being used for a fifteen year period, 49,500
hours. Considering the bulb’s 20,000-hour lifespan, two and a half bulbs will be used every fifteen years.
We multiplied the total cost of purchasing and using one 10.5-watt LED bulb by 2.5 to get $78.81, the
average cost of buying and using one of these bulbs for fifteen years. Considering the fact that this LED
product is a new and innovative alternative to the aforementioned CFL bulb, of which there is an
average of 39 per commercial building at any given time, our team decided it was best to consider the
cost of purchasing and using 39 of these 10.5-watt LED bulbs at a time over a fifteen year period, which
would be $3073.69.
3.2.4 Linear Tube Lighting – Fluorescent vs. LED
Linear tube lighting is used very often in commercial buildings, and accounts for a high
percentage of the cost of lighting for businesses. In fact, the average commercial building contains 301
linear (fluorescent) tube light bulbs in use at any given time. Eighty percent of all bulbs used in
commercial buildings are linear fluorescent bulbs. Currently, virtually all of these bulbs fall under the
category of linear fluorescent lighting5. Our team chose to evaluate a 32-watt T8 linear fluorescent bulb
(Philips), which typically costs about $13 and has a lifespan of 20,000 hours15. In a commercial setting,
the cost of electricity to run one of these bulbs for its entire lifetime is $65.60. Therefore, the total cost
of purchasing and using one 32-watt T8 linear fluorescent bulb is $78.60.
Considering a situation where one of these bulbs is used for a fifteen year period (49,500 hours
of use), two and a half bulbs would need to be purchased and used. The cost of purchasing and running
two and half bulbs is $196.50. Commercial buildings use an average of 301 linear fluorescent tube lights
at a time5, so our team multiplied the cost of running one bulb at a time for fifteen years ($196.50) by
301, to find the average cost for a commercial building of purchasing and using this type of linear
fluorescent tube lighting over a fifteen year period, $59,146.50.
15Recent technological advancements in light-emitting diode tube lighting have encouraged the
adoption of these new LED products as potential replacements for linear fluorescent bulbs like the one
discussed above. For the purposes of comparison, our team chose to examine an 18-watt T8 LED tube
light (Green Creative), which has an equivalent light output to that of the 32-watt compact fluorescent
bulb mentioned above. This bulb costs about $38.00 and has lifespan of 50,000 hours16. In a typical
commercial building, with an electricity price of 10.25 cents per kilowatt-hour, it would cost $92.25 to
run one of these bulbs for its entire lifetime. The total cost of purchasing and using one 18-watt T8 LED
tube light for its entire lifespan is $130.25.
Considering this bulb’s 50,000-hour lifespan, a single bulb would last an entire fifteen year
period. Therefore, the fifteen year cost of purchasing and using one of these bulbs is $130.25. Our group
calculated the cost of using this type of LED tube light bulb to replace linear fluorescent tube lights.
Since there are 301 linear fluorescent light bulbs being used in the average commercial buildings, we
calculated the cost of purchasing and using 301 of these 18-watt LED tube light bulbs at a time for a
fifteen year period, $39,205.25.
3.3 Cost-Benefit Analysis – Phi Gamma Delta Fraternity House
In conducting an extensive energy audit of the Phi Gamma Delta Fraternity House, our team was
able to adequately assess the commercial building’s current lighting situation in terms of energy
consumption by type of light bulb. The house (floor plan can be found in Appendix 7.3.2) contains 15
bedrooms, an industrial kitchen, a large dining room, a foyer area, a living room, two bathrooms, and a
basement. Table 1 below summarizes the data we collected in our audit and includes a list of the
different types of light bulb used at FIJI, the quantity of each type of bulb, and each light bulb’s product
specifications.
Table 1 Summary of Energy Audit
Average hours of use per day was calculated for each type of light bulb by compiling the daily
usage values for each individual light bulb of the given type. These daily usage values for all light bulbs in
bedrooms were based on estimates given by each room’s tenants; our group’s first-hand observations
allowed us to estimate daily light bulb usage in all common areas. Using our data, we calculated the
annual energy usage (consumption) for each type of bulb using Equation (1), shown below. Finally,
16assuming the electricity price is $0.145 per Kilowatt-hour (KWh), the average price of electricity in
Massachusetts10, we calculated the annual energy cost of each type of light bulb used at FIJI (See
Equation (2)).
Equation (1):
AEC =P * n * ADU * 365 days/year
Equation (2):
ECY = $0.145/KWh * AEC
AEC = Annual Energy Consumption (kWh)
P = Power Output (kW)
n = number of bulbs
ADU = Average Daily Usage (hrs)
ECY = Energy Cost per Year ($)
Our group was able to conduct supplemental interviews with each of the two house managers
at FIJI in order to evaluate our findings for consistency. Both managers confirmed our data, including
bulb types and energy use, to be quite typical for the building. Once we assessed and established the
current lighting situation at Phi Gamma Delta, our next task was to calculate the potential costs and
benefits involved in replacing all traditional light bulbs with equivalent LED bulbs. In order to do this, it
was necessary for us to research different LED products and determine the bulbs that most nearly
replicated the light quality and intensity of the bulbs currently being used in the house. Table 2 shows
the specifications for the proper replacement LED bulb for each of the bulbs currently being used by FIJI.
The costs and specifications of the bulbs were identified using online retailers including Amazon, Sears,
and Home Depot (2014). Once again, Equations (1) and (2) were used to project the annual energy
usage and energy cost for each LED replacement bulb type.
Table 2 LED Lights replacing traditional light forms
3.4 Survey Results
Table 6 displays the results from the survey distributed to the WPI community. The answers for
each question that received the most responses are highlighted.
Survey Results
17Total Respondents: 367
This survey contains seven questions and will take approximately five minutes to complete.
Please answer truthfully and to the best of your abilities. The survey results will be anonymous, so
please do not include your name anywhere on this survey.
Choose the best choice, 0 through 5; 0=Not at all, 5=Very.
1. How familiar are you with recent increases in the design and consumer adoption of
energy efficient technology?
Answer Responses Percentage
0 18 5%
1 43 12%
2 54 15%
3 113 31%
4 100 27%
5 39 11%
2. How knowledgeable are you about traditional types of lighting technology used in
everyday life (incandescent, fluorescent, etc.)?
Answer Responses Percentage
0 8 2%
1 24 7%
2 49 13%
3 119 32%
4 109 30%
5 58 16%
3. In general, how familiar are you with newer types of energy-efficient lighting (CFL,
LED, etc.)?
Answer Responses Percentage
0 10 3%
1 27 7%
2 57 16%
3 127 35%
4 95 26%
5 51 14%
4. How familiar are you with the applications of LED lighting in today’s world?
Answer Responses Percentage
0 7 2%
1 27 7%
2 69 19%
3 96 26%
184 117 32%
5 51 14%
5. How familiar are you with the energy and cost saving potential of using LED light bulbs
in place of traditional bulbs?
Answer Responses Percentage
0 7 2%
1 22 6%
2 41 11%
3 62 17%
4 119 32%
5 116 32%
6. How likely are you to choose an LED light bulb over traditional incandescent or
compact fluorescent bulbs?
Answer Responses Percentage
0 13 4%
1 22 6%
2 45 12%
3 93 25%
4 107 29%
5 87 24%
Table 3 Survey Results
194.0 Discussion
4.1 Literature Review
4.1.1 Brief History of Lighting
Life has revolved around light since the beginning of time. The power to control and emit light
has been a struggle for humans for over 10,000 years ago since the first fire starting kits were created in
the Neolithic Period.17 Since then light sources have grown and expanded as all of society and
technology has. Oil and gas lamp use spanned from 2600 B.C to the late nineteenth century. In 1800 it
was confirmed that electricity was able to emit visible light by an arc between two electrical rods. It was
not until a consistent source of energy generation, electromagnetic induction, that this visible arc of
electricity was harnessed into arc lights. This arc lighting was adopted by lighthouses, roadways,
stadiums and halls but were too bright for residential use.17
Thomas Edison was the first inventor to design and manufacture lighting systems for businesses
and home use in 1881. The incandescent lighting system was a relatively new technology but under
Edison’s research by 1882 more than 30,000 incandescent lamps were being used in factories and
homes. This sparked even more interest in the lighting industry leading to a swarm of new technologies
and advances. Fluorescent light bulbs were the next major development in lighting. These light systems
were mastered by one of Edison’s former employees, Daniel Moore, and brought to market in 1904.
Although more expensive to create, fluorescent lighting allows for 75-80 percent more efficiency
creating more light and less heat.17
It was not until 1962 that an innovative new form of lighting was discovered. Light emitting
diodes, or LED’s, were first developed when a GE engineer when photons were released from a metal
diode after being exposed to electricity. The visible light emitted from the diodes could originally only
be produced as yellow and red light and it was not until the 1990’s that new methods were developed
that would allow LED’s to deliver white light. White light production has allowed LED’s to break into the
consumer markets and challenge the traditional light sources.17
204.1.2 Mechanisms of Incandescent Lighting
Incandescent bulbs were the most widely used light
source for decades because of the developments made by
Thomas Edison. The screw in bulb was adopted as an industry
standard over other developing lighting bulb styles.18
Compared to other light sources today incandescent bulbs are
very simple and thus manufactured at low costs.
Incandescent bulbs emit white light as an electric
current runs through a tungsten filament. As the electric
current passes through the filament, the filament temperature
begins to rise. Tungsten has an abnormally high melting point
(3,422 degrees Celsius) allowing the filament to heat to the
point where it glows and emits light. The electricity that heats
each filament originates from the foot contact at the base of a
bulb and attaches to the filament at each end.18
Every incandescent bulb is vacuum sealed in order to
prevent combustion. With the tungsten filament reaching
temperatures up to 3,000 degrees any presence of oxygen can
produce negative effects. As these high temperatures are Figure 5 . Breakdown of Incandescent Bulb19
reached excited atoms will detach from the tungsten filament and begin to collect in the casing of the
bulb. Over time this leads to a dimmer light and a dark coating around the bulb. In modern
incandescent bulbs the case is filled with inert gas to prevent this from happening. As these small
filament particles evaporate off of the tungsten they will be deflected back towards its original place.
Filament particles rejoin as they come together with the filament extending the lifetime and brightness
of the bulb.
214.1.3 Mechanisms of Fluorescent Lights
Fluorescent lighting does not use a metal filament
to emit light like incandescent bulbs but rather a reaction
between gaseous materials. These bulbs are made up of
large discharge tubes whose interior walls are coated in
phosphorous. Each tube is filled with argon and a small
amount of mercury vapor. At each end of the tubes are
electrodes to supply an electric current throughout the
bulb and a seal to maintain a low pressure. As electricity
runs into the electrodes, the tubes are preheated and a
rapid conduction of electrons begins between the two
ends.20 The introduction of free electrons ionize the
argon gas and both free electrons and ionized argon
travel rapidly through the tubes. As these rapidly moving
particles make their way around tube the mercury vapor
experiences an electron jump eventually returning to its
original form. When the electron falls back to its original
level, energy is released in the form ultraviolet photons.20
Figure 6 Breakdown of Fluorescent bulb21
Because ultraviolet photons are not visible to the
human eye, in order to create white light the phosphorous coating is added. The photons emitted by
the mercury excite the electrons of the phosphorous causing a second electron jump to occur. When
the phosphorous atoms return to their normal state, energy is then emitted as a visible light photon.
The ballast located at the base of the bulb controls the flow of alternating current through a tube. If the
ballast is unable to properly control the alternating current and the level of current reaches an
abnormally high level, the tubes will burst and
shatter.20
4.1.4 Mechanisms of LED Lights
Light Emitting diodes provide much
differently than incandescent or fluorescent
lighting. Rather than generating light through a
filament, plasma or gas, LED’s utilize a
semiconductor to emit photons. These
Figure 7 Composition of LED Semiconductor22
22semiconductors consist of different element combinations of gallium, aluminum, arsenide, indium and
phosphide. The precise differences in the composition of semiconductors leads to different
wavelengths of light and therefore changing the color of the light emitted.23 Figure 7 is an example of a
common composition found in LED semiconductors that emit red light. In order to produce white light
the red, green and blue LED chips are combined into a single series, allowing for all different spectrums
of white light to be emitted all depending upon the ratios of each color. A second method used to emit
white light utilizes LED’s that emit UV light very similar to fluorescent lighting. These diodes are
encased in a bulb coated in phosphorous. When the UV light photons created by the diode react with
the phosphorous coating white light is emitted.24
These semiconductor chips are
doped to produce a diode with a
positive and negative junction. This
junction is located in the middle of the
semiconductor where the positive and
negative type layers meet. The p-type
material is positively charged leaving
holes for electrons to join on too. On
Figure 9 Sketch of Semiconductor laser light22
the other side of the semiconductor is the n-type
material that contains extra electrons making in negatively charged. In its resting state, the materials in
the diode are separated by the p-n junction when the N-type materials joining onto the p-type forming a
depletion zone. When an electric current is added to the diode, current flows freely from the p-type
region to the n-type. The current flowing through the diode drives electrons and p-type material
through the junction point, forming an active region.
In the active region the holes of the holes of the p-
type material combines with the surrounding free
electrons, causing the p-type material to fall into a
lower energy level. Transition to a lower level energy
causes energy to be released in the form of a photon
or light. Production of light through a solid state
process such as this is called electroluminescence.25 Figure 8 Sketch of output for typical laser diode as a
function of drive current for three separate temps.22
This process is illustrated in figure 8 which shows the
reaction process in a simple LED laser light.
23This process is not one hundred percent efficient in creating light photons and therefore the
energy that is not released as light photons turns into heat. As seen in Figure 5 when the temperature
of a diode is increased the amount of current required to produce a given light output is increased. To
prevent this from happening a heat-sink slug is commonly placed underneath the semiconductor chip.
This device allows heat to quickly and efficiently travel away from the diode keeping the temperature
stable.22 LED bulbs do not require any gaseous materials and are covered with a clear plastic lens.
Figure 10 breaks down the components of a basic LED light bulb.
4.1.5 Current Trends in the lighting and LED market
Many of the trends that are affecting
today’s commercial lighting sector are being
influenced by the national government. In
December of 2011 a Presidential
Memorandum was released regarding the
implementation of energy savings projects and
performance-based contracting for energy
savings. In the memorandum the president
stated “Upgrading the energy performance of
buildings is one of the fastest and most
effective ways to reduce energy costs, cut pollution, Figure 10. Breakdown of components in a LED light bulb
and create jobs in the construction and energy
sectors.”26 In February of 2012 President Obama announced the Better Building Initiative devoted to
making the industrial and commercial sector 20% more energy efficient over the span of the next ten
years. He also wanted to accelerate the private sector investment in energy efficiency.27 This initiative
would incorporate strategies of better access of information, workforce training and having the federal
government lead by example. The Better Building Alliance was also formed to have organizations share
their experiences and savings while also committing to energy efficiency. Currently the alliance has over
200 commercial sector members who represent over 9 billion commercial square feet of building.28
24You can also read