ZEBRA2020: NEARLY ZERO-ENERGY BUILDING STRATEGY 2020 - Nearly Zero-Energy Building (nZEB) technology solutions, cost assessment and performance
←
→
Page content transcription
If your browser does not render page correctly, please read the page content below
ZEBRA2020: NEARLY ZERO-ENERGY
BUILDING STRATEGY 2020

Deliverable 5.1:
Nearly Zero-Energy Building (nZEB)
technology solutions, cost assessment and
performance
Deliverable 5.1: nZEB technology solutions, cost assessment and performance

Technical References
Project Acronym                 Zebra2020
Project Name                    Nearly Zero-Energy Building Strategy 2020
Project Coordinator             Raphael Bointner
                                TU Wien - Vienna University of Technology
                                Energy Economics Group – EEG
                                Gusshausstrasse 25-29/370-3
                                A-1040 Wien / Vienna, Austria
                                Tel: +43(0)-1-58801-370372
                                E-Mail: bointner@eeg.tuwien.ac.at
Project Duration                2014 - 2016
Website                         www.zebra2020.eu

Deliverable No.                 D5.1
Dissemination Level             Public
Work Package                    5
Lead beneficiary                EURAC
Contributing beneficiary(ies)   BPIE, CIMNE, Ecofys, ENERDATA, NAPE, SINTEF, TU Wien
Author(s)                       Ramón Pascual, Giulia Paoletti
Co-author(s)                    Filippos Anagnostopoulos
Reviewed by                     Raphael Bointner and Michael Klinski
Date                            September, 2016
File Name                       ZEBRA2020- Deliverable 5.1

  This document has been produced in the context of the ZEBRA2020 IEE/13/675/S12.675834
  Project.

                                                                            2
Deliverable 5.1: nZEB technology solutions, cost assessment and performance

Project consortium

                                          Energy Economics Group Institute of Power
                               EEG        Systems and Energy Economics Vienna
                                          University of Technology
                                          International Centre for Numerical Methods in
                              CIMNE
                                          Engineering, Building Energy and Environment

                              Ecofys      Ecofys Germany GmbH

                              EURAC       EURAC research Institute for Renewable Energy

                               NAPE       National Energy Conservation Agency

                             SINTEF       The foundation SINTEF

                               BPIE       Buildings Performance Institute Europe

                             Enerdata     Enerdata SAS

Legal Notice

The sole responsibility for the content of this publication lies with the authors. It does not
necessarily reflect the opinion of the European Union. Neither EASME nor the European
Commission is responsible for any use that may be made of the information contained therein
All rights reserved; no part of this publication may be translated, reproduced, stored in a retrieval
system, or transmitted in any form or by any means, electronic, mechanical, photocopying,
recording or otherwise, without the written permission of the publisher. Many of the designations
used by manufacturers and sellers to distinguish their products are claimed as trademarks. The
quotation of those designations in whatever way does not imply the conclusion that the use of
those designations is legal without the consent of the owner of the trademark.

                                                                                    3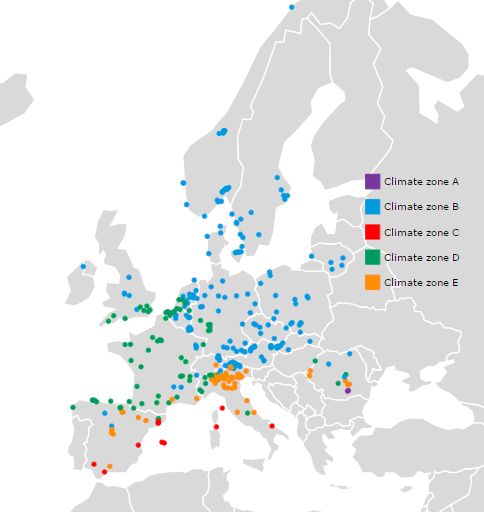
Deliverable 5.1: nZEB technology solutions, cost assessment and performance

Table of Contents

    About ZEBRA 2020 ............................................................................................................. 7
    Introduction .......................................................................................................................... 8
1     Target nZEB in European countries ..................................................................................... 9
    1.1       nZEB definition ......................................................................................................... 9
    1.2       Share of new nZEBs in selected European countries ............................................ 10
                 Share of new residential nZEBs .......................................................................... 11
                 Share of new non-residential nZEBs ................................................................... 13
2     nZEB features in European countries ................................................................................ 15
    2.1       Methodology of nZEB data collection ..................................................................... 15
                 nZEB data collection ........................................................................................... 15
                 Definition of the climatic zones ............................................................................ 17
                 Indicators collected.............................................................................................. 19
    2.2       nZEB features for cold winter climates ................................................................... 20
                 New nZEBs ......................................................................................................... 20
                 Renovated nZEBs ............................................................................................... 20
    2.3       nZEB features for warm summer climates ............................................................. 23
                 New nZEBs ......................................................................................................... 23
                 Renovated nZEBs ............................................................................................... 23
    2.4       nZEB features for mild climate ............................................................................... 26
                 New nZEBs ......................................................................................................... 26
                 Renovated nZEBs ............................................................................................... 26
    2.5       Solution-set for new nZEBs .................................................................................... 29
    2.6       Solution-set for renovated nZEBs .......................................................................... 30
3     Assessment of nZEB cost and associated macro-economic benefits................................ 31
    3.1       The renovation model............................................................................................. 31
    3.2       Input data ............................................................................................................... 32
    3.3       Assumptions ........................................................................................................... 33
    3.4       Scenarios ............................................................................................................... 35
    3.5       Results ................................................................................................................... 35
                 Austria ................................................................................................................. 35
                 Belgium ............................................................................................................... 37

                                                                                                                       4
Deliverable 5.1: nZEB technology solutions, cost assessment and performance
Czech Republic ................................................................................................... 38
Denmark .............................................................................................................. 39
France ................................................................................................................. 41
Germany.............................................................................................................. 42
Italy ...................................................................................................................... 43
Lithuania .............................................................................................................. 45
Norway ................................................................................................................ 46
Poland ................................................................................................................. 47
Romania .............................................................................................................. 49
Spain ................................................................................................................... 50
Slovakia ............................................................................................................... 51
Sweden ............................................................................................................... 53
Interpretation of scenarios’ results ...................................................................... 54
4 nZEB performance: energy savings compared to expected savings ................................. 56
4.1 Case studies .......................................................................................................... 56
France ................................................................................................................. 57
Germany.............................................................................................................. 57
Italy ...................................................................................................................... 58
Norway ................................................................................................................ 62
Poland ................................................................................................................. 63
Spain ................................................................................................................... 66
4.2 Deviation between calculation and monitoring ....................................................... 67
Reasons of the deviation ..................................................................................... 67
Suggestions to overcome the deviation .............................................................. 70
Legal framework .................................................................................................. 71
5 Professionals’ opinion about nZEB readiness of the building sector ................................. 73
5.1 General information ................................................................................................ 73
5.2 Market and construction of high-energy performance buildings ............................. 75
Use, availability and interest in passive solutions ............................................... 75
Use, availability and interest in active solutions .................................................. 76
Use, availability and interest in renewable energy technologies ......................... 77
5Deliverable 5.1: nZEB technology solutions, cost assessment and performance
Technology selection criteria ............................................................................... 78
5.3 Professional competence ....................................................................................... 79
6 Summary ............................................................................................................................ 81
Figures ..................................................................................................................................... 85
Tables ...................................................................................................................................... 87
Annex I: Energy efficiency categories according to the nZEB radar ........................................ 88
Annex II: nZEB features ......................................................................................................... 106
Annex III: Assessment of nZEB cost and associated macro-economic benefits ................... 142
Annex IV: Literature review .................................................................................................... 157
Annex V: Analysis of case studies with monitored performance and interviews to involved
experts ................................................................................................................................... 191
Annex VI: Questionnaire to professionals of the building sector (Country results) ................ 223
6Deliverable 5.1: nZEB technology solutions, cost assessment and performance
About ZEBRA 2020
Nearly Zero-Energy Building Strategy 2020
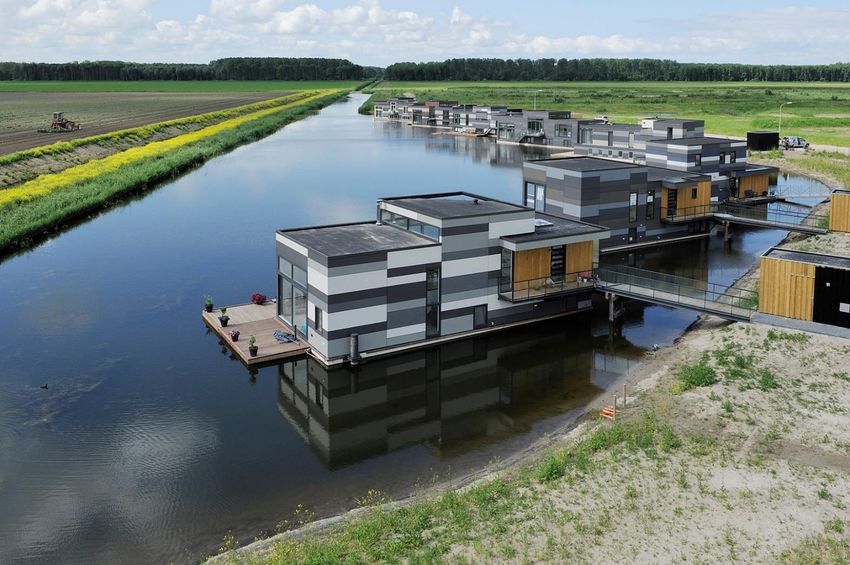
Sustainability of the European society and economy will be based on renewable energy and
high resource efficiency. For the building sector, this implies the large scale deployment of low-
energy buildings (so called nearly Zero-Energy Buildings or nZEBs). ZEBRA2020 aims at
creating an observatory for nZEBs based on market studies and various data tools and thereby
generate data and evidence for policy evaluation and optimisation. European legislation (Energy
Performance of Buildings Directive) makes nZEBs a standard by 2020. Therefore, the key
objective of ZEBRA2020 is to monitor the market uptake of nZEBs across Europe and provide
data and as well as recommendations on how to reach the nZEB standard.
ZEBRA2020 covers 17 European countries and about 89% of the European building stock and
population. Thus, it is actively contributing to meeting the ambitious target of 100% share of
nZEBs for new buildings from 2020 and a substantial increase of deep nZEB renovations.
Learn more at www.zebra2020.eu
7Deliverable 5.1: nZEB technology solutions, cost assessment and performance
Introduction
European legislation (Energy Performance of Buildings Directive) makes nZEBs a standard by
2021 for all new buildings and 2019 for all new public buildings. The technology is already
available and proven; however, the large-scale uptake of nZEB construction and renovation will
be a big challenge for all market actors and stakeholders involved. A substantial gap in reliable
data on current market activities makes it difficult for policy-makers to evaluate the success of
their policies and measures. Therefore, the key objective of ZEBRA2020 is to monitor the
market uptake of nZEBs across Europe and provide data and input on how to reach the nZEB
standard. The information gathered from the European construction sector and academia will
get structured and analysed to derive recommendations and strategies.
This report aims to describe representative features, possible solution sets, cost assessment
and nZEB savings compared to expected savings, both for new and renovated buildings, in 17
selected European countries1.
The report is structured in the following parts:
target nZEB: definition and nZEB market penetration;
nZEB features and possible solution sets;
assessment of nZEB cost and associated macro-economic benefits;
nZEB performance: energy savings compared to expected savings;
survey on nZEB market and professional competence;
summary.
This should be useful for public authorities that can boost different technologies when they
define minimum requirements in tenders or local codes, and designers that can find suggestions
for designing nZEBs.
Austria, Belgium, Czech Republic, Denmark, France, Germany, Italy, Lithuania, Luxemburg, Norway, Poland, Romania, Slovakia,
Spain, Sweden, Netherlands and United Kingdom
8Deliverable 5.1: nZEB technology solutions, cost assessment and performance
1 Target nZEB in European countries
1.1 nZEB definition
According to article 2 of the EPBD, “‘nearly zero-energy building’ means a building that has a
very high energy performance, as determined in accordance with Annex I. The nearly zero or
very low amount of energy required should be covered to a very significant extent by energy
from renewable sources, including energy from renewable sources produced on-site or nearby.”
As concrete numeric thresholds or ranges are not defined in the EPBD, these requirements let
a lot of space for own interpretation and thus allow Member States (MSs) to define their nZEB
in a very flexible way taking into account their country specific climate conditions, primary energy
factors, ambition levels, calculation methodologies and building traditions. This is also the main
reason why existing nZEB definitions differ significantly from country to country. It is thus a
challenging task to find a common denominator for defining an nZEB on a European scale.
After 31/12/2020 all new buildings have to achieve the nZEB target (public buildings by
31/12/2018). Therefore, MSs shall draw up national plans for increasing the number of nZEBs.
Furthermore, they shall develop policies and measures to stimulate the transformation of
buildings that are refurbished into nZEBs. Among others, the national plans shall include:
a detailed application of nearly zero-energy buildings including a numerical indicator of
primary energy use expressed in kWh/m² per year;
intermediate targets for improving the energy performance of new buildings, by 2015;
information on the policies and financial measures for the promotion of nZEBs.
According to CA EPBD report (2015), about 40% of the MSs do not yet have a detailed definition
of the nZEB in place. About 60% of the MSs have laid out their detailed nZEB definition in a
legal document, but a few of them emphasise the draft status of the definition, or that the
definition might be updated later on.
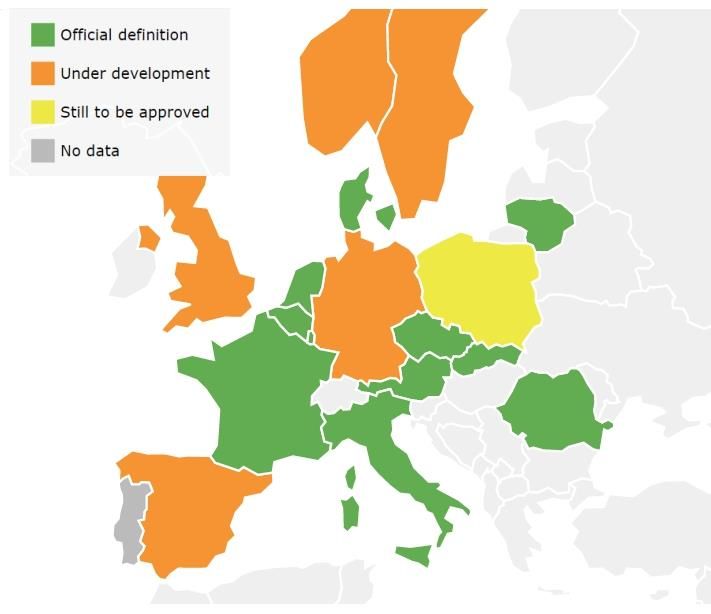
The Figure 1 shows the current status (May 2016) of the nZEB definition in the ZEBRA2020
selected countries.
9Deliverable 5.1: nZEB technology solutions, cost assessment and performance
Figure 1: nZEB definition by selected country. (Source: ZEBRA2020)
Although the common European nZEB definition, at national level the nZEB definition defined
from European MSs result similar but not identical.
For this reason, within ZEBRA2020, the ‘nZEB radar methodology’2, elaborated by project
partners, allows to identify the nZEBs built in the European area. This procedure starts from
nZEBs definition defined from the market tracking context and combines a qualitative and
quantitative analysis of energy performance standards of the buildings in relation of the territorial
context. The nZEB radar methodology defined four different categories in relation to the energy
efficiency qualities:
1. better than nZEBs: Net Zero Energy Buildings / Plus energy buildings;
2. nZEB buildings according to national definitions;
3. better than building code: buildings with an energy performance better than the
national requirements in 2012,
4. building code: buildings constructed/renovated according to national minimum
requirements in 2012.
1.2 Share of new nZEBs in selected European countries
In this chapter, it is shown the distribution of new nZEBs in the 17 selected European countries,
for residential and non-residential buildings. The results of the analysis are shown in the tool
“Energy efficiency trends in buildings” (http://www.zebra-monitoring.enerdata.eu/overall-
building-activities/), developed within ZEBRA2020 and it allows to display indicators on the
status of building stock target countries. This provides information on the trends of the new
nZEB construction in the building market from 2010. The used data are mainly collected from
national reports and databases. In some cases, it has been necessary to make assumptions
2
http://zebra2020.eu/website/wp-content/uploads/2014/08/ZEBRA2020-Deliverable-D21_final.pdf
10Deliverable 5.1: nZEB technology solutions, cost assessment and performance
due to the lack of data. In a few other cases, the lack of data and/or definitions did not allow
stating numbers for higher performance than “better than building code”.
Share of new residential nZEBs
In 2014, the percentage of new nZEBs (in yellow colour) or better than nZEBs (in green colour)
in some of the selected countries was very different between countries, as showed in the bar
chart of Figure 2. In France, for example, 100% of the new residential buildings achieved the
nZEB target (or better than nZEBs). On the other side, in countries like Romania, Spain,
Netherlands or United Kingdom the number of new nZEB (or better) was null or almost null,
also due to the lack of a national nZEB definition like in Norway and Sweden.
100%
80%
60%
40%
20%
0%
AT BE ES FR UK IT NL NO PL CZ DE RO SK SE
Building code Bettern than building code National official nZEB definition Better than nZEB
Figure 2: Distribution of new dwellings according to the nZEB radar graph in 2014. (Source: ZEBRA2020)
The trend of nZEB standard and better than nZEB of new dwellings buildings in selected
countries between 2010 and 2014 is represented in the bar chart of Figure 3. In 2013, France
achieved the target of 100% nZEB standard for new residential buildings. In Austria, the share
of new nZEB dwellings was also relatively high (over 35%). In other countries like Belgium, Italy
and Germany the share of new nZEB dwellings was between 15% and 25%, but with positive
increase as showed in Figure 4. On the other hand, there were other countries in which the
share of new nZEB dwellings was still almost void due to the lack of data or the low amount of
nZEBs.
11Deliverable 5.1: nZEB technology solutions, cost assessment and performance
AT
BE
CZ
DK
100% in France
FR for 2013 and 2014
DE
IT
PL
SK
UK
0.0% 10.0% 20.0% 30.0% 40.0% 50.0%
UK SK PL IT DE FR DK CZ BE AT
2014 1.10% 7.30% 11.43% 22.30% 13.39% 100.00% 4.36% 22.19% 35.76%
2013 0.74% 7.23% 8.75% 20.70% 15.25% 100.00% 10.80% 4.15% 7.09% 36.23%
2012 0.64% 5.24% 10.92% 14.40% 14.27% 34.53% 9.03% 3.61% 4.39% 31.93%
2011 1.01% 3.85% 8.83% 12.00% 12.91% 28.71% 0.35% 3.62% 5.15% 28.03%
2010 0.96% 3.54% 9.14% 8.70% 5.39% 17.15% 0.05% 2.83% 4.29% 26.89%
Figure 3: Share of new dwellings built according to nZEB definition or better than nZEB. (Source: ZEBRA2020)
100%
82.8%
80%
60%
40%
17.9%
20% 10.7% 13.6%
8.2% 8.0%
2.3% 1.5% 3.8%
0.1%
0%
AT BE DK FR UK IT PL CZ DE SK
Figure 4: Increase of new dwellings nZEB or better than nZEB between 2010 and 2014 (or first and last year
available). (Source: ZEBRA2020)
12Deliverable 5.1: nZEB technology solutions, cost assessment and performance
Share of new non-residential nZEBs
As the bar chart of Figure 5 shows, the share of new non-residential buildings with nZEB level
(or better) in 2014 was characterized by big differences in the selected countries. In France, all
the new non-residential buildings achieved the target of nZEBs or better than nZEBs, while in
other countries this amount was null like in Sweden, Spain, Netherlands and Austria.
100%
80%
60%
40%
20%
0%
AT ES FR IT NL PL CZ SK SE
Building code Bettern than building code National official nZEB definition Better than nZEB
Figure 5: Distribution of new non-residential buildings according to the nZEB radar graph in 2014. (Source:
ZEBRA2020)
The trend of new non-residential nZEBs or better than nZEBs built between 2010-2014 in the
selected countries was very dismal, Figure 6. France achieved the target in 2013, Poland
presented a positive trend close to 30% and Belgium and Italy near to 10% (Figure 7). Besides,
the issue of lack of data was more evidenced in the non-residential sector.
13Deliverable 5.1: nZEB technology solutions, cost assessment and performance
BE
CZ
DK
100% in France
for 2013 and 2014
FR
IT
PL
SK
0% 5% 10% 15% 20% 25% 30% 35% 40% 45% 50%
SK PL IT FR DK CZ BE
2014 5.0% 40.3% 10.3% 100.0% 1.0%
2013 6.5% 36.9% 10.6% 100.0% 1.8% 1.0% 6.0%
2012 2.9% 26.0% 8.7% 0.2% 0.0% 1.0% 5.0%
2011 2.7% 24.6% 8.0% 0.3% 0.0% 1.0% 2.7%
2010 2.2% 31.1% 14.5% 1.3% 0.0% 1.0% 8.5%
Figure 6: Share of new non-residential buildings built according to nZEB definition or better than nZEB. (Source:
ZEBRA2020)
99%
100%
80%
60%
40%
20%
9%
2% 3%
0% 0% 0%
0%
BE CZ DK FR IT PL SK
Figure 7: Increase of new non-residential nZEB or better than nZEB between 2010-2014 (or first and last year
available). (Source: ZEBRA2020)
14Deliverable 5.1: nZEB technology solutions, cost assessment and performance
2 nZEB features in European countries
2.1 Methodology of nZEB data collection
This part of the study aims to show possible solution sets and architectonical features of nZEBs
already built or renovated in the last years in the selected European countries.
The use of one strategy, solution or technology rather than another when renovating or
constructing an nZEB is influenced by various factors. On the one hand national strategies,
incentives and support schemes play an important role at national level, but on the other hand
factors linked to a specific geographical area like building traditions, climate conditions and
availability of sources, materials or technologies are also very relevant in the design process.
The approach used in this analysis was based on climatic zones instead of countries.
The analysis process has been based on the following steps:
- data collection, made by each project partner;
- definition of a common climate zone, in order to classify the buildings according to
comparable climatic conditions;
- common energy performance indictors;
- solutions sets:
o passive energy efficiency solutions
o active energy efficiency solutions
o renewable energy in nZEBs
nZEB data collection
In order to discover peculiarities and distinctive features of new and renovated nZEBs built
recently, a detailed data collection was realized in 173 selected European countries (Figure 8).
In total, data of 411 buildings were collected providing information on:
- location and climate;
- year of construction;
- kind of construction;
- use of building;
- energy performance;
- envelope features (U-Values and insulating materials);
- passive cooling strategies;
- heating, domestic hot water (DHW), cooling and mechanical ventilation technologies;
- use of renewable energy.
3
Austria, Belgium, Czech Republic, Denmark, France, Germany, Italy, Lithuania, Luxemburg, Norway, Poland, Romania, Slovakia,
Spain, Sweden, Netherlands and United Kingdom
15Deliverable 5.1: nZEB technology solutions, cost assessment and performance
Figure 8: Number of collected nZEBs in each selected European country.
As displayed in bar chart of Figure 9; 333 are new buildings and 78 are renovated building, 261
are residential buildings and 150 are non-residential.
400
78
350
300
250
44
200
333
150
34
100 217
50 116
0
Residential Non-Residential Total
New buildings Renovation
Figure 9: Number of collected nZEB by type of intervention and use of building.
In order to show a recent picture of the nZEB market and detect possible solution trends, the
selection of nZEBs was focused mainly on buildings constructed or renovated in the last 5 years,
see the bar chart of Figure 10.
16Deliverable 5.1: nZEB technology solutions, cost assessment and performance
90
80
Number of nZEBs
70
60
50
40
30
20
10
0
2004 2005 2006 2007 2008 2009 2010 2011 2012 2013 2014 2015
Renovation 0 1 1 3 2 2 14 14 11 17 11 2
New 6 4 4 1 6 12 55 58 75 50 49 13
New Renovation
Figure 10: Distribution of collected nZEBs by year of construction or renovation.
Definition of the climatic zones
In order to classify the collected nZEBs by climatic zones, within ZEBRA2020 a common
methodology was developed. The climatic zones defined are 5, according to the corresponding
Heating Degree Days (HDDs) and the Cooling Degree Days (CDDs) (as shown in Table 1).4
To calculate HDDs and CDDs it was used the online tool (http://www.degreedays.net), fixing
the same base temperature at 15°C for HDD and 18,5°C for CDD of the last 36 months.
Table 1: Climatic zone defined by ZEBRA2020, according to Heating and Cooling Degree Days limits.
Climatic Zone Heating and cooling degree days Climate
Buildings with HDDs >= 1962
Zone A Cold winters and warm summers
CDDs >= 525
Buildings with HDDs >= 1962
Zone B Cold winters and mild summers
CDDs < 525
Buildings with HDDs < 886
Zone C Warm winters and warm summers
CDDs >= 525
Buildings with HDDs between 886 and 1962
Zone D Temperate winters and mild summers
CDDs < 525
Buildings with HDDs between 886 and 1962
Zone E Temperate winters and warm summers
CDDs >= 525
Table 2, Table 3, and Figure 11 show that more than half of the collected nZEBs are located in
the climatic zone B, characterized by cold winters and mild summers.
Katerina Tsikaloudaki, Kostas Laskos and Dimitrios Bikas (2011). On the Establishment of Climatic Zones in Europe with Regards
to the Energy Performance of Buildings. Energies 2012, 5, 32-44 (http://www.mdpi.com/1996-1073/5/1/32/pdf).
17Deliverable 5.1: nZEB technology solutions, cost assessment and performance
Table 2 : Distribution of nZEB by climatic zone and use Table 3: Distribution of nZEB by climatic zone and
of building. type of intervention.
Non- New
Climatic Zone Residential Total Climatic Zone Renovation Total
residential buildings
Zone A 6 6 12 Zone A 12 0 12
Zone B 137 104 241 Zone B 190 51 241
Zone C 11 1 12 Zone C 11 1 12
Zone D 54 24 78 Zone D 62 16 78
Zone E 53 15 68 Zone E 58 10 68
Europe 17 261 150 411 Europe 17 333 78 411
Figure 11: Distribution map of collected nZEB according to climate zones.
The results are shown on the basis of the building use (residential and non-residential) and kind
of intervention (new or renovated), and in order to have a more representative sample of
buildings for each climate zones, the climate categories have been reduced to 3:
cold winter climates: climate zone A and B characterized by cold winters.
warm summer climates: climate zone C and E characterized by warm summers.
mild climate: climate D characterized by temperate winters and mild summers.
18Deliverable 5.1: nZEB technology solutions, cost assessment and performance
Indicators collected
Energy performance
To measure the energy performance of the buildings, there are different indicators and
calculation methodologies, which can be different in every country. For this reason and in order
to compare the ‘energy performance results’ of the collected buildings, it was necessary to
define a common energy performance indicator. After some controversies found in the primary
energy indicator due to different calculation methods and primary energy factors, within
ZEBRA2020 the energy performance results were represented through the Heating Demand
indicator (kWh/(m²year)).
Passive Energy Efficiency solutions
The passive energy efficiency solutions include:
- the building envelope solutions, such as wall, roof, windows, etc.;
- passive strategies for cooling, such as natural ventilation, etc.
Active Energy Efficiency solutions
The active energy efficiency solutions include:
- mechanic ventilation;
- heating systems, such as boiler (gas, biomass...), heat pumps, etc.;
- production of DHW, such as boiler (gas, biomass...), heat pumps, etc.;
- cooling system (only for warm summer climates).
Renewable Energy in nZEBs
The renewable energy solutions include only:
- electric production systems through Photovoltaic panels;
- thermal production systems through Solar thermal collectors.
19Deliverable 5.1: nZEB technology solutions, cost assessment and performance
2.2 nZEB features for cold winter climates
The number of nZEBs data collected in cold winter climates is 253, from which 202 are new
buildings (of which 118 are residential and 84 are non-residential), and 51 are renovated
buildings (of which 25 are residential and 26 are non-residential).
New nZEBs Renovated nZEBs
Energy performance Energy performance
In new residential buildings, the heating demand* for In renovated residential buildings, the heating
a large number of cases is between 14 and 22 demand* for a large cases of cases is between 16
kWh/(m²year), with an average of 19,8 and 27 kWh/(m²year), with an average of 21,3
kWh/(m²year), as shown in the box plot ** of Figure kWh/(m²year), as shown in the box plot ** of Figure
12. 14.
Figure 12: Heating demand of new residential buildings in Figure 14: Heating demand of renovated residential
cold winter climates. buildings in cold winter climates.
In new non-residential buildings, the heating In renovated non-residential buildings, the heating
demand* for a large number of cases, is between 11 demand* for a large number of cases is between 12
and 16 kWh/(m²year), with an average of 17 and 38 kWh/(m²year), with an average of 28,5
kWh/(m²year), as seen in the box plot ** of Figure kWh/(m²year), as seen in the box plot ** of Figure
13. 15.
Figure 13: Heating demand of new non-residential Figure 15: Heating demand of renovated non-residential
buildings in cold winter climates. buildings in cold winter climates.
*Some buildings have a high value for Heating Demand, nonetheless they can reach nZEB level due to a low value of Primary Energy.
**Box plot: Way of representing statistical data on a plot in which a rectangle is drawn to represent the second and third quartiles, with a vertical line
inside to indicate the median value. The lower and upper quartiles are shown as horizontal lines either side of the rectangle.
20Deliverable 5.1: nZEB technology solutions, cost assessment and performance
Passive Energy Efficiency solutions Passive Energy Efficiency solutions
Wall Wall
The thermal transmittance averages of the walls The thermal transmittance averages of the walls
are: are:
- Uwall-Value 0,18 W/m²K for residential buildings - Uwall-Value 0,20 W/m²K for residential buildings
- Uwall-Value 0,14 W/m²K for non-residential buildings. - Uwall-Value 0,18 W/m²K for non-residential
buildings.
The most common wall insulating materials are:
- expanded polystyrene (27%) for residential The most common wall insulating materials are:
buildings; - expanded polystyrene (24%) for residential
- stone wool (19%) for non-residential buildings. buildings;
- stone wool (23%) for non-residential buildings.
Roof Roof
The thermal transmittance averages of the roofs The thermal transmittance averages of the roofs
are: are:
- Ur-Value 0,11 W/m²K for residential buildings; - Ur-Value 0,13 W/m²K for residential buildings;
- Ur-Value 0,16 W/m²K for non-residential buildings. - Ur-Value 0,12 W/m²K for non-residential buildings.
The most common insulating material is stone wool The most common wall insulating materials are:
for residential (19%) and for non-residential (14%) - wood fiber (24%) for residential buildings;
buildings. - cellulose (14%) for non-residential buildings.
Windows Windows
The averages Uw-Value are: The averages Uw-Value are:
-0,84 W/m²K for residential buildings; -0,88 W/m²K for residential buildings;
-0,85 W/m²K for non-residential buildings. -0,94 W/m²K for non-residential buildings.
The most common type of glass is triple glass for The most common type of glass is triple glass for
both residential (57%) and non-residential (56%). both residential (84%) and non-residential (58%).
Passive cooling strategies Passive cooling strategies
The passive cooling solutions used in residential The passive cooling solutions used in residential
buildings are: buildings are:
-sunshade (24%); -sunshade (48%);
-natural ventilation (16%); -thermal mass (48%);
-thermal mass (16%); -natural ventilation (44%);
-night cooling (15%); -night cooling (44%);
-sunspaces (1%); -none or unknown (48%).
-other (3%);
-none or unknown (73%). The passive cooling solutions used in non-
residential buildings are:
The passive cooling solutions used in non- -night cooling (27%);
residential buildings are: -sunshade (23%);
-sunshade (18%); -thermal mass (15%);
-natural ventilation (8%); -natural ventilation (15%);
-evaporative cooling (4%); -evaporative cooling (4%);
-night cooling (2%); -other (4%);
-thermal mass (2%); -none or unknown (50%).
-sunspaces (1%);
-other (13%);
-none or unknown (65%).
Active Energy Efficiency solutions Active Energy Efficiency solutions
Mechanical Ventilation Mechanical Ventilation
New nZEBs use mechanical ventilation systems Renovated nZEBs use mechanical ventilation
with heat recovery in 80% of cases. systems with heat recovery in:
- 81% of residential building;
The efficiency averages of the heat recovery - 92% of non-residential building;
systems are:
- 85% in residential buildings;
21Deliverable 5.1: nZEB technology solutions, cost assessment and performance
- 81% in non-residential buildings. The efficiency averages of the heat recovery
systems are:
- 84% in residential building;
- 82% in non-residential building.
Heating system Heating system
In residential, the most used heating system types In residential, the most used heating system types
are: are:
-heat pumps (31%); -district heating (40%);
-district heating (21%); -low temperature non-condensing boiler (16%);
-condensing boiler (17%). -stove (12%).
In non-residential, the most used heating system In non-residential, the most used heating system
types are: types are:
-heat pumps (32%); - heat pump (28%);
-district heating (27%); - district heating (27%);
-condensing boiler (11%). - condensing boiler (15%).
In residential and non-residential, electricity is the Concerning the energy carrier, district heating is the
most used energy carrier for heating. most used.
Domestic Hot Water Domestic Hot Water
In residential, half of DHW systems are the same as The most common DHW systems are the same
the heating system types. systems as the ones used in the heating system, in
In non-residential, the DHW system are: both residential (56%) and non-residential (38%)
- The same as the heating system in 31% of the buildings.
cases;
- A dedicated generation system in 31% of the
cases.
Renewable Energy Renewable Energy
Photovoltaic systems Photovoltaic systems
In residential, 30% of the buildings use photovoltaic In residential, 16% of the buildings use photovoltaic
systems. systems.
In non-residential, 27% of buildings use photovoltaic In non-residential, 27% of buildings use photovoltaic
systems. systems.
Solar thermal systems Solar thermal systems
In residential, 31% of the buildings use solar thermal In residential, 32% of the buildings use solar thermal
systems. systems.
In non-residential, 24% of buildings use solar In non-residential, 15% of buildings use solar
thermal systems. thermal systems.
22Deliverable 5.1: nZEB technology solutions, cost assessment and performance
2.3 nZEB features for warm summer climates
The number of nZEBs data collected in warm summer climates is 80, from which 69 are new
buildings (of which 55 are residential and 14 are non-residential), and 11 are renovated buildings
(of which 9 are residential and 2 are non-residential).
New nZEBs Renovated nZEBs
Energy performance Energy performance
In new residential buildings, the heating demand* In renovated residential buildings, the heating
for a large number of cases is between 9 and 17 demand* for a large number of cases is between 21
kWh/(m²year), with an average of 14,0 and 29 kWh/(m²year), with an average of 25,1
kWh/(m²year), as shown in the box plot ** of Figure kWh/(m²year), as seen in the box plot ** of Figure
16. 18.
Figure 16: Heating demand of new residential buildings in Figure 18: Heating demand of renovated residential
warm summer climates. buildings in warm summer climates.
In new non-residential buildings, the heating In renovated non-residential buildings, the heating
demand* for a large number of cases is between 6 demand* for a large number of cases is between 3
and 36 kWh/(m²year), with an average of 24,8 and 14 kWh/(m²year), with an average of 8,5
kWh/(m²year), as seen in the box plot ** of Figure kWh/(m²year), as shown in the box plot ** of Figure
17. 19. Notwithstanding the sample of nZEBs for non-
residential buildings is very low (2 nZEBs), therefore
this value is not amply representative.
Figure 17: Heating demand of new non-residential
buildings in warm summer climates. Figure 19: Heating demand of renovated non-residential
buildings in warm summer climates.
*Some buildings have a high value for Heating Demand, nonetheless they can reach nZEB level due to a low value of Primary Energy.
**Box plot: Way of representing statistical data on a plot in which a rectangle is drawn to represent the second and third quartiles, with a vertical line inside
to indicate the median value. The lower and upper quartiles are shown as horizontal lines either side of the rectangle.
23Deliverable 5.1: nZEB technology solutions, cost assessment and performance
Passive Energy Efficiency solutions Passive Energy Efficiency solutions
Wall Wall
The thermal transmittance averages of the walls The thermal transmittance averages of the walls
are: are:
- Uwall-Value 0,17 W/m²K for residential buildings - Uwall-Value 0,18 W/m²K for residential buildings
- Uwall-Value 0,14 W/m²K for non-residential - Uwall-Value 0,19 W/m²K for non-residential buildings.
buildings.
The most common wall insulating materials are:
The most common wall insulating materials are: - expanded polystyrene (44%) for residential
- expanded polystyrene (25%) for residential buildings;
buildings; - stone wool (50%) for non-residential buildings.
- stone wool (19%) for non-residential buildings.
Roof Roof
The thermal transmittance averages of the roofs The thermal transmittance averages of the roofs
are: are:
- Ur-Value 0,24 W/m²K for residential buildings; - Ur-Value 0,20 W/m²K for residential buildings;
- Ur-Value 0,15 W/m²K for non-residential buildings. - Ur-Value 0,17 W/m²K for non-residential buildings.
The most common insulating material is: The most common wall insulating material is:
- 35% wood fiber for residential building; - wood fiber (44%) for residential buildings;
- 14% expanded polystyrene for non-residential - stone wool (50%) for non-residential buildings.
buildings.
Windows Windows
The average Uw-Value is: The average Uw-Value is:
-1,16 W/m²K for residential buildings; -1,16 W/m²K for residential buildings;
-1,17 W/m²K for non-residential buildings. -1,12 W/m²K for non-residential buildings.
The most common types of glass are: The most common type of glass is triple glass for
- Triple glass (47%) for residential buildings; residential buildings (44%), while in non-residential
- Triple glass (29%) and low emission double glass there is no data.
(29%) for non-residential buildings.
Passive cooling strategies Passive cooling strategies
The passive cooling solutions used in residential The passive cooling solutions used in residential
buildings are: buildings are:
-natural ventilation (55%); -natural ventilation (56%);
-sunshade (55%); -sunshade (56%);
-night cooling (49%); -night cooling (56%);
-thermal mass (47%); -thermal mass (56%);
-sunspaces (7%); -sunspaces (11%);
-other (4%); -None or unknown (33%).
-None or unknown (36%).
The passive cooling solutions used in non-
The passive cooling solutions used in non- residential buildings are:
residential buildings are: -sunshade (50%);
-sunshade (50%); -None or unknown (50%).
-natural ventilation (43%);
-night cooling (36%);
-thermal mass (36%);
-none or unknown (43%).
Active Energy Efficiency solutions Active Energy Efficiency solutions
Mechanical Ventilation Mechanical Ventilation
New nZEBs use mechanical ventilation systems Renovated nZEBs use mechanical ventilation
with heat recovery in 90% of cases, in both systems with heat recovery in:
residential and non-residential buildings. - 78% of residential building;
- 100% of non-residential building;
The efficiency average of the heat recovery
systems is 83%.
24Deliverable 5.1: nZEB technology solutions, cost assessment and performance
The efficiency averages of the heat recovery
systems are:
- 85% in residential building;
- 95% in non-residential building.
Heating system Heating system
In residential as well as in the non-residential the In residential buildings the most used heating
most used heating systems are: systems is:
- heat pumps, about 57%; - condensing boiler (56%).
- boiler (residential 15%, non-residential 14%).
In non-residential buildings the most used heating
In line with the heating system type, electricity is in system is:
both cases the most used energy carrier (near - heat pump (100%).
60%).
Concerning the energy carrier, gas (56%) is the
most used in residential and electricity (100%) in
non-residential.
Domestic Hot Water Domestic Hot Water
In residential, the most common option for DHW 67% of residential buildings use a DHW system
system is the option partially depending on solar partially depending on solar thermal collectors and
thermal collectors and integration with the heating integration with the heating system.
system (31%). No data is provided for non-residential buildings.
In non-residential, the most common system is a
dedicated generation system (36%).
Cooling system Cooling system
In residential, 53% of the buildings use cooling In residential, 22% of the buildings use cooling
system and the most used cooling systems are: system and the used cooling systems are:
- heat pumps using outside air as the heat source - heat pumps using outside air as the heat source
(22%); (11%);
- heat pumps using soil as the heat source (7%); - heat pumps using soil as the heat source (11%);
- heat pumps using water as the heat source (7%).
In non-residential, the two selected buildings use
In non-residential, 79% of the buildings use cooling heat pumps using water as the heat source as
system and the most used cooling systems are: cooling system.
- heat pumps using outside air as the heat source
(36%).
- heat pumps using soil as the heat source (21%);
- heat pumps using exhaust air as the heat source
(14%);
Renewable Energy Renewable Energy
Photovoltaic systems Photovoltaic systems
In residential, 55% of the buildings use photovoltaic In residential, 44% of the buildings use photovoltaic
systems. systems.
In non-residential, 43% of buildings use In non-residential, 100% of buildings use
photovoltaic systems. photovoltaic systems.
Solar thermal systems Solar thermal systems
In residential, 44% of the buildings use solar In residential, 78% of the buildings use solar thermal
thermal systems. systems.
In non-residential, 29% of buildings use solar In non-residential, no buildings mentioned to use
thermal systems. solar thermal systems.
25Deliverable 5.1: nZEB technology solutions, cost assessment and performance
2.4 nZEB features for mild climate
The number of nZEBs data collected in mild climate is 78, from which 62 are new buildings (of
which 44 are residential and 18 are non-residential), and 16 are renovated buildings (of which
10 are residential and 6 are non-residential).
New nZEBs Renovated nZEBs
Energy performance Energy performance
In new residential buildings, the heating demand* In renovated residential buildings, the heating
for a large number of cases, is bet ween 8 and 15 demand* for a large number of cases is between 13
kWh/(m²year), with an average of 14,0 and 24 kWh/(m²year), with an average of 17,5
kWh/(m²year), as shown in the box plot ** Figure 20. kWh/(m²year), as seen in the box plot ** Figure 22.
Figure 20: Heating demand of new residential buildings in Figure 22: Heating demand of renovated residential
mild climates. buildings in mild climates.
In new non-residential buildings the heating In renovated non-residential buildings, the heating
demand*, for a large number of cases, is between 9 demand* for a large number of cases is between 9
and 15 kWh/(m²year), with an average of 11,4 and 33 kWh/(m²year), with an average of 20,0
kWh/(m²year), as seen in the box plot ** Figure 21. kWh/(m²year), as shown in the box plot ** Figure 23.
Figure 21: Heating demand of new non-residential Figure 23: Heating demand of renovated non-residential
buildings in mild climates. buildings in mild climates.
*Some buildings have a high value for Heating Demand, nonetheless they can reach nZEB level due to a low value of Primary Energy.
**Box plot: Way of representing statistical data on a plot in which a rectangle is drawn to represent the second and third quartiles, with a vertical line inside
to indicate the median value. The lower and upper quartiles are shown as horizontal lines either side of the rectangle.
26Deliverable 5.1: nZEB technology solutions, cost assessment and performance
Passive Energy Efficiency solutions Passive Energy Efficiency solutions
Wall Wall
The thermal transmittance averages of the walls The thermal transmittance averages of the walls
are: are:
- Uwall-Value 0,14 W/m²K for residential buildings - Uwall-Value 0,12 W/m²K for residential buildings
- Uwall-Value 0,14 W/m²K for non-residential - Uwall-Value 0,11 W/m²K for non-residential buildings.
buildings.
The most common wall insulating materials are:
The most common wall insulating materials are: - expanded polystyrene (30%) for residential
- expanded polystyrene (27%) for residential buildings;
buildings; - expanded polystyrene (33%) for non-residential
- stone wool (28%) for non-residential buildings. buildings.
Roof Roof
The thermal transmittance averages of the roofs The thermal transmittance averages of the roofs
are: are:
- Ur-Value 0,13 W/m²K for residential buildings; - Ur-Value 0,12 W/m²K for residential buildings;
- Ur-Value 0,12 W/m²K for non-residential buildings. - Ur-Value 0,12 W/m²K for non-residential buildings.
The most common insulating material is: The most common wall insulating material is:
- 18% stone wool for residential building; - cellulose fiber (30%) for residential buildings;
- 28% expanded polystyrene for non-residential - stone wool (33%) for non-residential buildings.
buildings.
Windows Windows
The average Uw-Value is: The average Uw-Value is:
-0,99 W/m²K for residential buildings; -0,97 W/m²K for residential buildings;
-0,87 W/m²K for non-residential buildings. -0,89 W/m²K for non-residential buildings.
The most common types of glass are: The most common types of glass are:
- Triple glass (57%) for residential buildings; - Triple glass (70%) for residential buildings;
- Triple glass (61%) for non-residential buildings. - Triple glass (67%) for non-residential buildings.
Passive cooling strategies Passive cooling strategies
The passive cooling solutions used in residential The passive cooling solutions used in residential
buildings are: buildings are:
-sunshade (27%); -sunshade (10%);
-natural ventilation (23%); -natural ventilation (10%);
-thermal mass (20%); -thermal mass (10%);
-None or unknown (70%). -night cooling (10%);
-other (10%);
The passive cooling solutions used in non- -None or unknown (80%).
residential buildings are:
-sunshade (17%); The passive cooling solutions used in non-
-night cooling (17%); residential buildings are:
-natural ventilation (11%); -none or unknown (100%).
-thermal mass (11%);
-none or unknown (72%).
Active Energy Efficiency solutions Active Energy Efficiency solutions
Mechanical Ventilation Mechanical Ventilation
New nZEBs use mechanical ventilation systems Renovated nZEBs use mechanical ventilation
with heat recovery in: systems with heat recovery in:
- 86% of residential building; - 70% of residential building;
- 78% of non-residential building. - 78% of non-residential building.
The efficiency averages of the heat recovery The efficiency averages of the heat recovery
systems are: systems are:
- 87% in residential building; - 91% in residential building;
- 85% in non-residential building. - 80% in non-residential building.
27Deliverable 5.1: nZEB technology solutions, cost assessment and performance
Heating system Heating system
In residential buildings, the most used heating In residential buildings, the most used heating
systems are: systems are:
- heat pump (40%); - condensing boiler (30%);
- condensing boiler (20%); - heat pump (30%).
- stove (20%).
In non-residential buildings, the most used heating
In non-residential buildings, the most used heating systems are:
systems are: - heat pump (33%);
- heat pump (40%); - non-condensing boiler (33%).
- boiler (33%).
In 70% of residential buildings, the energy carrier for
Electricity is the most used energy carrier for heating is unknown, while in non-residential, gas
residential, while gas is the most used in non- (33%) and wood chips (33%) are the more common
residential. energy carriers for heating.
Domestic Hot Water Domestic Hot Water
In residential, the most common system for DHW is In residential, 50% of buildings use as DHW system
the system partially depending on solar thermal a partially depending on solar thermal collectors and
collectors and integration with the heating system integration with the heating system;
(41%). In non-residential, 50 % of the buildings use the
In non-residential, 44% of the systems are same system as the heating system (50%).
dedicated generation systems.
Renewable Energy Renewable Energy
Photovoltaic systems Photovoltaic systems
In residential, 33% of the buildings use photovoltaic In residential, 10% of the buildings use photovoltaic
systems. systems.
In non-residential, 44% of the buildings use In non-residential, 50% of buildings use photovoltaic
photovoltaic systems. systems.
Solar thermal systems Solar thermal systems
In residential, 41% of the buildings use solar thermal In residential, 40% of the buildings use solar thermal
systems. systems.
In non-residential, 22% of buildings use solar In non-residential, 33% of buildings use solar
thermal systems. thermal systems.
28Deliverable 5.1: nZEB technology solutions, cost assessment and performance
2.5 Solution-set for new nZEBs
The listed typical solution-set for new nZEBs is based on the collected data of recently
constructed nZEBs, considering different climate categories, most recurrent technologies and
the use of the building. Every building project has to be designed according to local climate
conditions, building type and has to meet the current regulation requirements.
Residential nZEBs Non-residential nZEBs
Passive Energy Efficiency solutions
Wall Thermal transmittance Around 0,20 W/m²K Around 0,15 W/m²K
Insulating material Expanded polystyrene Stone wool
Roof Thermal transmittance Around 0,10 W/m²K. Around 0,15 W/m²K.
Cold winter climates
Insulating material Stone wool Stone wool
Windows Thermal transmittance Around 0,85 W/m²K Around 0,85 W/m²K
Type of glass Triple glass Triple glass
Passive cooling solutions Sunshade, natural ventilation, thermal mass and night Sunshade, natural ventilation, thermal mass,
cooling. evaporative cooling and night cooling.
Active Energy Efficiency solutions
Mechanical Ventilation MV using heat recovery with efficiency about 85%. MV using heat recovery with efficiency about 85%.
Heating system type Heat pumps or District Heating, when available Heat pumps or District Heating, when available
Energy carrier for heating Electricity or district heating as energy carrier Electricity or district heating as energy carrier
Domestic Hot Water system Same as heating system. Same as heating system or dedicated generation
system.
Renewable Energy
Photovoltaic and solar thermal systems Photovoltaic and solar thermal Photovoltaic and solar thermal
Passive Energy Efficiency solutions
Wall Thermal transmittance Around 0,15 W/m²K Around 0,15 W/m²K
Insulating material Expanded polystyrene Stone wool
Roof Thermal transmittance Around 0,25 W/m²K. Around 0,15 W/m²K.
Insulating material Wood fiber Expanded polystyrene
Warm summer climates
Windows Thermal transmittance Around 1,15 W/m²K Around 1,15 W/m²K
Type of glass Triple glass Triple and low emission double glass
Passive cooling solutions Sunshade, natural ventilation, thermal mass and night Sunshade, natural ventilation, thermal mass and night
cooling. cooling.
Active Energy Efficiency solutions
Mechanical Ventilation Mechanical ventilation using heat recovery with Mechanical ventilation using heat recovery with
efficiency about 85%. efficiency about 85%.
Heating system type Heat pumps Heat pumps
Energy carrier for heating Electricity Electricity
Domestic Hot Water system Partially depending on solar thermal collectors and Dedicated generation system.
integration with the heating system.
Cooling system type Heat pumps Heat pumps
Renewable Energy
Photovoltaic and solar thermal systems Photovoltaic and solar thermal Photovoltaic and solar thermal
Passive Energy Efficiency solutions
Wall Thermal transmittance Around 0,15 W/m²K Around 0,15 W/m²K
Insulating material Expanded polystyrene Stone wool
Roof Thermal transmittance Around 0,15 W/m²K. Around 0,10 W/m²K.
Insulating material Stone wool Expanded polystyrene
Windows Thermal transmittance Around 1,0 W/m²K Around 0,90 W/m²K
Mild climates
Type of glass Triple glass Triple glass
Passive cooling solutions Sunshade, natural ventilation and thermal mass. Sunshade, natural ventilation, thermal mass and night
cooling.
Active Energy Efficiency solutions
Mechanical Ventilation MV using heat recovery with efficiency about 85%. MV using heat recovery with efficiency about 80%.
Heating system type Heat pumps Heat pumps and boilers
Energy carrier for heating Electricity Gas and electricity
Domestic Hot Water system Partially depending on solar thermal collectors and Dedicated generation system.
integration with the heating system.
Renewable Energy
Photovoltaic and solar thermal systems Photovoltaic and solar thermal Photovoltaic and solar thermal.
29You can also read