PROPORTIONAL REPRESENTATION IN PRACTICE - An International Comparison of Ballots and Voting Rules - Fraser Institute
←
→
Page content transcription
If your browser does not render page correctly, please read the page content below

2018

PROPORTIONAL REPRESENTATION
IN PRACTICE
An International Comparison of Ballots and Voting Rules

Lydia Miljan and Geoffrey Alchin

fraserinstitute.org
Contents

Executive Summary / i

Introduction / 1

Electoral Systems / 2

Plurality and Majoritarian Systems / 4

Proportional Representation / 9

Conclusion / 22

References / 24

     Acknowledgments      /     33
     About the authors   / 33
     Publishing information     / 34
     Supporting the Fraser Institute     / 35
     Purpose, funding, and independence         / 35
     About the Fraser Institute      / 36
     Editorial Advisory Board     / 37

                                                       fraserinstitute.org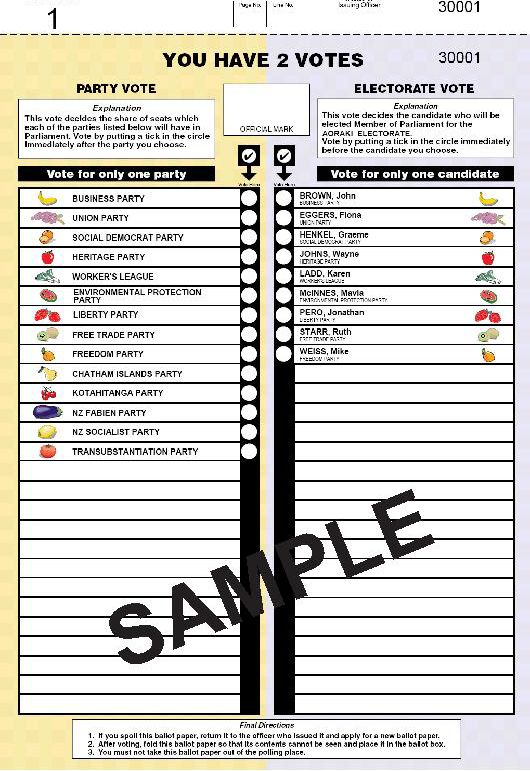
fraserinstitute.org

Executive Summary

The BC NDP and Green party caucuses have signalled that they are com-
mitted to having the upcoming referendum on electoral reform be a choice
between the current electoral system (first-past-the-post or FPTP) and
proportional representation (PR). Given that PR systems can vary widely
in practice, this paper examines the institutional characteristics of three
systems that are potential replacements for the simple plurality or FPTP
system: Party List Proportional, Mixed Member Proportional (MMP), and
Single Transferable Vote (STV). There are undeniable strengths in all three
systems, but all are found wanting given the political realities in British
Columbia. This paper argues that replacing BC’s current FPTP electoral
system will require both trade-offs and an understanding of the impact
that such changes will have on the way votes are counted.
       The Party List Proportional system is commonly used in most
European democracies. In these systems, candidates run in ridings that
have more than one member. There are two types of Party List system.
The first is the Closed Party List system in which the electorate votes for
their preferred political party. The second is the Open Party List system in
which the electorate votes for their preferred candidate and their preferred
political party. There can be many differences between these sub-systems
stemming from their different seat allocation formulae, district sizes, and
vote thresholds. Advocates for reform point out that the Party List Pro-
portional system increases the likelihood of women and minorities being
elected. However, critics note that this system, especially the Closed Party
List system, weakens the link between the MP and the constituency.
       Germany, New Zealand, and Mexico, among other countries, use
the Mixed Member Proportional electoral system. Its main feature is that
it combines a plurality or majority system with proportionality. In this sys-
tem, the electorate votes twice on the same ballot. The first vote, the party
vote, is to select the political party. The second vote, the electorate vote, is
the plurality or majority vote by which voters choose the candidate they
wish to fill the seat. In most cases, FPTP is the selection method for the
electorate vote. The advantages of MMP include: reducing wasted votes,
providing more choices when voting, reducing the dominance of larger

                                                               fraserinstitute.org
ii / The Consequences of Electoral Reform in British Columbia

                          parties, helping smaller parties grow, and preserving the link between
                          the MP and the electorate. However, by providing more choice, fringe
                          parties tend to be given more power, which increases the likelihood of
                          minority or coalition governments, increasing the possibility of collusion
                          between parties to impede opponents, and potentially creating large and
                          complex ballots.
                                The Australian Senate, Malta, the Republic of Ireland, and North-
                          ern Ireland all use the Single Transferable Vote electoral system. Its main
                          feature is that it enables voters to choose candidates from different parties,
                          but also candidates from the same party. Because it allows voters to choose
                          between parties and between candidates, it preserves the link between
                          the MP and the electorate, helps independent candidates get elected,
                          reduces the number of wasted ballots, and provides incentives to parties to
                          provide a balanced team of candidates, which may help promote women
                          and minority groups. However, because of the complexity of the electoral
                          formulae, it tends to take a greater amount of time to determine winners
                          with this system, it is prone to “donkey voting” whereby voters simply rank
                          candidates in the order they appear on the ballot, and often leads to large
                          and complex ballot papers.
                                Any replacement of BC’s current FPTP electoral system will require
                          trade-offs, an understanding of the impact that such changes will have on
                          the way votes are counted, and what impact the new system may have on
                          the legislature and the party system.

fraserinstitute.org
Introduction

The British Columbia government has set out the ballot question for the
upcoming referendum on electoral reform (British Columbia, 2018). It will
consist of a two-part ballot. The first part will ask a straightforward question:

      “Which system should British Columbia use for provincial
      elections?”
      Voters will choose one of the following:
      • The current First Past the Post voting system
      • A proportional representation voting system

      If a majority selects a change to the voting sytem, then the second
question will be used to develop the alternate electoral system. The second
question ask:
      “If British Columbia adopts a proportional representation voting
      system, which of the following voting systems do you prefer?”
      Voters will rank or select one or more of the following:
      • Dual Member Proportional (DMP)
      • Mixed Member Proportional (MMP)
      • Rural-Urban Proportional (RUP)

        Of the three options provided, only MMP has been used in practice.
This is problematic as voters will have no understanding or appreciation of
how these systems will work in British Columbia.
        A jurisdiction’s choice of electoral system has a profound impact
on the number of parties, electoral disproportionality, party extremism,
and policy choices (Golder, 2005). This paper reviews and examines each
of these elements and explains how they operate in practice internation-
ally. It will proceed by first examining the types of electoral systems, and
then reviewing the way in which countries around the world cast ballots,
count votes, and allocate seats in those systems. Although we cannot tell
readers how the rural-urban PR, or DMP would work in British Columbia,
we can give readers a sense of the complexity and options found in other
PR systems. This exercise should give readers some guidance as there are
elements of all these systems in the proposed referendum question.

                                                                fraserinstitute.org
Electoral Systems

                      How citizens vote in a democratic country, province, state, or even city, in-
                      fluences how governments are selected and how those governments oper-
                      ate. As the IDEA Handbook on Electoral System Design notes, the electoral
                      system is “the easiest political institution to manipulate, for good or for
                      bad” (Reynolds, Reilly, and Eillis, 2008: 5). Some also believe that electoral
                      systems are crucial to democratic rule by ensuring that the government
                      remains responsive and accountable to its citizens (Bormann and Golder,
                      2013).
                             Electoral systems are complex and multifaceted, and few countries
                      share identical systems. Indeed, there are many components to jurisdic-
                      tion’s electoral system, including: the electoral formula, which deter-
                      mines how votes are translated into seats; the electoral threshold, or the
                      minimum proportion of votes needed to be awarded a seat; and district
                      magnitude, which is the number of seats in each electoral district. Table 1
                      below lists most of the countries referred to in this paper and the various
                      components of their electoral systems that are discussed in more detail
                      below.

fraserinstitute.org
Table 1: Current Electoral System Characteristics for Lower Houses or
Unicameral Legislatures, OECD Countries
Country Electoral Party Formal Total Number Num- Total
Formula List Vote Num- of Single ber of Number of
Thresh- ber Member List Multi-Mem-
old (%) of District District ber Districts
MPs MPs MPs for Lists
PLURALITY AND MAJORITARIAN
Australia Alternative Vote N/A N/A 150 150 0 0
Canada First-past-the-post N/A N/A 338 338 0 0
France Two-Round Majori- N/A N/A 577 577 0 0
tarian
United Kingdom First-past-the-post N/A N/A 650 650 0 0
United States First-past-the-post N/A N/A 450 450 0 0
MIXED
Germany Mixed-Member Closed 5% 622 299 323 16
Proportional
Hungary Mixed-Member Closed 5% 199 106 93 1
Proportional
Japan Parallel Plurality-PR Open N/A 465 289 176 11
New Zealand Mixed-Member Closed 5% 120 70 50 1
Proportional
PROPORTIONAL REPRESENTATION
Austria List PR Closed 4% 183 0 183 9
Belgium List PR Open 5% 150 0 150 11
Czech Republic List PR Open 5% 200 0 200 14
Denmark List PR Open 2% 179 0 179 10
Estonia List PR Open 5% 101 0 101 12
Finland List PR Open None 200 1 199 14
Greece List PR Open 3% 300 8 292 49
Iceland List PR Closed 5% 63 0 63 6 or 7
Ireland Single Transferable — — 158 0 158 40
Vote
Israel List PR Closed 3.25% 120 0 120 1
Italy List PR Open 3% 630 9 621 21
Luxembourg List PR Open None 60 0 60 4
Netherlands List PR Closed 0.67% 150 0 150 18
Norway List PR Open 4% 169 0 169 19
Poland List PR Open 5% 460 0 460 41
Portugal List PR Closed None 230 0 230 22
Slovakia List PR Closed 5% 150 0 150 1
Slovenia List PR Open 4% 90 0 90 8
Spain List PR Closed 3% 350 2 348 50
Sweden List PR Closed 4% 349 0 349 30
Switzerland List PR Open None 200 5 195 21
Notes:
In Finland one member is elected by a simple majority for the province of Åland.
In Greece there are eight single-member constituencies.
There are nine single member seats in Italy (one for Valle d’Aosta and eight for Trentino-Alto Adige).
There are two single member seats in Spain for the North African regions of Ceuta and Melilla.
Sources: Inter-Parliamentary Union (2018); Lijphart, 2012.Plurality and Majoritarian Systems
Canada’s federal and provincial electoral systems are part of the plurality
and majoritarian family of electoral systems. These electoral systems tend
to produce majority governments whether or not a party receives a major-
ity of the votes. The focus of these systems is to produce an effective work-
ing government by allowing the party that wins the most electoral seats
to carry out its platform with few impediments. One consequence of such
majority governments is that they are often held more accountable than
coalition governments because the public is able to judge the government’s
policy record clearly (Norris, 1997).
Within this family of systems, British Columbia and Canada use an
electoral formula known as First-Past-the-Post (FPTP), or single member
plurality (SMP), which works as follows in BC. The province is divided
into single-member districts organized by population and region of which
there were 87 as of the last election. On election day, voters go to the polls
and vote for their preferred candidate to represent their constituency. The
candidate who receives the largest share (or plurality) of votes in the con-
stituency is elected to the legislature, and the party that has the most seats
(often a majority) in the legislature governs. One key benefit of a plurality
system is that determining the outcome is simple and straightforward. The
candidate with the most votes wins. When regimes value proportionality
over clarity of outcome, they have to devise specific and often complex
rules to determine the outcome of an election.
Electoral reform advocates often argue that FPTP isn’t democratic.
They make this claim by insisting that all the seats are won by a simple
plurality (i.e., treating them as a group) rather than a majority (a collection
of individual seat winners from the ridings). They do this by calculating
the overall popular vote and comparing that to the number of seats won by
the government. This direct comparison of overall popular vote and seat
allocation ignores a fundamental element of Canada’s electoral system:
regional representation. It is often the case that in each riding the winner
is the person who receives a majority, not simply a plurality, of votes. In a
two-party system, the winner is most likely the party that receives more
than 50 percent of the vote. However, when the party system has more
fraserinstitute.orgProportional Representation in Practice: An International Comparison of Ballots and Voting Rules / 5
than two effective parties, as is the case currently in BC, it becomes more
difficult to win with a majority than a plurality. Yet even in a two-plus
party system, it is the case that more seats are won by a majority than by a
plurality. Indeed, in both the BC elections of 2013 and 2017, a majority of
seats were won with majorities—54 percent of seats in 2013 and 53 per-
cent in 2017. This finding emphasizes the fact that the FPTP formula does
not invariably distort popular support. As we will see below, PR systems
often do not have this kind of result and end up distorting regional sup-
port in the guise of proportionality.
For regimes other than FPTP, a primary objective following the elec-
tion is calculating the majority that will determine who receives the seat
in each constituency Within the majoritarian family, a variety of different
electoral formula and different mechanisms are used to try to ensure that
the winning candidate in a constituency achieves a majority of the votes.
Two such formulae are France’s two-round system and the Alternative
Vote system that Australia uses to elect members to its lower house. Elec-
tions under these two systems are similar to elections using FPTP rules in
that they all use single-member districts. The difference is in the way votes
are translated into seats. Under France’s two-round system, if no candidate
receives a majority of votes in the initial round of voting, a second election
is held among the candidates that attained a vote share equal to a certain
percentage of registered voters. The candidate with the most votes in the
second round wins the seat. By allowing voters to cast a subsequent vote,
France achieves a higher degree of consensus around the eventual win-
ner. However, the fact remains that the second round now includes vot-
ers’ second and first choices. Other regimes that rank candidates include
Malta, the Republic of Ireland, Northern Ireland, and Tasmania, though
each adjusts the voting system slightly.
Australia’s Alternative Vote system requires voters to rank their
preferences among all the candidates in their constituency. If no candidate
receives a majority of the first preference votes, then the candidate with
the fewest votes is dropped and that person’s votes are redistributed based
on the second or subsequent preferences of their voters. The process is
repeated until one candidate achieves a majority.
The Australian Senate uses STV, a system in which voters select
individual candidates from party lists. However, the structure of the bal-
lot is slightly different than those used in other STV systems. Australian
voters for the Senate are given two options. The first option is the same
as with other STV electoral systems: voters select candidates from party
lists, as is illustrated in the bottom half of the ballot in figure 1. However, if
they wish, voters can bypass the ranking of individuals and instead simply
vote for their preferred party, as illustrated in the top half of figure 1. This
fraserinstitute.org6 / The Consequences of Electoral Reform in British Columbia
Figure 1: Australian Senate STV Ballot
Source: Australian Electoral Commission: http://results.aec.gov.au/12246/images/icons/icon_senateballot-
paper.gif.
second option is referred to as “above-the-line voting” or “ticket voting.”
The rationale for this option is to make voting easier. In 1983, the Senate
ballot for the riding of New South Wales had 62 candidates. This led to
numerous mistakes in sequential voting1 on the ballots, which increased
the number of invalid votes. Above-the-line voting was introduced a year
later through reforms in the Commonwealth Electoral Act. Above-the-line
voting has become so popular that more than 95 percent of Australians
use this option (Bennett and Lundie, 2007; Australian Electoral Commis-
sion, 2017; Australian Electoral Commission, 2016a; Sawer, 2005; Raue,
2016, April 18).
The alternative vote (AV), or ranked ballot, is the system that most
Canadian political parties use to elect their leaders. Prime Minister
Trudeau has remarked that this is a system he had favoured for Canada
(Kupfer, 2017). While this system works for internal leadership contests,
the values of the parties in those elections are different than the values
1
In sequential voting, voters follow a sequence of steps to determine which
candidates will be eliminated and which retained for an opportunity to be considered
again in the next round of voting. This voting method enables voters to reduce the
field of candidates until one is selected. This method is used in the presidential
primary system in the United States (Barbera and Gerber, 2017: 211; Ciciora, 2015).
fraserinstitute.orgProportional Representation in Practice: An International Comparison of Ballots and Voting Rules / 7
that Canadians might have for government. For a political party, the goal
of a leadership race is twofold: to select a leader and to emerge from the
contest unified. The AV, or ranked ballot, is designed for the efficiency
of vote counting, but more importantly, to give the appearance that the
leader not only has the most votes, but is supported by the majority of
party members. For Canadian political parties, leadership races held under
AV rules enable party members to rank candidates on a ballot. If their first
choice is eliminated before a winner is selected, their second and subse-
quent choices are counted until a winner emerges. The NDP uses the raw
vote count to select the leader. The Liberal and Conservative parties do
not use a one vote, one person system. To ensure regional appeal, these
parties weigh each riding equally, giving them 100 points. (If a riding has
fewer than 100 members, then that riding has points allocated according
to the actual vote.) In the case of the Liberal leadership race in 2013, Justin
Trudeau was victorious in the first round, which makes it appear that the
system is effective and straightforward. However, this is not always the
case in practice. For example, the 2017 Conservative Party leadership race
went to 13 rounds to give Andrew Scheer the victory on the final ballot
with a mere 50.95 percent of the points. Until the final round, second place
finisher Maxime Bernier was leading in each round. More recently, at the
provincial level in March 2018, the Ontario Progressive Conservative party
went to three ballots to give Doug Ford the victory with 50.62 percent of
the points. Ironically, in this contest, he lost both the popular vote and the
number of constituencies but won on points because of the way in which
the ridings were weighted. Because of this discrepancy, no announcement
of the winner was made at the convention. Convention attendees were sent
home and the winner was announced seven hours after the start of the con-
vention in a hastily convened news conference. While AV systems give the
appearance of simplicity and transparency, the way in which the formulae
are used to declare a winner can vary and be confusing.
Australia, which uses the STV electoral system for its Senate, is not
the only jurisdiction to take a different approach to that voting system.
The Tasmanian system, also referred to as the Hare-Clark system, em-
phasizes candidates over parties. Unlike Malta, the Republic of Ireland,
and Northern Ireland, the Tasmanian system is unique in demanding that
voters rank at least five candidates. The rationale for the selection of at
least five candidates is because the districts elect five representatives. The
Tasmanian system also differs from the Australian Senate system because
it does not allow above-the-line voting. In addition, the ballot in Tasmania
organizes the votes according to political parties, as illustrated in figure 2
(Tasmanian Electoral Commission, 2018; ABC News, 2006, February 2;
Green, 2014, January 17; Revolvy, undated – b; Raue, 2016, April 18; Tas-
fraserinstitute.org8 / The Consequences of Electoral Reform in British Columbia
manian Parliamentary Library, 2015; Proportional Representation Society
of Australia, 2017; Newman, 2006; Inglis, 2018, February 9).
Figure 2: Tasmanian House of Assembly STV Ballot
Source: Bennett and Lundie, 2007.
fraserinstitute.orgProportional Representation
Despite the fact that its Citizens Assembly on Electoral Reform had
recommended an STV system for the province, the current BC govern-
ment has specifically stated that the referendum on electoral reform will
determine whether the province should switch to a form of proportional
representation (PR). The argument in favour of PR is that the legislature
more closely resembles the composition of society as a whole. One notable
concern about this electoral system is that it allows single issue parties to
emerge, such as “left-leaning” green parties, or “right-leaning” anti-im-
migration parties (Mudde, 1999). In addition, PR systems create signifi-
cantly more political parties than do the other electoral systems and as a
result, the legislature is fractured into more segments. In order to limit the
number of parties elected, countries employ electoral formulae to translate
votes into seats.
European countries use electoral formulae widely. There are a num-
ber of inter-country differences with respect to how PR is used. In contrast
to plurality or majoritarian systems, PR systems intend to more closely
align overall votes with seats, giving smaller or minority parties a greater
chance of winning seats. Within the PR electoral family, the main differ-
ences among systems revolve around the use of open versus closed lists for
candidates, the size of electoral districts, the threshold for parties to attain
seats, and the formulae for converting votes to seats (Norris, 2004). Party
thresholds, the formulae used to convert votes into seats, and party lists
will be discussed in more detail below.
In general, in PR electoral systems, voters select party lists in multi-
member districts. A multi-member district is one in which the constitu-
ency, or riding, has more than one representative. To choose candidates,
voters select their preferred choices from a list. In these PR systems, lists
can either be open (in which voters choose both their preferred political
party and their preferred candidates on the list) or closed (in which voters
can only select a party; the party chooses the candidates on the list). In
either the open or closed list system, the order in which candidates appear
on the list determines which candidates get elected. As a simple example,
in a district with 10 seats, if a party receives 40 percent of the vote, the first
fraserinstitute.org10 / The Consequences of Electoral Reform in British Columbia
four candidates on the list will be elected. Of the 20 countries in this study
that use list PR, 12 use open lists and eight use closed lists. On the one
hand, closed lists make the voting process easy and reduce complicated
ballot papers, but on the other, it is party elites rather than voters who de-
cide who will govern. Moreover, in this system, the public’s ability to select
specific candidates that may better reflect their regional interests is lost.
District magnitude is another variable that varies widely between PR
electoral systems. For example, in Israeli elections for the 120 seats in the
Knesset, the entire country is considered to be one district, whereas elec-
tions for the 350 seats in the Spanish Congress of Deputies are contested
among 50 districts. While the introduction of multi-member electoral dis-
tricts is central to PR, their use can result in two potential problems. First,
large multi-member ridings can give rise to large ballot papers, which can
cause confusion among voters. Second, large multi-member ridings can
lead to a diminishing link between voters and elected officials (Miljan and
Jackson, forthcoming; UK Engage, 2013, June 18; Harewood, 2002, August
31; Electoral Knowledge Network, undated – a). Regional representation
plays an important role in the link between voters and elected officials.
In many of the international cases where PR is used, the land masses are
small, so regional differences may not be very important for the electorate.
However, in Canada, and even just in British Columbia, there are signifi-
cant regional differences as a result of population density, proximity to
large urban centres, and even geography itself. Regional representation is
one cornerstone of Canadian democracy that might be sacrificed in a PR
system composed of large multi-member districts.
In combination, these different components of PR systems can
produce quite different outcomes in terms of the overall proportionality
of the system, the number of parties represented in the legislature, and the
number of minor parties that receive seats, among other issues.
Another electoral system that sometimes falls under the PR family is
the semi-proportional Single Transferable Vote (STV) system. As men-
tioned above, this system sees the jurisdiction divided up into multi-mem-
ber districts of about four or five representatives. Parties then put forward
as many candidates as they feel can win seats in the district. Voters then
rank order their preferences for candidates. The total number of votes is
then divided by the number of seats in the district, which produces a quota
that candidates must attain in order to be elected. After the first prefer-
ences are counted, if seats remain unfilled, the candidate with the lowest
number of votes is eliminated and his or her second preferences are then
redistributed. This process continues until all seats are filled.
fraserinstitute.orgProportional Representation in Practice: An International Comparison of Ballots and Voting Rules / 11
Vote thresholds in PR electoral systems
As briefly explained earlier, a key element differentiating PR and plural-
ity or majoritarian electoral systems is the use of formal vote thresholds.
These thresholds typically refer to a certain percentage of votes that a
party must receive in a district to attain a seat in that district. The use of
thresholds in PR systems stems from the presence of multi-member dis-
tricts, which, depending on the size of the district, could make it relatively
easier for parties with only minimal support to attain seats in the legisla-
ture. Indeed, vote thresholds are often intended to prevent extremist par-
ties from having a voice in the legislature (Spiegel Online, 2013, September
19). While the exact threshold varies by jurisdiction, most jurisdictions
that use PR electoral systems employ some formal vote threshold.
There is no generally accepted or consistent policy across countries
regarding thresholds. However, of the countries that use vote thresholds
in our sample of countries from table 1, vote thresholds range from 0.67
percent in the Netherlands to 5.0 percent in several countries including
Belgium, the Czech Republic, Estonia, Iceland, Poland, and Slovakia. It’s
worth noting that some countries such as Greece, Luxembourg, Portugal,
and Switzerland have no formal vote thresholds, which means that a rep-
resentative can be elected with a very small share of the vote total. Some
countries, such as Denmark and Brazil, use relatively more complex vote
threshold requirements than others.
For example, in Denmark, parties do not receive any constituency
seats unless they win a compensatory seat,2 win two percent of the coun-
trywide vote, or gain the equivalency of the Hare quota in two of the three
regions.3 In Brazil, parties must receive at least five percent of the country-
wide vote spread among at least a third of the states. Within those states,
a party must receive at least two percent of the vote. Given the wide range
of vote thresholds employed, should British Columbia shift to PR, it is not
clear what—or even if—a vote threshold would be used.
2 There are 175 seats in the Danish parliament. Of those, 40 are compensatory seats
(tillægsmandat), which are distributed among three electoral regions: Metropolitan
Copenhagen (along with Frederiksberg), the Islands, and Jutland. These three
electoral regions are subdivided into 17 multi-member constituencies, which is
where the remaining 135 seats are from. These seats are called constituency seats
(kredsmandater) (Gallagher and Mitchell, 2005).
3 The Hare quota will be explained below.
fraserinstitute.org12 / The Consequences of Electoral Reform in British Columbia
Seat allocation formulae
PR systems also use a seat allocation formula to ensure that the distribu-
tion of seats closely reflects how the electorate voted. As previously men-
tioned, different countries use various formulae to calculate the vote. The
first such formula is the Droop quota. Created by an English lawyer named
Henry Richmond Droop in 1868, the Droop quota is calculated by dividing
the number of votes by the number of seats plus one. Most STV systems
use the Droop quota to determine the seat allocation (Revolvy, undated
– a). In these jurisdictions, voters do not have to rank all the candidates.
They can choose to rank as few as one candidate or as many as they like
(United Kingdom, Parliament, 2017). This is important because requiring
voters to rank each candidate can lead to an increase in spoiled ballots. For
example, the ballots for the Australian House of Representatives require
that voters rank every candidate from their most preferred to their least
preferred. Failure to do so results in a spoiled ballot. In the 2013 House of
Representatives election, ballots with incomplete rankings made up almost
half (47.5 percent) of the 58.6 percent of the ballots that were assumed
to have been spoiled unintentionally (Australian Electoral Commission,
2016b).4 In the 2015 Canadian general election, only 0.7 percent of ballots
were spoiled (Miljan, 2016).
The Droop quota works by first determining the total number of first
preference votes for all candidates. Once this is completed, any candidate
who receives a number of first preference votes that is greater than or
equal to the predetermined quota is elected. If there are still seats to fill,
then additional counts are required. In these additional counts, the extra
votes (votes that are above the quota) for the candidates who have been
elected in the first count are redistributed according to the voters’ second
preferences. This process continues until all the seats are filled. After any
count, if there are no candidates with enough votes equal to or greater
than the quota, the candidate with the lowest number of votes is elimin-
ated. The votes of that candidate are then redistributed in the next round to
candidates who are ranked higher in preference (Gallagher, 1992; Electoral
Commission New Zealand, 2015; Electoral Knowledge Network, undated –
c; Revolvy, undated – a; Accurate Democracy, 2017; Citizens’ Assembly on
Electoral Reform, 2003).
The second seat allocation formula is called the Hare quota. It is sim-
ilar to the Droop quota, but simply takes the number of votes and divides
them by the number of seats (Accurate Democracy, 2017). Although both
4
In the 2013 Australian election, 5.9 percent of votes were considered to be invalid in
House of Representatives voting (Australian Electoral Commission, 2016b).
fraserinstitute.orgProportional Representation in Practice: An International Comparison of Ballots and Voting Rules / 13
the Droop and Hare quotas are similar, they differ in how they favour par-
ties. Because the Droop quota is smaller than the Hare quota, it tends to
benefit larger parties that receive more votes (Gallagher, 1992, Harewood,
2002, August 31). The Hare quota thus increases the presence of smaller
parties in the legislature because it treats both large and small parties the
same (Lijphart, 1990).
The two remaining seat allocation formulae are the ones most often
used in PR systems. The Sainte-Laguë and d’Hondt formulae are described
as a “highest averages method.” In this method, each party competes for
a seat in sequence, as in an auction. The bid for a seat that a party puts
forward is composed of the original number of votes it has received and
how many seats it has won. Each time a party wins a seat, its bid is reduced
because it is divided by progressively larger numbers, called divisors. To il-
lustrate how this method works, consider an example provided by Michael
Gallagher (1992).
In an election, Party A receives 60,000 votes, Party B receives 28,000
votes, and Party C receives 12,000 votes. In the first round of bidding,
Party A has the best bid of 60,000, so it receives the first seat. After it re-
ceives the first seat, its number of votes is reduced by dividing by a divisor,
which would be 3 because it is the second round of bidding. In the second
round, Party A has a bid of 20,000 seats (60,000 ÷ 3 = 20,000), compared to
Party B which has the best bid of 28,000. This means that Party B receives
the second seat. However, Party B’s number of votes is reduced by dividing
by the divisor, which is again 3. This continues until all the seats are filled
(Gallagher, 1992).
The difference between the Sainte-Laguë and d’Hondt formulae
is the divisors. Divisors are used to reduce a bid (Gallagher, 1992). The
Sainte-Laguë formula uses odd numbers as its divisors and the d’Hondt
formula uses even numbers (Revolvy, undated – c; d; Gallagher, 1991;
1992; Electoral Commission New Zealand, 2017a; Poptcheva, 2016).
Mathematically, the more rapidly the divisors increase, the more rapidly
the bids decrease. This means that when using the Sainte-Laguë formula,
the bids decrease faster, which causes the bids of the larger parties to
decrease to around the level of the smaller parties faster (Gallagher, 1992).
Not only does the Sainte-Laguë formula help smaller parties achieve seats,
but it can also achieve a seat allocation that more proportional to votes
than the d’Hondt formula.5
5
In one study, researchers found that applying the two formulas to the Southwest
electoral region in the 2009 British general election yielded very different results
(McLean and Johnston, 2009). In that election, the Conservative Party received
468,742 votes, the Labour Party 118,716 votes, the Liberal Democrats 266,253
votes, the Greens 144,179 votes, the UK Independence Party 341,845 votes, and the
fraserinstitute.org14 / The Consequences of Electoral Reform in British Columbia
How these formulae would have affected BC’s electoral system can be
seen in the BC–STV model that the Citizens’ Assembly recommended. In
the proposed 2004 BC–STV model, the number of ridings would have been
reduced from 85 to 20. Every riding would have had multiple representa-
tives. Some ridings would have had as few as two representatives elected,
but in ridings with higher population densities, there could have been
as many as seven representatives. Critics of this system were concerned
about a loss of regional representation and accountability of those elected.
Party lists
Party lists are another key component of PR electoral systems that can also
differ within such systems. In a PR electoral system, candidates are chosen
based on their position on a party-created list (Electoral Knowledge Net-
work, undated – a). Depending on the type of party list used, voters can
select either their preferred party (a closed list system), or their preferred
party and their preferred candidates within that party (an open list system).
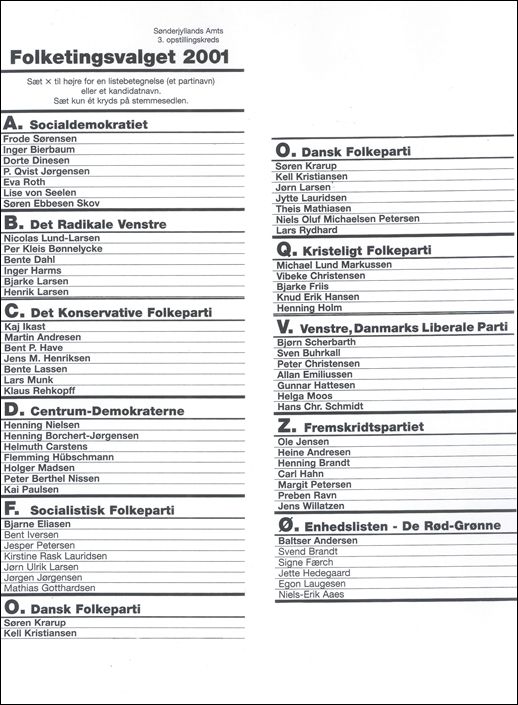
The original system is the closed party list system in which voters
select their preferred political party. This method is used in South Africa,
for example, where voters select either the picture of the leader, or the
party name (see figure 3) (Norris, 1997; FairVote, 2017a; b). The candidates
are then elected based on their position on a list, which is determined by
the party. This means that more power resides with the party elite, which
draws up the list, than with the party membership (Norris, 1997; Gallagher
and Mitchell, 2005). Jurisdictions included in this study that use the closed
party list system include Austria, Iceland, Israel, Netherlands, Portugal,
Slovakia, Spain, and Sweden.
In the open party list system, voters express their preference not just
for the political party of their choice, but also for the candidates within
their preferred political party. Denmark, for example, uses an open party
list system (see figure 4, a picture of a ballot from that country’s 2001
election). Unlike closed party list systems, open party list systems give
voters more say over which candidates get elected because the order of
candidates on an open party list is determined through a combination
British National Party 60,899 votes. When they applied the Sainte-Laguë formula,
the researchers found that all parties except the British National Party won seats.
However, when they applied the d’Hondt formula, only the Conservative Party, the
Liberal Democrats, and the UK Independence Party won seats (McLean and Johnston,
2009). This means that the Sainte-Laguë formula more proportionally represented
how people voted. It also demonstrates that the different formula for calculating the
results can lead to profoundly different outcomes.
fraserinstitute.orgProportional Representation in Practice: An International Comparison of Ballots and Voting Rules / 15
Figure 3: South African Closed List Ballot
fraserinstitute.org16 / The Consequences of Electoral Reform in British Columbia
of electorate choice and party choice (Norris, 1997; Reilly, 2016; King,
2000; FairVote, 2017a; b; Institute for Democracy and Electoral Assistance
[IDEA], 2005.). Other states that use open party list systems in our sample
of countries include Belgium, Czech Republic, Estonia, Finland, Greece,
Italy Luxembourg, Norway, Poland, Slovenia, and Switzerland. It is worth
noting that the choice of an electoral system does not determine which
seat allocation formula a state can use.
Figure 4: Denmark’s Open Party List Ballot Paper
Source: Gallagher and Mitchell (2005): 459.
fraserinstitute.orgProportional Representation in Practice: An International Comparison of Ballots and Voting Rules / 17
Mixed electoral systems
The second referendum question will allow voters to rank three of the fol-
lowing electoral systems:
• Mixed Member Proportional (MMP)
• Dual Member Proportional (DMP), and
• Rural-Urban PR
Of these, MMP is the only one that has been used internationally.
Dual Member Proportional (DMP)
The DMP system proposed by British Columbia Attorney General David
Eby will require the redrawing of electoral boundaries. Urban ridings will
be combined so that there are two representatives for each riding. For
rural ridings, the boundaries might not be changed, and in those ridings
only one legislator would be selected. It is unclear from the recommen-
dations what the total will be for the number of representatives selected,
though Eby recommends an upper limit of 95 representatives. Nonetheless,
the key feature of this system is that each dual-member constituency will
elect two representatives. In this system, political parties are able to nomin-
ate up to two candidates per electoral district. The order of the representa-
tives would be determined by the political party. Voters would select a pair
of candidates in a single vote. The seats are allocated in such a way that the
overall result is proportional to the overall provincial vote. This is done in
a series of steps. For those who win with a majority in their riding, that
number of seats is subtracted from the total seat count. The remaining
seats are those for which no one person (or party) has enough votes to win
an outright majority. Those seats that then allocated according to the prov-
incial popular vote. Eby argues that this system is highly proportional to the
provincial results. However, the design of the system means that rural areas
are disadvantaged twice. First, they will have fewer representatives, and
second, because of their smaller population sizes, their perspective will have
less weight in a proportional system.
Rural-Urban PR
The Rural-Urban PR system recommended by Eby uses two types of voting
system: the STV system in urban and semi-urban areas; and MMP in rural
areas. Some districts would be voting under a List PR system, while others
would go with the existing FPTP.
fraserinstitute.org18 / The Consequences of Electoral Reform in British Columbia
In this system, there would be a varying number of representatives
per constituency, with some having only two representatives, while others
could have up to seven.
How We Vote notes that voters will not know key details of any of
the recommended systems until after the vote. Key details of the electoral
systems, such as whether the province will used closed or open lists, the
order of candidates on a list, the methods for filling single-member dis-
tricts, the ratio of FPTP to the List PR seats, the number and configuration
of regions, and the number of list seats in each region, would have to be
determined by the legislature after the referendum (Eby: 71).
Mixed electoral systems use both PR and majoritarian electoral rules
to translate votes into seats. It is often the case in these types of electoral
systems that a certain proportion of seats in the legislature will be awarded
using plurality electoral rules, while the remaining proportion will be
awarded using PR (see table 2).
Table 2: The Allocation of Seats in the Legislatures of Germany, Bolivia,
New Zealand, and Mexico
Legislature Number of Seats Number of Seats Number of Seats
in Legislature Allocated by Allocated by
Electorate Vote Party Vote
German Bundestag 598 299 299
Bolivian Chamber of 130 77 53
Deputies (of which 7 are
Indigenous or
Campesino seats)
The New Zealand House 120 71 49
of Representatives (of which 7 are
Māori seats)
Mexican Chamber of 500 300 200
Deputies
Source: Compiled by the authors from The Electoral Knowledge Network, undated – b; Instituto Nacion-
al Electoral, 2018; Political Database of the Americas, 2010; Freedom House, 2016; ElectionGuide, 2014,
October 12; 2017; Financial Times, 2017, September 25; The Economist, 2017, October 24; New Zealand
Parliament, 2017a.
fraserinstitute.orgProportional Representation in Practice: An International Comparison of Ballots and Voting Rules / 19
Examples from elsewhere
New Zealand
For an example of these types of elections, consider how New Zealand’s
mixed electoral system allocates seats for the House of Representatives.
New Zealand’s electoral system, known as Mixed-Member Proportional
(MMP), asks electors to cast two votes: one for an individual to represent
Figure 5: MMP New Zealand Ballot Paper
Source: Electoral Commission New Zealand (2017b).
fraserinstitute.org20 / The Consequences of Electoral Reform in British Columbia
their constituency (the electoral vote) and one for a party list (the party
vote). After the single-member seats are allocated, the party list votes are
used to compensate for the disproportionality of the single member plur-
ality (SMP) elections. Thus, as Norris (2004) explains, if a party receives
10 percent of the list vote but does not receive any of the single-member
seats, that party is awarded list seats until their number of seats is equiva-
lent to 10 percent of the legislature. In New Zealand, 70 seats are filled
through SMP elections, while the remaining 50 seats are filled through
multi-member PR. In some cases, the number of seats in the New Zea-
land House of Representatives can be increased because of “overhang”
seats (Green, 2017; Electoral Commission of New Zealand, 2018; n.d.a; b).
Overhang seats occur when a party receives more seats through the elec-
torate vote than they would otherwise be allocated through the party vote.
More specifically, an MP gains an overhang seat when he or she get more
votes in their riding than their party gets at the national level. For example,
if a party is entitled to six seats based on the party vote, but wins seven
constituencies, then the seventh seat is called an overhang seat (Electoral
Commission New Zealand, undated – a). Figure 5 provides an example of
New Zealand’s ballot.
Germany
In the German Bundestag, there are 709 seats, of which 598 are statutory
or fixed. Overhang and balance seats increase the number of seats in the
legislature from 598 to 709. Of the statutory seats, half (299) are allocated
based on the electorate vote. The remaining seats go to MPs that win by
the party vote. Similar to New Zealand, in some cases overhang seats can
be added to the Bundestag. However, unlike in New Zealand, “balance
seats” can also be added to the Bundestag (Deutscher Bundestag, 2013;
Institute for Democracy and Electoral Assistance [IDEA], 2005). The issue
with “overhang” seats became apparent with Angela Merkel’s Christian
Democratic Party in 2009. That year, the Christian Democratic Party won
so many electorate votes that there were not enough party votes to create
a legislature that was an accurate representation of the way people voted.
This created 24 “overhang” seats in the Bundestag. These “overhang” seats
resulted in a disproportional legislature that favoured the Christian Demo-
cratic Party. In 2012, the Bundesverfassungsgericht, the Federal Constitu-
tional Court in Germany, declared that overhang seats are unconstitution-
al because of the potential for a party with more second votes (party votes)
to gain fewer seats than another party with fewer second votes, and vice
versa. The court also stated that it is unconstitutional to have an unlimited
number of overhang seats because it infringes on the equal opportunity
fraserinstitute.orgProportional Representation in Practice: An International Comparison of Ballots and Voting Rules / 21
for political parties to gain seats in the legislature and equality of votes. To
correct this, in 2013 the court amended the Federal Electoral Act to create
“balance” seats. These “balance” seats simply compensate for any dispro-
portionality that may arise from overhang seats. In the last general elec-
tion in 2017, 111 seats were added to the Bundestag. Of those 111, 46 were
overhang seats and 65 were balance seats (Kirschbaum, 2009, September
23; Germany, Federal Returning Officer, 2017; Franklin, 2013, May 3; Dick,
2013, August 19; European Parliamentary Research Service Blog, 2013;
Spiegel Online, 2013, September 19; Staudenmaier, 2017, September 24;
Inter-Parliamentary Union, 2018, March 16; The Economist, 2017).
Mexico
In Mexico, the Chamber of Deputies has 500 seats. Of those, 300 are
awarded to MPs who win by the electorate vote. The remaining 200 seats
are awarded to MPs who win by the party vote (table 2). One feature of
Mexico’s Chamber of Deputies that sets it apart from legislatures in other
MMP systems is that it has a fixed number of seats, which prevents over-
hang seats being allocated (Barnes, Lithwick, and Virgint, 2016; Tribunal
Electoral de Poder Judicial de la Federación, 2014; Instituto Nacional
Electoral, 2018; Institute for Democracy and Electoral Assistance [IDEA],
2005; ElectionGuide, 2015, June 7). Some argue that “overhang” seats
enable the seats in the legislature to be distributed proportionally. Con-
sequently, having a fixed number of seats may result in a legislature that is
not as proportional as legislatures that do have these seats (Scoop, 2008,
October 22; Thomas, 2011).
Mexico uses the Hare quota to allocate seats based on the party
vote (ElectionGuide, 2015, June 7; Tribunal Electoral de Poder Judicial
de la Federación, 2014; Institute for Democracy and Electoral Assist-
ance [IDEA], 2005; Revolvy, undated – b). For a party to be considered in
Mexico, it must meet the threshold of at least three percent of the coun-
trywide vote (Tribunal Electoral de Poder Judicial de la Federación, 2014).
As a consequence, the use of the Hare quota means that in Mexico there is
greater proportionality (compared to countries that use the Droop quota)
and smaller parties have a better chance of gaining seats in the legislature
because both large and small parties are treated the same (Lijphart, 1990).
fraserinstitute.orgConclusion
In this paper’s review of the various types of PR systems and their uses
around the world, it has become clear that there are many nuances among
the different PR systems that affect the outcome of elections and the party
system that results. Campaign slogans that argue for proportionality may
aim for high ideals of democracy, but the slogans understate the complex-
ity of crafting a new electoral system. If the forthcoming referendum on
electoral reform in British Columbia supports a move to PR, much public
input and debate will be needed to determine what kind of proportional
system would benefit the province. As such, reform of the electoral system
will need to include an assessment of the voting formula because some
calculations favour large parties, while others favour smaller parties. In
addition, those who design the system will have to take into consideration
whether voters will be focusing on the parties or the representatives. Before
BC voters can indicate with any certainty that they favour PR, they first need
to know what specific type of PR will be implemented, including the type of
formula used, and they need to know if any redistricting will occur.
Like most electoral systems, the PR electoral systems discussed in
this paper have advantages and disadvantages. Regimes that use the single
transferrable vote as their voting system value the public being able to
choose between parties and between candidates in those parties. In this
system, it can be easier for independent candidates to get elected. STV
has been shown to help promote women and minority group candidates.
One disadvantage of this system is that the process of counting the votes
takes longer than in other systems, which means that the results are not
likely to be declared on the night of the election as they can be with FPTP.
Further, STV systems are prone to “donkey voting.” In other words, voters
will simply rank candidates in the order they appear on the ballot, which
does not make for informed voting decisions. They do this because in large
constituencies the ballot papers can become very long, which can lead
to confusion among the electorate and can also discourage voting (UK
Engage, 2013b).
Proponents of PR argue that this system increases the likelihood that
both women and minority groups are elected because parties benefit from
providing balanced lists that appeal to a wide range of voters. However, PR
fraserinstitute.orgProportional Representation in Practice: An International Comparison of Ballots and Voting Rules / 23
also tends to weaken the link between the MP and the constituents. This
is especially the case with closed party list systems. The electorate may
feel that they have no opportunity to determine which specific MP is go-
ing to represent them, and thus the accountability of the elected official is
reduced (Institute for Democracy and Electoral Assistance [IDEA], 2005;
UK Engage, 2013a).
Mixed member proportional is praised because voters believe that it
is a system in which fewer votes are wasted. Because smaller parties have
a better chance of being elected, the public can express its distaste for the
incumbent government by choosing fringe parties. (In turn, in MMP, some
smaller parties are allowed to be represented in the legislature.) MMP also
allows the public to vote for both an individual candidate and the party of
their choice. As a result, this system often reduces the dominance of one
or two larger parties in the legislature. Unlike the closed party list system,
MMP retains the link between the electorate and the MP. However, in
cases where smaller parties have a better chance of electoral victory, some
of those parties can be extremist—either on the left or on the right.
These systems often result in minority governments, which means
that sometimes the smaller parties have a disproportionate impact on how
the resulting government is constructed. Because minority or coalition
governments are so frequent in PR electoral systems, government itself
can often be unstable. Similar to STV, PR systems can sometimes cre-
ate lead to long, complicated ballots, which can discourage the electorate
(Thomas, 2016).
To replace British Columbia’s electoral system will require trade-offs
and a clear understanding of the impact that such changes will have on the
way in which the votes are tallied, and what impact that might have on the
legislature, the party system, and the province’s political culture. The inter-
action of all the factors involved in changing the electoral system makes it
exceedingly difficult to anticipate the likely consequences of such a change.
Nonetheless, a subsequent essay in this series, The Impact of Proportional
Representation on British Columbia’s Legislature and Voters, will examine
what effects a shift to PR would have for British Columbia.
fraserinstitute.orgReferences
ABC News (2006, February 2). Tasmania Election 2006: Hare-Clark Ex-
plained. ABC News Online. , as of June 6, 2018.
Accurate Democracy (2017). Seats and Quotas. Accurate Democracy.
, as of June 6, 2018.
Australian Electoral Commission [AEC] (2016a). Above the Line and below
the Line Voting. Senate Ballot Paper Study 2016. Australian Electoral Com-
mission. , as of June 6, 2018.
Australian Electoral Commission [AEC] (2016b). Informal Voting: 2016
House of Representatives Election. Australian Electoral Commission.
, as of June 6, 2018.
Australian Electoral Commission (2017). Voting in the Senate. Australian
Electoral Commission. 2017. , as of June 6, 2018.
Australian Electoral Commission (2018). Informality (%) House of Repre-
sentatives and Senate. Web table. Government of Australia. , as of April 27, 2018.
Barberà, Salvador and Anke Gerber (2017). Sequential Voting and Agenda
Manipulation. Theoretical Economics 12, 1: 211–247.
Barnes, Andre, Dara Lithwick, and Erin Virgint (2016). Electoral Systems
and Electoral Reform in Canada and Elsewhere: An Overview. Back-
ground paper. Library of Parliament. , as of June 6, 2018.
fraserinstitute.orgProportional Representation in Practice: An International Comparison of Ballots and Voting Rules / 25
Bennett, Scott and Rob Lundie (2007). Australian Electoral Systems. Re-
search paper number 5 2007-08. Parliament of Australia. , as of June 6, 2018.
Bormann, Nils-Christian, and Matt Golder (2013). Democratic Electoral
Systems around the World, 1946–2011. Electoral Studies 32, 2 (June):
360–369. doi: http://dx.doi.org/10.1016/j.electstud.2013.01.005.
British Columbia (2018). Electoral Reform Referendum 2018 Act,
S.B.C 2017, c. 22, s. 12. , as of June 25, 2018.
Ciciora, Phil (2015, August 4). Study: Sequential Voting in Presidential Pri-
maries Best System to Winnow Candidates. Illinois News Bureau. , as of June 14, 2018.
Deutscher Bundestag (2013). Parliament: Election of Members and the
Allocation of Seats. Deutscher Bundestag. , as of June 6, 2018.
Dick, Wolfgang (2013, August 19). How Do Germans Elect Their Parlia-
ment? Deutsche Welle [DW]. , as of June 6, 2018.
Eby, David (2018). How We Vote: 2018 Electoral Reform Referendum Report
and Recommendations of the Attorney General. Government of British Co-
lumbia. , as of June 18, 2018.
Economist (2017, October 24). Why Germany’s Parliament Has More Mem-
bers than Ever Before. The Economist. , as of June 6, 2018.
ElectionGuide (2015, June 7). United Mexican States: Election for Mexi-
can Chamber of Deputies. International Foundation for Electoral Systems.
, as of June 6, 2018.
Election Watch Australia (2013, September 19). Informal Voting Is on the
Rise. University of Melbourne. , as of June 6, 2018.
fraserinstitute.org26 / The Consequences of Electoral Reform in British Columbia
Electoral Commission New Zealand (undated – a). Overhang. MMP Review.
Electoral Commission New Zealand. , as of June 6, 2018.
Electoral Commission New Zealand (undated – b). Overhangs. MMP Re-
view. Electoral Commission New Zealand. ,
as of June 16, 2018.
Electoral Commission New Zealand (2015). STV – Single Transferable
Vote. Electoral Commission New Zealand. , as of June 6, 2018.
Electoral Commission New Zealand (2017a). Sainte-Laguë Allocation
Formula. Electoral Commission New Zealand. ,
as of June 6, 2018.
Electoral Commission New Zealand (2017b). Using your Voting Paper.
Electoral Commission New Zealand. , as of June 13, 2018.
Electoral Commission New Zealand (2018). MMP Voting System: How Are
MMPs Elected? Electoral Commission New Zealand. ,
as of June 6, 2018.
Electoral Knowledge Network (undated – a). Boundary Delimitation. The
Electoral Knowledge Network. , as of June 6, 2018.
Electoral Knowledge Network (undated – b). Mixed Member Proportion-
al. Electoral Systems. The Electoral Knowledge Network. , as of June 6, 2018.
Electoral Knowledge Network (undated – c). The Single Transfer-
able Vote (STV). Electoral Systems. The Electoral Knowledge Network.
, as of
June 6, 2018.
European Parliamentary Research Service Blog (2013, September 18). The
German Electoral System. European Parliament.You can also read