Can Indonesia's policy of reconfiguring its energy mix by increasing natural gas usage support its initiatives to reform energy subsidies?
←
→
Page content transcription
If your browser does not render page correctly, please read the page content below
November 2014

       Can Indonesia’s policy of reconfiguring
         its energy mix by increasing natural
           gas usage support its initiatives to
                   reform energy subsidies?

OIES PAPER: NG 93                           Siew Hua Seah,
                                   OIES-Saudi Aramco Fellow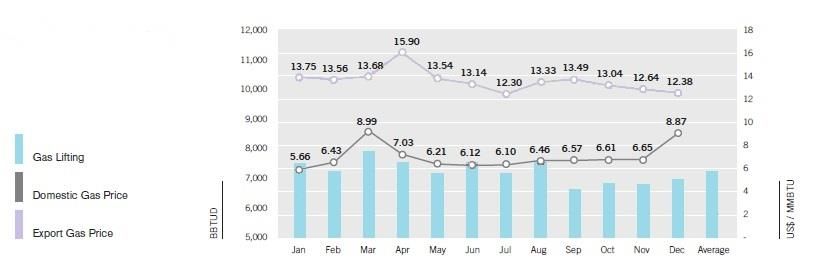
The contents of this paper are the authors’ sole responsibility. They do not
         necessarily represent the views of the Oxford Institute for Energy Studies or any of
                                            its members.

                                          Copyright © 2014
                               Oxford Institute for Energy Studies
                                  (Registered Charity, No. 286084)

This publication may be reproduced in part for educational or non-profit purposes without special
permission from the copyright holder, provided acknowledgment of the source is made. No use of this
publication may be made for resale or for any other commercial purpose whatsoever without prior
permission in writing from the Oxford Institute for Energy Studies.

                                      ISBN 978-1-78467-016-0

                                                                                                      i
Acknowledgements

I would like to thank Professor Bassam Fattouh for his invaluable guidance,as well as Professor Anne
Booth and Dr Eliza Van Waeyenberge for their advice in the early stages of research.
The completion of this paper would also not be possible without Tim, for his support and
encouragement.

                                                                                                   ii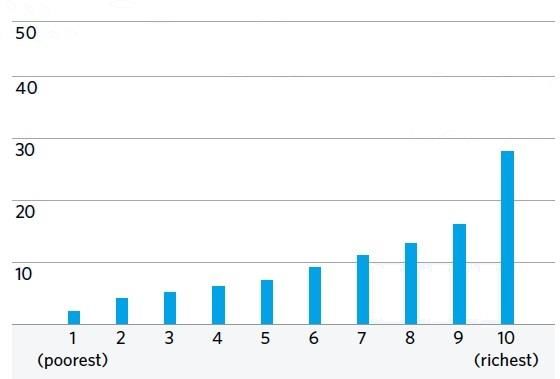
Abstract
Against a backdrop of rapidly growing oil and gas production and exports, the Indonesian government
introduced fuel subsidies in the late 1950s to stimulate economic development. However, since the
country ceased to be a net exporter of oil in 2004, increasing demand for oil products and political
pressure to maintain subsidies has meant that government expenditure on subsidies has steadily
escalated. Despite the various energy policy reforms implemented since 1998 to cut fuel subsidies
and adapt to the evolution of the country’s energy landscape, it is now clear that oil subsidies are no
longer the stabilizers that once helped a young nation find its balance. Indonesia’s dependence on
subsidies is, instead, now weighing down a country pedalling hard towards the goal of economic
success. This paper argues that increasing the production and consumption of natural gas will provide
the much-needed momentum to cut Indonesia’s reliance on oil and empower the incoming Widodo
administration to tackle the challenges of reconfiguring its energy mix and establishing sustainable
energy policies.

                                                                                                     iii
Contents
Acknowledgements .............................................................................................................................. ii
Abstract ................................................................................................................................................. iii
Contents ................................................................................................................................................ iv
I. Introduction ........................................................................................................................................ 1
II. Past success and failure in energy reforms................................................................................... 3
2.1 The 1998 fuel price hike following the Asian Financial Crisis (AFC) ............................................ 4
2.2 The Kerosene-to-LPG conversion programme of 2007 ................................................................ 5
2.3 Extended use of gas-based transport fuels .................................................................................. 5
2.4 Effects of hikes in the international crude price ............................................................................ 5
2.5 The 2013 increase in electricity prices for high-volume users ...................................................... 5
2.6 Past energy reforms ...................................................................................................................... 6
III. How higher natural gas usage supports energy subsidy reform ............................................... 8
3.1 Why natural gas? .......................................................................................................................... 8
3.2 Challenges of driving natural gas ................................................................................................ 10
A. Improving energy infrastructure ................................................................................................. 10
B. Sustaining production ................................................................................................................ 10
C. Balancing natural gas demand and exports .............................................................................. 11
D. King coal .................................................................................................................................... 11
3.3 Indonesia’s natural gas future ..................................................................................................... 11
IV. Natural gas reforms in Malaysia and Thailand ........................................................................... 14
4.1 South-east Asia’s three largest energy consumers .................................................................... 15
4.2 Malaysia ...................................................................................................................................... 15
4.3 Thailand ...................................................................................................................................... 17
4.4 Reflecting on Indonesia............................................................................................................... 18
V. Conclusion ...................................................................................................................................... 20
Glossary ............................................................................................................................................... 22
Reference List ..................................................................................................................................... 24
Bibliography ........................................................................................................................................ 27
Figures and Tables
Figure 1: Distribution of subsidies by household income in 2010 (by deciles) ....................................... 1
Figure 2: Indonesia’s domestic gas utilization by sector (tcf) ................................................................. 3
Figure 3: Evolution of Indonesia’s energy mix ........................................................................................ 4
Figure 4: Indonesia gas lifting and prices (2012) .................................................................................. 13
Figure 5: ASEAN GDP per capita US$ (2000–12) ............................................................................... 14
Table 1: Central government expenditure and subsidies (trillion IDR) ................................................... 4
Table 2: Summary of Indonesia’s major energy reforms ........................................................................ 7
Table 3: Primary energy demand in Indonesia by fuel (mtoe) ................................................................ 9
Table 4: Indonesia Gas Balance Projection for 2020 (mmcm/d) .......................................................... 11
Table 5: Access to modern energy services in ASEAN 2011 ............................................................... 14
Table 6: Primary energy demand in Malaysia by fuel (mtoe) ............................................................... 16
Table 7: Gas production by country (bcm) ............................................................................................ 17
Table 8: Fossil fuel net trade by country ............................................................................................... 17
Table 9: Primary energy demand in Thailand by fuel (mtoe) ................................................................ 18
ivI. Introduction
Shortly after the nationalization of Dutch enterprises in 1957, the young nation of Indonesia under the
Sukarno regime began subsidizing oil products used in the transportation, industrial, and power
generation sectors in a bid to stimulate the economy and protect citizens from inflation (Beaton and
Lontoh, 2010). But since Indonesia ceased to be a net exporter of oil in 2004, due to declining
production, government expenditure on subsidizing oil products produced from imported crude oil has
risen dramatically (MOF, 2014). Energy subsidies are expected to represent 18.66 per cent of
Indonesia’s total planned expenditure of 1,876.87 trillion IDR (US$160.47 billion) in 2014, based on
the revised budget approved by parliament in June 2014 (Table 1 and MOF, 2014). Such a large sum
could otherwise be deployed towards development goals such as: education, health care, and
improvements in agricultural productivity. And while it can be argued that fuel subsidies do contribute,
indirectly, to citizen welfare, Indonesia’s energy subsidies are distributed on the basis of usage levels
and therefore tend to benefit higher-income users who have greater usage and access to electricity
(Agustina et al. 2012, Figure 1).1
Figure 1: Distribution of subsidies by household income in 2010 (by deciles)
Percentage of subsidies received (%)
Source: Agustina et al., 2012 and BPS, 2011
In the past, against a backdrop of healthy domestic oil reserves, the subsidization of oil products for
citizens provided stabilizers for a newly independent Indonesia which was trying to find its balance.
But now – almost 60 years after independence and with the decline of oil production together with
escalating government expenditure on subsidies for imported oil products – it is time for the country to
give up the false security that such subsidies offer and confidently pedal forward unaided towards
sustainable economic growth, through energy policy reform. Indonesian policy makers are rightly now
proposing to reconfigure the nation’s energy policy, in order to cut expenditure on energy subsidies.
The government plans to reduce reliance on oil in its energy mix by shifting to more cost-efficient
fuels, such as natural gas and coal (SKK Migas 2013). But this is not without its challenges.
1
‘Step by step they (subsidies) must be cut’, said Widodo, only the second democratically elected president since the fall of the
Suharto regime, when discussing plans for the future of the country’s fuel subsidies in May 2014 (Moestafa and Maurung,
2014). ‘Those who now receive fuel subsidies are the people who have’, he said in the pre-election interview (2014).
1The election of Widodo, a self-made furniture entrepreneur with no former links to the political elite or
military background, is looked upon with mixed expectations. Cynical observers are hesitant to herald
a new era of administrative reforms under a new leader who has limited support in parliament, while
more optimistic supporters are hopeful that Widodo may bring positive changes to the nation’s costly
fuel subsidy programme, in order to benefit low-income Indonesians (Financial Times, 2014).
Moreover, it is encouraging that in the run up to taking office in October 2014, Widodo has remained
firm in his commitment to the implementation of gradual reforms to the country’s costly fuel subsidy
system (Bland, 2014).
This paper will establish that by changing its energy mix, Indonesia has a strong chance of being able
to reform its energy pricing policy in order to ensure the cost efficient and sustainable usage of its
natural gas resources. A stagnant oil-centric energy mix has hampered the fuel price subsidy reforms
attempted by previous regimes. But now, with plans to adapt its energy mix to international fuel prices
and its domestic production capabilities, Indonesia’s shift away from dependency on oil to an
alternative fuel such as natural gas offers the new administration a fresh opportunity to initiate positive
change. In this analysis, reference to ‘energy subsidies’ will extend to subsidies on fuel prices in the
domestic market and electricity tariffs.
This paper is divided into four parts. Section 2 discusses the key reforms to Indonesia’s energy
subsidy system which have been attempted since 1998. These include: the 1998 fuel price hike
following the Asian Financial Crisis (AFC) that precipitated the fall of the Suharto government, the
Kerosene-to-LPG conversion programme of 2007, and the 2013 increase in electricity prices for high-
volume home, business, and industrial users.
Section 3 shows how natural gas could support the reconfiguration of the country’s energy mix to cut
dependency on oil. There are a number of factors that place Indonesia in an ideal position for initiating
energy policy reform: the potential to divert expenditure on oil subsidies to investment in new energy
infrastructure, the smaller number of existing subsidies for natural gas usage compared to those for
oil products, the potential for higher domestic gas production, and recent government initiatives to
increase natural gas usage. The government will, however, face challenges in this task such as:
inadequate natural gas infrastructure, the high costs of sustaining and increasing natural gas
production, difficulties associated with balancing domestic natural gas demand with exports, and the
competition posed by coal as an alternative fuel. While these challenges are not insurmountable, the
government will have to stay the course to ensure sustainable reforms are implemented.
The comparative analysis in Section 4 of Thailand and Malaysia – two of Indonesia’s neighbours
similarly in the midst of reconfiguring their energy mix to meet growing domestic demand – illustrates
the fact that Indonesia is in a relatively advantageous position. Increasing the usage of natural gas in
Indonesia is likely to place less of a burden on government expenditure than in Malaysia, as
Indonesians enjoy comparatively small subsidies on natural gas. And compared to Thailand, which
holds limited indigenous natural gas supplies, Indonesia’s potential for higher production from new
discoveries and unconventional gas sources is a major advantage.
Section 5 concludes by summarizing the main arguments and acknowledging that if the incoming
Widodo administration is willing to take advantage of Indonesia’s potential for transformation boldly, it
will be able to make a positive and long-lasting change to its energy policies.
2II. Past success and failure in energy reforms
Indonesia was the world’s largest LNG producer between 1977 and 2005. However, with declining
natural gas production and new producers entering the international market Indonesia, with LNG
exports of just 22.4 bcm in 2013, now ranks behind Qatar, Malaysia, and Australia (exports of 105.6
bcm, 33.8 bcm, and 30.2 bcm respectively) (BP, 2014).
Despite having produced and exported pipeline gas and LNG for what is now close to four decades,
Indonesia’s plans to increase domestic natural gas usage have only emerged in recent years, with the
passing of the 2001 oil and gas law no. 22 (Nugroho, 2005). Domestic natural gas supplies currently
fuel the country’s power generation and industrial sectors, and are used as feedstock for
petrochemical and fertilizer production, particularly in the western provinces (Figure 2, SKK Migas
2013, and IGA 2013).
Figure 2: Indonesia’s domestic gas utilization by sector (tcf)
tcf
Source: SKK Migas 2013 and IGA 2013
Energy demand centres on Indonesia’s most populous island of Java; this is expected to continue,
with West Java expected to have the largest gas supply deficit of 30.87 mmcm/d by 2020 (MEMR,
2013). Natural gas reserves are connected to users by relatively sparse gas pipelines and
transmission networks, as limited natural gas usage in the past meant that insufficient downstream
infrastructure was built (Nugroho, 2005 and IEA, 2014). While the building of infrastructure offers
long-term benefits, it is a costly and lengthy process that near-sighted government agencies, plagued
by corruption, have in the past failed to invest in adequately (Beaton & Lontoh, 2010).
Spending on electricity increased from US$900 million in 2005 to US$3.4 billion in 2006 due to rising
international crude prices and the high level of diesel consumption for power generation in Indonesia
(IISD, 2012). Since then subsidies have been rising steadily, reaching 350.3 trillion IDR (US$29.8
billion) in the latest revised budget for 2014 (MOF, 2014 and Table 1). Going forward, the Indonesian
government hopes to reduce its budget deficit by cutting expenditure on oil subsidies through a
reconfiguration of its energy mix that will cut the oil component from 49.7 per cent to 23.7 per cent
(SKK Migas, 2013). While the natural gas component is expected to shrink from 20.1 per cent in 2010
to 19.7 per cent in 2025, overall natural gas usage will increase by 134 per cent from 599.8 MMBOE/d
in 2010 to reach 1405.4 MMBOE/d (Figure 3).
3Figure 3: Evolution of Indonesia’s energy mix
2010 Energy Mix 2025 Energy Mix
(2,984 MMBOE/d) (7,134 MMBOE/d)
Coal
Gas
Oil
New and
renewable
Source: SKK Migas, 2013
Table 1: Central government expenditure and subsidies (trillion IDR)
2006 2007 2008 2009 2010 2011 2012 2013 2014
Audited Audited Audited Audited Audited Audited Audited Revised Revised
Total
440 505 693 629 884 1,070 1,491 1,726 1,877
expenditure
All
107 150 275 138 193 295 346 348 403
subsidies
Energy
95 117 223 95 140 256 306.5 299.8 350.3
subsidies
Fuel
64 84 139 45 82 165 212 200 246
subsidies
Source: MOF, 2014
2.1 The 1998 fuel price hike following the Asian Financial Crisis (AFC)
The most notable fuel price hike in Indonesia’s recent history occurred in 1998 in the wake of the
Asian financial crisis. In the aftermath of the crisis and on the road to recovery, the Suharto
government turned to the IMF for financial support. But the IMF’s promise of a $43 billion rescue
package came with a set of requirements, one of which was the cutting of fuel subsidies to reduce
government expenditure and improve the country’s fiscal deficit (IEA, 2014). Jakarta implemented
these cuts in May 1998 in order to qualify for another $3 billion tranche of funding; gasoline prices
consequently rose 70 per cent to 1,200 IDR/l, transport diesel rose 58 per cent to 600IDR/l, and
industrial gasoil rose 39 per cent to 500 IDR/l (Argus, 1998). The riots that followed in response to the
hikes contributed to the downfall of the long-standing Suharto regime.
Further fuel price hikes were implemented in October 2000 in a bid to qualify for another tranche of
funding. This time, fuel prices increased by an average of 15 per cent – lower than the IMF’s
recommendation of 30 per cent. Earlier in the year, the government had planned for increases of up
to 20 per cent, but in the end it backtracked to an average figure of 15 per cent and offered cash
handouts to the poor (Argus, 2000).
4In 2005, the government introduced the Unconditional Cash Transfer (UCT) programme to provide
assistance to poor households when further subsidy cuts raised household fuel prices by over 125 per
cent and gasoline, kerosene, and diesel fuel prices by 105 per cent (World Bank, 2012). These cash
handouts, which were split into four instalments over a year, targeted households that enjoyed the
fewest benefits under the former subsidy system. Over 19 million households (more than a third of
households in Indonesia) received these cash transfers in 2005 (Beaton and Lontoh, 2010). This was
the first time the government had turned to using cash handouts to assuage social grievances.
2.2 The Kerosene-to-LPG conversion programme of 2007
In 2007, the kerosene-to-LPG conversion programme encouraged the replacement of kerosene with
LPG (which has the advantage of being both cleaner burning and cheaper) with hopes of reducing the
burden of kerosene subsidy on the government. Under this scheme, the government supplied citizens
with a start-up package of an LPG tank, stove, and accessories. LPG usage eventually overtook that
of kerosene in 2010, bringing about savings of US$5.2 billion between 2007 and 2011, according to
government estimates (Beaton and Lontoh, 2010).
2.3 Extended use of gas-based transport fuels
In 2007, the government initiated plans to widen the usage of gas-based transport fuels such as
compressed natural gas (CNG) and liquid gas for vehicles (LGV) in the more populous Java–Bali
region. Accumulated savings from these conversions reached IDR45.3 trillion (US$5.7 billion)
between 2007 and April 2011 (IISD, 2012).
2.4 Effects of hikes in the international crude price
In response to hikes in the international crude price, the government cut fuel subsidies in May 2008;
this resulted in a price hike of 22 per cent, 27 per cent, and 25 per cent for gasoline, kerosene, and
diesel respectively. Despite the hikes being met with protests across the country from Indonesians
already suffering from international food price hikes, it was necessary for the government to curb fuel
subsidies as these were threatening to reach US$14 billion that year. The government, however,
distributed monthly cash handouts of 10,000IDR to low-income families to help soften the blow of
these hikes (Quiano, 2008).
In March 2012, in the first attempted fuel price increase in nearly four years, the Yudhoyono
government announced plans to cut subsidies on 1 April, in response to international crude price
hikes. But the planned increase in fuel prices (33 per cent for diesel and gasoline) was eventually
scrapped due to public protests and parliamentary opposition (Bellman, 2012).
The government eventually raised gasoline prices by 44 per cent and diesel prices by 22 per cent, in
June 2013. While protests initially erupted across the country, the government pressed on with the
reforms, arguing that the increases were necessary to strengthen the rupiah and improve the trade
balance by cutting oil imports and expenditure on subsidies. Low-income households also received
cash handouts as a result of these hikes, which helped to soften the blow (Ho, 2013).
2.5 The 2013 increase in electricity prices for high-volume users
In addition to fuel-based subsidies, the electricity tariff system also subsidizes energy usage in the
country. The electricity tariff system is set annually with different tariffs for industry, business, public
services, and residential users. These subsidies represent the difference between the average cost of
electricity for state-owned utility Perusahaan Listrik Negara (PLN) – consisting of fuel inputs, power
plants, transmission, distribution, supply costs, and margin for the utility – and the average electricity
tariff set by the government (IISD, 2012). In 2013, the Indonesian government successfully cut back
electricity subsidies. Four groups were shortlisted for the removal of electricity subsidies: households
with more than 6,600Va usage, businesses with 6,600–200,000Va usage, businesses with more than
200,000Va usage, and government buildings with 6,600–200,000Va. Poorer households with 450–
900Va of usage were unaffected. The government phased in quarterly increases in tariffs of 4.3 per
5cent up to October 2013 – reaching a total of 15 per cent in 2013 – when the subsidies were
completely removed (Cahyafitri, 2014).
Plans were also made in 2013 for an increase in electricity tariffs for industrial users starting 1 May
2014, whereby tariffs would be increased by 38.9 per cent or 64.7 per cent depending on the scale of
power consumption. This increase will be implemented gradually, with rises every two months until
December 2014 (Global Business Guide, 2014).
2.6 Past energy reforms
Indonesia has seen both success and failure in implementing these reforms, a summary of which is
set out in Table 2 below. The first major price reform dealt a large blow to the Suharto regime, in part
due to the circumstances of the Asian financial crisis where citizens already facing economic turmoil
were unwilling to accept further price increases. But in recent years, the government has managed to
successfully implement reforms such as the kerosene-to-LPG programme and electricity tariff
increments for businesses, industries, and wealthier users.
A common characteristic of successful energy reforms has been the implementation of targeted cash
handouts, or UCTs, for the poor. The use of such payments stems from the growing recognition
among policy makers of the fact that energy subsidies have not been particularly beneficial to
Indonesia’s poor. Starting with cash handouts to support households through subsidy cuts in 2005,
through to the most recent 2013 electricity tariff reforms, the country’s energy reforms are now slowly
but surely starting to target those who Widodo views as the country’s ‘have-nots’.
The reforms of Indonesia’s system of energy subsidies have undoubtedly been accompanied by
political risk, but the country’s unnecessary and unsustainable reliance on subsidies to fund its
consumption of imported oil has only served to slow its development growth. During his election
campaign Widodo pledged to gradually cut fuel subsidies, replace 90 per cent of diesel-fired power
plants (with coal-fired, gas-fired, and geothermal generating plant) within three years, and reform or
replace the corruption-plagued SKK Migas (Argus, 2014f).
6Table 2: Summary of Indonesia’s major energy reforms
1998 First major fuel price hike, to meet IMF requirements for receiving
funding following AFC. Resulted in violent riots and the fall of the Suharto
regime.
2000 More fuel price hikes were implemented to qualify for another tranche of
IMF funding.
2005 Unconditional Cash Transfer (Bantuan Langsung Tunai) programme
introduced to provide support to low-income households.
2007 Kerosene-to-LPG conversion programme to encourage the replacement
of kerosene with LPG (both cleaner burning and cheaper).
2007 Government starts widening the usage of gas-based transport fuels such
as CNG and LGV in the more populous Java–Bali region.
2008 Government cut subsidies; this resulted in fuel price hikes averaging
nearly 30%. Low-income families received monthly cash handouts.
2012 Plans to increase prices of subsidized products by 33% on 1 April 2012
were scrapped due to public protests and parliamentary opposition.
2013 Plans implemented to remove electricity subsidies for households with
more than 6,600Va usage, businesses with 6,600–200,000Va usage,
businesses with more than 200,000Va usage, and government buildings
with 6,600–200,000Va.
2014 Starting 1 May 2014, tariffs for industrial users increased by 38.9% or
64.7% depending on the scale of power consumption.
7III. How higher natural gas usage supports energy subsidy reform
Indonesia’s plans to increase natural gas usage and reconfigure its energy mix in the next two
decades offer a long-awaited opportunity to reform its failing energy subsidy system. This section will
discuss how widening the usage of natural gas can reduce dependence on oil, hence allowing the
government to cut expenditure on subsidizing costly oil imports. The rising costs of Indonesia’s oil
imports, its increasing expenditure on subsidies for the usage of oil products, the country’s rising fuel
demand, a growing need for cleaner-burning fuels, and the existence of over 3 tcm of proven gas
reserves – all point to the importance of driving natural gas usage as a key part of the solution to
Indonesia’s fast growing energy deficit (IEA, 2014).
3.1 Why natural gas?
Indonesian politicians who support energy subsidies argue that subsidies contribute to economic
growth through poverty reduction and increased security of supply. However, highly subsidized fuel
prices also interfere with market mechanisms and divert government resources from investing in
energy infrastructure – such as natural gas distribution networks and gas-fired power plants – that
support natural gas usage and drive long-term growth and competitiveness (Agustina et al., 2012 and
Braithwaite et al., 2012). The current system of subsidies, which is based on usage rate rather than
on supplementing low income levels, means that wealthier urban citizens with a high rate of energy
usage and access to electricity are the main beneficiaries. As of 2011, 66 million Indonesians (27 per
cent of the population) did not have access to electricity (IEA, 2014).
Usage of natural gas enjoys fewer subsidies than that of oil products in Indonesia. And natural gas
has been sold domestically to industrial users and power plants at a much smaller price differential
(US$3–4/MMBtu or over 20 per cent lower than international prices) (SKK Migas, 2013) than has
been the case for oil products,
Replacing the usage of highly subsidized oil products with natural gas has the potential to bring about
savings in government expenditure; this was seen in the kerosene-to-LPG conversion programme
and the 2007–2011 CNG and LGV for transportation programmes (Beaton and Lontoh, 2010 and
Braithwaite et al. 2012). Politically, the maintenance of existing subsidies is also far more attractive to
the Indonesian public than increasing oil product prices by cutting oil subsidies.
Fuel price hikes have always been politically unpopular with citizens, particularly in cities where
demand for transportation fuel is higher. Reports of oil price hikes tend to be met with riots and have
caused the government to slow down or retract policy changes, as was seen in the failed electricity
price hike of 2012 (Bellman, 2012 and Ho, 2013). But the government’s approach to communicating
these price hikes has steadily improved in recent years, particularly with the introduction of cash
handouts in 2005.
The smaller subsidies associated with natural gas could also mean that despite concerns of rising
production and import costs (discussed later in this chapter) and even if demand increases, it is less
likely that the government would need to make significant price adjustments to ensure the future
economic feasibility of natural gas usage. Imported oil products require a far higher percentage of
subsidization and this has already proven to be beyond the government’s means (IISD, 2012).
In 2010, Indonesia’s natural gas production and usage levels peaked to reach 82.0 bcm and 40.3 bcm
respectively (BP, 2014). But production levels have since declined to reach 70.4 bcm in 2013, while
usage fell in line to reach 38.4 bcm in the same year (BP, 2014). These figures suggest that natural
gas demand can rally to absorb supplies if they are available. LNG exports declined to 22.4 bcm in
2013 from 24.8 bcm in 2012, due to a combination of reduced production and the government’s plan
to divert more natural gas to the domestic market by cutting back term contract commitments (BP,
2014).
8Despite the current slow down in production and exports, more potential indigenous natural gas
reserves are being discovered. Large new offshore projects, such as East Natuna and Gendalo-
Gehem, are expected to drive output in the country after 2020, according to the IEA (2014). LNG
liquefaction capacity in the country is also expected to strengthen to around 55 bcm by the 2020s
(IEA, 2014). The IEA estimates that unconventional gas sources such as shale and coal bed methane
are expected to contribute to production from the 2020s, with combined output from these sources
reaching up to 20 bcm in 2035 (IEA, 2014).
Indonesia’s overall electricity demand is expected to triple between 2011 and 2035, with average
annual growth of 4.8 per cent, according to IEA forecasts (2014). Natural gas usage will see the
biggest growth for industry users – such as the fertilizer and petrochemicals sectors – with the share
of gas in the industry fuel mix increasing from 28 per cent in 2011 to an expected 47 per cent in 2035
(IEA, 2014, Table 4). While power generation is mostly fuelled by diesel, Indonesia has some power
plants that were initially designed to run on natural gas but which are currently running on oil due to
the lack of natural gas supply. It is therefore possible to switch back to natural gas if the supplies are
available (IEA, 2014).
Table 3: Primary energy demand in Indonesia by fuel (mtoe)
2011–
1990 2011 2020 2025 2035
2035*
Coal 4 31 60 78 115 5.5%
Oil 33 73 84 87 95 1.1%
Gas 16 35 46 53 71 3.0%
Hydro 0.5 1.1 1.6 2.1 2.7 4.0%
Bioenergy** 34 40 39 37 38 –0.3%
Other 2 16 21 25 37 3.5%
Renewables
Total 89 196 252 282 358 2.5%
*Compound average annual growth rate.
** Includes traditional and modern biomass uses.
Source: IEA, 2014
Natural gas is therefore an ideal fit for Indonesia’s future energy needs, based on current and
potential availability of supplies and the presence of strong and growing demand.
The success of Indonesia’s drive to increase natural gas usage will be determined by the availability
of natural gas infrastructure in the form of import terminals and gas distribution networks to industrial
users and power plants. State-owned utility PLN has also agreed to pay more for gas, to secure
domestic gas supplies (Argus, 2011b).
The floating storage and regasification unit (FSRU), Satu Regas LNG import terminal, started up in
2013. This has up to 3.8 mmt/yr in processing capacity and 1.5 mmt/yr LNG contracted from the
Bontang LNG plant to supply PLN’s Muara Karang and Tanjung Priok power plants, with around
3mmt/yr of joint demand in West Java (Argus, 2013a).
Indonesia’s second LNG receiving terminal, Lampung FSRU, is expected to commission in the third
quarter of 2014, while another import terminal, East Central Java FSRU, is targeted to start up post
2014 (Argus, 2014e). The conversion of the 6.5 mmt/yr Arun LNG plant into an import and
regasification terminal by 2015 will also increase the country’s capacity for LNG imports and
regasification (Argus, 2011c and GIIGNL, 2014). Two more FSRUs, a 3 mmt/yr central Java project
operated by Pertamina and a 1.5 mmt/yr terminal at Cilegon in north-west Java run by the private-
sector Indonesian firm Energi Dian Kemala, are also likely to come on stream over 2014–15 (IEA,
2013). GDF Suez also signed an agreement, in June 2014, with state-controlled Indonesian gas
distributor Perusahaan Gas Negara (PGN) to study the feasibility of an onshore LNG import terminal.
The potential terminal would be in northern Java, Indonesia’s most densely populated island (Argus,
2014a).
9FSRUs are ideal for Indonesia’s plans to deliver small amounts of LNG to its domestic users. Not only
are they cheaper to build, but they also allow importers to fast track supply networks as it takes
around two to three years to construct a newbuild floating terminal compared to seven years for an
onshore terminal (Oil and Gas Investments Bulletin, 2012).
3.2 Challenges of driving natural gas
A. Improving energy infrastructure
In the short term, Indonesia’s efforts to drive natural gas usage have to be carried out in parallel with
improvements to its energy infrastructure. Diverting more natural gas production to the domestic
market would not be possible without sufficient distribution pipelines to reach industrial users and
increased gas-fired power generation to boost demand (Nugroho, 2004).
Natural gas infrastructure expansion by Pertamina and the former upstream regulator BPMigas has
set plans in motion to cut oil usage. The potential savings from reduced oil subsidies could be
deployed towards further infrastructure developments such as LNG import terminals and gas-fired
power plants (Patel, 2013).
Natural gas volumes for the domestic market are increasingly being made available through the non-
renewal of long-term LNG supply contracts. Domestic demand, however, has not yet entirely caught
up with the increase in supply; as a result Pertamina has offered more LNG cargoes on the
international spot market in 2013 and 2014 (Argus, 2013b).
Electricity price controls in Indonesia have also slowed the expansion of generating capacity, together
with the grid extensions and upgrades that would allow the country to meet its electrification targets.
PLN purchases electricity from IPPs using government subsidies that are determined annually.
Moreover, without the assurance that PLN can continue to afford to purchase electricity from them
through government subsidies in the long term, private initiatives to drive power generation growth in
the country are dampened, as IPPs lack the confidence to invest in longer-term projects, the IEA
suggests (IEA, 2014).
Reductions in LNG and pipeline gas exports will bring few benefits if distribution networks and centres
of demand are unable to support government natural gas usage targets. The plans of both
Indonesia’s outgoing and incoming administrations to increase natural gas production and
consumption in the coming years highlight the urgency of expanding energy infrastructure. Such an
expansion is required to ensure that natural gas reserves located on the outer islands – away from
the centres of demand in Java – will be able to reach consumers to support increased gas usage
(Nugroho, 2005). In the near term, Indonesia’s main challenge is to drive domestic and foreign
investment in its energy infrastructure by reforming its energy subsidy system; government
expenditure can thus be diverted towards funding much-needed energy infrastructure rather than
providing subsidies (Braithwaite et al., 2012).
B. Sustaining production
As more natural gas is diverted away from exports to fulfil domestic demand, the potential loss of
revenue generation from exports in the long term has to be offset by higher domestic natural gas
prices, in order to encourage new exploration and production (E&P) projects (Nugroho, 2004). If
higher domestic demand calls for an increase in the allocation – currently 25 per cent under
Indonesian law – of production to the less lucrative domestic market, it could affect the attractiveness
of new projects to international banks, which offer financing on the basis of the expected price of gas
produced (Mujiyanto and Tiess, 2013). Upstream projects will therefore struggle to secure financing if
they are expected to supply the domestic market at low prices. The government must be mindful of
the need to keep domestic natural gas prices at levels that maintain the profitability of both new
production coming on stream and of LNG imports.
10Across the world, the costs of upstream gas projects increase and are set to rise further – due to a
combination of competition for skilled E&P workers, high equipment costs, and the need to access
new gas reserves in more challenging geographical terrain – and Indonesia will no doubt also
experience this trend (GIIGNL, 2014). Competition is also growing in the LNG export market: various
US shale gas-to-LNG projects are to come on stream starting 2016, there are plans for increased
production and exports by Russia and Australia, and a large number of potential East African gas and
LNG projects are in the pipeline (GIIGNL, 2014). All of this suggests that Indonesia is unlikely to be
able to rely entirely on higher export prices to balance out lower domestic revenue, as producers will
also need to maintain export prices that are competitive on the international market.
C. Balancing natural gas demand and exports
In order to keep production economically feasible, it will be important to find the right balance between
export and domestic revenue to compensate for lower domestic prices. Increased natural gas usage
will also mean diverting natural gas from the lucrative LNG and pipeline gas export markets to the
domestic market (Nugroho, 2004).
LNG is the country’s main form of natural gas export, alongside pipeline gas. Oil exports have been
on the decline for the last decade and natural gas exports are an increasingly important component of
the country’s GDP (EIA, 2014b). The fuel’s revenue generation ability, both internationally and
domestically, will determine how successful the country can be in driving investment in energy
infrastructure to support natural gas usage and in ensuring sustainable domestic consumption.
Domestic gas demand is, however, expected to exceed the natural gas supplies allocated to the
domestic market and as a result Indonesia will have to turn to the import market for additional
supplies (Table 4 and MEMR, 2013).
Table 4: Indonesia Gas Balance Projection for 2020 (mmcm/d)
South West East East
Aceh Papua Masela
Sumatra Java Java Kalimantan
Supply 0.906 27.33 30.39 6.68 44.77 29.34 16.99
Demand 4.276 46.24 61.25 30.61 21.63 29.62 0
Balance –3.37 –18.2 –30.87 23.93 23.14 –0.283 16.99
Source: MEMR, 2013
An expected two-year delay in the expansion of production at the BP-operated Tangguh LNG plant
will make more LNG imports possible in 2018. This expansion will add another 3.8 mmt/yr production
train to the project – from which 40 per cent of production will go towards supplying the domestic
market (Argus, 2013b). In a bid to secure LNG imports for this plant, Pertamina signed a contract in
July 2014 to double its long-term LNG purchases from US firm Cheniere Energy’s planned 13.5
mmt/yr Corpus Christi terminal in Texas to as much as 1.52 mmt/yr (Argus, 2014c).
D. King coal
Keeping energy production costs low is a priority for any country, especially for a low-income
developing country like Indonesia. As the world’s largest coal producer, coal will remain a more
attractive fuel than natural gas for Indonesia, as it is cheaper and more readily available.
Consequently, coal will maintain a larger share of the energy mix and that share will continue to grow.
It accounted for 24.7 per cent of the country’s 2,894 MMBOE/d usage in 2010 and is projected to
reach 30.7 per cent of 7,134 MMBOE/d for 2025 (Figure 3 and SKK Migas, 2013). Indonesia’s natural
gas consumption was only up 9 per cent in the last decade and natural gas accounted for 21 per cent
of overall fuel usage in 2013 (BP, 2014).
3.3 Indonesia’s natural gas future
Achieving a sustainable balancing point – at which the growing export revenue from natural gas
drives domestic demand – is now increasingly possible for Indonesia but such an achievement is not
without its challenges. The government needs to ensure that additional energy infrastructure is built to
11sustain the country’s plans to increase gas usage. Rising upstream costs and international LNG
prices would mean that Indonesia needs to set sustainable prices for natural gas, to ensure that
production and imports remain economically viable.
Indonesia has been making much-needed progress in its contract price renegotiations, ensuring that
its exports are sold at current international prices. In July 2014, the Indonesian government secured a
long-awaited upwards revision of long-term prices for Indonesian LNG exports to China. Indonesia
agreed higher term prices for the 7.6 mmt/yr Tangguh LNG facility with China’s state-owned CNOOC,
and removed the oil ceiling price from the contract in July (Argus, 2014d). The successful negotiation
of higher prices with CNOOC will also strengthen Indonesia’s position in upcoming contract talks with
the South Korean LNG buyers K Power and Posco (Argus, 2014d).
Contract prices for Indonesian LNG deliveries to China will rise by an estimated $5/MMBtu this year,
assuming an average Japan Customs Cleared (JCC) price of $100/bl. The price formula for 2014 is
0.0650 × JCC + 1.5, followed by 0.090 × JCC + 1.3 for 2015, 0.1050 × JCC + 1.50 in 2016, and 0.110
× JCC + 2.3 in 2017 (BP Migas website). The previous CNOOC contract, agreed in 2002, was for 2.6
mmt/yr of LNG from Tangguh LNG at 5.25 per cent of JCC, plus a premium of $1.35/MMBtu, based
on a JCC ceiling price set at $26/bl. The contract was renegotiated in 2006, when the JCC ceiling
price was revised upwards to $38/bl. Renegotiations in 2010 and 2012 did not result in a price
increase (SKK Migas, 2014a).
A number of supporting factors point to natural gas being the key to the successful reconfiguration of
Indonesia’s energy mix. By starting with cuts to government subsidies on oil production and oil-fired
power generation, more funds can be diverted towards the building of energy infrastructure that
supports higher natural gas usage. The country’s smaller subsidies on natural gas compared with
those on oil products potentially offers the government some leeway in implementing domestic natural
gas prices that can sustain both production and import costs.
Overall, energy supply security is a priority for the Indonesian government and while increasing
natural gas usage has its advantages, the debate will repeatedly return to energy prices. Electricity
tariffs need to target the wealthier higher consumption groups and domestic natural gas prices need
to be high enough to ensure the continued feasibility of future E&P projects (IISD, 2012). The need to
import LNG will also require the government to ensure that domestic natural gas is sold at sustainable
prices so as not to incur huge losses on these imports (IEA, 2014).
Alongside the growing momentum to divert more natural gas to the domestic market, Indonesia has to
ensure that electricity and natural gas prices remain relatively close to international market levels, to
avoid the costly mistakes that previous governments have made with fuel subsidies for oil products.
Indonesia has made some headway in terms of increasing its domestic natural gas prices in recent
years. PLN has indicated its willingness to pay prices on a par with the international market price for
cargoes delivered to the country’s new LNG terminals (Argus, 2011b). In 2012, SKK Migas increased
Indonesia’s average natural gas price by 28.76 per cent bringing it to US$10.59/MMBtu (Figure 4 and
SKK Migas, 2013), as a result of price renegotiations with PLN and allocating more LNG volumes
from Tangguh LNG to the domestic market.
The Indonesian government has made progress in its efforts to increase domestic gas supplies and
this bodes well for the Widodo administration. In early October this year, SKK Migas announced the
signing of five new domestic gas supply contracts valued at US$10.5 billion. The largest contract was
signed between PLN and Tangguh LNG for a total of 400 LNG cargoes, to be delivered over a period
of 19 years; this is the largest domestic gas supply contract signed to date. The four other, smaller,
deals are: a 14,160 cubic metres per day supply contract secured by PLN for Tana Tidung in East
Kalimantan, a five-year 0.34–1.416 mmcm/d contract for gas supplies to East Java, a 1.81 mmcm/d
supply contract to for the Pacific Ammonia plant in East Kalimantan up to December 2019, and a 0.3
mmcm/d contract to supply the Mont Megang Muara Enim power plant in South Sumatra for 21
months (SKK Migas, 2014b).
12Domestic gas supplies will increase to meet demand, but infrastructure expansion will be necessary
to bring gas to domestic users, warned J Widjonarko, the acting head of SKK Migas. Natural gas
supplies directed to the domestic market are expected to overtake exports this year according to SKK
Migas, with an estimated 110.7 mmcm/d delivered to domestic users compared to 95.0 mmcm/d that
will be exported (SKK Migas, 2014b).
Figure 4: Indonesia gas lifting and prices (2012)
Source: SKK Migas, 2013
While natural gas production and exports appear to have slowed in the short term, Indonesia’s is
expected to have a lasting relationship with the fuel in the long term, with more potential reserves
being discovered. The country’s new and planned LNG import terminals will also support domestic
natural gas usage, while the rise of new production plants will ensure supplies are available to sustain
demand. Natural gas maintains an advantage over coal in terms of environmental performance, as its
consumption can lower local pollution and carbon emissions, bringing with it overall long-term health
benefits for Indonesians (IEA, 2014). And gas-fired power plants, despite burning a more expensive
fuel, have the benefit of lower capital costs and shorter construction times compared to coal-fired
power plants (IEA, 2014).
In short, increasing Indonesia’s domestic natural gas usage can support the reconfiguration of the
country’s energy mix, as lower oil consumption and demand for oil imports translates into lower
government spending on oil subsidies (Mujiyanto and Tiess, 2013). This will not only reduce the
overall burden of this expenditure on the government’s budget but will also allow more funds to be
made available for building natural gas infrastructure. Improvements to the country’s natural gas
infrastructure will not only increase production levels but also boost demand capacity. The hope of
freeing up government expenditure through the replacement of oil usage by that of natural gas and
alternative fuels is, however, not without its challenges.
13IV. Natural gas reforms in Malaysia and Thailand
Malaysia and Thailand are more developed than Indonesia in terms of both GDP (Figure 5, World
Bank, 2014) and electrification rates (Table 5), but the three countries share a common plan to
increase overall natural gas demand to cope with growing domestic energy needs as their economies
expand. Thailand and Malaysia are more reliant on natural gas than Indonesia; their governments
therefore face slightly different issues in managing the challenge of increasing natural gas usage.
Figure 5: ASEAN GDP per capita US$ (2000–12)
45,000
40,000
35,000
Indonesia
30,000
Malaysia
25,000
Thailand
20,000
Philippines
15,000
Vietnam
10,000
Brunei Darussalam
5,000
0
2002
2000
2001
2003
2004
2005
2006
2007
2008
2009
2010
2011
2012
Source: World Bank, 2014
Table 5: Access to modern energy services in ASEAN 2011
Population Urban Rural
Electrification
without electrification electrification
rate (%)
electricity (m) rate (%) rate (%)
Brunei 0 100 100 99
Cambodia 9 34 97 18
Indonesia 66 73 85 60
Laos 1 78 93 70
Malaysia 0 100 100 99
Myanmar 25 49 89 29
Philippines 28 70 89 52
Singapore 0 100 100 100
Thailand 1 99 100 99
Vietnam 4 96 100 94
Source: IEA, 2014
This section examines the main objectives of each country’s energy policies, to emphasize how
Indonesia’s present energy scenario places it at a relative advantage in reconfiguring its energy mix
and reforming its subsidy system. The discussion will begin by examining the overall energy
landscape for the three countries, before moving on to sections analysing the energy policies of
14Malaysia and Thailand. The discussion will then close by drawing comparisons between these
countries’ energy policies and those of Indonesia.
4.1 South-east Asia’s three largest energy consumers
The energy polices of Malaysia, Thailand, and Indonesia are unique; they reflect country-specific
demand patterns and resource availability. Indonesia is the largest energy user in south-east Asia,
with 196 mtoe of demand in 2011, ahead of Thailand and Malaysia at 119mtoe and 74mtoe
respectively (IEA, 2014). But all three share the common goals of energy security, affordability, and
efficiency, which they hope to achieve by diversifying their energy mix and reducing reliance on oil
(IEA, 2014).
Increasing usage of natural gas in Malaysia, Thailand, and Indonesia is part of an overall increase in
south-east Asia, and has contributed to the emergence of LNG demand. Between 2011 and 2013,
first Thailand, then Indonesia, and then Malaysia became LNG importers (IEA, 2014). Previously,
Asian LNG importers – Japan, South Korea, China, Taiwan and India – accounted for most of the
world’s LNG demand (GIIGNL, 2011).
Thailand and Malaysia, like Indonesia, are looking to cut costly fuel subsidies that distract from
investment, with the goal of greater long-term benefits such as improved energy infrastructure and
efficiency. In keeping with most nations in south-east Asia, Indonesia, Malaysia, and Thailand rely on
a system of blanket energy subsidies that apply to the entire nation. As already argued in relation to
Indonesia, these subsidies are inefficient and should be replaced with targeted financial support for
the poor (IISD, 2012). In 2012, fossil fuel subsidies amounted to $51 billion in south-east Asia, despite
ongoing reform efforts by various nations (IEA, 2014).
Another disadvantage of subsidies at an international level is the prevalence of fuel smuggling in the
region. Subsidized fuels from one country are resold in neighbouring countries where prices are
higher. Indonesia, Malaysia, and Thailand are all suffering from this phenomenon. Not only does the
country supplying the subsidized fuel products see a decline in legitimate sales, its government
forgoes taxes and excise duties from the countries receiving the smuggled products. Illegitimate sales
in countries receiving a large amount of smuggled fuel also translate into losses for the government
due to unpaid tax revenues (IEA, 2014 and IISD 2012). The issue of fuel smuggling in south-east Asia
shows that the negative effects of fuel subsidies are not constrained to a country’s borders and can
become a region-wide problem.
While there may be price or even supply concerns among south-east Asian nations when considering
natural gas as an option, natural gas remains a more economical and accessible choice than oil
products. Malaysia and Thailand, in comparison to Indonesia, have a smaller margin of growth
potential for natural gas usage, as they have lower production levels and natural gas consumption
has already placed some constraints on their government budgets. But their comparatively higher
current penetration of gas usage also means that they have significant infrastructure available to
support the preference of natural gas above oil products.
As is the case in Indonesia, overall natural gas demand in Malaysia and Thailand will increase, but
the share of natural gas in each of these countries’ energy mix will shrink as these countries drive
their plans to expand into renewables and unconventional gas sources to ensure the sustainable
growth of their economies. Natural gas in the meantime will remain an important choice of fuel as
these governments attempt to cut their reliance on oil products.
4.2 Malaysia
Malaysia’s initiatives to increase energy supplies and reconfigure its energy mix by shifting away from
costly oil products bear closer resemblance to Indonesia’s experience than Thailand’s. As a large
producer of oil and gas for many years, the government had for decades provided citizens with highly
subsidized oil and gas products. But with energy needs rising in Malaysia its government now, like its
Indonesian counterpart, faces the challenge of balancing export revenue generation with the need to
supply domestic gas requirements at subsidized prices (IEA, 2014).
15While Malaysia’s oil products might not be as highly subsidized as Indonesia’s, the former’s subsidies
for natural gas are more entrenched as domestic prices have been subjected to government price
caps as a means of attracting foreign investment (MGA, 2013). As the main power generation fuel in
Malaysia, demand for natural gas has increased alongside economic growth (Table 6 and Figure 5).
Malaysia’s natural gas consumption stood at 34.0 bcm in 2013, up from 27.2 bcm in 2003 (BP, 2014).
Table 6: Primary energy demand in Malaysia by fuel (mtoe)
1990 2011 2020 2025 2035 2011–35*
Coal 1 15 24 29 39 3.9%
Oil 11 28 33 35 40 1.6%
Gas 6 28 34 37 41 1.5%
Hydro 0.3 0.7 1.6 1.9 2.9 6.4%
Bioenergy** 1.8 2.2 2.8 3.2 4.4 3.0%
Other
0.0 0.0 0.1 0.1 0.4 48.1%
Renewables
Total 21 74 96 106 128 2.3%
* Compound average annual growth rate
** Includes traditional and modern biomass uses
Source: IEA, 2014
Domestic natural gas prices in Malaysia have historically been lower than export prices, and this in
turn has dampened the revenues of state-owned oil and gas company Petronas (MGA, 2013). The
cap on domestic natural gas prices has also meant that with international LNG prices rising on the
back of stronger demand in recent years, Petronas has incurred significant loss of revenue by
forgoing exports. Between 2008 and 2010, Petronas was estimated to have lost RM100 billion in
potential LNG export revenues by supplying natural gas to the domestic market (MGA, 2013).
Increasing domestic demand for natural gas has also meant that despite being a long-time LNG and
pipeline gas exporter, Malaysia started importing LNG from Qatar and Australia in 2013 (Argus,
2013c). The inclusion of costly imported LNG to counteract shortages faced by the industrial sector
could translate into increased revenue losses for importer Petronas, due to domestic price controls
(MGA, 2013). Action should be taken to raise domestic natural gas and electricity prices to reflect
rising costs. There are, however, some encouraging developments. In December 2013, the Malaysian
government approved electricity price hikes by state-owned utility TNB for the first time in over two
years (Chong and Ramasamy, 2013).
In addition to reducing the pressure on state-owned companies, raising natural gas prices would also
help drive investment in upstream production, as the promise of higher domestic prices improves the
attractiveness of upstream projects to financial institutions and investors.
In the longer term, natural gas production in Malaysia is still expected to grow, but more natural gas
supplies will likely be diverted to the domestic market. Malaysia’s gas production is projected to rise to
71 bcm in 2020, before declining slightly to 65 bcm in 2035 due to depleting reserves (Table 7). Net
natural gas exports are forecasted to increase to about 30 bcm by 2020, before declining to 17 bcm
by 2035 due to rising domestic demand, according to IEA estimates (Table 8).
16You can also read