Impacts of Reductions in US Cotton Subsidies on West African Cotton Producers - Julian M. Alston, Daniel A. Sumner, and Henrich Brunke
←
→
Page content transcription
If your browser does not render page correctly, please read the page content below
Impacts of Reductions in US
Cotton Subsidies on West African
Cotton Producers
Julian M. Alston, Daniel A. Sumner, and Henrich Brunke
Julian M. Alston and Daniel A. Sumner are professors in the department of agricultural and
resource economics at the University of California, Davis. Sumner is also the director of the UC
Agricultural Issues Center where Henrich Brunke was a research specialist. The views
expressed are the authors’ alone and not those of any institution with which they are affiliated.
The authors appreciate information provided by numerous colleagues, especially Nick Minot,
Sunday Odjo and Gerald Estur. We also appreciate comments and suggestions of Michael
Carter, Gerald Estur and other reviewers. Research on this paper was supported by Oxfam
America.

Oxfam America is an international relief and development organization that creates lasting
solutions to poverty, hunger, and injustice. As part of our Make Trade Fair campaign, we are
working to reform the 2007 Farm Bill so that it better protects the environment, feeds the
hungry, and gives farmers here and abroad the chance to make a decent living.
To take action, visit www.oxfamamerica.org/farmbill.
CONTENTS

Introduction                                                                    1

Cotton in West Africa                                                           1

Effects of US Policies on World Market Prices                                   2

Implications of World Price Changes for Prices Received by African Producers    5

Effects of Changes in Cotton Prices on Cotton-Producing Households              9

Summary and Conclusion                                                         11

List of Cited References, Additional Relevant Literature and Annexes           12

Notes                                                                          34
Introduction
Oxfam America’s campaign to reform US trade-distorting commodity subsidies rests on two basic
premises. The first premise is that trade-distorting commodity subsidies lead to additional production of
cotton, which lowers the world price for cotton. The negative relationship between cotton subsidies and
the world price of cotton is well established (despite ongoing debate over the magnitude of the price
effect) and Alston and Brunke (2006) provide updated estimates using 2004-2005 as a baseline. The
second premise is that lower world cotton prices harm cotton farmers in West Africa and elsewhere.
Between 2 million and 3 million farms in West Africa rely on cotton as their main source of cash income,
and they compete directly with subsidized US cotton. Not surprisingly then, lower world cotton prices
harm millions of households and more than 10 million people across the region.
This impact is confirmed through simulations of the price impact of cotton subsidies that provide
estimates of losses to exporters, marketers and farmers in West Africa and elsewhere (Alston and Brunke
2006; Anderson and Valenzuela 2006; Goreux 2003; Sumner 2003b and others). These studies have
been instrumental in shaping Oxfam’s campaigning around trade rules, but they fall short of providing a
sense of what these “gains” really mean for the cotton farm family – how important these gains are in
terms of increased household income and the ability of the household to pay for inputs to improve farm
productivity, for food and for other basic needs.
This present study builds on the recent estimates by Alston and Brunke (2006) to estimate the
reductions in income to cotton farmer households in Benin, Burkina Faso, Chad, and Mali if counter-
cyclical payments, marketing loans, and direct payments programs were eliminated in the United States.
The results are reported in terms of effects on incomes of typical cotton producing households both in
absolute terms and as a share of total household income. We also relate this income impact to food
consumption of a typical cotton-producing household and to potential to purchase inputs that enhance
farm productivity.
Cotton in West Africa
The C-4 countries (Benin, Burkina Faso, Chad, and Mali) are major cotton producers in Africa
and significant in the international market for cotton. Collectively these four countries represent about
three percent of world production and about eight percent of world exports. However, although they are
significant participants in world cotton markets, even collectively the C-4 countries do not exercise any
market power in cotton trade.
Cotton is an important crop in the C-4 countries of Africa. It accounts for between 2.5 and 7
percent of GDP in these countries. Cotton accounts for about 60 percent of crop revenue in the C-4
countries and is the primary export crop accounting for the majority of agricultural export earnings in each
country (Baffes 2004, 2005). Thus cotton is important to the wellbeing of farm families and of the
economies more broadly.
The C-4 countries are among the poorest in the world – they rank between 173 and 193 among
about 208 countries ranked by the World Bank (2006) in terms of Gross National Income per capita
(converted to common currency units using either moving averages of market exchange rates or
purchasing power parity exchange rates). Furthermore, farm families are typically poorer than non-farm
families in these countries. In Benin, given the remoteness of cotton production and the lack of access to
non-farm employment, cotton farmers are poor relative to residents who live nearer to the coast. Cotton
is produced on farms that also grow maize, millet, cassava and other crops for market sales and home
consumption. Some farms also grow vegetables for home use and for the local market (Minot and
Daniels 2005). Cotton producers in Burkina Faso are likely to be slightly better off than other farmers,
many of whom have little access to cash crop production and who therefore rely almost completely on
production for home consumption. Nonetheless, all data support the finding that cotton-growing
households in the C-4 countries are extremely poor even by the standards of the developing countries.
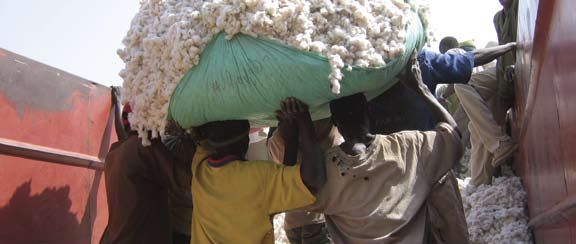
Oxfam America ׀Impacts of Reductions in US Cotton Subsidies on West African Cotton Producers 1Cotton is important to the labor force in each country and is the dominant source of employment
in cotton producing regions. According to the Food and Agriculture Organization of the United Nations
(FAO) farm employment in cotton was 450,000 workers in Benin (29 percent of total employment),
380,000 workers in Burkina Faso (7 percent of total employment), 380,000 workers in Chad (10 percent
of total employment) and 800,000 workers in Mali (17 percent of total employment) (Shui 2004). Using
these figures, total on-farm cotton employment in the C-4 countries is about two million workers.
About 325,000 farms produce cotton in Benin, 200,000 farms produce cotton in Burkina Faso,
350,000 farms produce cotton in Chad, and 200,000 farms produce cotton in Mali (Gerald Estur, personal
communication, May 2007). Together with total area planted to cotton in each country, these farm
numbers also provide evidence on the average size of cotton area per farm that grows cotton (Table 1).
We also note that, given average household size in the region often reaches 10 members per farm
household, these cotton farm numbers indicate that several million individuals in the C-4 countries are
dependent on cotton income.
In the C-4 region, cotton area grew from the early 1990s through 2002 while cotton yields
stagnated or fell. The large exchange rate adjustment in 1994 made exportable cotton more profitable
relative to locally consumed products. Major production expansion occurred in Benin and Burkina Faso
with less growth in Mali and only moderate production growth in Chad (Shui 2004). From 2004 to 2006,
cotton area declined in Benin and expanded further in Burkina Faso (Table 2).
Map 1 shows the locations of cotton growing regions in West Africa. Cotton is grown in inland
and remote areas where non-farm employment is limited and where cotton is particularly well suited
relative to other crops. Even in Benin, where there is a coastal outlet, the cotton is grown in the arid
inland northern region away from the more heavily populated coastal areas.
Effects of US Policies on World Market Prices
Alston and Brunke (2006) examined the effects of US cotton subsidies on the world price of
cotton and consequently on cotton growers in the African nations of Benin, Burkina Faso, Chad and Mali
by quantifying the effects of modifying individual subsidy programs in the United States in the context of
the forthcoming 2007 US farm bill. Subsidies to the US cotton industry are similar to those provided for
other programs crops (wheat, feed grains, oilseeds and rice) and have been included in periodic US farm
bills for seven decades. Cotton subsidies include three main payment programs to eligible cotton
producers: the direct payment program; the counter-cyclical payment program; and the marketing
assistance loan program. Each of these subsidy programs has different provisions and different effects
on production incentives (Claassen 2002; Sumner 2003b; Sumner 2006; Westcott and Young 2002;
Westcott, Young and Price 2002; and Young and Westcott 2000). Alston and Brunke (2006) discussed
each of the main program provisions in detail. For each program, using average data for 2004 and 2005
to represent a “normal” year, they developed estimates of the equivalent rates of pure subsidy in terms of
their incentive effects, which they used in their simulation model to examine the effects of a hypothetical
complete elimination of US subsidies leaving other countries’ policies in place.
The Simulation Model
The simulation model used by Alston and Brunke (2006) is similar to that of Sumner (2006),
which in turn is based on that in the annex to his Cato publication (Sumner 2005a). The simulation model
is based on a system of equations, with variables expressed in proportional (or percentage) changes.
The simulated changes in prices and quantities of cotton are relative to a baseline, which is defined using
data for 2004-05. The analysis is conducted holding constant everything else that determines the
underlying supply and demand conditions for cotton and the market equilibrium, apart from the changes
in policy being analyzed. With this modeling approach it is not necessary to be able to forecast the
values and effects of all of the variables that may change over time and may influence the baseline.
The model is described in detail by Alston and Brunke (2006). It includes six equations that
represent the supply and demand for cotton in the United States (shown by subscript u), West Africa
Oxfam America ׀Impacts of Reductions in US Cotton Subsidies on West African Cotton Producers 2(subscript a), and the rest of the world (subscript r), and five equations defining market-clearing conditions
that link consumer and producer prices among regions and set total supply equal to total demand:
(1) %ΔSu = εu %ΔPsu
(2) %ΔDu = ηu %ΔPdu
(3) %ΔS a = ε a %ΔPsa
(4) %ΔDa = ηa %ΔPda
(5) %ΔS r = ε r %ΔPsr
(6) %ΔDr = ηr %ΔPdr
(7) %ΔPdu = %ΔP
(8) %ΔPsa = %ΔPda = τa %ΔP ; 0 < τa ≤ 1
(9) %ΔPsr = %ΔPdr = τr %ΔP ; 0 < τr ≤ 1
(10) % ΔPsu = α% ΔP + (1 − α)% ΔG = α % ΔP + (1 − α) ( % Δγ + %Δg )
(11) δ sa %ΔS a + δ su %ΔSu + (1 − δ sa − δ su )%ΔS r = δda %ΔDa + δdu % ΔDu + (1 − δda − δdu )% ΔDr .
In these equations, the term %ΔS stands for the approximate percentage (or proportional)
change in the quantity supplied, %ΔD stands for the approximate percentage change in the quantity
demanded, and %ΔP stands for the approximate percentage change in incentive prices faced by
consumers (subscript d) and producers (subscript s). The parameters εu, εa and εr are the price (or per
unit revenue) elasticities of supply in the United States, West Africa and the rest of the world; ηu, ηa and ηr
are the price elasticities of demand in the United States, West Africa, and the rest of the world; and τa,
and τr are elasticities of price transmission between the United States and producers and consumers in
West Africa, and between the United States and producers and consumers in the rest of the world. The
variable Psu represents the effective incentive price perceived by US cotton growers. It is comprised of
the market price, P, plus effective per unit revenue received from the government through subsidies,
denoted G = γg, where g is the government support including all the subsidies, and γ is a coefficient that
reflects the extent to which the subsidies are coupled to production in the sense that they stimulate a
production response (when γ = 1, a dollar of subsidy has the same effect on production as a dollar of
revenue from the market).
Substituting the market-clearing price equations (7) through (10) into the supply and demand
equations (1) through (6), and then substituting (1) through (6) into (11) and solving for price yields:
−δ su εu (1 − α)%ΔG
(12) %ΔP = .
δ su εu α + δ sa ε a τa + (1 − δ su − δ sa )ε r τr − δdu ηu − δda τa ηa − (1 − δdu − δda )τr ηr
where δsu is the share of US production in world production and δdu is the share of US consumption in
world consumption; δsa is the share of West Africa production in world production and δda is the share of
West Africa consumption in world consumption. Here consumption means use of cotton in milling, not the
final consumer use of cotton textile products.
Effects of Subsidy Reductions
Alston and Brunke (2006) used equation (12) to assess the effect of the outcomes of changes in
parameters underlying US cotton subsidy programs, represented as changes in the effective US cotton
subsidy rate, G, on the price of cotton facing producers in West Africa, and other variables. Then they
computed the change in C-4 “producer surplus” by multiplying the change in the world price (in cents per
Oxfam America ׀Impacts of Reductions in US Cotton Subsidies on West African Cotton Producers 3pound) by the C-4 quantity produced (in pounds). This “producer surplus” includes benefits to everyone
involved in the production and marketing chain as well as farmers.
The parameters used in the simulations include market shares, parameters reflecting the
magnitude and form of US subsidies, and supply and demand elasticities combined with price
transmission elasticities, as shown in Table 3. The total value of subsidies (g) was defined as equal to
the average over 2004 and 2005 of direct payments ($613 million) plus counter-cyclical payments ($1,376
million) plus marketing loan benefits ($1,549 million) plus crop insurance ($34 million). i They used two
sets of relative incentive factors, corresponding to values for γ applying to different elements of g. One
set includes values of 0.20 for direct payments, 0.30 for counter-cyclical payments, and 1.00 for
marketing loans. To assess robustness of the results they also employed a set of values of 0.40 for direct
payments, 0.60 for counter-cyclical payments, and 1.00 for marketing loans. Combined with their
average data for 2004 and 2005, these sets of incentive factors respectively imply values for (1 – α) of
0.3031, representing comparatively decoupled subsidies, and 0.3526, representing less-decoupled
subsidies.
Marketing loan benefits are tied directly to cotton production and offset market revenue on a
dollar-for-dollar basis. Marketing loans provide some financing benefits and mitigate price risk, so one
could argue that they have a stronger effect on cotton production than market price. However, all models
that have examined the effects of cotton subsidies have treated marketing loan revenue as equivalent to
market revenue in terms of production incentives and Alston and Brunke (2006) followed this approach.
The values for γ applying to direct payments and counter-cyclical payments are less than one
because producers are not required to grow cotton on their payment base in order to receive these
payments. However, these payments affect US cotton production significantly for several reasons. First,
although current production does not affect current payments, if the payment base is updated in the
future, as it was in 2002, then production of cotton affects future cotton payments, and producers who
recognize the possibility of such an update in the future have an incentive to maintain cotton-base land in
cotton production. Second, although farmers are not required to grow cotton to receive the direct
payments and the counter-cyclical payments, they do lose benefits if they grow fruits, vegetables, melons,
tree nuts or wild rice on cotton base. In some areas where cotton is grown these restricted crops are
important relevant alternatives, and therefore this planting restriction will keep some cotton-base land in
cotton production. Third, these payments reduce the income risk of cotton production and provide an
income guarantee that can help farmers finance their production costs (Hennessey 1998). The counter-
cyclical payments off-set low cotton prices and thus smooth revenues for farmers who grow cotton on
their cotton base. Finally, econometric evidence and survey responses support the findings of significant
cotton production effects of direct payments and especially counter-cyclical payments (Goodwin and
Mishra 2005, and 2006; Key, Lubowski and Roberts 2005; Sumner 2005c; McIntosh, Shogren, and
Dohlman 2007).
Alston and Brunke (2006) reported results for partial and complete elimination of US cotton
subsidies using various combinations of parameters. In the analysis here, the focus is on the complete
removal of counter-cyclical payments, marketing loans, and direct payments programs; partial subsidy
removal would have impacts proportional to those reported below. We report results using the same
combinations of parameters as Alston and Brunke (2006), but with one difference. Alston and Brunke
(2006) assumed an elasticity of C-4 farmer supply with respect to the world market price of 0.20. This
elasticity is equal to the product of the elasticity of supply with respect to the local price, εa, and the
elasticity of price transmission, τa (i.e., τa×εa, = 0.20). In our subsequent research we developed
information, detailed later in this report, which suggests using values in the range of 0.4 to 1.0 for the
elasticity of supply, and values in the range 0.83 to 1.33 to represent the elasticity of price transmission
(corresponding to price transmission multipliers of 0.5 to 0.8). Combining these values of τa (0.83, 1.33)
and εa (0.4, 1.0) implies values for τa×εa of 0.33, 0.53, 0.83, and 1.33, all larger than the 0.20 used by
Alston and Brunke (2006). However, in equation (12) these differences in values for those parameters
have very little influence on the measured price impacts of policy changes, because they enter in the
denominator multiplied by the share of West African production in world production, δsa, which is very
small (less than 3 percent). Our main results on the effects of world price changes on C-4 cotton farmers,
at the end of this report, are based on conservatively small values of these parameters: τa = 0.83 and εa =
Oxfam America ׀Impacts of Reductions in US Cotton Subsidies on West African Cotton Producers 40.4, and thus τa×εa = 0.33. Hence, for consistency, we use the value τa×εa = 0.33 to compute the world
price changes upon which those estimated effects are based.
Table 4 summarizes the main results obtained using the combinations of parameters defined in
Table 3. ii It includes estimates of the effects of 100 percent removal of US farm bill cotton policies on the
world price and producer surplus in C-4 countries for alternative values of three key parameters: (a) the
importance of subsidy revenue as an element of US producers’ incentive price, which depends on the
extent to which the different elements of subsidy are decoupled, (1 – α), (b) the elasticity of US supply
response, and (c) the elasticity of supply response in the rest of the world. Across the range of these
parameters, the estimated effect of removal of US cotton policy on the world price ranges from 5.9
percent to 17.0 percent. More likely parameter combinations would imply an estimate close to the mid-
point of the range, 11.5 percent. We interpret these impacts as intermediate-term impacts that persist for
several years after there is time for the policy change to have an impact on reducing US production.
They are not immediate year-one impacts, nor are they very long-run effects that would allow for new
technology on the production side or new cotton mills on the demand side. iii
The corresponding impacts on C-4 countries range from $43 million per year to $126 million per
year, with more likely parameter values implying effects in the range of $80 million per year. Overall
these results show that the world price would rise and the C-4 African countries would gain if US cotton
subsidies were cut. The more-detailed results form an analysis of the implications of removal of particular
forms of subsidy indicated that the marketing loan program would be the most important program to cut
and that the counter-cyclical payments are also significant. In what follows, we take a conservative
approach and use only the estimates corresponding to (1 – α) = 0.3031, which implies slightly smaller
effects of US subsidies on world prices for given values of the other parameters: estimated price
increases, that would result from removal of US cotton subsidies, ranging from 5.9 to 14.1 percent.
Implications of World Price Changes for Prices Received by
African Producers
The C-4 African countries are price takers in the global cotton market, which means changes in
production by the C-4 cotton producers do not appreciably affect the prevailing export price of cotton. iv
Cotton from the C-4 African countries, as a group, accounts for only about three percent of world cotton
production and only about eight percent of world exports (see Alston and Brunke, 2006 for details).
These quantities are too small for the C-4 countries collectively to have significant influence on world
markets; and, for any individual C-4 country, cotton production and export shares are even smaller.
Furthermore, the C-4 cotton industries have no institutional mechanism to attempt to influence markets. v
Although there is market concentration in individual countries in procurement and marketing of cotton, this
does not indicate market power in international markets. Based on these facts, we treat the export price
of cotton as exogenous (determined outside the markets within Africa). Therefore, we investigate the
effect on the price of cotton received by farmers in the C-4 countries when the export price changes as a
result of a hypothetical cut in US subsidies for cotton.
Market Pricing Mechanisms
When cotton moves from the farms in the C-4 countries to the export market, additional costs are
incurred in the process of assembly, ginning, transport and administration. In a marketing system in
which many firms were competing to buy and market cotton, there would be clear explicit linkages among
the export price, the farm-to-port marketing costs, and the farm price of cotton. Price information would
be transmitted back up the marketing stream from the port through the marketing costs to the farm price.
In such a competitive marketing system, a rise in the export price or a drop in marketing costs would be
reflected clearly and quickly in a rise in the price paid for cotton at the farm. In the C-4 countries of Africa,
however, competitive firms do not handle seed-cotton pricing, procurement, marketing and export.
Government-operated or government-regulated firms are major players, and farm prices are set in
advance of the marketing season throughout the C-4 region (Badianes et al. 2002; Harmsen 2004;
Lagandre 2005; Odjo 2007).
Oxfam America ׀Impacts of Reductions in US Cotton Subsidies on West African Cotton Producers 5Cotton marketing in the C-4 countries has evolved over the past decade to provide for less
government control and more competition for parastatal companies (Goreaux 2005, Harmsen 2004). In
Benin for example, the state owned enterprise SONAPRA no longer has monopoly control over the
purchasing of cotton or distribution of purchased inputs to growers. Eight companies were created to
operate gins and market cotton. Producer prices, however, are negotiated and there is no spot market
pricing; rather, market signals are transmitted on a weekly or monthly basis back to growers. Over-
investment in ginning capacity did not lead to added competition and favorable price outcomes for
growers. Instead an allocation system limits such competition among ginners. Changes in the marketing
systems in other countries have also reduced the role of government firms and parastatals, but a fully
competitive ginning and marketing system has not emerged.
Marketing Margins and Price Transmission Relationships
Recent institutional changes notwithstanding, the marketing structure for cotton pricing means
that year-to-year changes in the price of cotton paid to farmers do not fully reflect recent changes in the
price received for that cotton in the export market or recent changes in marketing costs. Furthermore, in
any year the price of cotton may not represent the long-run equilibrium price implied by the prevailing
market conditions.
Table 5 shows sample marketing costs in units of seed cotton in Benin based on data from
economist Dr. Sunday Odjo. These data show that fiber accounted for between 41.6 percent and 42.5
percent of the weight of seed cotton at the farm level from 2001/2002 to 2003/2004. The price at the farm
for seed cotton was between 165 FCFA (Central African francs, or francs CFA) and 195 FCFA per kg and
another 10 FCFA was added in a local assessment per kg. Transport cost from the farm to the gin was
18.1 FCFA in 2001/2002 and 2002/2003 and rose to 25.4 FCFA in 2003/2004. Costs added after the
farm gate add about 15 percent of the cost of cotton measured at the gin. The first three rows of Table 6
repeat the rows of Table 5, but now expressed in units of ginned cotton fiber. In these rows of Table 6,
the cost data in Table 5 are divided by the appropriate fiber share in seed cotton for each year. The other
costs from the gin to the export market are all specified in costs per kg of cotton fiber. Note that the value
of cottonseed is subtracted from cotton fiber marketing costs. On a fiber basis, the farm procurements
costs average about 65 percent of the net fiber costs FOB over this three-year period. This is high
relative to the share of farm price in the port price for the period prior to 2001 in Benin and in the other C-
4 countries (Table 7).
An examination of the ginning and marketing costs in Table 6 shows that most of these costs
apply on a per-unit basis. Given these costs, and with competition for cotton to satisfy export demands,
an increase or decrease in the export market price would be expected to translate into a higher price at
vi
the farm. However, the ex ante negotiation of farm prices annually means that market price shifts will be
transmitted only with a lag, and temporary movements may not be transmitted at all. In a situation with
prices negotiated in advance, the prices received by growers reflect long-term expected market
conditions, and growers do not face the year-to-year price fluctuations experienced in the export market.
Such a system protects growers from some price risk, but also reduces the degree to which market
signals, in terms of fluctuations in expected prices, are transmitted to growers.
The general downward trend in the export price of cotton is clear from annual data on the
international cotton price shown in Figure 1 (expressed in the price of cotton fiber per pound). This figure
shows the Cotton A-Index price in both US cents per pound (left axis) and FCFA per pound (right axis).
The price of cotton in US cents per pound trended down over the whole period, but the rate of decline
was even faster in the period since the high prices of the middle 1990s. Figure 1 also shows that the
price expressed in FCFA per pound follows the same pattern as the price in US cents per pound. The
large jump in the FCFA price in 1994 was due to a one-time currency unit adjustment and perhaps in part
to the high world cotton price in that year.
Figure 2 shows the 25-year relationships between the annual world price of cotton, shown at the
top of the chart and the farm price for cotton fiber in the C-4 countries. All of the data are reported in
FCFA per pound of cotton fiber. The fluctuations in the world price in FCFA terms are displayed clearly in
the figure; the variation in the local prices is less clear in the figure, given the smaller absolute range in
these data.
Oxfam America ׀Impacts of Reductions in US Cotton Subsidies on West African Cotton Producers 6Figure 2 indicates several important features of cotton price movements. First, since the middle
1990s the world market price of cotton has been on a downward path with considerable fluctuation from
year to year. Second, there is less fluctuation in the absolute price in Africa, although in percentage
terms there is also significant year-to-year fluctuation in many countries. Third, the C-4 prices tend
generally to move together, although the movements are not identical for all countries or for all years.
Fourth, there is considerable percentage variation in the farm price across countries. For example, in
2004 the price in Mali was over 200 FCFA per pound while the price in Benin reported in Figure 2 was
about 150 FCFA per pound, a difference of more than one-third of the Benin price. Finally, for our
purposes, an important relationship illustrated in Figure 2 is that prices in the African countries do not
follow the international price movements on a year-to-year basis. Nor do they follow international prices
with a clear, constant time lag. The ratio of the domestic farm price to the international price varies and
the absolute difference varies as well. No simple cost-based mark-up rule or simple cost-based price
transmission framework can account for these patterns in the data.
In the last decade of the data shown, the price of fiber at the farm gate ranged from about one-
third of the Cotton A-Index price at the border (about 150/450 from about 1995 to 1996) to more than half
from 2001 to 2004 (175/325). (See also Table 7 based on data though 2001.) The absolute differential
ranged from about 300 FCFA per pound in 1995/96 to about 150 FCFA per pound in 2001 to 2004.
These data may reflect a decline in the marketing margins with policy reforms in the late 1990s. They do
not provide strong empirical support for a high degree of short-run price transmission from the border
back to the farm.
However, these observed price linkages reflect mainly unanticipated and temporary changes in
market conditions, which the current marketing institutions in C-4 countries are expected to smooth out.
This evidence is not directly applicable to the policy questions we address in this paper. For our analysis,
we are considering the effects of a permanent and fully anticipated rise in the price of cotton on world
markets caused by modifications in the US subsidies for cotton. The system of negotiating smoothed
prices for growers based on long-term expected export prices does not preclude the transmission of price
changes in export prices that are expected to be permanent. Changes in US cotton subsidies are
expected to cause a fully anticipated shift in the long-term average level around which export prices
fluctuate. Such a change in the price regime would be transmitted to grower prices under the negotiated
price mechanism even while year-to-year export price fluctuations are not observed in the grower prices.
Figure 2 shows that even under the older and more rigid pricing schemes the major border price
changes in the middle 1990s were transmitted to growers in the form of substantial grower prices
increases over the subsequent two or three years. That price change was caused by a currency
devaluation that also caused increases in the costs of inputs in the marketing system so in that case the
farm price rose in proportion to the export market price (Figure 2).
Figure 2 shows that during the period 1985 to 1993 the export price was comparatively stable,
with the Cotlook A Index fluctuating around the value of 200 FCFA per pound of cotton fiber between a
minimum of 163 (1992) and a maximum of 263 (1989). Over the same period, the farm price in C-4
countries fluctuated around 100 FCFA per pound of cotton fiber, within a range of 86 to 118 FCFA per
pound but typically within a much smaller range than that. Over that period, the price ratio was close to
2:1 and the mark-up from farm to export was about 100 FCFA per pound. In 1994, the export price
jumped from 200 to over 500 FCFA per pound. The farm prices did not respond immediately, but over a
number of years they adjusted to a new equilibrium range. During the period 1998 to 2006, the export
price fluctuated between 280 and 407 FCFA per pound, averaging around 325 FCFA per pound, with a
general downward trend. Over the same period, the farm price in C-4 countries fluctuated around 200
FCFA per pound of cotton fiber, within a range of 172 to 216 FCFA per pound. Compared with the earlier
period, the export price increased by about 125 FCFA per pound while the farm price increased by about
100 FCFA per pound; about 80 percent of the export price increase was transmitted to farmers.
We use two alternative price transmission characterizations – 80 percent and 50 percent
transmission of per unit changes in export prices to per unit changes in farm prices for cotton fiber – to
conservatively reflect the potential price transmission of a fully anticipated and permanent increase in the
vii
average level of export prices cause by reductions in US cotton subsidies. In both cases we assume
Oxfam America ׀Impacts of Reductions in US Cotton Subsidies on West African Cotton Producers 7that only a portion of the export price becomes incorporated in the farm price, meaning that some of the
price increase is captured in marketing costs or profits of the marketing system.
An assumption that 80 percent of the export price change is transmitted to the cotton fiber price at
the farm is consistent with the observation that the bulk of the costs of the marketing system, trucks, fuel,
loading and unloading cost and similar charges, do not depend on the price of cotton. viii Of course, these
costs of marketing are affected by domestic price changes and by exchange rate movements when they
affect prices paid for marketing inputs such as fuel and equipment. Although farm prices may not vary
with export price within one season, this transmission model assumes that, after a few years, a clear and
permanent shift in the average level of export prices would be largely reflected in per unit market prices
for fiber at the farm. Under the alternative assumption, only 50 percent of a long-run, permanent change
in the export market price is transmitted to the fiber price at the farm, which implies that when export
prices increase significantly, returns to marketing firms increase substantially.
In the case of 80 percent transmission (which means that a 100 FCFA change in the export price
would be reflected as an 80 FCFA change in the farm price), the percentage change in the price of fiber
at the farm level is larger than the percentage change in the export price. This result reflects the
assumption that the price transmission percentage for these price changes is larger than the average
farm price of fiber as a share of export price. For the 50 percent price transmission the percentage
change in the farm price is smaller than the percentage change in the export price.
Implications of World Price Changes for Farm Prices, Production and Revenue
In Table 8 we translate the percentage changes in export prices from Table 4 into the currency of
the C-4 cotton exporters (FCFA). We start with a base price of 730 FCFA per kilogram of fiber, which is
consistent with current exchange rates and the forecasted prices for the 2007/2008 marketing year,
assuming no US policy change (FAPRI 2007). The alternative percentage changes in the export prices –
reflecting different assumptions about elasticities of supply response in the United States and the rest of
the world to world price movements – are then applied under two price transmission assumptions. The
50 percent price transmission is used to recognize the quite limited observed correlation between year-to-
year movements in the farm price relative to the world price from 1980 to 2006 as illustrated in Figure 2.
The 80 percent transmission recognizes the marketing cost calculations in Table 6 that applied to Benin
during the 2001/02 to 2003/04 seasons, and the longer-term linkages between general movements in the
farm price relative to the world price from 1980 to 2004 also as illustrated in Figure 2.
Table 9 translates the fiber prices at the farm into the price of unginned cotton, which is the price
received by farmers. Based on the data from Benin we assume that 42 percent of the weight of seed
cotton is fiber and so, given a base price of 440 FCFA per kg (60 percent of the export price), we use a
base farm price of seed cotton of 185 FCFA per kg (which is consistent with recent data). The gain to
farmers in seed cotton prices ranges from 9 FCFA per kg corresponding to the smallest world price
change of about 6 percent with 50 percent price transmission, to 35 FCFA per kg corresponding to a
world price change of about 14 percent with 80 percent price transmission.
Given the price changes for seed cotton at the farm we can also consider the supply response of
C-4 farmers to these improved market prices that they face. Information from Dr. Sunday Odjo suggests
considerable scope for cotton supply expansion exists in Benin, both in terms of shifting some land from
other crops and for adopting practices that improve on the very low yields that are currently obtained. Mr.
Odjo suggests that a value for the supply elasticity above 1.0 would be appropriate in this case of a long-
run adjustment to a permanent price increase (Odjo 2007). In addition, we note that cotton area and
production expanded rapidly in the region as opportunities expanded in the 1990s. We use a supply
elasticity of 1.0 to reflect this case of responsive supply to price incentives. An alternative view is that
growers maintain much of their cropland area for food crops to provide direct support for their families and
local markets. Expansion of area planted to cotton is limited by labor available at harvest and by capacity
of specialized equipment. Technology and technological knowledge is also limited, thus the means to
increase cotton production in response to higher prices is limited. We use a supply elasticity of 0.4 to
reflect this less-responsive case.
Oxfam America ׀Impacts of Reductions in US Cotton Subsidies on West African Cotton Producers 8Table 10 shows the quantity and farm revenue impacts in percentage terms from applying a
supply elasticity of 1.0 (panel a) and 0.4 (panel b) to the percentage changes in farm prices of seed
cotton reported in Table 9. With a supply elasticity of 1.0, the percentage change in quantity is equal to
the percentage change in price for seed cotton, and the percentage change in revenue is approximately
equal to the sum of the percentage change in quantity and the percentage change in price. Thus for farm
price increases in the range of 5 to 20 percent, farm revenue from cotton would increase by at least 10
percent, and possibly as much as 40 percent. With a smaller supply elasticity of 0.4, the percentage
change in quantity is 0.40 times the percentage change in price and the percentage change in revenue is
1.4 times the percentage change in price. In this case, for farm price increases in the range of 5 to 20
percent, farm revenue from cotton would increase by at least 7 percent, and possibly as much as 27
percent.
Effects of Changes in Cotton Prices on Cotton-Producing
Households
This section reviews the role of cotton revenue in family incomes and expenditures among cotton
producing households in the C-4 countries. Such a review will help us understand the implications of an
increase in revenue from cotton for cotton growing households in the C-4 countries.
Table 9 shows the effects of the alternative percentage changes in the export price on the change
in the price of seed cotton paid to farmers. The price changes range from 14 FCFA to 35 FCFA per kg
with price transmission of 80 percent and from 9 FCFA to 22 FCFA per kg with price transmission of 50
percent. In order to better understand the effects of these price changes on the well-being of farm
families we must explore their sources of income and expenditures. Minot and Daniels (2005) found that,
in the main cotton growing regions of Benin, cotton growers had yields of seed cotton of 1,084 kg per
hectare and the average cotton grower in their sample operated about 2.3 hectares of cotton. This
average size of cotton operation is higher than the average for all of Benin, which includes production
from regions less specialized in cotton production where farmers devote more attention to other crops.
Recent information, provided by Odjo (2007), shows a yield of 1,272 kg per hectare based on
information from ONS and yield of 1,500 kg per hectare based on data from FUPRO – ONS and FUPRO
are cotton marketing organizations in Benin (Table 11). Using a yield of 1,200 kg per hectare the
estimated price increases would generate additional net revenue per hectare in the range of 16,800
FCFA to 42,000 FCFA given a price transmission of 80 percent (a price increase of 14 to 35 FCFA);
additional net revenue per hectare in the range of 10,800 FCFA to 26,400 FCFA given price transmission
of 50 percent (a price increase of 9 to 22 FCFA).
The data in Table 2 show that national average cotton yields ranged from about 900 kg per
hectare to about 1,250 kg per hectare except in Chad where yields are lower. (The data in Table 2 are in
kilograms of fiber per hectare and can be converted to kilograms of seed cotton per hectare using the fact
that about 42 percent of the weight of seed cotton is fiber). In Table 2, national average yield data from
International Cotton Advisory Committee (ICAC) show average yields in the range of 1,000 kg per hectare
except in Chad where yields are about 700 kg per hectare. Table 1 shows that cotton operations are
larger in area in Mali and Burkina Faso than the average in Benin and Chad.
Based on the data of Minot and Daniels (2005), an average cotton farm in their sample in Benin
produces an average of 2.6 tons of cotton. This production per farm is also consistent with the average
yield of about 1,000 kg per hectare and about 2.6 hectares per farm in Mali and Burkina Faso (as
reported in Table 1 and Table 2). In the calculations below, we use 2.6 tons of seed cotton as a measure
of typical production from a farm that concentrates on cotton production in the C-4 region. We note that,
on average, operations in Benin are smaller, and in Chad cotton yields are lower. Furthermore
production per farm varies widely from year to year as yields vary with weather and market conditions.
Data in Table 11 show that about 40 percent of total cotton revenue on cotton farms is spent on
inputs purchased off the farm, such as fertilizer, insecticide and equipment, and fees paid by the farmers.
Given total cotton revenue of 480,000 FCFA per farm (185 FCFA/kg times 2,600 kg per farm) the off-farm
Oxfam America ׀Impacts of Reductions in US Cotton Subsidies on West African Cotton Producers 9costs are about 190,000 FCFA and the cotton returns about 290,000 FCFA per farm to the farm family for
value added by labor and land resources. If labor is hired from off the farm then the returns to the farm
family are lower yet.
Table 12 applies the increases in farm prices of seed cotton reported in Table 9 to cotton
production of 2.6 tons per farm to calculate the approximate increase in net cotton revenue per farm
resulting from the price increase. ix The gains range from 23,400 FCFA per cotton farm to 88,400 FCFA
per cotton farm. The gains from higher cotton prices – in the range of 23,400 to 88,400 FCFA per farm –
would add very significantly to cotton net revenue in the range of 290,000 FCFA per farm.
Data in Table 11 show mid-range fertilizer costs of about 37,500 per hectare. Thus the increase
in revenue from a modestly higher price of cotton would allow the typical farm in our illustration to
purchase the fertilizer for between about 0.6 hectares and 2.4 hectares of cotton land. They could also
use this added revenue to purchase fertilizer for their land that grows corn or millet, and improve yields.
Since fertilizer is often a major cash cost for many growers in Africa, improved productivity for cotton, and
especially for food crops, is an important potential contribution of higher cotton prices.
Table 12 also provides an assessment of the added cotton revenue as a share of household food
expenditures. Minot and Daniels (2005) found that expenditure per capita was 99,437 FCFA for cotton
farms and of this amount 57 percent was spent on food, implying per capita food expenditure of about
56,679 FCFA. Table 12 shows that the gain in income from the higher price of cotton could account for
the full annual food expenditure for between about 0.4 and 1.6 average individuals. Data from other
household surveys in the region confirm that households in the region are large, very poor and include
members across a range of ages. For example, in his 2000 survey of farm households in Burkina Faso,
Akresh reports average household size of about 11 members comprised of seven adults and four children
under the age of 18. (This is consistent with the Minot and Daniels survey, which found average
household size of about 10 members.) If a typical 11-member household is comprised of 7 adults and 4
children and we assume food consumption of a child is 50 percent of that of an adult, then the food
expenditure necessary for an adult is 62,977 FCFA and the food expenditure for a child is 31,488 FCFA
per year.
The data in Table 12 – gains in the range of 23,400 to 88,400 FCFA per farm from a modestly
higher world price (between 6 and 14 percent higher) – can be put into stark terms to illustrate their
importance. If we put these figures in terms of the resources to feed a child for a year, the gains from a 6
to 14 percent increase in the world price would provide enough resources to the family to maintain at
least one child for about 10 months of the year and up to three children for the full year. For a household
at the margin of subsistence, modest improvements in income from a higher price of cotton can
determine whether food is available or not. Alternatively, the higher price of cotton would allow a typical
household to add to the expenditures on food to improve the diet of all the children in the household
sufficient to maintain food consumption above the level of severe malnutrition or the margins of
starvation.
The total population of cotton-growing households in the C-4 numbers about 10 million people,
many of them children. The added revenue from an increased price of cotton would provide the
resources to feed at least one million children in cotton-growing households who would otherwise be
hungry. Of course, the added revenue received by cotton farmers may be used to meet many demands
other than food. This might include more access to rural schooling, improved health care or other
household expenditures. Some of the increased farm revenue may be allocated to improve farm
productivity through better inputs or technology to improve yields, or investments in equipment to reduce
labor bottlenecks in expanding cotton production. No single alternative will receive all the increase in
farm income from a higher price of cotton. The purpose of these illustrations is to illustrate the point that
even a modest world price increase that was filtered through imperfect price transmission would yield
significant and measurable improvements in the daily lives of some of the world’s poorest people. It is
important to recognize that, measured in terms of the consumption patterns of cotton farm families in the
C-4 region, a modestly higher price of cotton could save several children per family from malnutrition or
even starvation.
Oxfam America ׀Impacts of Reductions in US Cotton Subsidies on West African Cotton Producers 10Summary and Conclusion
The C-4 countries are significant in the world cotton market, but nevertheless they are price
takers and therefore face world market prices and policies of other countries that influence world market
prices. Cotton is important to the economies of the C-4 countries in aggregate, and especially important
to the poor in those countries who obtain a significant share of their employment and income from cotton.
Accordingly, if US policies have significant effects on world market prices for cotton, and those price
effects are transmitted through to farmers in C-4 countries, they will likely have disproportionately large
effects on the poor in those countries.
A number of questions must be addressed to determine the size and importance of the cost of US
cotton subsidies to cotton farming families in West Africa. First, what is the effect of the subsidies on the
world market price faced by exporters in C-4 countries? The answer to that question depends on a
number of factors, including parameters that couple US subsidies to US incentive prices, and elasticities
that connect incentive prices to output. Alston and Brunke (2006) estimated these effects with a range of
parameter values, and in this analysis we used their estimates based on comparatively conservative
assumptions about the extent to which subsidies are decoupled. Allowing for a range of supply
responses in the United States and in Africa to world price changes, elimination of US subsidies would
result in an increase in the world price for cotton of between 6 and 14 percent, in round figures.
A second question is: what would be the effect of a change in the export price of between 6 and
14 percent, as a result of elimination of US cotton subsidies, on prices received by C-4 cotton farmers?
The discussion above has documented the limited year-to-year transmission of movements of export
prices to movements in prices at the farm in the C-4 countries. Prices are negotiated based on farm costs
or are determined by the government before export prices are known, and thus cannot reflect current
export prices. On the other hand, the data on farm-to-port marketing costs and on longer-term price
relativities are consistent with a much higher rate of price transmission from the border to the farm for
more enduring changes in market conditions. Based on such information, a rate of price transmission of
80 percent or more would be applicable to the price effects from a permanent and fully anticipated
change in US policy; to be conservative we also applied a rate of price transmission of 50 percent. We
applied the different rates of price transmission to the given changes in the world price for cotton of
between 6 and 14 percent, and then converted proportional price changes at the farm for fiber to changes
per unit prices for seed cotton. The results imply that eliminating US cotton policies would result in
increases in farm prices of seed cotton ranging from 14 FCFA to 34 FCFA with price transmission of 80
percent and from 9 FCFA to 21 FCFA with price transmission of 50 percent.
A third and final question is: what would changes in farm prices of cotton in the range of 9 to 35
FCFA per kg mean for cotton farm households in the C-4 countries? Using 2.6 tons of seed cotton per
farm, price changes in this range would provide increases in gross and net income from cotton production
of between 23,400 and 88,400 FCFA per farm per year. This is a significant amount when compared with
net returns from cotton of 290,000 FCFA per farm per year. Using the average expenditure per
household (with about 10 members) of about 1 million FCFA found by Minot and Daniels (2005), the
additional income from removing US cotton subsidies would add between 2.3 percent and 8.8 percent to
the average expenditures of cotton producing households. The additional income per household is
equivalent to between 40 percent and 160 percent of the expenditure per capita on food, and as such
would be sufficient to support food expenditure for an additional 0.4 to 1.6 persons per household for
about one million households – in round terms, a million people. It could provide all of the food needed
for a much larger number of small children given their lower food requirements, and could provide
enhanced nutrition but only part of the food requirements for a much larger number again.
Oxfam America ׀Impacts of Reductions in US Cotton Subsidies on West African Cotton Producers 11List of Cited References, Additional Relevant Literature and
Annexes
Akiyama, T., J. Baffes, D.F. Larson, and P. Varangis. “Commodity Market Reform in Africa: Some Recent
Experience.” World Bank Policy Research Working Paper 2995, March 2003.
Akresh, R. “Flexibility of Household Structure: Child Fostering Decisions in Burkina Faso.” Unpublished
paper, Department of Economics, University of Illinois, May 2007.
Alston, J.M. and H. Brunke. “Impacts of Reductions in US Cotton Subsidies on the World Price of Cotton,
and Implications for West African Cotton Producers.” Report prepared for Oxfam, November 3,
2006.
Alston, J.M. and D.A. Sumner. “Perspectives on Farm Policy Reform.” Keynote Address, Western
Agricultural Economics Association Annual Meeting, Anchorage, Alaska, June 28-30, 2006.
Anderson, K. and E. Valenzuela. “The WTO’s Doha Cotton Initiative: A Tale of Two Issues”, Mimeo,
World Bank, Washington DC, February 2006.
Babcock, B.A., J.C. Beghin, J.F. Fabiosa, S. De Cara, A. El-Obeid, C. Fang, C.E. Hart, M. Isik, H.
Matthey, A.E. Saak, K. Kovarik, and FAPRI Staff. Doha Round of the World Trade Organization:
Appraising Further Liberalization of Agricultural Markets, November 2002. 02-WP 317.
Badiane, O., D. Ghura, L. Goreux and P. Masson. “Cotton Sector Strategies in West and Central Africa.”
World Bank Policy Research Working Paper 2867, July 2002.
Baffes, J. “Cotton and Developing Countries: A Case Study in Policy Incoherence.” World Bank Trade
Note 10, Washington DC, 10 September 2003.
http://siteresources.worldbank.org/INTRANETTRADE/Resources/TradeNote10.pdf
Baffes, J. “Cotton: Market Setting, Trade Policies, and Issues.” World Bank Policy Research Working
Paper 3218, Washington DC, February 2004.
Baffes, J. “The Cotton Problem.” World Bank Research Observer. 20 (1): 109-144, 2005. Available at:
http://wbro.oxfordjournals.org/cgi/reprint/20/1/109
Crole-Rees, Anna et Bio Goura Soule. “Secteur cotonnier du Bénin : Mécanisme de formation des prix
du coton-graine et des intrants.” Crole-Rees Consultants and LARES. Volume I : rapport principal.
Claassen, R.. “Farm Bill Side by Side: Conservation Programs, Details and Analysis,” US Department of
Agriculture, Economic Research Service, Web Product,
http://www.ers.usda.gov/features/farmbill/analysis/conservationoverview.html, May 2002.
Elbehri, A. and S. MacDonald. “Estimating the Impact of Transgenic Bt Cotton on West and Central
Africa: A General Equilibrium Approach.” World Development 32(12): 2049–2064, 2004
Fadiga, M., L.S. Mohanty and S. Pan. “The Impacts of US and European Union Cotton Programs on the
West and Central African Countries Cotton Export Earnings.” Presented at the American
Agricultural Economics Association Annual Meeting, Denver, 1-3 August, 2004.
http://agecon.lib.umn.edu/cgi-bin/pdf_view.pl?paperid=14572.
Fang, C. and B.A. Babcock. China's Cotton Policy and the Impact of China's WTO Accession and Bt
Cotton Adoption on the Chinese and US Cotton Sectors. January 2003. 03-WP 322.
Oxfam America ׀Impacts of Reductions in US Cotton Subsidies on West African Cotton Producers 12FAO. “The Impact of Cotton Sector Support on Developing Countries: A Guide to Contemporary
Analyses.” Mimeo, Food and Agriculture Organization, Rome, September 2004.
FAPRI. “The Doha Round of the World Trade Organization: Appraising Further Liberalization of
Agricultural Markets.” Working Paper 02-WP 317, Food and Agricultural Policy Research
Institute, Ames, Iowa State University, 2002.
FAPRI. Agricultural Outlook, 2002. Accessed May, 2007. Available at:
http://www.fapri.iastate.edu/outlook2002/.
FAPRI. Agricultural Outlook, 2006. Accessed May, 2007. Available at:
http://www.fapri.iastate.edu/pubs/outlook.html.
FAPRI. Agricultural Outlook, 2007. Accessed May, 2007. Available at:
http://www.fapri.iastate.edu/outlook2007/.
Gillson, I., C. Poulton, K. Balcombe and S. Page. Understanding the Impact of Cotton Subsidies on
Developing Countries. ODI Background Report, Overseas Development Institute, May 2004.
http://www.odi.org.uk/publications/cotton_report/cotton_report.pdf
Goodwin, B.K. and A.K. Mishra. “Another Look at Decoupling: Additional Evidence on the Production
Effects of Direct Payments.” American Journal of Agricultural Economics 87(5), December 2005.
Goodwin, B.K.and A.K. Mishra. “Are Decoupled Farm Payments Really Decoupled? An Empirical
Evaluation.” American Journal of Agricultural Economics 88(1), February 2006 pp. 73-88.
Goreux, L. “Prejudice Caused by Industrialised Countries Subsidies to Cotton Sectors in Western and
Central Africa: Background Document to the Submission Made by Benin, Burkina Faso, Chad
and Mali to the WTO.” TN/AG/GEN/4, Geneva: World Trade Organization, June 2003.
Goreaux, L. “Cut Subsidies, beware diversionary tactics and don’t miss the Hong Kong window of
opportunity.” In Eric Hazzard Editor. International Trade Negotiations and Poverty Reduction: The
White Paper on Cotton. Occasional Paper Number 249. Dakar 2005.
http://www.ictsd.org/ministerial/hongkong/docs/cotton_book_en.pdf
Harmsen, R. “The Cotton Sector Reform in Benin and the Subsidies by Major Producing Countries.” IMF
Country Report No. 04/370, Benin: Selected Issues and Statistical Appendix, Section II.
International Monetary Fund November 2004.
Hennessy, D. “The Production Effects of Agricultural Income Support Policies Under Uncertainty,”
American Journal of Agricultural Economics. 80 (February 1998): 46-57.
ICAC. “Production and Trade Policies Affecting the Cotton Industry.” International Cotton Advisory
Committee, Washington DC, 2002. Available at
http://www.icac.org/icac/Meetings/cgtn_conf/documents/icac_ccgtn_report.pdf
ICAC. “Production and Trade Policies Affecting the Cotton Industry.” International Cotton Advisory
Committee Standing Committee, Attachment 1 to SC-N-473, Washington DC. 18 May 2004.
ICAC. Statistics Division. “Cotton Producer Price Data for Benin, Burkina Faso, Mali, Chad.” Accessed
May 2007.
ILEAP. “Legal Issues in Relation to Financial Compensation under the Cotton Initiative.” International
Lawyers and Economists Against Poverty, 2004. Available at
http://www.fao.org/es/ESC/en/20953/22215/highlight_47647en.html
Oxfam America ׀Impacts of Reductions in US Cotton Subsidies on West African Cotton Producers 13You can also read