Polar and non-polar components in Fast Pyrolysis Bio-Oil in relation to REACH registration - June 2021 IEA Bioenergy: Task XX Month Year xxxx: xx
←
→
Page content transcription
If your browser does not render page correctly, please read the page content below

Polar and non-polar components in
Fast Pyrolysis Bio-Oil in relation to
        REACH registration.

                 June 2021

           IEA Bioenergy: Task XX
                Month Year
                  xxxx: xx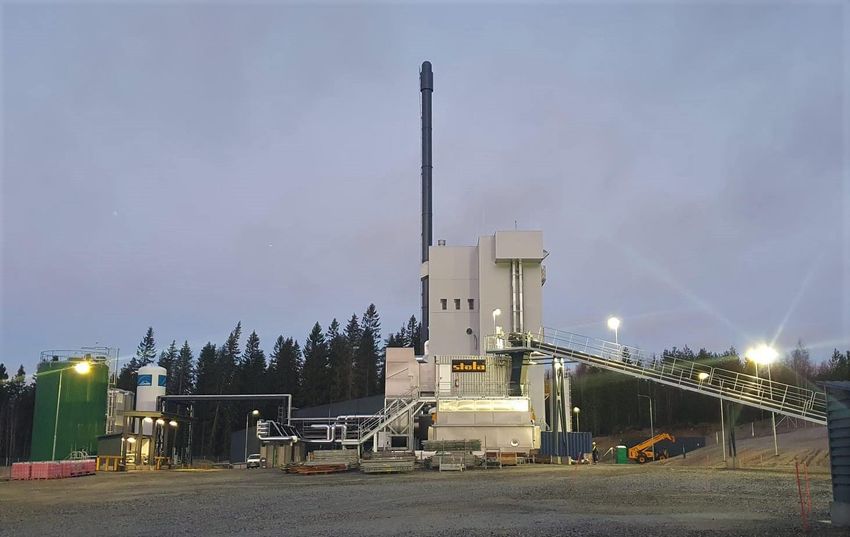
Polar and non-polar components in Fast Pyrolysis
                          Bio-Oil in relation to REACH registration.

                    Bert van de Beld, Evert Leijenhorst, Hans Heeres – BTG Biomass Technology
                                            Group BV, The Netherlands

                                                   Anja Oasmaa, Taina Ohra-aho, VTT Finland

                 Copyright © 2021 IEA Bioenergy. All rights Reserved

                 ISBN, if applicable, here

                 Published by IEA Bioenergy

The IEA Bioenergy Technology Collaboration Programme (TCP) is organised under the auspices of the International Energy Agency (IEA) but is functionally and legally autonomous.
Views, findings and publications of the IEA Bioenergy TCP do not necessarily represent the views or policies of the IEA Secretariat or its individual member countries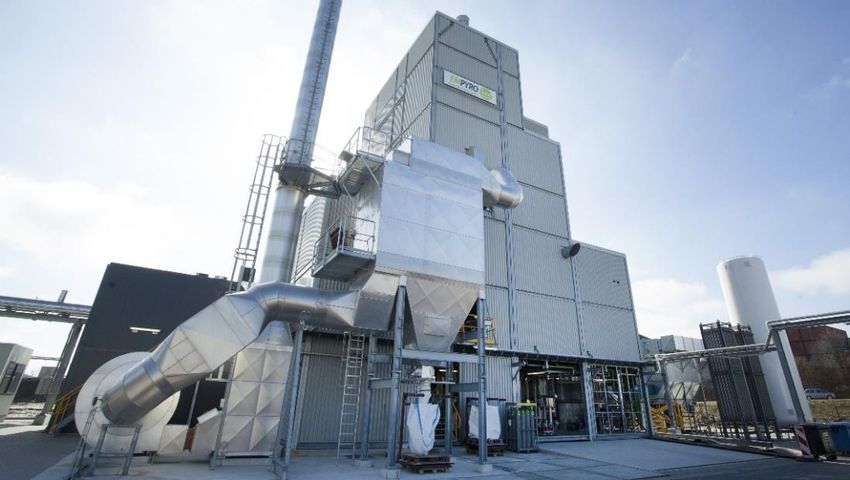
PREFACE
One of the objectives of IEA Task 34 is to facilitate commercial deployment of Direct Thermochemical
Liquefaction technologies. Fast pyrolysis is maturing, and significant amounts of pyrolysis oil are
introduced on the European market. Consequently, registration in the European REACH system is
required, demanding dedicated chemical analyses and expertise. Both VTT and BTG are already
active in the fast pyrolysis field for a long time, and in several projects, attention was given to REACH
related issues. Therefore, it was decided to have a dedicated effort within IEA-Task 34 to combine
and share the experiences of VTT and BTG on this subject which is expected to be beneficial for
producers, end-users, project developers and researchers in this field. Additionally, a scientific paper
will be prepared focusing specifically on the analysis of aldehydes.

                                                                                                       1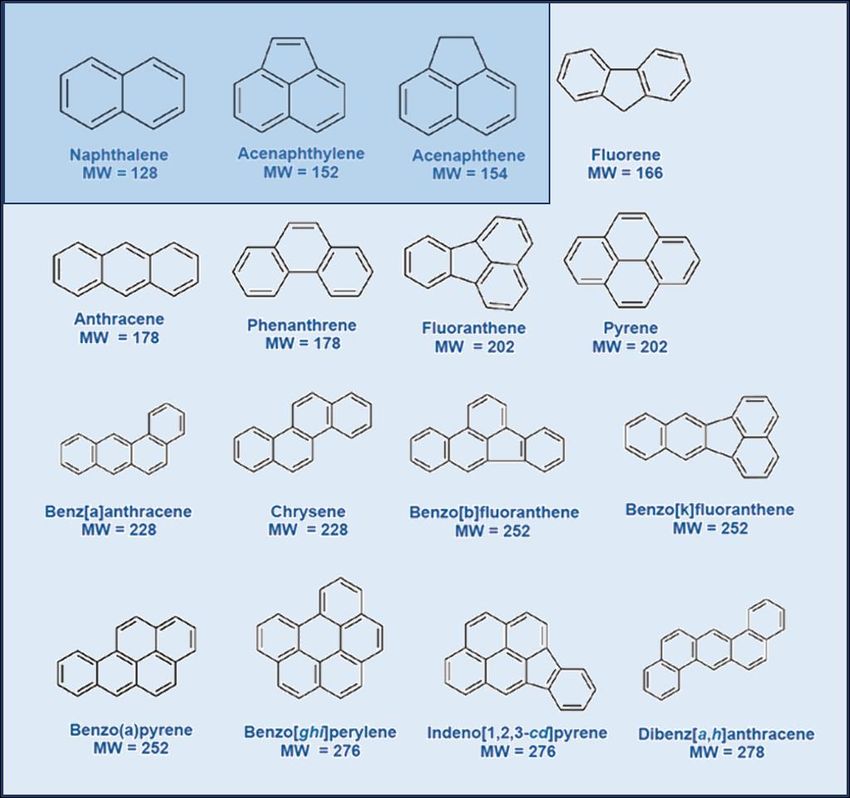
2
SUMMARY
Fast pyrolysis bio-oil (FPBO) is entering the European market and estimated production capacity will
exceed 100 million litres in 2021 with individual production capacities of well above 10 kton/year.
So-called REACH registration is mandatory.

REACH stands for Registration, Evaluation, Authorisation and Restriction of Chemicals. It is the
European system aiming to protect human health and the environment through the better and earlier
identification of the intrinsic properties of chemical substances. In 2013 a FPBO registration dossier
was submitted to ECHA (European Chemicals Agency). In the dossier FPBO is classified as a UVCB, i.e.
a product with Unknown or Variable composition, Complex reaction products or Biological materials.
The registration is valid for FPBO produced by fast pyrolysis from lignocellulosic biomass and is
characterized by its chemical and physical properties. In addition, specific restrictions are given on
the concentrations of some polar and non-polar compounds. This report focusses on the analyses of
these compounds.

The polar compounds considered are formaldehyde, acetaldehyde, methanol, furfural, phenol and
cresol. Different analysis methods have been applied by VTT, University of Groningen (RUG) and BTG
to measure the concentrations of these compounds in FPBOs of different origin or post-treated in
different ways. Taking into account the complexity of measuring individual components in FPBO the
agreement between the measuring methods is acceptable. Formaldehyde cannot be measured
directly as it is in chemical equilibrium with methylene glycol. The actual concentration is calculated
using the equilibrium constant and the sum of concentration of formaldehyde and methylene glycol.
Additionally, the formaldehyde concentration in the atmosphere around fast pyrolysis units was
measured. Under normal working conditions and proper pre-cautions, the formaldehyde
concentration is always well below legal exposure limits.

The specific non-polar compounds in FPBO refer to the poly-aromatic hydrocarbons (PAHs) and more
in particular the EPA PAH13. The starting point were the different analysis methods known from
literature for measuring PAHs in FPBO. RUG & BTG have evaluated these methods and further
improved them. A specific challenge is to avoid the co-extraction of phenolic compounds as it gives
overlapping peaks in the subsequent analysis resulting in false PAH values. Some variation in results
is observed, but in all cases the total PAH13 content is well below the limit of 35 ppm as given in the
Reach registration for FPBO.

Summarizing, the analysis methods have successfully been developed or improved. Based on analysis
of FPBOs from different biomass resources it appears that generally FPBOs can comply with the
specifications and limits given in the FPBO REACH dossier.

                                                                                                     3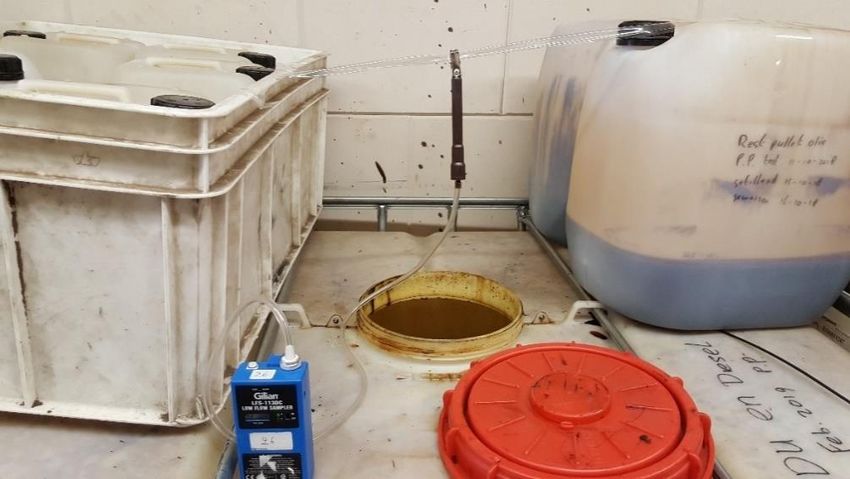
Index
  Preface ............................................................................................................ 1
  Summary .......................................................................................................... 3
  List of Figures .................................................................................................... 5
  list of Tables ..................................................................................................... 5
  List of abbreviations ............................................................................................ 6
Introduction ........................................................................................................ 7
    REACH registration of fast pyrolysis oil .................................................................... 7
Status of commercial implementation of fast pyrolysis in Europe ........................................ 10
    Fast pyrolysis ................................................................................................ 10
    Fast pyrolysis processes .................................................................................... 10
    Production plants in Europe ............................................................................... 10
Polar compounds in FPBO ....................................................................................... 13
  Furfural ......................................................................................................... 13
  Methanol ........................................................................................................ 15
  Acetaldehyde .................................................................................................. 16
  Phenol & Cresol ................................................................................................ 18
  Formaldehyde .................................................................................................. 19
  Formaldehyde in the vapour phase ......................................................................... 26
Non-Polar compounds in FPBO ................................................................................. 29
  Poly Aromatic Hydrocarbons (PAH) ......................................................................... 29
  PAH’s toxicity and regulations ............................................................................... 29
  PAH’s analysis .................................................................................................. 30
  Experimental analysis work .................................................................................. 31
  Results .......................................................................................................... 33
Conclusions ....................................................................................................... 36
  Acknowledgements ............................................................................................ 36

                                                                                                                      4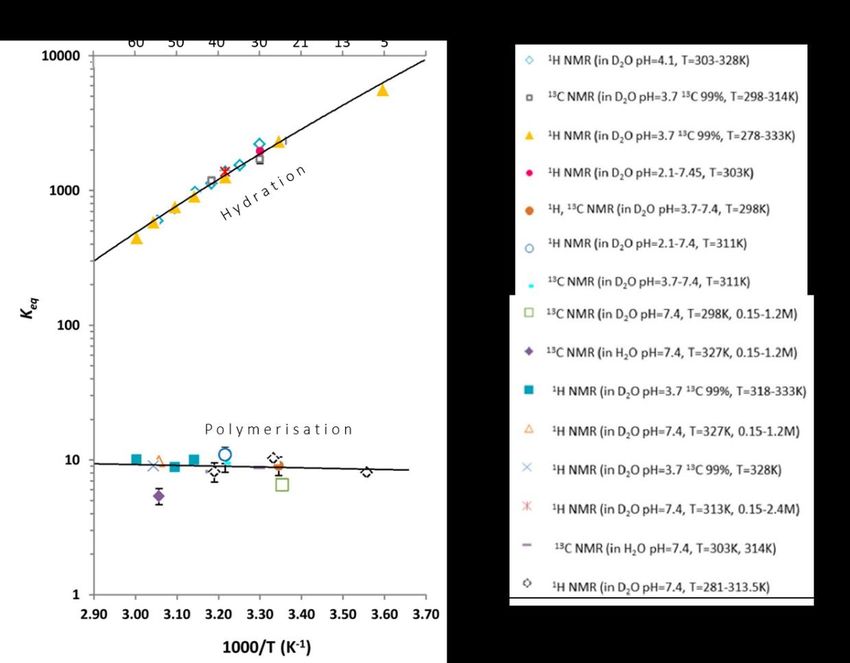
LIST OF FIGURES
Fig. 1: Integrated fast pyrolysis plant in Joensuu, Finland. ............................................... 10
Fig. 2: The Empyro fast pyrolysis plant in Hengelo, the Netherlands. ................................... 11
Fig. 3: GFN plant in Lieksa - Finland .......................................................................... 12
Fig. 4: Polar compounds identified in the FPBO-SIP ........................................................ 13
Fig. 5: A typical chromatogram of the furfural (in FPBO) analysis applying the RuG method ........ 15
Fig. 6: A typical chromatogram of the MeOH (in FPBO) analysis applying the RuG method .......... 16
Fig. 7: A typical chromatogram of the acetaldehyde (in FPBO) analysis applying the RuG method . 17
Fig. 8: A typical chromatogram of the phenolics (in FPBO) analysis applying the RuG method ...... 19
Fig. 9: Formaldehyde equilibria in water and gas phase ................................................... 20
Fig. 10: Equilibrium data for FA-MG equilibrium (blue solid line) compared to literature data, and
experimental data (red solid line). ........................................................................... 21
Fig. 11: Formaldehyde hydration and dimerization equilibrium constant as a function of the
temperature and for varying pH (range 2.1 – 7.4) .......................................................... 22
Fig. 12: DNPH derivatization of formaldehyde and methylene glycol .................................... 23
Fig. 13: Formaldehyde measurement from the gas phase ................................................. 26
Fig. 14: photograph of formaldehyde measurement in the gas phase ‘worst-case scenario 1’ ....... 27
Fig. 15: photograph of formaldehyde measurement in the gas phase ‘worst-case scenario 3’ ....... 27
Fig. 16: Chemical structure of the PAH16 compounds. In PAH13 napthalene, acenapthalene and
acenapthene are excluded. .................................................................................... 30

LIST OF TABLES
Table 1: The FPBO - SIP profile .................................................................................. 8
Table 2: Properties & composition of FPBO. ................................................................... 8
Table 3: Results of the furfural analysis ...................................................................... 14
Table 4: Results of the methanol analysis.................................................................... 16
Table 5: Results of the acetaldehyde analysis ............................................................... 17
Table 6: Results of the acetaldehyde analysis; Concentrations in ppm. ................................. 18
Table 7: Experimental results of the mini Round Robin by RUG and VTT ............................... 24
Table 8: Formaldehyde hydration chemical equilibrium constants for different equilibrium
temperatures based on Fig. 10 & Fig. 11. .................................................................... 25
Table 9: Minimum and maximum formaldehyde concentrations in FPBO calculated from RuG analysis
data ................................................................................................................ 25
Table 10: Minimum and maximum formaldehyde concentrations in FPBO calculated from VTT
analysis data ...................................................................................................... 25
Table 11: Minimum and maximum formaldehyde concentrations in FPBO calculated from BTG
analysis data ...................................................................................................... 25
Table 12: Results of the dedicated formaldehyde measurements for three employees during a
normal working day ............................................................................................. 27
Table 13: Results of the ‘worst-case’ scenarios to determine the presence of formaldehyde in the
gas phase. ......................................................................................................... 28
Table 14: Recovery of PAH’s, GCMS2 method (RUG) ....................................................... 32
Table 15: Analysis performed of different samples and methods ........................................ 35

                                                                                                                      5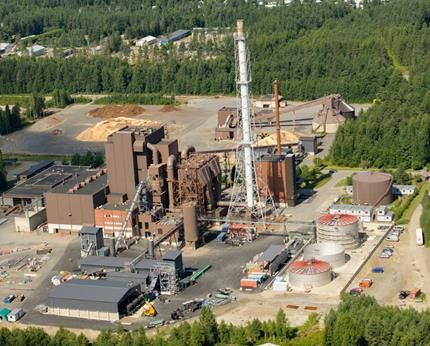
LIST OF ABBREVIATIONS
BTG        Biomass technology Group BV
DNPH       2,4-Dinitrophenylhydrazine
PFBHA      2,3,4,5,6-Pentafluorobenzyl)-hydroxylamine
DNPH-FA    DNPH formaldehyde complex
EPA        Environmental Protection Agency
FA         Formaldehyde
FAMG       Sum of formaldehyde and Methylene Glycol
FID        Flame Ionization Detector
FPBO       Fast Pyrolysis Bio-Oil
GC-ECD     Gas Chromatography – Electron Capture Detector
HF         Hemiformal
Keq        Equilibrium constant
ME         Methanol
MG         Methylene Glycol
MGn        Methylene Glycol oligomers (n=2-8)
SIP        Substance Identification Profile
W          Water
FID        Flame Ionization Detector
FPBO       Fast Pyrolysis Bio-oil
GC         Gas chromatography
HPLC       High-performance liquid chromatography
JD         Joint Dossier
MS         Mass Spectrometry
PAH        Poly Aromatic Hydrocarbon
REACH      Registration, Evaluation, Authorization and restriction of Chemicals
RRF        Relative Response Factors
RuG        Rijksuniversiteit Groningen
SIM        Single Ion Monitoring
SIP        Substance Identity Profile
UV         Ultra Violet
UVCB       Unknown or Variable composition, Complex reaction products or Biological
           materials
VF         Volumetric Flask
VTT        Teknologian Tutkimuskeskus VTT Oy – Technical Research Centre of Finland

                                                                                      6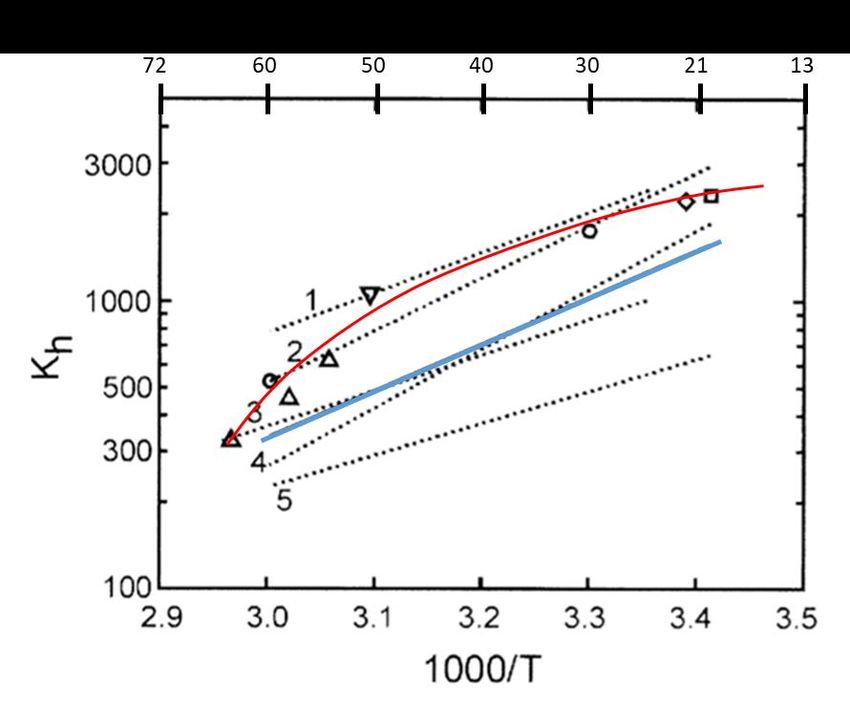
Introduction
REACH is the European system aiming to protect human health and the environment through the
better and earlier identification of the intrinsic properties of chemical substances. REACH stands for
Registration, Evaluation, Authorisation and Restriction of Chemicals. To comply with the regulation,
companies must identify and manage the risks linked to the substances they manufacture and/or
place on the market in the EU. All substances produced or imported in the European Union in
quantities above 1 t/y will be obligated for registration in REACH.

Proper registration of products is of crucial importance for the implementation and
commercialization of any technology, and therefore also relevant for fast pyrolysis of biomass. IEA
Bioenergy Task 34 was very active to provide data needed for REACH registration. 1 In 2013 a ‘FPBO
REACH consortium’ –led by Fortum and Linnunmaa from Finland- was established, with the goal of
obtaining the REACH registration for FPBO at the ECHA (European Chemicals Agency). A joint dossier
was submitted late 2013.

REACH registration of fast pyrolysis oil
The total capacity of the current European fast pyrolysis plants (see next chapter) is about 15 t/h
FPBO exceeding 100 million litres of FPBO annually, and the products are applied commercially.
Production capacity of a single production plant exceeds 10,000 t/y.

FPBO is recognized as a 2nd generation advanced biofuel or intermediate energy carrier. However, it
is completely different from conventional fossil fuels both in its physical properties and chemical
composition.

Due to the nature and properties of FPBO a dedicated REACH registration is required, and first of all
the product must be defined in a so-called Substance Identity Profile (SIP) to distinguish this product
from any other product in REACH. The FPBO SIP profile is given in Table 1; specific information on
the properties and composition are given in Table 2.2

1
  Bridgwater, A.; Czernik, S.; Diebold, J.; Meier, D.; Oasmaa, A.; Peacocke, C.; Piskorz, J.; Radlein,
D. (eds.) Fast Pyrolysis of Biomass – A Handbook. Published in the UK by CPL Press: Aston University,
Bioenergy Research Group, 1999. ISBN: 1 872691 07.
2
  Oasmaa, A., Van De Beld, B., Saari, P., Elliott, D. C. & Solantausta, Y. Norms, standards, and
legislation for fast pyrolysis bio-oils from lignocellulosic biomass. Energy and Fuels 29, 2471–2484
(2015).

                                                                                                     7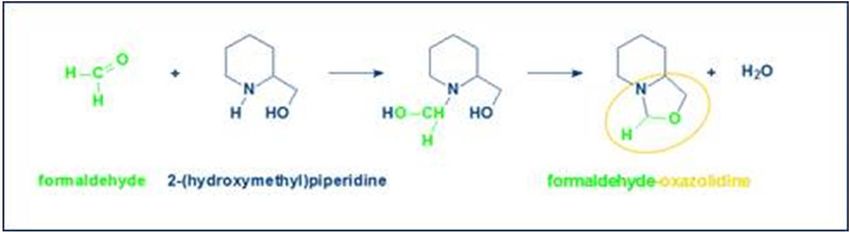
Table 1: The FPBO - SIP profile

    SIP profile Fast Pyrolysis Bio-Oil
    EC name               Fast Pyrolysis Bio-oil
    EC number             692-061-0
    CAS name              Fast Pyrolysis Bio-oil
    CAS number            1207435-39-9
    IUPAC name            Fast Pyrolysis Bio-oil
    Public name           Fast Pyrolysis Bio-oil
    Origin                Fast pyrolysis of lignocellulosic biomass
    Definition            Liquid condensate recovered by thermal treatment of lignocellulosic
                          biomass, at short hot vapor residence time (typically less than about 10
                          seconds) typically at between 450-600°C at near atmospheric pressure or
                          below, in the absence of oxygen.

Table 2: Properties & composition of FPBO.

    Properties and composition of Fast Pyrolysis Bio-oil
    pH                                                    >2 – 3.5
    Water content                                         < 40 ww %
    Ash content                                           < 0.5 ww %
    Solids content                                        < 5.0 ww %
    Viscosity (40°C)                                      < 200 mm2/s
    Density                                               1.1 – 1.3 kg/L
    Organic compounds
    Polar components
    Formaldehyde                                          < 0.5 ww %
    Methanol                                              < 3 ww %
    Non-polar components
    PAH13a                                                < 35 ppm (0.0035 ww%)
    Bentso[a]Pyrene                                       < 0.01 ww % (100 ppm)
    dibenz[a,h]anthracene                                 < 0.01 ww % (100 ppm)
    Sum of Carc. 1B classified   substancesb              < 0.1 ww % (1,000 ppm)
    Sum of Carc. 2 classified substancesb                 < 1.0 ww % (10,000 ppm)
a sum PAH13: Anthracene, Benz[a]anthracene, Benzo[a]pyrene, Benzo[a]fluoranthene, Benzo[k]fluoranthene,
Benzoperylene, Chrysene, Dibenz[a,h]anthracene, Fluorene, Fluoranthene, Indenopyrene, Phenantrene,
Pyrene
b Carc. 1B classified substances (Annex VI of CLP regulation 1272/2008): e.g. of sum PAH13:

Benz[a]anthracene, Benzo[a]pyrene, Benzo[k]fluoranthene, Chrysene, Dibenz[a,h]anthracene
c Carc. 2 classified substances (Annex VI of CLP regulation 1272/2008): e.g. Formaldehyde, acetaldehyde,

Furfural

                                                                                                           8
FPBO is classified as a so-called UVCB (Unknown or Variable composition, Complex reaction products
or biological materials). General characteristics of FPBO are given like water content, pH, viscosity,
and density. The range is rather broad, and normally the pyrolysis oil from a wide range of
technologies and lignocellulosic biomass feedstock will be covered. Analytical methods for these
properties are well established, and a.o. validated in IEA Round Robin studies.3
In addition to these general properties, specifications are included on the content of certain polar
and non-polar compounds. The polar compounds include formaldehyde, acetaldehyde, phenol,
furfural, methanol and cresol. The non-polar compounds mainly concern poly-aromatic compounds
(PAH13/PAH16). Specific limits are included for Bentso[a]pyrene and dibenz[a.h]anthracene, but the
allowable content is higher than the total allowable PAH13 content (including the two previous
compounds) and the relevance is unclear.
Additionally, the analysis methods for these organic components in fast pyrolysis oil were not well
developed and validated whereas it is known that standard existing analysis techniques are often not
appropriate for FPBO analysis. In the next chapters the analysis of the polar and non-polar compounds
in FPBO will be evaluated in more detail. But first a brief overview of full-scale, European FPBO
production plants is given.
3
Oasmaa, A., Lehto, J., Solantausta, Y. & Kallio, S. Historical Review on VTT Fast Pyrolysis Bio-oil
Production and Upgrading. Energy and Fuels (2021) doi:10.1021/acs.energyfuels.1c00177.
9Status of commercial implementation of fast pyrolysis in Europe
In this chapter the fast pyrolysis process will be briefly described, and subsequently commercial
production facilities in Europe exceeding 1 t/y of FPBO are identified.
Fast pyrolysis
Fast pyrolysis is a process in which organic materials are rapidly heated to 450 - 600 °C in absence of
air. Under these conditions, organic vapours, permanent gases and charcoal are produced. The
vapours are then quickly condensed to fast pyrolysis bio-oil (FPBO). Typically, 50-75 wt.% of the
feedstock can be converted into fast pyrolysis bio-oil (FPBO). Pyrolysis enables the transformation of
difficult-to-handle solid biomass of different nature into a clean and uniform liquid. Its energy density
is four to five times higher than that of the original solid material, which offers important logistic
advantages.
Fast pyrolysis processes
Various reactor technologies have been developed for the fast pyrolysis of biomass. The crucial
element in the pyrolysis process is to rapidly heat the biomass to maximize the production of organic
vapours. These vapours need to be quenched rapidly as well to minimize losses by thermal cracking
and polymerisation reactions. As a result, heat transfer is a very important aspect in the process
development. Biomass materials typically exhibit relatively poor heat conductivity, which means the
biomass must be fed to the reactor in small particles to allow for rapid heating. Well-known reactor
technologies are based on fluidized bed reactors, the rotating cone reactor, twin-screw mix reactor
and ablative systems, but only the first two are currently applied commercially.
Production plants in Europe
Savon Voima – Joensuu - Finland
The integrated fast pyrolysis plant in Joensuu is based on VTT’s patented technology. 4 The plant was
built in 2013 by Fortum and in 2019 acquired by Savon Voima -a Finnish energy company. The patented
technology concerns the integration
of a fluidized bed fast pyrolysis
process producing FPBO to an
existing fluidized bed boiler
combined heat and power (CHP)
plant. The purpose of integrating
FPBO production into a fluidized
bed boiler is to increase overall
energy efficiency and profitability
and to decrease the production
costs of the bio-oil. In the
integrated fast pyrolysis concept
hot sand from the fluidized bed
boiler is used for heating the fast
pyrolysis reactor. Simultaneously,
fast pyrolysis process by-products Fig. 1: Integrated fast pyrolysis plant in Joensuu, Finland.
4
Solantausta, Y.; Oasmaa, A.; Sipilä, K.; Lindfors, C.; Lehto, J.; Autio, J.; Jokela, P.; Alin, J.
Heiskanen, J. Bio-oil production from biomass: Steps toward demonstration. Energy & Fuels 2012,
26, 1, 233-240. https://doi.org/10.1021/ef201109t.
10such as char and non-condensable gases are cofired in the CHP boiler together with the primary forest
residue boiler fuel.
The plant in Joensuu has an hourly biomass intake of around 10 t/h and annual FPBO design capacity
is 50,000 ton. The FPBO product is stored on-site and can be used as peak fuel in the heating season.
EMPYRO – Hengelo – The Netherlands
The Empyro fast pyrolysis plant in Hengelo (the Netherlands) is based on BTG-BTL’s patented
technology. The plant was built in 2014 by a consortium led by BTG-BTL. In 2019 the plant was
acquired by Twence, a Dutch biomass and waste recycling company.
The process includes fast heating of biomass followed by rapid condensation of the vapours produced.
The original reactor concept is based on the so-called rotating cone. In this reactor biomass particles
at room temperature and hot sand particles are intensively mixed in the reactor resulting in rapid
heating and a quick release of organic vapours. The produced vapours pass through several cyclones
before entering the condenser, in which the vapours are quenched by re-circulated oil. The pyrolysis
reactor is integrated in a circulating sand system composed of a riser, a fluidized bed char combustor,
the pyrolysis reactor, and a down-comer. In this concept, char is burned with air to provide the heat
required for the pyrolysis process. Oil is the main product; non-condensable pyrolysis gases are
combusted and can be used e.g. to generate additional steam.
The Empyro plant has a design capacity of 25 MW (biomass input) and produces 3.2 t FPBO per hour
(~20 kton/y). Besides pyrolysis oil steam and electricity is generated and the plant is self-sustaining.
The pyrolysis oil is used as boiler fuel by FrieslandCampina 5.
Fig. 2: The Empyro fast pyrolysis plant in Hengelo, the Netherlands.
5
Industrial Process Heat: case study 3: Process steam in a dairy factory via fast pyrolysis bio-oil, Contribution
of Task 34 to the intertask project on industrial heat, September 2020, Bert van de Beld and Ardy Toussaint, IEA
Bioenergy.
11Green Fuel Nordic (GFN) – Lieksa - Finland
The GFN-Lieksa plant in Lieska (Finland) is also based on BTG-BTL technology. The plant was
implemented and commissioned in 2020 by Green Fuel Nordic oy (GFN) -a Finnish biorefinery
company. The feedstock is sawdust from the nearby sawmill and the design capacity is 3.2 t/h
pyrolysis oil. The FPBO is used for a.o. replacing heating oils.
Fig. 3: GFN plant in Lieksa - Finland
Pyrocell – Gävle - Sweden
The Pyrocell plant in Gävle (Sweden) is based on BTG-BTL technology. The plant is implemented by
Pyrocell- a joint venture of Setra and Preem. The feedstock will be sawdust from the sawmill and
the production capacity is 3.3 t/h of FPBO. The FPBO will be used at the Preem refinery in Lysekil.
Commissioning and start-up is expected in Q3/Q4 2021.
12Polar compounds in FPBO
The relevant polar compounds identified in the FPBO-SIP are formaldehyde, acetaldehyde, phenol,
furfural, methanol, and cresol. Due to the extreme complexity of FPBO, straightforward analysis
techniques and methods are not always applicable. The polar compounds considered are shown in
Fig. 4.
Fig. 4: Polar compounds identified in the FPBO-SIP
In a mini Round Robin, RuG and VTT tested five FPBO samples of different origin. An aged clean wood
FPBO was tested because storage time can have a large influence on the concentration of the polar
compounds (reacting away in time). Furthermore, a freshly produced clean wood FPBO, a wood FPBO
in which a large part of the water was removed, a miscanthus-derived FPBO and a bark-derived FPBO
were also tested. The FPBO with reduced water content, was the fresh clean wood oil treated in an
evaporator under vacuum. Due to the low boiling points of formaldehyde (BP=-19 °C), acetaldehyde
(BP=20 °C) and Methanol (BP=65 °C) it is likely that besides water also these components will be
(partly) removed, and lower concentrations are to be expected.
In this section, the analysis of the polar compounds is described applying multiple modified methods
developed and tested by the RuG, BTG and VTT.
FURFURAL
Furfural can be found in FPBO as a pyrolysis product, it is produced by the acid catalyzed dehydration
of the C5 sugars present in the hemi-cellulose during pyrolysis.
RuG method
The method used by the RuG is based on HPLC (Agilent 1200 series, VWD) applying a Biorad Aminex
HPX-87H (300 mm × 7.8 mm, 9 µm particles) column and the NREL/TP-510-42623 method. Preparatory
to analysis, the FPBO needs to be water extracted. Extraction is performed by adding 1 part of well
homogenized FPBO drop by drop to 8 parts of water using a syringe with needle into a sample flask.
During the addition of FPBO to the water, the whole is stirred by a magnetic stirrer. After FPBO
addition, the sample flask is closed and stirred for another 2h. Subsequently the extract is filtered
by using a PTFE syringe filter (0.2 µm). A 6-point furfural calibration series (in H2O) is prepared in a
concentration range of 25-250 mg/kg and measured. Subsequently the FPBO sample is filtered (0.2
13µm PTFE filter) and measured in triplicate. The areas vs. concentration of the calibration points are
plotted and the concentration of furfural in the FPBO can then be obtained by extrapolating the
furfural area and correcting for the dilution factor.
VTT method 1 (used for Furfural, Acetaldehyde & Formaldehyde)
The furfural, acetaldehyde and formaldehyde content were determined by using static headspace
Gas Chromatography with Electron Capture Detector (HS-GC-ECD). Formaldehyde, acetaldehyde, and
furfural were analyzed as oximes using an Agilent 7697A Headspace Sampler coupled with an Agilent
7890B gas chromatograph. The compounds were detected using Micro Electron Capture Detector. For
the derivatization, well homogenized FPBO was first extracted with water and the water extract was
subsequently filtrated to remove solid material. The sample extract was then further diluted with
water. Thereafter, a known amount of diluted sample extract and an aqueous solution containing the
derivatization agent O-(2,3,4,5,6-pentafluorobenzyl)-hydroxylamine (PFBOA) (6 mg/L) were pipetted
in a headspace vial and run using HS-GC-ECD. After the stabilization at 60 °C for 30 minutes in HS,
the aldehyde measurements were performed by GC-ECD using a HP-5 capillary column, 50 m x 0.32
mm x1.05 µm (J&W Scientific, Folsom, CA). For calibration, aqueous solutions of formaldehyde,
acetaldehyde and furfural were prepared at three different concentrations. The standards were
further prepared and analyzed like the samples.
VTT method 2 (used for Furfural, Acetaldehyde, Methanol, Phenol and Cresols)
The furfural, acetaldehyde, methanol, phenol, and cresol (o-, m-, p-) content was determined from
a FPBO water extract by using Agilent 7890A gas chromatography combined with an Agilent 5977B
mass selective detector (GC/MSD). The separation of compounds was performed using a J&W HP-
INNOWax high polarity fused silica capillary column (length: 60 m, inner diameter: 0.25 mm and film
thickness: 0.25 μm). The compound detection was performed by applying a mass scan range of m/z
between 27 and 300 (EI 70 eV). For the analysis, 1 g of well homogenised FPBO was weighed and
extracted in an ultrasonic bath with 20 ml of water. After extraction, the sample was centrifuged,
and 9 ml of water extract was mixed with 1 ml of internal standard (1-butanol, 1 g/L). Before GC/MS
analysis, the sample was filtrated using a membrane filter (0.45 µm) to remove solid material. For
the quantification, three-point calibration curves for methanol, acetaldehyde, furfural, phenol, o-
creseol and m-cresol were prepared. The calibration curve of m-cresol was also used to determine
the content of p-cresol.
Results
Firstly, the standards were measured with the methods. The calibration curves for each method were
derived by plotting the areas of the standards against the concentrations. All methods gave
calibration curves with good correlation coefficients. Subsequently, by extrapolating the area of the
furfural peak and correcting for the dilution the furfural concentration could be obtained. The results
for the 5 FPBO’s measured by each method is given in Table 3. As an example, a typical chromatogram
obtained with the RuG method can be found in Fig. 5.
Table 3: Results of the furfural analysis
Samples RuG (wt%) VTT-1 (wt%) VTT-2 (wt%)
Aged clean wood oil 0.24 ± 0.01 0.32 ± 0.02 0.21 ± 0.00
Fresh clean wood oil 0.32 ± 0.02 0.32 ± 0.03 0.25 ± 0.00
Clean wood oil after water removal 0.21 ± 0.03 0.21 ± 0.03 0.16 ± 0.02
Miscanthus oil 0.36 ± 0.01 0.48 ± 0.01 0.34 ± 0.00
Bark oil 0.36 ± 0.00 0.45 ± 0.03 0.28 ± 0.00
14Fig. 5: A typical chromatogram of the furfural (in FPBO) analysis applying the RuG method
Concentrations between 0.16-0.48 wt% were found in the oils. There is some difference in furfural
concentration between the different types of FPBO. In general, the highest concentrations were
found in the miscanthus- and bark oil. The results obtained with the 3 methods only differ slightly
and follow the same trend although the VTT-2 method seems to give some structural lower values.
METHANOL
Methanol can be found in FPBO as a pyrolysis product, sometimes it is also added to the FPBO as a
homogenizer mainly to suppress the phase separation of resin material. No methanol was added to
the samples measured in the round robin.
RuG method
The method used by the RuG is based on GC-FID applying a Restek Stabilwax-DA column (30 m x 0.32
mm x 1 µm df). Firstly a 5-point methanol calibration series (in IPA) is made in a concentration range
of 200-1000 mg/kg and measured. Subsequently a well homogenized FPBO sample is diluted 10x in
IPA, filtered (0.2 µm PTFE filter) and measured. The areas vs. concentration of the calibration points
are plotted and the concentration of methanol in the FPBO can then be obtained by extrapolating
the methanol area and multiplying it times the dilution factor.
VTT method
See VTT method 2, described in the furfural analysis.
Results
With both methods the standards were measured first. The methanol calibration curve for each
method was derived by plotting the areas of the standards against their concentrations. Good
correlation coefficients were obtained for both curves. By extrapolating the area of the methanol
peak and correcting for the dilution, the methanol concentration could be obtained. The results for
the 5 FPBO’s measured by each method is given in Table 4. A typical chromatogram obtained with
the RuG method can be found in Fig. 6.
15Table 4: Results of the methanol analysis
Samples RuG (wt%) VTT-1 (wt%)
Aged clean wood oil 0.48 ± 0.02 0.46 ± 0.01
Fresh clean wood oil 0.62 ± 0.01 0.58 ± 0.02
Clean wood oil after H2O removal 0.05 ± 0.00 0.07 ± 0.01
Miscanthus oil 0.58 ± 0.04 0.62 ± 0.01
Bark oil 0.79 ± 0.01 0.83 ± 0.02
Depending on the type of FPBO, methanol concentration in the range of 0.05-0.83 wt% were found.
The results obtained with the 2 methods only differ minimally and follow the same trend. Aged wood
seems to have lost some of the methanol in time ~22%, which could be due to slow in situ reactions
such as esterification. Furthermore, the FPBO in which some of the water was removed shows a
methanol decrease of ~90%, obviously the methanol is largely removed by evaporation in the water
removal step.
Fig. 6: A typical chromatogram of the MeOH (in FPBO) analysis applying the RuG method
ACETALDEHYDE
Acetaldehyde is component that can be found in pyrolysis oil. As with formaldehyde, acetaldehyde
is formed by depolymerization and scissoring reactions during pyrolysis.
RuG method
Formaldehyde and acetaldehyde where analyzed based on the EPA Method 8315A method. 1 g of well
homogenized FPBO was mixed with 40 g of water in a centrifuge tube and left overnight at room
temperature. After 24 hours the water mixtures were centrifuged for 3 hours at 4500 rpm to obtain
clear water layers. 0.5 g of the water extract was taken and added in a 250 ml Florence flask. 100
ml of water, 4 ml of citrate buffer and 6 ml of DNPH reagent was added and the mixture was kept in
an orbital shaker at 40 °C for one hour. Agitation was set to a gentle swirl. Immediately after one
hour, 10 ml of sat. NaCl was added. The DNPH derivatives were concentrated by use of an SPE setup
16with 2 g of C18 cartridges. The derivatives were flushed off the SPE cartridges with 10 ml of
acetonitrile and collected in test tubes. The acetonitrile weight was recorded. The DNPH derivatives
were analyzed with a HPLC system. A Hewlett Packard 1100 series HPLC was used with a DAD detector
set at 360 nm. 5 µl of sample was injected on a 250 × 4.6 mm 5 µm Agilent ZORBAX Eclipse XDB-C18
column at 30 °C. A gradient of acetonitrile/water was used as eluent starting with 65:35 for 15
minutes; 100:0 at 30 minutes; 65:35 at 45 minutes and hold for 15 minutes with a flow of 1 ml/min.
The HPLC system was calibrated using a commercial standard of DNPH carbonyl derivatives dilutes to
5 standards in a range of 10 to 50 mg/kg (concentration represented as non-derivatized carbonyl).
The samples were extracted, derivatized and analyzed in triplicate.
VTT method
See VTT method 1 & 2, described in the furfural analysis.
Results
Firstly, the standards were measured with the methods. The calibration curves for each method were
derived by plotting the areas of the standards against the concentrations. All methods gave
calibration curves with good correlation coefficients. Subsequently, by extrapolating the area of the
acetaldehyde peak and correcting for the dilution, the acetaldehyde concentration could be
obtained. The results for the 5 FPBO’s measured by each method is given in Table 5. As an example,
a typical chromatogram obtained with the RuG method can be found in Fig. 7.
Table 5: Results of the acetaldehyde analysis
Samples RuG (wt%) VTT-1 (wt%) VTT-2 (wt%)
Aged clean wood oil 0.15 ± 0.04 0.08 ± 0.00 0.11 ± 0.00
Fresh clean wood oil 0.24 ± 0.04 0.31 ± 0.01 0.44 ± 0.03
Clean wood oil after H2O removal 0.06 ± 0.01 0.01 ± 0.00 0.03 ± 0.00
Miscanthus oil 0.38 ± 0.01 0.44 ± 0.04 0.68 ± 0.02
Bark oil 0.53 ± 0.04 0.59 ± 0.04 0.90 ± 0.01
Fig. 7: A typical chromatogram of the acetaldehyde (in FPBO) analysis applying the RuG method
Acetaldehyde concentration in the range of 0.01-0.90 wt% were found in the oils and there is some
difference in concentration between the different types of FPBO. In general, also here the highest
concentrations were found in the miscanthus- and bark oil. The results obtained with the 3 methods
do differ slightly although they seem to follow the same trend. The results obtained with the VTT-2
method are structural higher compared to the VTT-1 method.
17PHENOL & CRESOL
Phenol and cresol can be found in pyrolysis oil. The phenolic monomers are produced from the lignin
in the biomass. Lignin polymers contain a certain amount of ether bonds with their monomers
(phenolics). These ether bonds are relative weak bonds and can readily be broken during the pyrolysis
of biomass.
RuG method
The concentration of phenol and cresol was determined using an internal standard method. In this
method 2,4,6-tribromophenol was used as the internal standard. The relative response factors (RRF)
are determined singular with pure components (standards). The well homogenized FPBO samples
were diluted 5x in tetrahydrofuran (THF). Subsequently the internal standard was added to the
samples. The samples solutions were then filtered over a PTFE filter (0.2 µm pore size) to remove
solid material and directly measured by GC-FID-MS equipped with a Restek Rtx-1701 60 m × 0.25 mm
ID. 0,25 µm df column.
VTT method
See VTT method 2, described in the Furfural analysis (page 14).
Results
For both methods, the standards were measured first. For the RuG method the RRF was determined
and for the VTT method calibration curves were prepared by plotting the areas of the standards
against the concentrations. Subsequently, by applying the RRF or by extrapolating the area of the
phenolic peaks and correcting for the dilution the concentration of individual phenolics could be
obtained. The results for the 5 FPBO’s measured by the VTT method are given in Table 6. With the
RuG method, only a pine oil was analysed. As an example, a typical chromatogram obtained with the
RuG method can be found in Fig. 8.
Table 6: Results of the acetaldehyde analysis; Concentrations in ppm.
Samples Phenol o-Cresol m-Cresol p-Cresol
Aged clean wood oil (VTT) 673 255 114 214
Fresh clean wood oil (VTT) 543 367 230 272
Clean wood oil after water removal (VTT) 656 407 262 312
Miscanthus oil (VTT) 1393 407 255 467
Bark oil (VTT) 783 453 325 364
Fresh clean wood oil (RuG)1 559 419 226 453
1
: Fresh clean wood oil from other batch than used by VTT
Depending on the type of FPBO, the concentration of phenolics found in the oils ranges from 114-
1395 ppm. With the RuG method only 1 sample was analysed and although this was a different sample
as analysed by VTT, the results do not differ a lot and follow the same trend. In general, the highest
concentrations of phenolics were found in the miscanthus- and bark oil. The lowest concentration of
phenol was obtained in the fresh clean wood oils and the lowest concentration of cresol isomers in
18the aged clean wood oil. The decrease in the cresol concentration in the FPBO during storage could
be due to reactions of cresols with for instance reactive aldehydes. 6
Fig. 8: A typical chromatogram of the phenolics (in FPBO) analysis applying the RuG method
FORMALDEHYDE
General
Formaldehyde is a flammable and strongly pungent smelling gas at ambient temperature, the boiling
point of formaldehyde is -19 °C. At low temperature formaldehyde dissolves in non-polar solvents
such as toluene, ether, etc. With increasing temperature, the solubility quickly reduces.
Formaldehyde in polar solvents such as water, alcohols, acids, etc. can polymerize and/or react with
the solvent. In aqueous solutions formaldehyde will primarily convert into methylene glycol, and the
presence of free formaldehyde will be very low. It forms a clear solution with a strong pungent smell.
Formaldehyde is a toxic and reactive chemical and the main risk is exposure by inhalation. It can also
be very sensitive to the skin, and it is genotoxic (DNA and RNA reactions) and carcinogenic. When
inhaled, the formaldehyde directly reacts (absorbs very fast in moisture) with molecules on site of
impact, meaning that it will mainly react/be absorbed in the respiratory organ(s), rather than being
absorbed in the blood. As for inhalation, contact to the skin will result in reactions with the skin, and
due to fast metabolisation it is not further penetrated into the body. In the EU, the maximum allowed
concentration of formaldehyde in finished products is 0.2% (2000 ppm), and any product that exceeds
0.05% (500 ppm) must include a warning that the product contains formaldehyde 7. In oral products
the maximum concentration is 0.1 %. Formaldehyde and mixtures containing ≥ 0.1% (1000 ppm) are
classified as a Carc. 1B substance(s). Furthermore, some formaldehyde releasers -which are
substances or product emitting formaldehyde during use- can also be classified as Carc. 1B substances
6
Diebold, J. P. A Review of the Chemical and Physical Mechanisms of the Storage Stability of Fast
Pyrolysis Bio-oils. In: Fast Pyrolysis of Biomass: A Handbook; Bridgwater, A. V. (ed.), CPL Press:
Newbury, U.K, 2002, pp. 243-292
7
ECHA investigation report Formaldehyde and formaldehyde releasers 15 March 2017. Available online
https://echa.europa.eu/documents/10162/13641/annex_xv_report_formaldehyde_en.pdf/58be2f0
a-7ca7-264d-a594-da5051a1c74b
19depending on the concentrations emitted. Examples of these releasers are for instance different kind
of formaldehyde-based resins used in wood based products, paint, coatings, etc.
As mentioned, in aqueous solutions formaldehyde will convert into methylene glycol. With respect to
safety & toxicity is methylene glycol and formaldehyde should not be considered as equivalents.
However, standard analytical methods cannot distinguish between both components. In 2014 Golden
& Valentini8 wrote a critical assessment on the properties and analysis of formaldehyde and
methylene glycol. They emphasized that formaldehyde and methylene glycol are chemically and
toxicologically certainly not equivalent.
Chemical Equilibrium
From a chemical point of view only small quantities of formaldehyde are present in water. The
majority of formaldehyde is hydrated to methylene glycol and methylene glycol oligomers (n = 2–8 in
HO(CH2O)nH), see Golden & valentini8. The equilibrium in water between monomeric formaldehyde
and methylene glycol and derivatives is strongly directed to the hydration side. The presence of
acids, a low temperature and/or high formaldehyde concentration will enhance the polymerisation.
Methanol is often added to formaldehyde solutions to suppress/slow down the polymerisation into
paraformaldehyde which would result in an insoluble polymer-precipitate. Similar to methylene
glycol polymerization, formaldehyde can react with methanol forming water-soluble hemiformal and
poly(oxymethylene) hemiformal molecules9,10 as illustrated in Fig. 9.
Formaldehyde in aqueous solutions is in chemical equilibrium with methylene glycol (see also Eq. 1).
Winkelman et al11, calculated the chemical equilibrium constant of formaldehyde/methylene glycol
in water (Eq. 2) by first determining the reaction rate constant of formaldehyde hydration via
enhanced absorption of formaldehyde into water in a stirred tank reactor. 8
Fig. 9: Formaldehyde equilibria in water and gas phase
(FA=Formaldehyde, W=Water, ME=Methanol, MG=Methylene Glycol, HF=Hemiformal)
8
R. Golden, M. Valentini, Formaldehyde and methylene glycol equivalence: Critical assessment of chemical and toxicological
aspects, Regulatory Toxicology and Pharmacology 69 (2014) 178–186
9
A review of the effects of formaldehyde release from endodontic materials, International Endodontic Journal, 48, 829–838,
2015
10
Journal of Molecular Liquids 134 (2007) 58-63
11
Winkelman et al, Chemical Engineering Science, 57 (2002), 4067-4076
20(Eq. 1)
(Eq. 2)
The results obtained by Winkelman et al. are shown in Fig. 2 (blue solid line) and fall well within the
data of other researchers. In the same figure the experimental data from different resources are
presented, and a trendline is shown (red solid line). The temperature range covered is roughly from
20 to 65 °C.
Fig. 10: Equilibrium data for FA-MG equilibrium (blue solid line) compared to literature data, and experimental
data (red solid line).
More recently, Rivlin et al.12 applied 1H- and 13C-NMR to determine a.o. the equilibrium constant of
formaldehyde hydration and dimerization in aqueous solutions at various pH (2.1-7.4) and
temperatures (273-333 K). An overview of the experimentally determined hydration and dimerization
equilibrium constant as a function of temperature and pH is given in Fig. 11.
21Fig. 11: Formaldehyde hydration and dimerization equilibrium constant as a function of the temperature and for
varying pH (range 2.1 – 7.4)12
From these results it can be concluded that in particular the hydration equilibrium is temperature
dependent, and the equilibrium constant decreases (less hydration) with increasing temperature.
However, in all cases the hydrated form (i.e. methylene glycol) is strongly preferred. The
polymerization equilibrium is less sensitive to temperature, and both equilibria are hardly influence
by pH. The hydration equilibrium constants obtained by Rivlin et al11. are comparable to the data
collected and calculated by Winkelman et al13.
Summarizing -on basis of the data above- it is concluded that in an aqueous media, and for
temperatures between of 5 to 65 °C the equilibrium between FA and MG is completely on the side of
methylene glycol. The equilibrium constant ranges from 200-300 for high temperature (~ 65 °C) to
more than 2,000 at room temperature. It means that the FA concentration is always at least a factor
200-300 lower than the MG concentration.
Formaldehyde analysis
Golden & Valentini8 evaluated the analysis method for determining the FA content in aqueous media.
Typically, a derivation method is applied using DNPH as derivatization agent; DNPH reacts quickly
with FA to form DNPH-FA complex, and the latter one is actually analysed. To restore the equilibrium
between MG and FA some MG will be converted to FA, and subsequently the FA will react with the
12
Rivlin et al., J. Phys. Chem. B, 2015, 119, 12, 4479-4487 – reproduced with permission from publisher.
13
Winkelman et al, Chemical Engineering Science, 57 (2002), 4067-4076
22excess DNPH. Ultimately, all MG is converted to FA and then reacts with DNPH to DNPH-FA. As a
consequence, this analysis method determines FAMG, i.e. the sum of formaldehyde and methylene
glycol.
Fig. 12: DNPH derivatization of formaldehyde and methylene glycol
RuG method
The method is the same as used for acetaldehyde, see page 16.
VTT method
The method used is the same as used by VTT for Acetaldehyde, see page 14.
BTG method
The UV-VIS method was used to determine the formaldehyde- and formaldehyde derivatives
(methylene glycol + oligomers) content in FPBO and fractions thereof. The method uses acetylacetone
and ammonium acetate to form a complex (Diacetyldihydrolutidine) with formaldehyde and its
derivatives14,15. Prior to sample preparation, a reagent solution with and without acetylacetone was
prepared (With: In a 100 ml VF (volumetric flask) with 25 ml of demi-water, dissolve 15 g of anhydrous
ammonium acetate, 0.3 ml glacial acetic acid and 0.2 ml acetyl acetone and fill to the mark with
demi-water. Without: In a 100 ml VF with 25 ml of demi-water, dissolve 15 g of anhydrous ammonium
acetate, 0.3 ml glacial acetic acid and fill to the mark with demi-water). Subsequently, four
formaldehyde standard solutions ranging in concentrations from 0.000-0.370 mg/l were prepared in
50 ml VFs to which also 5.0 ml of reagent solution incl. acetylacetone was added (and filled to the
mark with demi-water). A sample solution was prepared by weighing 0.16 g of well homogenized
FPBO in a 100 ml VF and adding 50 ml of demi-water. After placing the cap, the flask was gently
swerved for 5 min and then placed in an ultrasonic bath for 5 min (at ambient T). Again, the flask
was gently swerved for 5 min and filled to the mark with demi-water. The solution was then filtered
by applying a plastic syringe and a suitable 0.45 μm filter. Subsequently, 0.5 ml of the filtered solution
was pipetted into a VF of 50 ml and 5.0 ml of reagent solution with acetylacetone and 44.5 ml of
demi-water was added. The sample reference solution was prepared by pipetting 0.5 ml of the
filtered solution into a VF of 50 ml and adding 5.0 ml of reagent solution without acetylacetone and
44.5 ml of demi-water. All solutions (standards & samples) were then shaken for at least 15 s and
immersed (whole flask with cap) in a thermostatic water bath set at 60 °C for 10 min, followed by
14
Determination of Formaldehyde Content in Toys and Fabrics Using UV/Vis Spectrometry,
https://www.perkinelmer.com/lab-solutions/resources/docs/APP__FormaldehydeInToysUVVis.pdf
15 HAYUN et al., Orient. J. Chem., Vol. 33(3), 1400-1405 (2017)
23cooling for 2 min in a cooling bath (0 °C). After cooling, the flasks were shaken again for at least 15
s. Absorbance measurements at 412 nm (λ of max. absorbance) were performed between 35-60 min
from the time when the flasks were placed in the heated water bath. Absorbance measurements of
the standard solutions were performed against water and the sample solutions were measured against
their sample reference solutions. The solutions were measured by applying a double-beam Perkin
Elmer, Lambda 25, UV/VIS spectrophotometer, and applying the UV WinLab V6.0 software package.
Results
Mini Round robin
RuG and VTT tested five similar FPBO samples of different origin in 2020. Back-up samples were
stored at BTG in a freezer, and under these conditions aging will be very limited. In 2021, the same
samples were used by BTG for the UV-VIS analysis. In Table 7, the results obtained by the RuG, VTT
and BTG for the 5 FPBO’s are given. Values are indicated as FAMG, i.e. the sum of methylene glycol
and formaldehyde content. The FPBO with reduced water content, was the fresh clean wood oil
treated in an evaporator under vacuum. Likely, due to the low boiling point of FA (BP=-19 °C) besides
water also FA will be removed, and lower values are to be expected. Methylene glycol has a much
higher boiling point (BP=194 °C) and its removal is unlikely.
Table 7: Experimental results of the mini Round Robin by RUG and VTT
Samples FAMG meas. by RuG FAMG meas. by VTT FAMG meas. by BTG
(wt%)1 (wt%)1 (wt%)1
Aged clean wood oil 1.27 ± 0.04 1.10 ± 0.01 1.25 ± 0.00
Fresh clean wood oil 1.85 ± 0.30 1.76 ± 0.12 1.84 ± 0.01
Clean wood oil after H2O 1.90 ± 0.25 1.52 ± 0.02 1.84 ± 0.02
removal
Miscanthus oil 1.05 ± 0.03 0.83 ± 0.06 0.84 ± 0.02
Bark oil 1.49 ± 0.06 1.44 ± 0.05 1.35 ± 0.04
1
: Total measured FAMG concentration (formaldehyde + methylene glycol).
Keeping in mind the complexity of the matrix, it is concluded that all 3 methods are giving similar
results, and the methods are equally applicable to determine FAMG in FPBO. Reduction of FAMG
concentration by evaporation is not effective, which is another indication that FAMG-content is
mainly determined by MG concentration.
Formaldehyde concentration in FPBO
The data given in Table 7, concerns the total concentration of formaldehyde and methylene glycol
(FAMG) in FPBO. Assuming chemical equilibrium between FA and MG is achieved the actual
concentration of FA can be calculated. From the data presented in Fig. 10 and Fig. 11, the values
presented in Table 8, can be derived showing the upper and lower values for the formaldehyde
hydration equilibrium constant at 3 temperatures. K min is the lowest value found (= highest FA
concentration), Kmax is the highest value, KW is the value determined by Winkelman, and K exp is the
equilibrium constant according to experimental work.
24Table 8: Formaldehyde hydration chemical equilibrium constants for different equilibrium temperatures based
on Fig. 10 & Fig. 11.
Equilibrium T = 20 °C T = 40 °C T = 60 °C
Kmin 600 380 220
Kmax 2,800 1,250 800
KW 1,560 686 333
Kexp 2,100 1,200 450
The lower and upper values were taken to calculate the minimum and maximum (worse case) formaldehyde
concentration in the FPBO samples of the mini-round robin. In Table 9 (RuG),
Table 10 (VTT) and Table 11 (BTG), these calculated min and max formaldehyde concentration range
are given. The lowest values are found at 20 °C and are often below 10 ppm. At 60 °C the
formaldehyde concentration in FPBO can increase to almost 100 ppm.
Table 9: Minimum and maximum formaldehyde concentrations in FPBO calculated from RuG analysis data
Samples FA calc. min-max FA calc. min-max FA calc. min-max
at 20 °C (ppm) at T 40 °C (ppm) at 60 °C (ppm)
Aged clean wood oil 5-20 10-33 16-58
Fresh clean wood oil 7-31 15-49 23-84
Clean wood oil after H2O removal 7-32 15-50 24-86
Miscanthus oil 4-18 8-28 13-48
Bark oil 5-25 12-39 19-68
Table 10: Minimum and maximum formaldehyde concentrations in FPBO calculated from VTT analysis data
Samples FA calc. min-max FA calc. min-max FA calc. min-max
at 20 °C (ppm) at 40 °C (ppm) at 60 °C (ppm)
Aged clean wood oil 4-20 9-31 15-54
Fresh clean wood oil 7-34 16-54 26-93
Clean wood oil after H2O removal 6-30 14-47 22-80
Miscanthus oil 4-19 9-30 14-52
Bark oil 6-30 14-48 23-82
Table 11: Minimum and maximum formaldehyde concentrations in FPBO calculated from BTG analysis data
Samples FA calc. min-max FA calc. min-max FA calc. min-max
at 20 °C (ppm) at T 40 °C (ppm) at 60 °C (ppm)
Aged clean wood oil 4-21 10-33 16-33
Fresh clean wood oil 7-31 15-31 23-84
Clean wood oil after H2O removal 7-31 15-31 23-84
Miscanthus oil 3-14 7-22 11-38
Bark oil 5-23 11-36 17-61
25FORMALDEHYDE IN THE VAPOUR PHASE
Concerning the potential exposure of humans to formaldehyde, the most likely route is through
inhalation of formaldehyde from the gas phase. Formaldehyde is not only in equilibrium with different
chemical components in the liquid phase, but also forms an equilibrium with the vapour phase above
the liquid assuming a closed system and sufficient residence time.
Measurement of formaldehyde in the gas phase
To investigate the presence of formaldehyde in the gas phase, measurements were performed at BTG
and at the Empyro FPBO production facility. To determine the presence of formaldehyde in the gas
phase, a specialized company ‘Strooming BV’ was hired to perform dedicated measurements. These
measurements are conducted using small adsorption columns (orbo-24 tube) containing XAD-2 beads
coated with 2-hydroxymethylpiperidine (Fig. 13). A measured amount of air is pumped for a certain
period through the column. Formaldehyde is chemically adsorbed and reacts to form formaldehyde-
oxazolidine. The total amount of formaldehyde-oxazolidine is measured and used to calculate the
original formaldehyde concentration in the air. The objective of the measurements was to determine
the formaldehyde exposure of employees during a normal working day. For these measurements,
sample tubes were placed on the clothing of the employees close to mouth and nose to ensure the
sample was representative for the air which is normally inhaled.
Fig. 13: Formaldehyde measurement from the gas phase
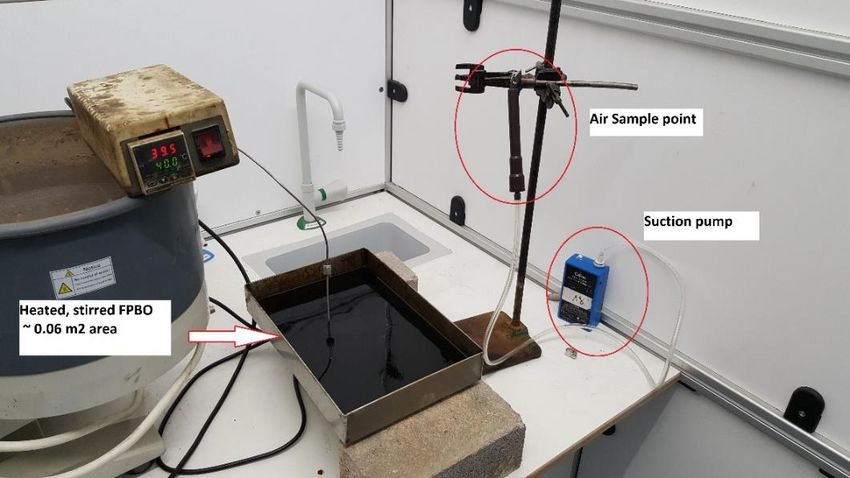
In addition, five ‘worst-case’ scenarios were tested where formaldehyde was measured in a specific
environment, being:
1. A non-ventilated environment directly above stirred, heated (40°C) FPBO (Fig. 14).
2. A non-ventilated environment directly above stirred FPBO at room temperature.
3. A non-ventilated environment directly above a 1m 3 FPBO container which was closed for at
least 1 month prior to the measurement (Fig. 15).
4. An environment open to the atmosphere in the Empyro pyrolysis plant where filters in the
FPBO circulation loop are regularly changed.
5. An environment open to the atmosphere in the Empyro pyrolysis plant next to the large FPBO
storage tank.
26Fig. 14: photograph of formaldehyde measurement in the gas phase ‘worst-case scenario 1’
Fig. 15: photograph of formaldehyde measurement in the gas phase ‘worst-case scenario 3’
Results of the gas phase formaldehyde measurements
The results of the various measurements of formaldehyde in the gas phase on three employees during
a normal working day are presented in Table 12. The exposure to formaldehyde in the gas phase is
much lower than the maximum allowable, daily concentration of 0.15 mg/m3 for each of the workers.
Table 12: Results of the dedicated formaldehyde measurements for three employees during a normal working
day
Measurement Time Concentration MAC valueA
mg/m3 mg/m3 Pass?
Empyro plant operator Daily limit < 0.034 0.15 Yes
(measured 11.7 hours)
BTG pilot plant operator Daily limit < 0.0063 0.15 Yes
(measured 5.5 hour)
BTG laboratory personnel Daily limit < 0.0062 0.15 Yes
(measured 5.5 hour)
A
= Maximum Allowable Concentration – The Netherlands 2019.
27You can also read