REV FEBRUARY 2018 - DENOVIX
←
→
Page content transcription
If your browser does not render page correctly, please read the page content below
Rev February 2018
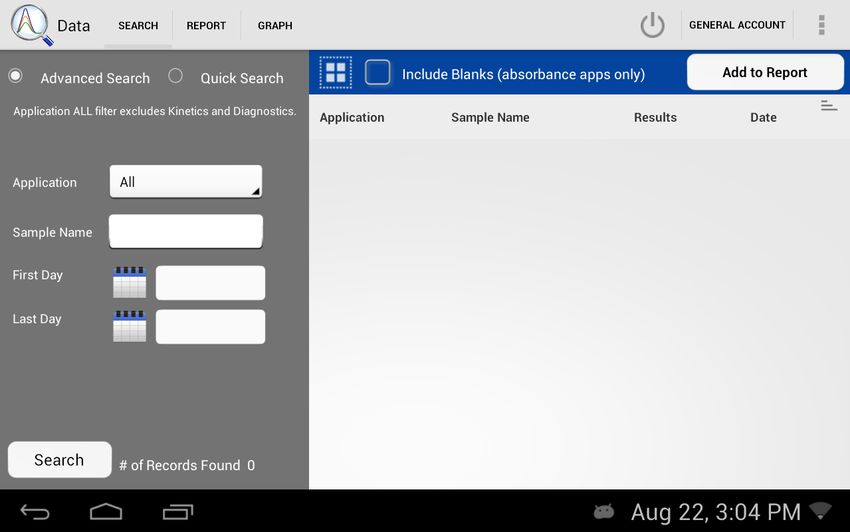
Table of Contents
       1. Introduction .............................................................................................. 5
       2. Set up and Safety ..................................................................................... 6
       3. Software Quick Guides ............................................................................ 8
             Software Icons ....................................................................................... 8
             Software Buttons ..................................................................................... 9
             Software Navigation ..............................................................................10
             Top Bar Overflow Functions ...................................................................11
       4. Report and Graph Screens.................................................................... 12
       5. Absorbance Apps: Basic Operation .................................................... 15
             Typical Absorbance Run Screen ........................................................... 17
             Best Practices Absorbance Measurements ........................................... 19
       6. Absorbance Nucleic Acid Apps ............................................................ 20
             dsDNA, RNA and ssDNA ......................................................................21
             Microarray ..............................................................................................22
       7. Absorbance Purified Protein, Peptide Apps ........................................ 28
             Protein A280 ..........................................................................................29
             Labeled Proteins ....................................................................................31
             Peptides ................................................................................................33
       8. Absorbance Colorimetrics App ............................................................ 36
             Generating a Standard Curve ............................................................... 37
             BCA                                                                                                    40
             Bradford                                                                                               40
             Lowry                                                                                                  40
             Pierce 660 ............................................................................................. 40
       9. Absorbance UV-Vis App ........................................................................ 41
       10. Absorbance OD 600 App ...................................................................... 43

2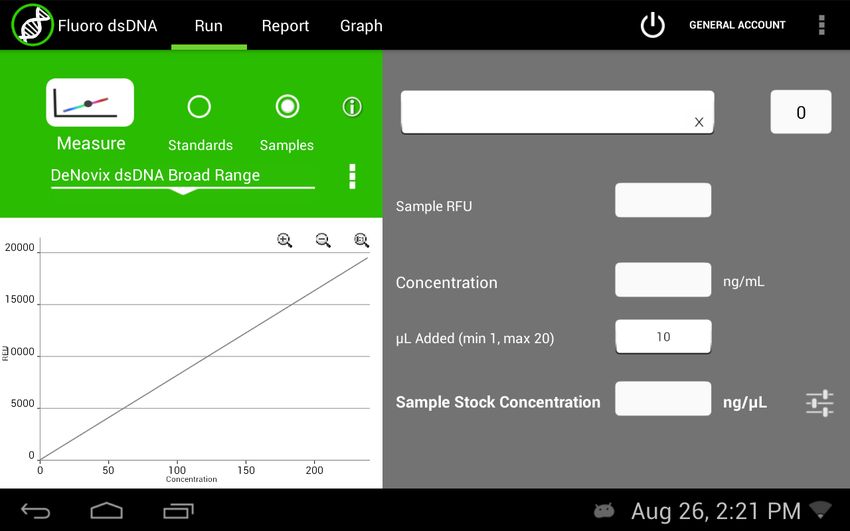
11. Absorbance Kinetics App..................................................................... 45
12. Absorbance Custom Methods Apps ................................................... 49
      Custom Standard Curve Methods ......................................................... 50
      Custom Formula Methods ..................................................................... 51
13. Fluorescence: Basic Operation........................................................... 53
      Best Practices ....................................................................................... 54
14. Fluorescence: Standard Curve Method Apps .................................... 55
15. Basic Fluorometer App ........................................................................ 62
      Excitation Selection and Emission Results ............................................63
16. Data Export and Print Options ............................................................ 64
      Export Options ....................................................................................... 64
      Export Via Email ....................................................................................65
      Export to a Network Folder ................................................................... 66
      USB                                                                                                    68
      Print Options ..........................................................................................70
17. Utility Apps and Functions .................................................................. 72
      Accounts App......................................................................................... 72
      Data App ................................................................................................74
      Export vs Archive ..................................................................................75
      Settings App ..........................................................................................77
      Updater App........................................................................................... 80
18.Lab Tool Apps ........................................................................................ 81
      Calculator App ....................................................................................... 81
      Timer App ..............................................................................................82
19. Maintenance ......................................................................................... 83
      Cleaning                                                                                               83
      Solvent Compatibility ............................................................................. 84

                                                                                                                    3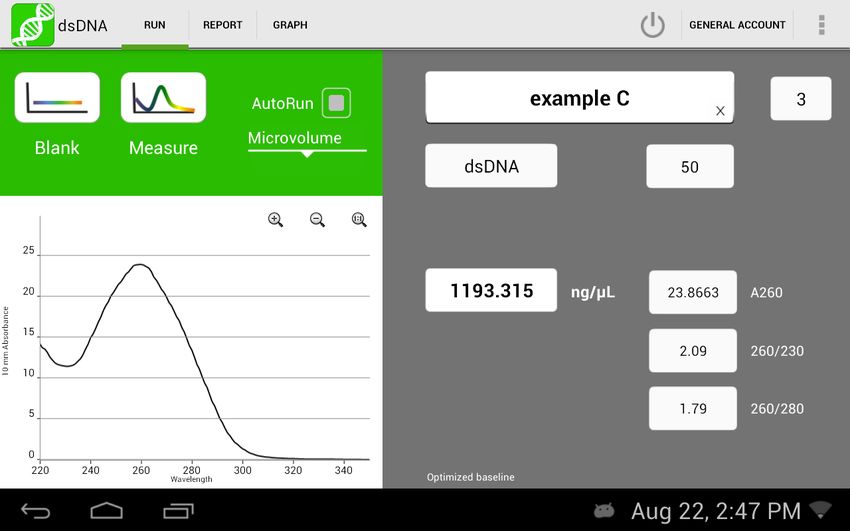
20. Diagnostics ........................................................................................... 85
          DS-11 Self Test ....................................................................................85
          Microvolume Pathlength Verification ....................................................86
          Verification Check Troubleshooting ....................................................... 87
          FX- Diagnostics ..................................................................................... 89
    21. Troubleshooting.................................................................................... 90
          Quick Help ............................................................................................. 90
          Software Errors ......................................................................................92
    22. Customer Support ................................................................................ 93

4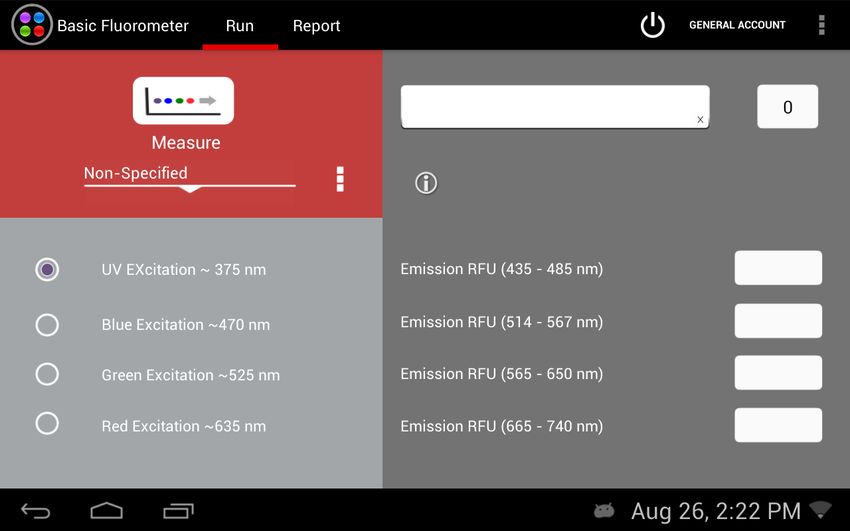
1. Introduction

  Product Technology

    DeNovix Spectrophotometers / Fluorometers are compact instruments with an
    integrated processor and a high-resolution touchscreen. The software utilizes
    application specific icons along with the Android™ operating system to provide
    an intuitive, easy-to-use instrument for both absorbance and fluorescence
    measurements.
    The SmartPath® Technology automatically adjusts the microvolume mode
    pathlengths to enable a sample measurements across a broad concentration
    range. Absorbance range specifications can be found at www.denovix.com.
    FX models include a fluorescence mode while the DS-11+ and DS-11 FX+
    instruments also enable cuvette-based measurements for low concentration
    samples and basic absorbance kinetic studies.

   Key Features include:
           • Integrated Processor and Hi-Definition 7-inch Touchscreen

           • Custom Android™ Control Interface

           • Simple, Intuitive EasyApps®

           • 1 μL and Cuvette Full Spectrum UV-Vis Analysis

           • Four Channel Fluorescence mode

                                                                                     5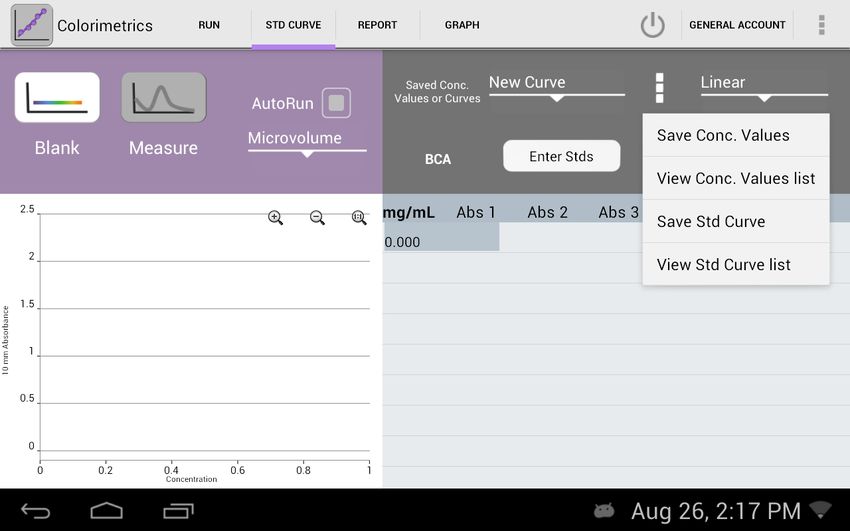
2. Set up and Safety

      1. Remove all packing materials including the protective cover on the screen.

      2. Plug the unit into a 100-240 VAC, 50-60/Hz receptacle using the grounded
         power supply (CUI MPN: ETSA120330U-P5P-SZ, Transformer Dest Top 12V
         40W, Lead free / RoHS Compliant) included with each unit.

      3. For instruments with red LED power indicators, turn on the power switch
         located in the back of the instrument. For instruments with green LED power
         indicators, press and release the power switch.

          The Android-based operating system will boot up in less than a minute.

      4. Use the Shut Down icon (accessed from within each app or on the Home
         screen) to do a soft power down.

     Cautions
        DO NOT REMOVE COVER
        No operator serviceable components inside. Refer servicing to qualified
        personnel.
        The DS-11 is designed for indoor use under the following conditions:
        Temperature: 15˚ to 35˚ C
        Humidity:    35 to 65 %                                                         !
        Use only the power supply provided with the instrument. Use of the
        instrument in any manner not specified by the manufacturer may impair the
        protection provided by the supplied power cord and power supply.

        NE PAS OUVRIR L’APPAREIL.
        Aucun composant réparable par un utilisateur est inclus. Confiez l'entretien à du
        personnel qualifié .

6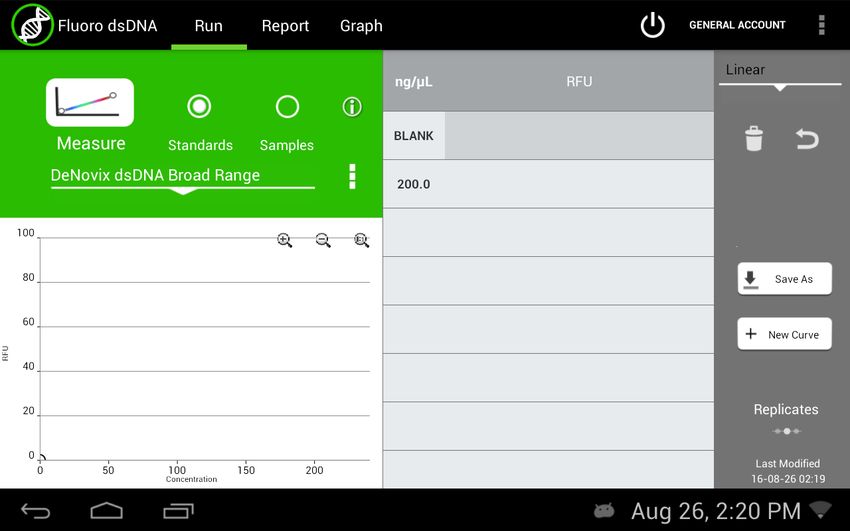
Installation and Safety

 Le DS- 11 est conçu pour une utilisation en intérieur dans les conditions suivantes :
 Température : 15° à 35˚C
 Humidité: ........35 à 65%
 Utilisez uniquement le bloc d'alimentation inclus avec l'instrument. Utiliser l’appareil
 dans des conditions non spécifiées par le fabricant peut compromettre la protection
 offerte par le cable d’alimentation et le bloc d'alimentation fournis avec l’appareil.

 VCCI (Class B) compliance statement for users in Japan:
 This is a Class B product based on the standard of the Voluntary Control Council
 for Interference (VCCI) from Information Technology Equipment. If this is used
 near a radio or television receiver in a domestic environment, it may cause radio
 interference. Install and use the equipment according to the instruction manual.
 This equipment has been tested for radio frequency emissions and has been
 verified to meet CISPR 22.2 Class B.

Instrument Rear Panel

 The DS-11 comes equipped with one Ethernet and three USB ports. The Ethernet
 feature is provided for internet connectivity only. The USB ports are used to
 facilitate data transfer to a FAT32 formatted USB storage device and connect to
 the accessory FX Module. In addition, the USB ports support the use of selected
 DYMO printers* and an Opticon OPI 3601 USB barcode reader. USB mouse and
 keyboard devices may also be used with the DS-11 FX+ series of instruments.
 *   Please refer to www.denovix for a list of supported Dymo printers.

                                                                                            7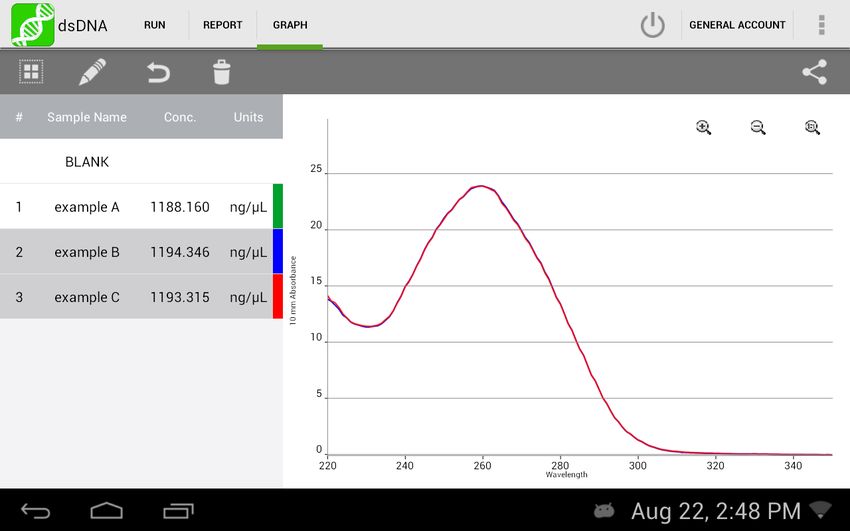
3. Software Quick Guides

      Software Icons

              Add                       Select All                       Export
       !                          !                              !

              Delete                    Purity Ratio Alert               Sort
                                                             !

              Edit                      Copy                             Info
                              !

              Undo                      Paste                        !   Shut Down

              The Overflow (top action bar) is used to access secondary features
       !      such as Select Units, Screen Capture, User Guide and Exit.

              Progress bars or busy indicators are used to indicate the instrument
       !      is in the process of making a measurement. Please wait until the icon
              has disappeared before performing additional actions.
              The USB Flash Drive Eject icon appears in the bottom notification bar
              when a drive is detected. The software will automatically safely
              unmount the flash drive after a screen capture or a report is exported
              to the drive. Tap the icon to remove a flash drive when nothing was
              exported or saved.
              The Quick Print icon is only displayed on Report or Graph screens
              when a DYMO label printer is connected to the instrument.

              Auto Export status icons are displayed at the top right of a Run
              screen. Ensure WiFi is connected prior to making a measurement.

8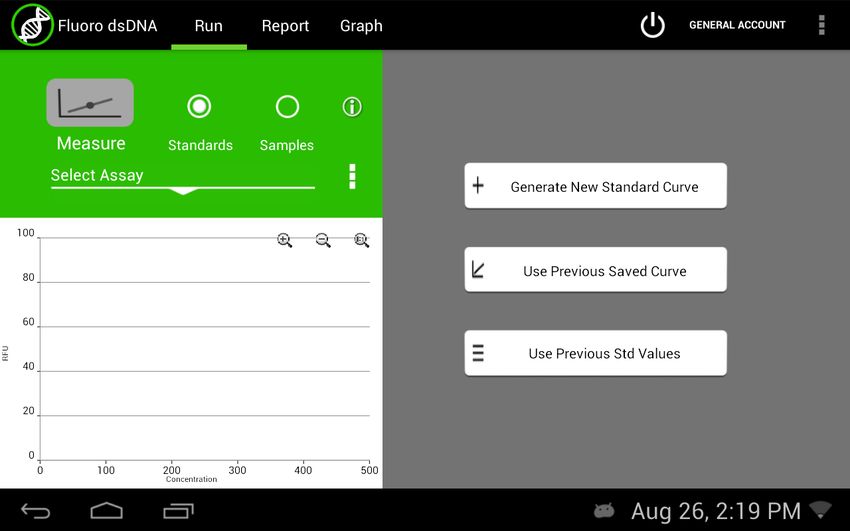
Software Quick Guides

Software Buttons
          The absorbance apps Blank button is used to establish a reference
          absorbance within each measurement app. The graph will not
          display a spectrum for a Blank measurement.
          The absorbance apps Measure button is used for sample
          measurements. It is inactive until at least one Blank measurement
          is complete.

          The fluorescence apps Standards Measure button is used to
          measure standards when building a standard curve.

          The Samples Measure button is used to quantitate samples.

          The fluorescence apps Replicates On/Off button is used to define if
          the standards curve enables one or up to three replicates.

          The fluorescence apps Basic Measure button is used to make
          single measurements not being read from a standard curve.

          Fields with Drop-Down Menus are indicated by black or white
          triangles located on the center bottom.

          Fields with black underlines are editable by the user. Tapping on the
          field will enable a keyboard, a numeric keypad or a dialog box.

          Application specific editor options can be accessed using the List
          Add/Edit button found to the right of some drop-down menus.

          Options buttons are used for such purposes as change units or
          trend line analysis parameters in the fluorescence apps.

          An accept and return to previous screen button is found in the
          lower right of some screens. All changes made to a selection are
          immediate.

                                                                                  9
Software Quick Guides

      Software Navigation

                        Apps are launched using Home screen icons. Swipe the Home
                        page to the left for additional icons.

                         The app Run, Report and Graph screens are accessed either
                         by the tabs on the top bar or by swiping the screens left or
                         right.

                         Use the Current Account Tab drop-down menu on the top
                         action bar in the Run, Report and Graph screens to select a
                         specific account within an app. Use the Accounts app to
                         create and manage accounts.

                        The bottom bar Back button is used to navigate to the main
                        level of the current app.

                        The bottom bar Home button is used to navigate to the Home
                        screen without closing the app.

                        The bottom bar Recents button is used to as a means of
                        displaying recently used apps. Swipe the app to the left from
                        the Recents list will close the app.

                        The bottom bar Collapse button is used in place of the Back
                        button whenever a keyboard is enabled. Use this button to
                        dismiss the keyboard.

      Notification Bar

        Information such as available updates, scheduled system backups reminders
        and WiFi connectivity status are located on the bottom action bar adjacent to
        the date and time display. Swipe the notification up for details. Tap outside the
        notification box to minimize the information.

10
Software Quick Guides
Top Bar Overflow Functions
Screen A .jpg may be exported as described in the chapter entitled
Capture "Screen Capture and Export" using this option.
Export A .csv file of sample data may be may be exported as
Selected described in the chapter entitled "Screen Capture and
Samples Export". Network printing is also enabled using this option.
Change Concentration units may be changed in some apps using
Units this option.
Archive The Archive function exports data as a .csv file to a network
Selected folder or USB flash drive and permanently deletes it from
Samples the instrument.
Clear This function saves and then clears all current sample
Samples records from the Report and Graph screens.
Baseline Some apps enable Baseline Correction changes from the
Correction Overflow function on the Run screen.
The User Guide may be accessed either from the Overflow
User Guide icon within any app or by launching the User Guide app.
The About feature brings up an information box displaying
About the current app version number.
Lamp The Diagnostics app Lamp Reset is used as a means to re-
Reset optimize a lamp when necessary.
The Diagnostics app Tech Support feature is used to send
Tech instrument related diagnostics files to DeNovix customer
Support support.
Exit Use the Exit function to close an application.
114. Report and Graph Screens
The measurement apps generally use a three page structure consisting of the
Run, Report and Graph screens. The various screens are accessed either by
using the top tabs or by swiping the touch screen left or right.
The typical Run screen varies significantly between the absorbance and the
fluorescence apps. Refer to the "Basic Operation" section for the absorbance
mode and the individual fluorescent app sections for more information.
Report Screen
!
• The Report screen list includes application specific data fields for each
sample measured in the current measurement session.
• Tap rows to highlight and select data for export. The Select All /UnSelect All
icons are used to quickly select or deselect all rows.
• The change will be applied to the current Report and Graph screen rows as
well as to the sample information retrieved using the Data app.
12Report and Graph Screens
• Clear highlighted sample records from the both the Report and Graph screens
using the Delete icon. The data is removed from the current report but is still
available using the Data app.
• Highlighted sample data may be exported or printed using the top action bar
Overflow Screen Capture or Export Selected functions. Additional information
is provided in the chapter entitled "Screen Capture and Export".
Graph Screen
!
• Tap rows to highlight and select data to display the spectra. The Select All /
UnSelect All icons are used to quickly select or deselect all rows.
• Up to 24 samples may be overlaid on the graph. Absorbance apps will display
sample spectra while the fluorescence apps will display the concentration
calculated from the standard curve trend line.
• Color blocks are used as a legend convention.
13Report and Graph Screens
• Highlight a single row and then tap the Edit icon to add or modify a sample
name. The change will be applied to the current Report and Graph screen
rows as well as to the sample information retrieved using the Data app.
• Clear highlighted sample records from the both the Report and Graph screens
using the Delete icon. The cleared data will be available using the Data app.
• Highlighted sample data may be exported or printed using the top action bar
Overflow Screen Capture or Export Selected functions. The data will will
exported as a .csv file and spectra may be re-graphed using a spreadsheet
chart function. Additional information is provided in the chapter entitled
"Screen Capture and Export".
145. Absorbance Apps: Basic Operation
Microvolume Measurements
1. Ensure both top and bottom sample surfaces are clean.
2. Pipette 1 μL of the blank solution onto the lower sample surface. Lower the
top arm and tap the Blank button.
3. Remove the solution from both sample surfaces using a clean, dry lab wipe.
4. Pipette 1 μL of the sample solution onto the lower sample surface.
5. Lower the arm and tap the Measure button. All microvolume measurements
are reported in 10 mm equivalent absorbance values.
Cuvette Measurements
Refer to the light path arrow as a guide when inserting a cuvette. Use cuvettes
that meet the following specifications:
• Width: 12.5 mm Length: 12.5 mm Height: 45 mm Z height: 8.5 mm
• UV wavelength region: Use quartz or UV transparent plastic cuvettes
• Visible wavelength region: Use quartz or plastic cuvettes
1. Insert a cuvette pre-filled with the Blank solution. Lower the arm and tap the
Blank button.
2. Insert a cuvette pre-filled with the sample solution. Lower the arm and tap
the Measure button.
15Basic Operation: Absorbance
Auto Run Measurements
1. Perform a Blank measurement as previously described and then select the
Auto Run checkbox on the app Run screen. Pipette 1 μL of the sample
solution onto the lower sample surface.
2. Lower the arm for automatic measurements. Deselect the feature to perform
new Blank measurements. Note: This feature may be used for both
microvolume and cuvette mode measurements.
Sample Measurement Modes
• Measurement mode selections are made using the drop-down menu found
next to the Measure button on the Run screen.
• The Microvolume mode uses 1.0 μL samples pipetted onto the sample
surface.
• The microvolume Short Path mode requires 0.5 μL samples pipetted onto the
sample surface. This mode is for high concentration samples and does not
use the 0.5 mm pathlength.
• The microvolume Fast Mode option is primarily for samples in the range
measured by the 0.5 mm pathlength although it may be used for higher
concentration samples .
• The DS-11+ enables the use of 10, 5, 2, 1, 0.5, 0.2 and 0.125 mm pathlength
Cuvette modes.
• Report screens will include actual absorbance values measured using a
specific cuvette pathlength. Graph screens will display all cuvette
absorbance values normalized to a 10 mm value.
• A new Blank measurement must be made when changing between
microvolume and cuvette modes.
16Basic Operation: Absorbance
Typical Absorbance Run Screen
• Blank, Measure, AutoRun and Mode: Use the Blank button when measuring
the reference solution and the Measure button for samples.Tap the AutoRun
box to enable automatic measurements upon lowering the arm. Use the drop-
down menu to select either microvolume or cuvette mode measurements.
• Sample Name: Tap the input box to display an on-screen keyboard or use a
Opticon OPI 3601 USB scanner to enter sample names.
• Sample Type and Factor Fields: Displays current sample type and associated
factors used for concentration calculations. The fields may be fixed or
selectable depending on the application.
• Absorbance Graph: The spectral plot displays data for the current sample
normalized to a 10 mm pathlength for microvolume measurements. Pinch
and zoom anywhere in the graph to rescale the X or Y-axis.
• Baseline Correction nm: Displayed at bottom of screen. Use the top action bar
Overflow function to modify. Additional baseline correction details are
provided within each relevant measurement app chapter.
17Basic Operation: Absorbance
Screen Saver
• The backlight for the screen will automatically turn off after 10 minutes of
inactivity. Simply tap anywhere on the screen to resume the last function.
• Although the screen is turned off for the screen saver mode, functions such
as the Timer and Kinetics measurements continue in the background. Always
check that these apps are not in use in the background prior to turning off the
instrument.
Mechanism Busy Indicator
• A progress bar will be displayed on the screen when the measurement
mechanism is busy.
• Please do not lift the arm, push software buttons or turn the instrument off
while a progress bar or other busy indicator is displayed.
Measurement Sessions
• New measurement sessions begin each time an app is accessed from a
closed state or when the account is changed while the application is open.
• In addition, new sessions automatically begin when the number of sample
records on the Report screen reaches 9999.
18Basic Operation: Absorbance
Best Practices Absorbance Measurements
• Clean both sample measurement surfaces prior to making the Blank
measurement.
• Use dH2O, not detergents or alcohol, for routine sample measurement surface
cleaning.
• Use a dry lab wipe to remove measurement liquids from both the top and
bottom surfaces immediately after each measurement.
• Use 1 μL samples for routine microvolume measurements.
Note: Select the Short Path mode for high concentration 0.5 μL samples.
• Use a fresh aliquot for each measurement.
• Use a fresh tip to deliver each sample aliquot.
• Avoid introducing bubbles when pipetting samples onto the measurement
surfaces.
• Ensure sample concentrations fall within absorbance limits of the instrument
for accurate results.
• Use the same buffer a sample is suspended in for the Blank measurements.
• Avoid using buffers such as RIPA buffers that contain components with
strong absorbances at the wavelength of interest.
• Measure a fresh aliquot of the buffer using the Measure button and ensure
the spectrum is relatively flat along the baseline before measuring samples.
• For cuvette mode measurements, use cuvettes with 8.5 mm Z heights. Select
the Cuvette option using the drop-down menu next to the Measure button and
ensure the cuvette is inserted in the proper orientation.
196. Absorbance Nucleic Acid Apps
dsDNA RNA ssDNA Microarray
! ! !
The four preconfigured nucleic acid apps are used to quantify nucleic acid
samples based upon absorbance values at 260 nm.
Quick Protocol
1. Launch the appropriate application from the Home screen.
2. Establish a Blank using the appropriate buffer.
3. Enter a sample name.
4. Select a sample type if applicable.
• Enter optional user-defined ng-cm/μL factor (ssDNA and Microarray).
• Select a dye type (Microarray only).
5. Measure a fresh aliquot of sample using the Measure button.
Notes:
• Blank with TE if the sample is dissolved in TE.
• Ensure that the sample isolation procedure is optimized and that samples are
purified prior to making absorbance measurements.
• Ensure all solutions are homogenous and well-mixed prior to sampling.
• Use fresh aliquots for each microvolume measurement.
20Nucleic Acids: Absorbance
dsDNA, RNA and ssDNA
The basic nucleic acid apps are optimized for the factor used to calculate
sample concentrations.
Screen Features
• Sample Type: The sample type is used to determine which ng-cm/μL factor
is used to calculate the concentration.
• The sample type is fixed for both the dsDNA and RNA apps.
• A Factor Input option along with the default ssDNA sample type is
available from the selector field for the ssDNA app.
• Factor: The default wavelength-dependent factors used for each app are as
follows: dsDNA: 50 ng-cm/μL RNA: 40 ng-cm/μL ssDNA: 33 ng-cm/μL
• Oligo factors derived from the Calculator app may be copied and pasted
directly into this field.
• Concentration Results: Concentration results are reported in units of ng/μL.
• Units may be changed using the Run screen top action bar Overflow
menu. The units selected at the time of the measurement is what is saved
to the database.
• A260: Reports the baseline-corrected 260 nm absorbance value.
• 260/230: Displays the ratio of the 260 nm and 230 nm absorbance values.
• 260/280: Displays the ratio of the 260 nm and 280 nm absorbance values.
Note: The DNA and RNA apps do not distinguish between the nucleic acid
species within a sample. It is important to optimize the isolation protocol to
ensure accurate quantitation.
21Nucleic Acids:Absorbance
Microarray
The Microarray app is used to quantify nucleic acid samples based upon
absorbance values at 260 nm and dyes based upon dye specific analysis
wavelengths.
Screen Features
• Sample Type: The sample type selection of ssDNA is the default option for
this application. Options include:
• ssDNA (Factor = 33 for nucleic acid concentration calculation.)
• RNA (Factor = 40 for nucleic acid concentration calculation.)
• Factor Input to enable a user-defined nucleic acid factor. Oligo factors
derived from the Calculator app may be copied and pasted directly into
this field.
• Dye Type: Cy3 is default selection for this application.
• Nucleic Acid Concentration Results: Results are reported in units of ng/μL.
• Units may be changed using the Run screen top action bar Overflow
menu. The units selected at the time of the measurement is what is saved
to the database.
• Dye/Fluorophore Concentration Results: Results are reported in units of μM.
• A260*: Reports the baseline and dye corrected 260 nm absorbance value.
This value may be lower than the A260 value observed in the absorbance
spectra due to the correction factors applied.
• AXXX: The baseline-corrected dye specific analysis wavelength absorbance
value (e.g A550 when using the Cy3 dye).
22Nucleic Acids: Absorbance
Dye List
There are 11 preconfigured dye types available for both the Microarray and
Labeled Proteins applications. New dye types may be saved using the List Add/
Edit button to the right of the dye list drop-down menu. Refer to the
manufacturer of the dye for analysis nm, extinction coefficient and correction
factor information.
Dye Ext. Coeff A260 Factor A280 Factor
Cy3 150000 0.08 0.08
Cy5 250000 0.05 0.05
Cy5.5 250000 0.05 0.18
Alexa Fluor 405 34,000 0.23 0.7
Alexa Fluor 488 71,000 0.3 0.11
Alexa Fluor 555 150,000 0.08 0.08
Alexa Fluor 594 90,000 0.43 0.56
Alexa Fluor 647 239,000 0 0.03
Alexa Fluor 680 184,000 0 0.05
Alexa Fluor 700 192,000 0 0.07
Fluorescein/FITC 68000 0.32 0.2
Dyes saved to the list are accessible for both the Microarray and Labeled
Proteins apps. The new dyes may be used by all accounts, including the General
Account. The user-added dyes may only be edited or deleted by the account
holder or an administrator account holder.
23Nucleic Acids:Absorbance
The following information is required in order to save a new dye to the list:
• Dye name
• Analysis wavelength
• Analysis wavelength specific molar absorption coefficient (M -1 cm-1)
• 260 nm absorbance correction factor
• 280 nm absorbance correction factor
Preconfigured dyes may not be modified or deleted.
Baseline Correction for Dyes
The software anchors the visual spectrum display to the baseline at 750 nm for
all measurements. It automatically applies a 340 nm bichromatic normalization
for the A260 value and uses a sloping baseline between 400 and 750 nm for dye
concentration calculations.
If adding a new dye, it is important to empirically determine if the default 750 nm
selection is appropriate to use as the baseline correction wavelength.
• The baseline correction screen is accessed from the Run screen top action
bar Overflow icon.
• Tap the Add icon to include a user-defined option between 750 and 840 nm.
• The new option will be used for both the the visual display and the sloping
dye baseline.
• Once a baseline correction nm is selected, it is applied to all subsequent
measurements and is not dye specific. When changing dyes, always confirm
that the proper baseline correction is applied.
24Nucleic Acids: Absorbance
Nucleic Acid Concentration Calculations
A modified Beer-Lambert equation is used to calculate concentrations as
follows:
c = (A * e)/b
c = the nucleic acid concentration in ng/microliter
A = the absorbance in AU
e = the wavelength-dependent factor in ng-cm/microliter
b= the pathlength in cm (10 mm)
Baseline Correction
Baseline corrections correct for offsets due to sample particulates. If a baseline
correction is not used, the sample spectrum may be offset from the baseline,
resulting in a change in the reported sample concentration. The DS-11 uses a
correction at 340 nm as the default selection. However, the user may elect to
define the baseline nm used for specific measurements.
The baseline correction screen is accessed from the Run screen top action bar
Overflow icon. Once a baseline correction nm is selected, it is applied to all
subsequent measurements within the same measurement session.
Purity Ratios
• The generally accepted 260/280 values are ~1.8 for pure DNA and ~2.0 for
RNA.
• The 260/230 values for nucleic acids usually range between 1.8 and 2.2.
25Nucleic Acids:Absorbance
Troubleshooting Purity Ratios
Issue Probable Causes/ Solutions
Dirty measurement surfaces or improper Blank.
Clean the surfaces, measure a new Blank using fresh source of
dH20 or sample buffer. Use the same solution (water or buffer) the
sample is in for the blank measurement.
Low 260/230
Presence of residual extraction reagent (ex. Carbohydrates,
Chaotropic salts, phenol).
Re-purify the sample, then remeasure. Contact the manufacturer of
the extraction kit for guidance on how to optimize the procedure.
Dirty measurement surfaces or improper Blank.
High 260/230 Clean the surfaces, measure a new Blank using fresh source of
dH20 or sample buffer. Use the same solution (water or buffer) the
sample is in for the blank measurement.
Dirty measurement surfaces or improper Blank.
Clean the surfaces, measure a new Blank using fresh source of
dH20 or sample buffer. Use the same solution (water or buffer) the
sample is in for the blank measurement.
Low 260/280
Presence of residual extraction reagent (ex. protein, phenol).
Re-purify the sample, then remeasure. Contact the manufacturer of
the extraction kit for guidance on how to optimize the procedure.
Dirty measurement surfaces or improper Blank.
Clean the surfaces, measure a new Blank using fresh source of
High 260/230
dH20 or sample buffer. Use the same solution (water or buffer) the
sample is in for the blank measurement.
26Nucleic Acids: Absorbance
Ratio Alerts
The DS-11 software v3.0 and above displays alerts icons within the dsDNA, RNA
and ssDNA apps for samples with purity ratios outside of specified minimum
and maximum limits. Tapping on the icon will pop-up a message with error
specific information.
The default settings are as follows:
Ratio Minimum Maximum
260/230 1.8 3
260/280 1.65 2.5
Users may elect not to have the alerts show or set custom limits using the Run
screen Overflow menu. The new limits may be used by all accounts, including
the General Account. Saved user-added limits may only be edited or deleted by
the account holder or an administrator account holder.
Note: The limits are only enforced for samples above a minimum concentration
value. A blue warning icon will be displayed when the sample concentration is
below the threshold.
277. Absorbance Purified Protein, Peptide Apps
Protein Labeled
Peptides
A280 Proteins
! ! !
Quick Protocol
1. Launch the appropriate application from the Home screen.
2. Establish a Blank using the appropriate buffer.
3. Enter a sample name.
4. Select a sample type.
• New protein or peptide types may be added to the selection list.
• Select a dye type when using the Labeled Proteins app.
5. Measure a fresh aliquot of sample using the Measure button.
Notes:
•If the buffer exhibits significant absorbance at 280 nm, use alternative methods
such as colorimetric assays to quantitate proteins.
•Ensure all solutions are homogenous and well-mixed prior to sampling.
•Use fresh aliquots for each microvolume measurement.
28Purified Protein, Peptides: Absorbance
Protein A280
The Protein A280 application is used to quantify samples based upon
absorbance values at 280 nm.
Screen Features
• Sample Type: The sample type and associated mass extinction coefficients
options include:
Use the 1A=1mg/ml option when neither the E1% nor Ext Coeff and MW for the
purified protein sample are known.
• Concentration Results: Results are reported in units of mg/mL.
• Units may be changed using the Run screen top action bar Overflow
menu. The units selected at the time of the measurement is what is saved
to the database.
• A280: Reports the baseline-corrected 280 nm absorbance value.
• 260/280: Displays the ratio of the 260 and 280 nm absorbance values.
Protein Type List
New Protein types using either user-defined E1% or MW and Ext. Coeff values
may be saved using the List Add/Edit button to the right of the sample type
drop-down menu.
• The new sample types may be used by any account holder.
• The new sample types may be edited or deleted only by the account holder or
an administrator account.
29Purified Protein, Peptides: Absorbance
Baseline Correction
Bichromatic normalizations correct for baseline offsets due to sample
particulates. If a baseline correction is not used, the sample spectrum may be
offset from the baseline, resulting in a change in the reported sample
concentration. The DS-11 uses a correction at 340 nm as the default selection.
However, the user may elect to define the baseline nm used for specific
measurements.
Sample Type E1% at 280 nm for 10 mm pathlength
BSA 6.67
1A=1mg/mL 10
IgG 13.7
User-defined mass extinction coefficient (L gm -1 cm -1) for a
E1%
10 mg/mL (1%) solution
User-defined MW (Daltons) and molar extinction coefficient
MW & Ext Coeff
(M -1 cm-1)
. However, the user may elect to define the baseline nm used for specific
measurements.
The baseline correction screen is accessed from the Run screen top action bar
Overflow icon. Once a baseline correction nm is selected, it is applied to all
subsequent measurements within the same measurement session.
30Purified Protein, Peptides: Absorbance
Labeled Proteins
The Labeled Protein application is used to quantify protein samples based upon
absorbance values at 280 nm as well as Dyes and Fluorophores at specific
analysis wavelengths.
Screen Features
• Sample Type: The sample type and associated mass extinction coefficients
options include:
Sample Type E1% at 280 nm for 10 mm pathlength
BSA 6.67
1A=1mg/mL 10
IgG 13.7
User-defined mass extinction coefficient (L gm -1 cm -1) for a
E1% 10 mg/mL (1%) solution
User-defined MW (Daltons) and molar extinction coefficient
MW & Ext Coeff
(M -1 cm-1)
• Dye Type: Cy3 is default selection for this application.
• Protein Concentration Results: Results are reported in units of mg/mL.
• Units may be changed using the Run screen top action bar Overflow
menu. The units selected at the time of the measurement is what is saved
to the database.
• Dye/Fluorophore Concentration Results: Results are reported in units of μM.
• A280*: Reports the baseline and dye corrected 280 nm absorbance value.
This value may be lower than the A280 value observed in the absorbance
spectra due to the correction factors applied.
• AXXX: The baseline-corrected dye specific analysis wavelength absorbance
value (e.g A550 when using the Cy3 dye).
31Purified Protein, Peptides: Absorbance
Protein Type List
New Protein types using either user-defined E1% or MW and Ext. Coeff values
may be saved using the List Add/Edit button to the right of the sample type
drop-down menu.
• The new sample types may be used by any account holder.
• The new sample types may be edited or deleted only by the account holder or
an administrator account.
Dye List
There are 11 preconfigured dye types available for both the Microarray and
Labeled Proteins applications. Refer to the "Microarray" section of the chapter
entitled "Nucleic Acids" for more information.
Baseline Correction
The software anchors the visual spectrum display to the baseline at 750 nm for
all measurements. It automatically applies a 340 nm bichromatic normalization
for the A280 value and uses a sloping baseline between 400 and 750 nm for dye
concentration calculations.
If adding a new dye, it is important to empirically determine if the default 750 nm
selection is appropriate to use as the baseline correction wavelength.
• The baseline correction screen is accessed from the Overflow icon.
• Tap the Add icon to include a user-defined option between 750 and 840 nm.
• The new option will be used for both the the visual display and the sloping
dye baseline.
• Once a baseline correction nm is selected, it is applied to all subsequent
measurements and is not dye specific. When changing dyes, always confirm
that the proper baseline correction is applied.
32Purified Protein, Peptides: Absorbance
Peptides
The Peptide app is used for low concentration samples which do not have
aromatic residues such as Trp, Tyr or Cys-Cys disulphide bonds. The Protein
A280 app is recommended when the sample does contain aromatic rings.
Screen Features
• Sample Type: The first two sample types included in the sample type drop-
down are preconfigured for both the analysis wavelength and the
corresponding E 0.1%.
• Sample type and associated E 0.1% coefficients options include:
Sample Type E 0.1% at specified nm for 10 mm pathlength Analysis Wavelength
215 nm
e215 nm 11.7
(recommended)
e205 nm 31 205 nm
User-defined mass extinction coefficient (L 215 or 205 nm
E0.1% gm -1 cm -1) for a 1 mg/mL (0.1%) solution User Option
• Analysis Wavelength Selector: The radio button selector will appear for all
sample types except the preconfigured e215 nm and e205 nm options. Note:
Extinction coefficients are wavelength dependent.
• Concentration Results: Results are reported in units of mg/mL.
• Units may be changed using the Run screen Overflow menu. The units
selected at the time of the measurement is what is saved to the database.
• AXXX: Reports the baseline-corrected analysis wavelength absorbance
values (e.g A205 or A215).
33Purified Protein, Peptides: Absorbance
Protein and Peptide Concentration Calculations
The Beer-Lambert equation is used to calculate concentrations as follows:
A = E1% * b * c
c = the protein concentration in g/100 mL
A = the absorbance in 10 mm equivalent
E1%= the percent extinction coefficient (L gm -1 cm -1) for a 10 mg/mL (1%)
solution
b= the pathlength in cm (10 mm)
The following equation is used to convert g/100 mL to mg/mL concentrations:
c (mg/mL)= (A/E1%) *10
The relationship between percent extinction coefficient (E1%) and molar
extinction coefficient (Ext. Coeff) is:
E1% = (Ext. Coeff *10) / molecular weight of protein (Daltons)
Note: The Peptide app uses E 0.1% values whereas the Protein A280 app uses E
1% values.
The DeNovix software reports concentrations in mg/mL units for the Protein
A280, Labeled Protein and Peptide applications. The concentration is
determined based upon the absorbance value at the analysis wavelength used
for the measurement.
34Purified Protein, Peptides: Absorbance
Ratio Alerts
The DS-11 software v3.0 and above displays alerts icons within the Protein
A280 for samples with A260/280 purity ratios outside of specified maximum
limits. Tapping on the icon will pop-up a message with error specific
information.
In general, pure protein samples will have a ratio below 0.57. The default
software value that will trigger an alert is 0.7.
Users may elect not to have the alerts show or set custom limits using the Run
screen Overflow menu. The new limits may be used by all accounts, including
the General Account. Saved user-added limits may only be edited or deleted by
the account holder or an administrator account holder.
Note: The limit is only enforced for samples above a minimum concentration
value. A blue warning icon will be displayed when the sample concentration is
below the threshold.
358. Absorbance Colorimetrics App
BCA Bradford Lowry Pierce 660
!
Refer to the manufacturer of the assay reagent for assay specific instructions.
Quick Protocol
1. Launch the app from the Home screen.
2. Select the assay type on Run screen. Navigate to the Standard Curve screen.
3. Select the appropriate microvolume or cuvette mode prior to making the
Blank measurement.
4. Establish a Blank using the appropriate buffer or the 0.00 mg/mL standard.
5. Generate a new Standard Curve by measuring at least one replicate for a
minimum of 2 standard concentrations. Alternatively, apply a previously
saved curve selected from the drop-down menu.
6. Navigate to the Run screen. Enter a sample name.
• Optional: Enter a dilution factor to be applied to the reported
concentration.
7. Quantitate the sample using the Measure button.Notes:
• The Graph Flip button is available on the Run and Graph Screens in the
Colorimetrics and Custom Standard Curve apps. The flip option is not a available
when reviewing the results in the Data app. Only the absorbance style graphs will
be displayed.
• Standard Concentrations: Minimum 2, Maximum 8.
36Colorimetrics: Absorbance
Generating a Standard Curve
1. Use the drop-down menu on the Std Curve screen to select New Curve or to
import a saved standard curve or standard curve concentration list.
2. If the New Curve option is selected, tap the Enter Standards button to enable
a pop-up box to enter a list of standard concentrations for the current
measurement session.
• The table enables up to 7 standard concentrations in addition to the
predefined 0.00.
• The 0.00 concentration is used for the diluent (no analyte) plus the assay
reagent. Although not recommended, the 0.00 concentration may be
edited.
3. Measure at least one replicate of each standard concentration by
highlighting the standard concentration row and then tapping the Measure
button.
• Up to 5 replicates may be measured for each concentration. Use fresh
aliquots for each measurement when using the microvolume mode.
• The software will advance after each measurement until the fifth replicate
has been measured. If additional measurements are made, the fifth
position will be overwritten.
• A minimum of two standards must be measured before the Measure
button is active on the Run screen.
• Select a standard row or individual replicate then tap the Delete icon to
display a drop-down list of delete options.
• Use the Undo icon to restore the most recent edit or delete action.
37Colorimetrics:Absorbance
Line Fit
The average of the replicates is used to determine a best-fit trend line of the
data set. The trend line equation is applied to the sample absorbance values to
calculate concentrations.
Options include:
• Linear
• 2nd Order
• Interpolation: This option draws a straight line between each point.
Note: The software will extrapolate concentrations for samples with
absorbances 15% above the absorbance values associated with the highest
standard for linear fits only.
Saving a Standard Curve
A standard curve or a series of standard concentrations may be saved and
reused at a later date.
38Colorimetrics: Absorbance
• Use the List Add/Edit button to the right of the curve list drop-down menu to
save a curve or concentration list.
Editing a Standard Curve
• The curve is in an editable state when the Lock icon is green.
• When a previously saved curve or concentration list is imported, a red Lock
icon will appear. Tap the icon to unlock the curve data set to enable
modifications and new absorbance measurements.
• All modifications to a curve (new or saved) are effective immediately. It is
important to save a curve with a new name prior to making any changes if
you do not want to modify the original curve.
• The only way to recall absorbance data for a standard curve is to save the
results as a saved curve before exiting the app.
• Although all accounts may use any previously saved standard curve or saved
concentration list, only the curve account holder or an administrator may
modify or delete a saved curve or concentration list.
Exporting a Standard Curve
The standard curve replicate values may be exported using the Screen Capture
function described in the chapter entitled "Screen Capture and Export."
Note: The standard curve data is not available in a .csv format. Use the Screen
Capture function to export a .jpg showing the curve replicate values.
39Colorimetrics:Absorbance
BCA
The bicinchoninic acid assay (BCA assay) is used to quantify protein by
measuring the Cu-BCA chelate formed in the presence of protein.
• The reaction product is measured at 562 nm using a baseline correction at
750 nm.
Bradford
The Bradford assay is based upon a protein-induced absorbance shift of a
Coomassie Blue dye as a method to determine protein concentration.
• The reaction product is measured at 595 nm using a baseline correction at
750 nm.
Note: Some Bradford formulations may form particulates during prolonged
incubations. It is recommended that the cuvette option be used when using
these types of formulations. The particulates may interfere with the shorter
pathlengths used for the microvolume measurements.
Lowry
The modified Lowry assay is used to quantify proteins based upon the
absorbance of tetradentate copper-protein complexes.
• The reaction product is measured at 650 nm using a baseline correction at
405 nm.
Pierce 660
The Pierce 660 nm Protein Assay is used to measure a reddish-brown dye-
metal complex that changes to green upon protein binding.
• The reaction product is measured at 660 nm using a baseline correction at
750 nm.
409. Absorbance UV-Vis App
UV-Vis
!
The UV-Vis app is used to monitor up to 6 specific analysis wavelengths.
Absorbance values for all wavelengths from the user selected wavelength
ranges are saved for each measurement and can be exported as a .csv file using
the Export function from the Report or Graph screens.
Quick Protocol
1. Launch the UV-Vis application from the Home screen.
2. Establish a Blank using the appropriate buffer.
3. Enter the analysis nm in the first input field. This wavelength is used to
determine which pathlength is utilized by the SmartPath® technology for
microvolume measurements. Enter up to five additional wavelengths of
interest.
4. Enter a sample name.
5. Measure a fresh aliquot of sample using the Measure button.
Wavelength List
A list of between 1 to 6 wavelengths may be saved and recalled by using the
Overflow icon to the right of the wavelength list drop-down menu.
41UV-Vis
Wavelength Range Selection
There are two wavelength ranges available for the UV-Vis app. Use the
checkbox feature to select between the 220 to 750 nm or the 190 to 840 nm
options. Changing ranges will automatically save and then clear current results.
A new Blank is required when switching ranges.
Use the Custom Formula App to create a method that utilizes a user-defined
wavelength range.
Cursor Position
The UV-Vis app Run Screen graph includes an moveable cursor initially set at
the analysis wavelength. Moving the cursor allows the user to find the
absorbance value of any wavelength after a measurement is made.
Note: The cursor wavelength absorbance value is a temporary value not saved
by the software.
Baseline Correction
The baseline correction normalizes the entire spectrum using the absorbance
value of the wavelength specified and corrects for baseline offsets due to
sample particulates. The default selection is set to 750 nm for the UV-Vis app.
If a baseline correction is not used, the sample spectrum may be offset from the
baseline, resulting in a change in the reported sample concentration.
The baseline correction list is accessed from the Overflow icon. Once a baseline
correction nm is selected, it is applied to all subsequent measurements within
the same measurement session.
4210. Absorbance OD 600 App
OD 600
!
This application is generally used to determine the optical density of microbial
cell cultures at 600 nm. Conversions to cells per mL are based upon a user-
defined factor.
Quick Protocol
1. Launch the app from the Home screen.
2. Establish a Blank using the appropriate buffer.
3. Enter a sample name.
4. Enter a cell conversion factor (optional).
5. Measure a fresh aliquot of sample using the Measure button.
Notes:
•All cell type specific conversion factors are user-derived.
•Ensure culture is well mixed prior to sampling.
•Use fresh 1 uL aliquots for each microvolume measurement.
•Although microvolume OD 600 measurements can be made, the cuvette 10 mm
mode is recommended for this app. This option is available on the DS-11 FX +.
43OD 600
Unique Features
• A600: The OD 600 is a measure of the light scattered by the cell suspension
solution. Reported values may differ for the same sample measured on
different spectrophotometer systems as values are dependent on both the
cell type and the optical configuration of the spectrophotometer.
o It is recommended that an optimal harvest density and the linear
range of growth curves be empirically determined for each microbial
cell type when using a new spectrophotometer.
• Cell Number Conversion Factor: The cell number conversion factor is used to
convert the 600 nm value into the number of cells per mL for the sample by
multiplying the absorbance value by the factor. Cell numbers are reported in
terms of 1 * 108 cells. The factor must be entered into the appropriate field
prior to a measurement.
Note: The cuvette mode selection (i.e the path length) must be taken into
account when determining target OD 600 values or entering cell conversion
factors. When making microvolume measurements, the OD 600 values
reported and used for cell number calculations are 10 mm equivalent values.
Baseline Correction
As microbial cell culture OD 600 values are measurements of light scattering,
the DS-11 software does not use a bichromatic baseline normalization unless
specified as a user selection.
The baseline correction screen is accessed from the Overflow icon. Once a
baseline correction nm is selected, it is applied to all subsequent measurements
within the same measurement session.
4411. Absorbance Kinetics App
Kinetics
!
The Kinetics application is a cuvette mode only application available for the
DS-11+ and DS-11 FX+ models.
Quick Protocol
1. Launch the app from the Home screen.
2. Use the Create Method button on the Run screen to define the parameters of
the method.
• The button will change to a drop-down menu after at least one method
has been defined. Use the List Add/Edit button to the right of the drop-
down to define additional new methods or edit previously saved methods.
3. Navigate to the Run screen and tap the Heater button to preheat the cuvette
block to the selected temperature.
4. When the Heater temperature field displays the set temperature, insert the
cuvette and establish a Blank using the appropriate buffer.
5. Insert the cuvette with the sample solution and tap the Measure button.
Notes:
•Use cuvettes with Z heights of 8.5 mm. Use the light path arrow as a guide when
inserting a cuvette into the cuvette block.
•Use a quartz or UV transparent plastic cuvette when using methods that include the
UV wavelength range.
45Kinetics:Absorbance
Define Method Screen Features
• Method Name: A unique name is required for each method.
• Analysis nm: Enter the primary wavelength of interest for the method. The
absorbance value at this wavelength will be plotted versus time on the Trend
plot.
• Analysis nm 2: Optional 2nd wavelength of interest for the method. The
absorbance value at this wavelength will be plotted versus time on the Trend
plot.
• Wavelength Range: Define a range between 190 to 840 nm.
• Baseline Correction Wavelength: 750 nm is the general recommendation but
the optimal wavelength should be empirically determined.
• Heater Set Point: The heater may be set to temperatures between 37ºC to
45ºC.
Stage Selections
Up to three stages of timed intervals may be included for each method. The
parameters for each stage include:
• Delay: This is the time before the first measurement of each stage.
• Interval: This is the time between measurements. The minimum interval is 5
seconds.
• Duration: This is the cumulative time of the individual stage not including the
delay. A duration will be rounded down to to the nearest even multiple of the
interval.
Example: Interval = 10 seconds, Duration = 31 seconds
Duration rounded down to 30 seconds.
46Kinetics: Absorbance
Run Screen Features
• Method: Select the method of choice using the drop-down menu. Use the List
Add/Edit button to the right of the drop-down to create or edit methods. All
methods are available to all accounts. However, only the account holder or an
administrator may edit or delete a method.
• Graph Type Flip Button: Graph types may be switched during the run.
• Spectra: Absorbance vs wavelength
• Trend: Absorbance vs elapsed time for analysis wavelength(s)
• Heater Control: Tap the On/Off button to control the heater. The heater may
overshoot the method set point before reaching a equilibrium + 0.5ºC of the
set point.
• Timer: This feature is used to monitor the sample solution warm-up time. The
timer is used in a count-up only mode but is not used to track the
measurement time.
• Stop Button: A Stop button replaces the Measure button on the Run screen
during the Kinetics run. Tapping this button will end the measurement and
save all data accumulated up to that point. The Measure button will be
available when the run is finished.
• Results Table: A scrollable table with the absorbance values at the specified
wavelength(s) per time is displayed on the Run screen.
Heater Temperature
• The temperature display box is color-coded for quick reference:
• White: Heater is off.
• Yellow: Heater is on, heater is not at method set point.
• Orange: Heater is on, cuvette holder block has reached the method set
point within + 0.5ºC.
47Kinetics:Absorbance
Sample Solution Temperature
• The solution in the cuvette may not reach the set point as quickly as the
heater. Use the Run screen timer as a means of monitoring the elapsed
warm-up time. Below are estimated warm-up times.
Solution Start Temp 4ºC Room Temperature
Heater Set Point Temp 37ºC 45ºC 37ºC 45ºC
Warm-up Time (mins) 15 to 20 15 to 20 10 to15 10 to 15
The times were determined after a 10 mm plastic disposable cuvette filled with water
was inserted into the cuvette block already heated to the method set point. Actual
times may vary and should be empirically determined for each assay protocol.
• The temperature display box does not measure the temperature of the
solution in the cuvette.
Report, Graph, Trend Screens
• Report Screen: Unlike other DS-11 measurement apps, the results displayed
in the Kinetics Report screen list are associated with one assay run. Each
time a new assay run is initiated, the previous results will be saved and then
cleared from the Report, Graph and Trend screens. The cleared data may be
accessed using the Data app.
Note: It is normal for the software to sometimes experience minor delays in
reporting kinetics data information relative to the actual measurement time
point. The actual time each measurement is initiated is what is reported in the
Elapsed Time field.
• Graph Screen: Displays the absorbance for the method-defined wavelength
range for each time point.
• Trend Screen: Displays the absorbance vs. elapsed time for method-defined
analysis wavelength(s). Use the action bar timers to narrow the time points
for export or screen capture.
48You can also read