Physiological, Nutritional and Metabolomic Responses of Tomato Plants After the Foliar Application of Amino Acids Aspartic Acid, Glutamic Acid and ...
←
→
Page content transcription
If your browser does not render page correctly, please read the page content below
ORIGINAL RESEARCH
                                                                                                                                            published: 07 January 2021
                                                                                                                                         doi: 10.3389/fpls.2020.581234

                                             Physiological, Nutritional and
                                             Metabolomic Responses of Tomato
                                             Plants After the Foliar Application of
                                             Amino Acids Aspartic Acid, Glutamic
                                             Acid and Alanine
                                             Marina Alfosea-Simón 1 , Silvia Simón-Grao 1,2 , Ernesto Alejandro Zavala-Gonzalez 3 ,
                                             Jose Maria Cámara-Zapata 1 , Inmaculada Simón 1 , Juan José Martínez-Nicolás 1 ,
                         Edited by:          Vicente Lidón 1 and Francisco García-Sánchez 2*
                  Sakiko Okumoto,
 Texas A&M University, United States         1
                                              Escuela Politécnica Superior de Orihuela, Universidad Miguel Hernández, Orihuela, Spain, 2 Centro de Edafología y Biología
                       Reviewed by:          Aplicada del Segura, Consejo Superior de Investigaciones Científicas, Murcia, Spain, 3 Investigador Asociado al
                       Guillaume Pilot,      Departamento I+D Atlantica Agricola, Villena, Spain
         Virginia Tech, United States
                           Luigi Lucini,
                                             Agriculture is facing a great number of different pressures due to the increase in
     Catholic University of the Sacred
                            Heart, Italy     population and the greater amount of food it demands, the environmental impact due
                         Hiroshi Ezura,      to the excessive use of conventional fertilizers, and climate change, which subjects the
        University of Tsukuba, Japan
                                             crops to extreme environmental conditions. One of the solutions to these problems
                  *Correspondence:
            Francisco García-Sánchez         could be the use of biostimulant products that are rich in amino acids (AAs), which
                   fgs@cebas.csic.es         substitute and/or complement conventional fertilizers and help plants adapt to climate
                                             change. To formulate these products, it is first necessary to understand the role of
                   Specialty section:
         This article was submitted to       the application of AAs (individually or as a mixture) in the physiological and metabolic
                      Plant Physiology,      processes of crops. For this, research was conducted to assess the effects of the
               a section of the journal
            Frontiers in Plant Science
                                             application of different amino acids (Aspartic acid (Asp), Glutamic acid (Glu), L-Alanine
           Received: 08 July 2020
                                             (Ala) and their mixtures Asp + Glu and Asp + Glu + Ala on tomato seedlings
      Accepted: 07 December 2020             (Solanum lycopersicum L.). To understand the effect of these treatments, morphological,
       Published: 07 January 2021            physiological, ionomic and metabolomic studies were performed. The results showed
                             Citation:       that the application of Asp + Glu increased the growth of the plants, while those plants
    Alfosea-Simón M, Simón-Grao S,
                  Zavala-Gonzalez EA,        that received Ala had a decreased dry biomass of the shoots. The greatest increase in
         Cámara-Zapata JM, Simón I,          the growth of the plants with Asp + Glu was related with the increase in the net CO2
    Martínez-Nicolás JJ, Lidón V and
             García-Sánchez F (2021)
                                             assimilation, the increase of proline, isoleucine and glucose with respect to the rest of the
              Physiological, Nutritional     treatments. These data allow us to conclude that there is a synergistic effect between
        and Metabolomic Responses            Aspartic acid and Glutamic acid, and the amino acid Alanine produces phytotoxicity
     of Tomato Plants After the Foliar
  Application of Amino Acids Aspartic        when applied at 15 mM. The application of this amino acid altered the synthesis of
     Acid, Glutamic Acid and Alanine.        proline and the pentose-phosphate route, and increased GABA and trigonelline.
         Front. Plant Sci. 11:581234.
      doi: 10.3389/fpls.2020.581234          Keywords: metabolites, nutrients, minerals, gas exchange parameters, 1 H-NMR, organic acids, sugars

Frontiers in Plant Science | www.frontiersin.org                                    1                                        January 2021 | Volume 11 | Article 581234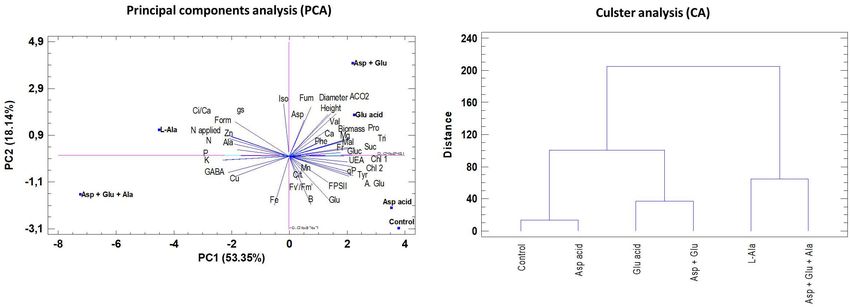
Alfosea-Simón et al.                                                                                            Foliar Aminoacid Application in Plants

INTRODUCTION                                                                (Glutamate, Cysteine, Phenylalanine, Glycine in soy Teixeira
                                                                            et al., 2017).
The tomato (Solanum lycopersicum L.) is one of the most-                        Despite the fact that as of today no doubts exist about the
consumed and demanded crops worldwide due to its great                      positive effects of the application of amino acids, as mentioned
nutritional and antioxidant properties. This high demand makes              above, little is known about the role played by each of these amino
it one of the most important crops at the social and economic               acids on the physiological and metabolic processes of plants. On
levels. In agreement with the statistics from the Food and                  many occasions, the biostimulant products are formulated from
Agriculture Organization [FAO] (2020), more than 180 million                the chemical hydrolysis of raw materials rich in amino acids
tons of tomato have been grown in the past year worldwide, of               (residues from the agro-food industry), but there is a lack of
which 24 million come from Europe. Spain is the second-most                 knowledge on their amino acid profile or what specific function
important producer in Europe, with an approximate production                they play in crops. Also, the application of biostimulant products
of 5 million tons per year.                                                 rich in amino acids can vary depending on the species, cultivar,
    Due to the increase in the world’s population since the                 climate, dose used, origin and application time (Parad̄iković
industrial revolution, the performance of the crops has had                 et al., 2019). Therefore, to create highly efficient biostimulant
to increase fast and exponentially to provide and answer to                 products, it is indispensable to understand what role the different
the demand for food; however, in the past few years, the                    amino acids play on the physiological and metabolic processes
production and quality of the harvest of various crops, among               of crops, and the possible antagonistic, neutral and synergistic
which we find tomatoes, have been greatly affected as a result of           effects between them.
climate change. The high temperatures and periods of drought,                   Amino acids such as Glutamic acid, Aspartic acid and
which have become more intense and prolonged, have affected                 Alanine are three of the amino acids used in the formulation
crop production (Wallace et al., 2003; Parry, 2019; Mutale-                 of biostimulant products (Colla et al., 2015). These are added in
Joan et al., 2020). Aside from the challenge faced by agriculture           their free form or as part of the raw materials from hydrolyzed
for increasing production in an era of climate change, we                   proteins. Glutamic acid is important in the metabolism of
also find another important challenge, such as the practice of              nitrogen, as it intervenes in the assimilation of nitrogen in
sustainable agriculture that affects the environment the least.             plants and in the reactions of amino transferases (Lea and
Thus, at present, new agronomic strategies are being designed               Ireland, 1999; Cao et al., 2010). This amino acid, aside from
and evaluated, which could help take on these challenges, starting          its intrinsic value as an amino acid itself, is the precursor
with the acquisition of basic scientific knowledge about the                of other amino acids such as Aspartic acid, Serine, Alanine,
physiological and metabolic processes of crops. As an alternative           Lysine and Proline, among others. Alanine is synthesized
to conventional agronomic strategies, such as the application of            from Glutamic acid, and its transamination with oxoglutarate
synthetic inorganic fertilizers, which could have damaging effects          produces glutamate and pyruvate, a reversible reaction, granting
on the environment, other more ecological alternatives are being            this amino acid a dual function between carbon and nitrogen
adopted (Foley et al., 2011; Tilman et al., 2002; Mutale-Joan et al.,       metabolism (Kendziorek et al., 2012). Lastly, this amino acid
2020). Among these new agronomic strategies, we find the use                is linked with the synthesis of chlorophylls and photosynthetic
of biostimulants (Lucini et al., 2015). It has been observed that           activity (Sánchez-Pale, 2017). Aspartic acid is obtained from a
the use of these products significantly improves the performance            transamination reaction between glutamate and oxaloacetate in
of crops, as they have beneficial effects on the physiological              plants, and is metabolized to produce the amino acids lysine,
processes of plants, such as the absorption of water and nutrients,         threonine, methionine, and isoleucine, in a series of reactions
among others (Mutale-Joan et al., 2020).                                    known as the Aspartic acid metabolic pathway. The application
    Biostimulants are composed of bioactive compounds such as               of these three amino acids to plants helps them to endure
humic acids, hydrolyzed proteins, seaweed and microorganism                 adverse environmental conditions such as drought, salinity and
extracts, among others (Rouphael et al., 2018). The hydrolyzed              heavy metal toxicity (Rai, 2002). However, up to the present,
proteins and seaweed extracts are a rich source of amino                    the effects of the individual application of these amino acids
acids, and these compounds tend to be added freely to enrich                on the physiology and the primary metabolism of plants, or
the biostimulant products, as they have very beneficial effects             the antagonistic or synergistic effects that could result from the
on the crops due to their role in the synthesis of proteins,                mixture of amino acids, are unknown. This knowledge could
vitamins, nucleotides and alkaloids, aside from having effects              be essential when designing biostimulants that contain amino
as elicitors (Khan et al., 2019). Some of the most important                acids, or even when selecting the raw materials for which the
effects described in the past few years are: (i) they palliate              profile of amino acids is better adapted to the requirements
the negative impact of certain environmental stresses such as               of a specific crop. For this, the objectives of the study were
drought (L-methionine in bitter gourd, Momordica charantia                  to understand the effects of the application of the amino acids
L.; Akram et al., 2020), salinity (mixture of amino acids in                Glutamic acid, Aspartic acid and Alanine, applied individually
tomato plants; Tantawy et al., 2009), Cd toxicity (Glutamate in             or as a mixture, on the physiological and metabolic processes,
rice; Jiang et al., 2020), (ii) they induce hormonal responses              and the nutritional state of tomato plants of the ‘Optima’
and improve the absorption of nitrogen (mixture of amino                    variety; and to discover if these changes stimulate the vegetative
acids and polypeptides in tomato, corn and peas; Colla                      growth of the plants. To characterize the metabolic state of
et al., 2014), (iii) they regulate the antioxidant metabolism               the plants, the 1 H-NMR omics technique was utilized, as it

Frontiers in Plant Science | www.frontiersin.org                        2                                   January 2021 | Volume 11 | Article 581234
Alfosea-Simón et al. Foliar Aminoacid Application in Plants
allows analyzing a great quantity of primary metabolites in a fast the adherence of the formulation to the leaves), and the pH was
and simple manner. adjusted to be 5.5 to 6.5. Therefore, the treatments applied were:
(1) Control treatment (without AAs, in which only ultrapure
water was pulverized on the tomato plants); and treatments with
MATERIALS AND METHODS the foliar application of the amino acids: (2) Asp, (3) Glu, (4)
L-Ala, (5) Asp + Glu, and (6) Asp + Glu + L-Ala. For each of
Growth Conditions and Plant Material the treatments, the concentrations of the equivalent nitrogen (mg
The experiment was performed on tomato plants (Solanum L−1 ) were: Asp 0.22, Glu 0.20, L-Ala 0.33, Asp + Glu 0.42, and
lycopersicum L.) of the ‘Optima’ variety, obtained from a Asp + Glu + L-Ala 0.75.
commercial seedling nursery (Babyplant S.L., Santomera, Murcia,
Spain), and planted in a tunnel greenhouse in an experimental Application of the Treatments
field from the CEBAS-CSIC, located in the municipality of The application of the treatments was performed foliarly, and
Santomera (18 Km from Murcia, Spain). The climatic conditions was done after two weeks of acclimation of the tomato plants.
in the interior of the greenhouse were: temperature day/nigh Each treatment was pulverized on the aerial part of the plants,
32/19 ± 3◦ C, photosynthetically active radiation (PAR) of so that the greatest foliar area was covered with the preparation.
1000 µmol m−2 s−1 , relative humidity of 52/80 ± 5% and a Within the greenhouse, the plants were divided into four blocks,
15 h photoperiod. and within each block, the treatments were applied to four plants,
The tomato seedlings, selected according to height and the which were considered as an experimental unit.
number of completely developed true leaves, were transplanted
to 3.5 L pots with a fine-grained “Universal” substrate, free of Gas Exchange Parameters
pathogens and weed seeds, composed of yellow and black peat,
After a week of treatment the following parameters were
coconut fiber and perlite, in a ratio of 5:4:1 (Projar professional,
measured: the net CO2 assimilation rate (ACO2 ), stomatal
2018, Spain) The irrigation was applied through of dripper system
conductance (gs ), the water use efficiency (WUE = ACO2 /Eleaf ,
of rate of 4 L h−1 .
where Eleaf corresponds to the value of leaf transpiration
With regards to fertigation management, Hoagland’s nutrient
obtained in each measurement), and the Ci/Ca ratio (where Ci
solution, composed of KNO3 (27 g 100 L−1 ), Ca(NO3 )2 (42 g
corresponds to the substomatal CO2 and Ca corresponds to
100 L−1 ), KH2 PO4 (7 g 100 L−1 ), MgSO4 (13 g 100 L−1 ), Fe-
external CO2 ). These parameters were measured in two plants
EDTA (1 g 100 L−1 ), and micronutrients (1 g 100 L−1 ; Hidromix
per treatment and block, in leaves that were completely developed
S, Valagro) was used in the irrigation. During the first week after
and healthy, in the morning (8:30am - 11:00am, using a portable
the transplantation, plants were irrigated with 50% Hoagland
gas analyzer for the measurement of gas exchange parameters
solution one minute per day. After this week, plants were
(PP System Ciras2, United Kingdom). During the measurements,
irrigated with 100% Hoagland solution two times per day, 5 min
the equipment was configured to maintain constant light (PAR:
during the morning and 5 min during the afternoon. The tap
1200 mmol m−2 s−1 ) and CO2 concentration (400 ppm) in the
water utilized for the preparation of the nutrient solution came
measurement chamber.
from Tajo-Segura water transfer, with an electrical conductivity
(EC) of 0.9 dS m−1 and pH of 8.2. When drainage in every
irrigation event was less than 15% irrigation time was increased. Chlorophyll Fluorescence and
Concentration Parameters
Amino Acids Utilized and Preparation The chlorophyll fluorescence parameters were measured in
The AAs utilized for the assays were Glutamic acid (Glu), the same plants utilized for the gas exchange measurements,
Aspartic acid (Asp) and Alanine (L-Ala) from Caldic Ibérica utilizing a portable pulse-modulated fluorometer FMS-2
(Barcelona, Spain). The selection of these three AAs and its (Hansatech Instruments Ltd., United Kingdom). The chlorophyll
doses was made according to previous experiments within fluorescence parameters measured were: the quantum efficiency
the framework of project RTC-2016-4568-2 carried out at the of PSII, (8PSII = (Fm 0 -Fs )/Fm 0 ; the antennae efficiency of PSII,
CEBAS-CSIC. The aim of this project was to study every one of Fv 0 /Fm 0 = (Fm 0 -F0 0 )/Fm 0 ; and the photochemical quenching
the 22 amino acids in different doses and mixtures in tomato co-efficient, qP = (Fm 0 -Fs )/(Fm 0 -F0 0 ), where Fs is the steady-state
plants. For each individual amino acid, a stock solution was fluorescence yield, Fm 0 is the maximal value when all reaction
first prepared with a final concentration of 7%. For this, 7 g centers are closed after a pulse of saturating light (12,000 µmol
of each amino acid were added to 100 mL of ultrapure water; m−2 s−1 for 0.8 s), and F0 0 is the minimal fluorescence in the
in the case of Glutamic acid and Aspartic acid, drops of 50% light-adapted state that is obtained by turning off the actinic
KOH were added to facilitate their dilution in water. After the light temporarily and applying a pulse of far-red light (735 nm)
preparation of the individual AAs (7%), the following treatments to drain the electrons from PSII. The chlorophylls were also
were prepared: 15 mM Aspartic acid (Asp), 15 mM Glutamic acid measured with a portable meter CL-01 (SPAD units- Hansatech).
(Glu), 15 mM Alanine (Ala), 15 mM Aspartic acid + 15 mM
Glutamic acid (Asp + Glu) and 15 mM Aspartic acid + 15 mM Growth Parameters
Glutamic acid + 15 mM Alanine (Asp + Glu + Ala). For each After the gas exchange and chlorophyll fluorescence
formulation, before their application, Tween-20 was added to measurements, the following measurements were taken:
a concentration of 0.1% (a surfactant compound that improves height and diameter of the stem at three different points in all
Frontiers in Plant Science | www.frontiersin.org 3 January 2021 | Volume 11 | Article 581234Alfosea-Simón et al. Foliar Aminoacid Application in Plants
the plants. Also, the number of flowers of each plant and the The resulting 1 H-NMR spectra were processed with the
percent of open flowers, after which the plants were harvested. Chenomx NMR Suite program version 8.3 (Chenomx,
In this sampling, the shoots of the plants were measured with a Edmonton, Canada), in order to identify and quantify the
precision Sartorius scale (Acculab), after which they were dried metabolites of interest. All the samples were calibrated with
in an oven at 60o C for at least 48 h (g dw shoot). From the the signal from the internal standard (IS), the deuterated
shoots, eight leaflets were collected from each plant, which were Trimethylsilylpropionic acid sodium salt (TSP-d4 ) and the
washed with de-ionized water; four of them were dry-processed pH was set to a value of around 6. The software utilized
for the nutritional study, and the other four were processed includes a broad range of spectrum data which can be utilized
fresh for the metabolomics study. The leaflets samples were to detect the metabolites that are over 5–10 µM: among the
taken from leaves that were completely developed, located metabolites that were found and/or quantified, the following
mid-height of the plant. are highlighted: Aspartate, Glutamate, Alanine, Glutamine,
Isoleucine, Valine, Tyrosine, Proline, Phenylalanine, Citrate,
Formate, Fumarate, Malate, Fructose, Glucose, Sucrose, GABA,
Determination of the Mineral Nutrients and Trigonelline (Duynhoven et al., 2013; Becerra-Martínez
Concentration in Leaf Tissue et al., 2017).
For the nutritional study, the previously dried and ground
samples were analyzed. The concentration of Na, K, Mg, Ca, Statistical Analysis
P, S, Fe, Cu, Mn, Zn and B was analyzed with inductively In this assay, the experimental design was one-factor
coupled plasma spectrometry (Iris Intrepid II, Thermo Electron (foliar application of the formulations) with a total of four
Corporation, Franklin, United States), after digestion with experimental units (n = 4), which consisted of 4 biological
HNO3 :H2 O2 (5:3 by volume), utilizing a microwave (CERM units each. The statistical analysis included a one-way
Mars Xpress, North Carolina, United States) with a temperature ANOVA with the SPSS program v24. When the ANOVA
ramp that reached 200◦ C in 20 min, and maintaining this was significant (p < 0.05), Duncan’s HSD test for the separation
temperature for 2 h. The total N and C was measured with a C/N of means was applied for p < 0.05. On the other hand,
elemental analyzer Thermo Finnigan (Milan, Italy). with the same statistics software, a Pearson’s correlation
matrix was performed, which measured the degree of
linear relationship between the variables. Also, to establish
Metabolic Analysis of Leaf Tissue the existence or not of significant differences between the
A “non-targeted” metabolic analysis was conducted in the fresh percent of metabolites compared with the control, a Student’s
leaf samples. These samples were ground with liquid nitrogen t-test was performed, for which the data were previously
with a mortar and pestle and lyophilized. Afterwards, the samples transformed through the arcsine of the root square of the value
were prepared for analysis according with the protocol by Van divided by one hundred.
der Sar et al. (2013). For this analysis, a Nuclear Magnetic A principal component analysis (PCA) and a cluster analysis
Resonance (NMR) system coupled to a 500 MHz Bruker (CA) were also performed. The cluster analysis was applied to the
spectrometer (Bruker Biospin, Rheinstetten, Germany) equipped standardized data for hierarchical associations employing Ward’s
with a broadband 5 mm N2 CryoProbe Prodigy BBO. All the method for agglomeration and the squared Euclidean distance as
tomato leaf extracts were measured at 300.1 ± 0.1 K without the dissimilarity measure.
rotation and with 4 test scans before the 32 scans performed
for the experiment.
The acquisition parameters were set in the following manner: RESULTS
the size of the FID = 64K, spectral band = 12.4345 ppm, receiver
gain = 28.5, acquisition time = 2.18 s, relaxation delay = 2s, and Vegetative Growth Parameters
line broadening = 0.50 Hz. The acquisition of data was performed The vegetative growth parameters were significantly affected
through the NOESY pulse sequence of pre-saturation (Bruker 1D, by the treatments applied. Without the exogenous application
noesypr1d) with water suppression through the irradiation of the of the AAs (control), the growth values were: a height of
water frequency during the recycling and mixing times. In the 37.5 cm, a stem diameter of 9.8 mm, and a dry weight of
procession of the samples and for each spectrum separately, a 19.1 g, respectively. The plants from the Asp + Glu treatment
reduction of noise is produced, based on the deconvolution of the had a shoot dry weight that was significantly greater than the
multi-level signal. Afterwards, a correction is performed of the rest of the treatments, increasing by 25% with respect to the
baseline, and to complete the process, an interpolation technique control plants. The plants with the least growth were those
of the areas of the signal is utilized. that were treated with the mixture of Asp + Glu + Ala,
All of this provides us with a “fingerprint” of the sample, with a decrease in growth of 76%. The dry weight of the
a general view of the metabolites that are most represented shoot decreased with the treatments in the following order:
produced by the cells at time of harvest, expressing the chemical Asp + Glu > Control = Asp > Glu = Ala > Asp + Glu + Ala.
shifts (δ) in parts per million (ppm). The NMR equipment detects As for the height, the plants treated with the Asp + Glu mixture
the signals and records them as frequency vs intensity graphic, were the tallest, but significant differences were only observed
known as the “acquisition spectrum”. with the Asp and Asp + Glu + Ala treatments. The plants
Frontiers in Plant Science | www.frontiersin.org 4 January 2021 | Volume 11 | Article 581234Alfosea-Simón et al. Foliar Aminoacid Application in Plants
with the thickest stems were those that were treated with Glu, Physiological Study
but significant differences were only observed with Asp and For the parameters of gas exchange, it was observed that
Asp + Glu + Ala (Figure 1). the plants without the exogenous application of AAs had the
following values: ACO2 14.4 µmol m−2 s−1 , gs 231.9 mmol
m−2 s−1 , Ci/Ca 0.65, and WUE 6.09 µmol mmol−1 (Figure 2). In
all the parameters assayed, significant differences were observed
with the treatments. The plants with the greatest net CO2
assimilation rate were those from the Asp + Glu treatment,
although without significant differences found with respect
to the Glu-treated plants. The lowest values were found in
plants from the Asp + Glu + Ala treatments (although not
significant with respect to the control and L-Ala). With respect
to the gs and Ci/Ca parameters, the control plants and those
treated with Asp had values that were significantly lower than
those from the rest of the treatments, while for WUE, the
lowest values were found in plants treated with Glu, L-Ala and
Asp + Glu + Ala.
The exogenous application of AAs did not affect neither
the quantum efficiency of PSII (8PSII ) nor the photochemical
quenching co-efficient (qP). However, significant differences
were observed between the treatments for the antennae efficiency
parameter, in that the plants from the Asp treatment had the
highest value, being significant with respect to those found in the
Glu and Ala treatments.
As for the concentration of chlorophylls, for the
completely developed leaves (DL) as well as the buds
(LB), significant differences were observed among the
treatments (Figure 3). The control plants had chlorophyll
values for DL and LB of 33.9 and 47.0 (SPAD values),
respectively. The plants that were treated with Asp acid
had the highest values of DL and LB, being significant for
all the treatment in DL, and as compared to the control
plants, and the Ala and Asp + Glu + Ala treatments
for LB.
Ionomic Study
For the plants that were not foliarly treated with AAs, the
concentration of the macronutrients Ca, K, Mg, Na and P were
2.66, 2.95, 0.72, 0.19, 0.31, and 3.97 g 100 g−1 dw, respectively
(Table 1). The concentration of Ca and Mg did not change due to
the application of the AAs treatments with respect to the control
treatment. However, significant differences were observed for
K, P and N. These differences were due to the concentration
of these nutrients increasing in the Ala and Asp + Glu + Ala
treatments with respect to the other treatments with AAs and
the control.
The micronutrients results showed that for the control plants,
the concentrations of B, Cu, Fe, Mn, and Zn were 47.8, 8.7, 171.2,
71.7, and 23.1 ppm, respectively (Table 1). In this case, there were
FIGURE 1 | Growth parameters: height (cm) (A), diameter stem (mm) (B) and
shoot (g dw) (C), measured in the ‘Optima’ variety of tomato after a week from
significant differences in the concentrations of Cu, Fe, Mn and
the exogenous application of the treatment with AAs: Control (without AAs), Zn. For Cu, these differences were due to the two-fold increase
Aspartic acid (Asp ac.), Glutamic acid (Glu ac.), L-Alanine (L-Ala), combination in concentration of the plants treated with Asp + Glu + Ala
Asp + Glu and combination Asp + Glu + Ala. In the ANOVA: ** and *** indicate as compared to the rest of the treatments. The concentration
significant differences at p < 0.01 and p < 0.001, respectively. The different
of Fe oscillated between 171.2 ppm (control) and 104.85 (Glu
lower case letters indicate significant differences (p < 0.05) between the
means established by Duncan’s test (n = 4).
and Asp + Glu), of Mn between 93.3 (Asp) and 67.5 (L-Ala),
and of Zn between 36.8 (L-Ala and Asp + Glu + Ala) and
Frontiers in Plant Science | www.frontiersin.org 5 January 2021 | Volume 11 | Article 581234Alfosea-Simón et al. Foliar Aminoacid Application in Plants
FIGURE 2 | Gas exchange parameters: net CO2 assimilation rate (ACO2 ) (A), stomatal conductance (gs ) (B), Ci/Ca ratio (Ci corresponds to the substomatal CO2
and Ca correspond to external CO2 ) (C) and water use efficiency (WUE) (D), measured in the ‘Optima’ variety of tomato after a week from the exogenous application
of the treatment with AAs: Control (without AAs), Aspartic acid (Asp ac.), Glutamic acid (Glu ac.), L-Alanine (L-Ala), combination Asp + Glu and combination
Asp + Glu + Ala. In the ANOVA: *** indicate significant differences for p < 0.001. The different lower case letters indicate significant differences (p < 0.05) between
the means established by Duncan’s test (n = 4).
23.1 (Control), with significant differences observed between the and the Asp + Glu + Ala mixture) decreased its concentration,
maximum and minimum values. moving from 6.83 mg g−1 dw from the control plants to
2.5 mg g−1 dw, while the treatments Asp, Glu and their mixture
Metabolomic Study (Asp + Glu) increased it, reaching the highest concentration in
Amino Acids the mixture of 10.02 mg g−1 dw. The concentration of Alanine
The AAs detected with 1 H-NMR in tomato plants were Aspartate, increased in the plants treated with this AA foliarly (L-Ala and
Glutamate, Alanine, Tyrosine, Valine, Glutamine, Isoleucine, Asp + Glu + Ala), and the Asp + Glu mixture, with the highest
Phenylalanine and Proline. Of these AAs, in the control plants, concentration measured in the plants treated with L-Ala. The
the ones that added up to 98% of the total AAs detected were, concentration of Tyrosine decreased with the application of L-Ala
in decreasing order, Glutamate (38%), Proline (30%), Glutamine and Asp + Glu + Ala. Likewise, the concentration of Isoleucine
(20%) and Aspartate (10%) (Table 2, Supplementary Figure 1). decreased with the application of Asp + Glu, in relation to the
Of all the AAs measured, significant differences were observed control plants (Table 2).
with the treatments assayed, for Glutamate, Proline, Alanine, As for the relative distribution of the AAs, it was
Tyrosine and Isoleucine. In the case of glutamate, it was observed observed that in general, the treatments followed a model
that the application of L-Ala, Asp + Glu and Asp + Glu + Ala that was similar to the control plants, as previously
decreased its concentration with respect to the control, with the commented, with some differences. The application of Asp,
lowest values observed in plants treated with Asp + Glu + Ala. Glu and their mixture resulted in the % proline being
In the case of Proline, the treatments which included L-Ala (L-Ala higher than that of glutamate; and in the Asp + Glu
Frontiers in Plant Science | www.frontiersin.org 6 January 2021 | Volume 11 | Article 581234Alfosea-Simón et al. Foliar Aminoacid Application in Plants FIGURE 3 | Chlorophyll fluorescence: antennae efficiency of PSII (Fv0 /Fm0 ) (A), quantum efficiency of PSII (8PSII ) (B), photochemical quenching co-efficient (qP) (C) and chlorophylls (Chl) measured in completely developed leaves (DL) (D) and leaf buds (LB) (E), parameters measured in the ‘Optima’ variety of tomato after a week from the exogenous application of the treatment with AAs: Control (without AAs), Aspartic acid (Asp ac.), Glutamic acid (Glu ac.), L-Alanine (L-Ala), combination Asp + Glu and combination Asp + Glu + Ala. In the ANOVA: ‘ns’ indicates non-significant differences for a confidence interval of 95%; on their part, *, **, and *** indicate significant differences at p < 0.05, p < 0.01, and p < 0.001, respectively. The different lower case letters indicate significant differences (p < 0.05) between the means established by Duncan’s test (n = 4). mixture, the % of L-Ala overcame that of Glutamine Organic Acids (Supplementary Figure 1). On the other hand, the percentage The organic acids quantified with 1 H-NMR were malate, of glutamine was higher than that of proline in the L-Ala and citrate, fumarate and formate (Figure 4, Supplementary Asp + Glu + Ala treatments. Figure 2). Among these, the most common was malate, whose Frontiers in Plant Science | www.frontiersin.org 7 January 2021 | Volume 11 | Article 581234
Alfosea-Simón et al.                                                                                                                       Foliar Aminoacid Application in Plants

TABLE 1 | Concentration of macro (g 100 g−1 dw) and micronutrients (ppm) quantified in leaves from the ‘Optima’ variety of tomato after a week from the exogenous
application of the treatment with AAs: Control (without AAs), Aspartic acid (Asp ac.), Glutamic acid (Glu ac.), L-Alanine (L-Ala), combination Asp + Glu and combination
Asp + Glu + Ala.

                                                                                         Macronutrients (g 100 g−1 dw)

Treatments                             Ca                              K                                 Mg                             P                              N

Control (without AAs)               2.66 ± 0.06                     2.95 ± 0.04 cd                 0.72 ± 0.03                     0.31 ± 0.02bc                   3.97 ± 0.15b
Asp Ac.                             2.73 ± 0.19                     2.85 ± 0.19 cd                 0.67 ± 0.07                     0.39 ± 0.04b                    4.49 ± 0.43b
Glu Ac.                             2.62 ± 0.20                     2.72 ± 0.01d                   0.71 ± 0.03                     0.28 ± 0.01c                    3.88 ± 0.27b
L-Ala                               2.92 ± 0.23                     4.50 ± 0.12b                   0.66 ± 0.05                     0.63 ± 0.04a                    6.08 ± 0.24a
Asp + Glu                           2.66 ± 0.21                     3.33 ± 0.22c                   0.71 ± 0.04                     0.40 ± 0.04b                    4.77 ± 0.17b
Asp + Glu + Ala                     2.05 ± 0.16                     5.42 ± 0.25a                   0.64 ± 0.08                     0.70 ± 0.02a                    6.47 ± 0.30a
ANOVA                                  ns                              ***                             ns                               ***                            ***

                                                                                               Micronutrients (ppm)

Treatments                             B                             Cu                                Fe                             Mn                             Zn

Control (without AAs)               47.8 ± 1.3                       8.7 ± 1.3b                   171.2 ± 22.2a                    71.7 ± 0.9bc                    23.1 ± 0.7c
Asp Ac.                             45.4 ± 1.2                      11.8 ± 0.6b                   121.9 ± 12.5bc                   93.3 ± 2.3a                     29.3 ± 1.7b
Glu Ac.                             43.7 ± 0.7                       9.3 ± 0.9b                   104.7 ± 2.9c                     84.8 ± 1.9ab                    29.8 ± 1.9b
L-Ala                               38.8 ± 2.8                      11.3 ± 1.0b                   125.5 ± 8.3bc                    67.5 ± 2.6c                     37.1 ± 2.7a
Asp + Glu                           40.9 ± 4.7                       8.9 ± 0.9b                   105.0 ± 9.5c                     76.6 ± 6.7bc                    30.2 ± 3.1b
Asp + Glu + Ala                     45.5 ± 5.2                      22.7 ± 2.5a                   154.2 ± 14.2ab                   83.4 ± 6.5ab                    36.4 ± 1.6a
ANOVA                                  ns                              ***                               **                             **                             **

In the ANOVA: ‘ns’ indicates non-significant differences for a confidence interval of 95%; on their part, ** and *** indicate significant differences at p < 0.01 and p < 0.001,
respectively. The different lower case letters indicate significant differences (p < 0.05) between the means established by Duncan’s test (n = 4).

TABLE 2 | Concentration of amino acids (mg g−1 dw) quantified by NMR in leaves from the ‘Optima’ variety of tomato after a week from the exogenous application of the
treatment with AAs: Control (without AAs), Aspartic acid (Asp ac.), Glutamic acid (Glu ac.), L-Alanine (L-Ala), combination Asp + Glu and combination Asp + Glu + Ala.

                                                                                     Amino Acids (mg g−1 dw)

Treatments              Glutamate             Proline       Glutamine        Aspartate         Alanine        Phenylalanine    Valine            Tyrosine         Isoleucine

Control (without        7.85 ± 0.68a        6.83 ± 0.26c 4.68 ± 0.46 2.50 ± 0.26              0.60 ± 0.05cd     0.26 ± 0.03   0.25 ± 0.03        0.19 ± 0.03a      0.15 ± 0.03b
AAs)
Asp Ac.                 6.58 ± 0.42abc      8.63 ± 0.37b 4.89 ± 0.58 2.43 ± 0.23              0.56 ± 0.01cd     0.22 ± 0.03   0.24 ± 0.02        0.18 ± 0.04a      0.14 ± 0.03b
Glu Ac.                 6.75 ± 0.70ab       8.13 ± 0.71b 4.02 ± 0.57 2.36 ± 0.23              0.48 ± 0.02d      0.30 ± 0.03   0.22 ± 0.03        0.15 ± 0.04ab     0.21 ± 0.04b
L-Ala                   5.05 ± 0.19cd       2.47 ± 0.17d 3.15 ± 0.48 2.31 ± 0.16              1.44 ± 0.07a      0.18 ± 0.02   0.21 ± 0.02        0.06 ± 0.01b      0.20 ± 0.04b
Asp + Glu               5.54 ± 0.26bcd 10.02 ± 0.22a 2.82 ± 0.47 3.55 ± 0.42                  0.66 ± 0.01c      0.27 ± 0.02   0.31 ± 0.03        0.13 ± 0.03ab     0.34 ± 0.04a
Asp + Glu + Ala         4.31 ± 0.43d        2.59 ± 0.04d 3.33 ± 0.40 2.53 ± 0.25              0.93 ± 0.03b      0.25 ± 0.02   0.21 ± 0.03        0.07 ± 0.01c      0.21 ± 0.04b
ANOVA                        **                    ***         ns              ns                ***              ns            ns                    *                 *

In the ANOVA: ‘ns’ indicates non-significant differences for a confidence interval of 95%; on their part, *, **, and *** indicate significant differences at p < 0.05, p < 0.01,
and p < 0.001, respectively. The different lower case letters indicate significant differences (p < 0.05) between the means established by Duncan’s test (n = 4).

concentration comprised 80% of the total acids quantified,                                   AAs treatments except for Asp. The greatest concentration was
followed by citrate with 12%, with fumarate and formate being                                found for the Asp + Glu + Ala mixture, without significant
minor constituents. Thus, the concentration of malate increased                              differences observed with Asp + Glu and L-Ala. Despite the
with the application of Glu, and decreased in the plants from                                changes produced by the application of the AAs, the relative
the L-Ala, Asp + Glu and Asp + Glu + Ala treatments, with                                    distribution of these in each treatment followed the same
respect to the control plants, reaching a concentration that was                             model as the one described previously for the control plants
lower in the last treatment (Figure 4). The concentration of                                 (Supplementary Figure 2).
citrate decreased in all the treatments except for L-Ala, where
no significant differences were found with respect to the control.                           Sugars
The concentration of fumarate increased with the application                                 The sugars quantified with 1 H-NMR in the leaves of the
of all the amino acids, with the highest value reached with                                  tomato plants were fructose, sucrose and glucose. Of
the Asp + Glu mixture. The same trend was observed in                                        these, the most commonly quantified was fructose (44.5%),
the shoot concentration of formate, which increased in all the                               followed by sucrose (31.5%) and glucose (24.0%) (Figure 5,

Frontiers in Plant Science | www.frontiersin.org                                         8                                           January 2021 | Volume 11 | Article 581234
Alfosea-Simón et al. Foliar Aminoacid Application in Plants
FIGURE 4 | Concentration of organic acids (mg g- 1 dw): malate (A), citrate (B), fumarate (C), and formate (D), quantified by NMR in tomato leaves from the
‘Optima’ variety of tomato after a week from the exogenous application of the treatment with AAs: Control (without AAs), Aspartic acid (Asp ac.), Glutamic acid (Glu
ac.), L-Alanine (L-Ala), combination Asp + Glu and combination Asp + Glu + Ala. In the ANOVA: ** and *** indicate significant differences for p < 0.01 and 0.001,
respectively. The different lower case letters indicate significant differences (p < 0.05) between the means established by Ducan’s test. The vertical bar indicates the
standard error of the mean (n = 4).
Supplementary Figure 3). For all of them, it was observed that normal conditions, without the application of AAs, the tomato
all the treatments affected their concentration. For fructose, the plants have values of 0.92 mg g−1 dw for GABA and 0.71 mg
concentration increased with the application of Glu, while it g−1 dw for Trigonelline. In both cases, it was observed that the
decreased with the application of L-Ala and Asp + Glu + Ala, ANOVA was significant for the treatments. The application of
as compared to the control plants. For sucrose, the only the Asp + Glu + Ala mixture increased the concentration of
significant difference observed between the treatments was GABA with respect to the rest of the treatments, increasing from
the increase in its concentration in plants from the Asp 1.15 mg g−1 dw for the control treatment to 1.82 mg g−1 dw
treatment, as compared to the application of Asp + Glu + Ala. for this treatment. The concentration of Trigonelline decreased
The concentration of glucose decreased with the application with the application of L-Ala and Asp + Glu + Ala, with the
of Asp, Glu, L-Ala and Asp + Glu + Ala, with the L-Ala concentration being the lowest in the latter treatment.
treatment having the lowest value. The relative distribution of
these three sugars did not change in the AAs treatments with Principal Components Analysis (PCA)
respect to the control treatment, as commented previously,
and Cluster Analysis
except for the application of L-Ala, which resulted in a greater
For a better and simpler visual interpretation of all the data,
percentage of sucrose as compared to the percentage of fructose
a principal component analysis and a cluster analysis were
(Supplementary Figure 3).
conducted (Figure 7). The first four components explained
93.75% of the variability, and the first three, represented by
Other Metabolites PC1, PC2 and PC3, explained 84%. The PC1 component
The 1 H-NMR analysis also detected and quantified 4- explained 53.35% of the variability observed, thus showing that
Aminobutyrate (GABA) and Trigonelline (Figure 6). In the variability was fundamentally due to WUE, qP, K, Mg, P,
Frontiers in Plant Science | www.frontiersin.org 9 January 2021 | Volume 11 | Article 581234Alfosea-Simón et al. Foliar Aminoacid Application in Plants
DISCUSSION
Amino acids in plants are involved in primary and secondary
metabolism, and participate in a wide range of cellular
enzymatic reactions as constituents of different enzymes such
as aminotransferases, dehydrogenases, lyases and decarboxylases.
Therefore, they can have an influence on diverse phenological
and physiological processes such as vegetative development of
the plants, seed germination, fruit maturation, signaling and
activation of defense systems against abiotic and biotic stresses,
osmotic adjustment, deactivation of reactive oxygen species, and
as a reserve source of nitrogen, among others (Teixeira et al.,
2017). These important functions of the AAs in plants lead
to the application of biostimulant products containing AAs,
either added in their free form or added as botanical and
seaweed extracts and hydrolyzed proteins, becoming a common
practice in agriculture (Khan et al., 2019). Nevertheless, in order
for the biostimulant products to become more efficient in the
improvement of the agronomic performance of the crops, and so
that they can be specifically formulated depending on the crop
varieties, it necessary to understand the function of each amino
acid in each crop, to identify antagonistic, synergistic or neutral
effects among the amino acid mixtures, and to determine the
doses and the best time of application.
In our experiment, it was observed that the foliar application
of AAs can alter the vegetative growth of the plants. However,
this effect was dependent on the AAs utilized for the preparation
of the products applied. According to the shoot dry weight data
(Figure 1), the best treatment found from all those applied was
the Asp + Glu mixture. And, taking account that the application
of these two AAs individually did not affect this parameter or
even decreased it, as in the Glu treatment, relative to the control
plants, it was concluded that there was a synergistic effect these
two AAs. The opposite behavior was found for the plants to which
L-Ala was applied individually or as part of a mixture. In this case,
it became apparent that L-Ala was harmful to tomato plants when
applied at a concentration of 15 mM. In addition, when mixed
with Asp + Glu, its negative effect was enhanced, as observed in
the decrease in dry weight of the shoot as well as the appearance
of damage to the leaves (Figure 1). Some synergic effects between
AAs has been previously reported. In an experiment conducted
with this same tomato variety under saline conditions (Alfosea-
FIGURE 5 | Concentration of sugars (mg g- 1 dw): fructose (A), Sucrose (B), Simón et al., 2020), it was observed that the Pro + Glu and
and glucose (C), quantified by NMR in tomato leaves from the ‘Optima’ variety Met + Trp mixtures were more efficient in palliating the effects
of tomato after a week from the exogenous application of the treatment with of salinity as compared to the individual application of these
AAs: Control (without AAs), Aspartic acid (Asp ac.), Glutamic acid (Glu ac.),
AAs. Despite the positive effects of the application of Glutamic
L-Alanine (L-Ala), combination Asp + Glu and combination Asp + Glu + Ala. In
the ANOVA: * and *** indicate significant differences for p < 0.05 and 0.001, or Aspartic acids being observed on several occasions, such as in
respectively. The different lower case letters indicate significant differences Kimchi plants grown in low temperatures (Lee et al., 2017) or rice
(p < 0.05) between the means established by Ducan’s test. The vertical bar under an excess of Cd (Rizwan et al., 2017), the positive effects of
indicates the standard error of the mean (n = 4). these two AAs applied simultaneously had never been previously
described. On the other hand, plants from Asp + Glu + Ala
applications received three times more amino acid content
compared to those from individual Asp, Glu and Ala spraying,
N, Glutamic acid, Proline, Tyrosine, Sucrose, GABA, Formate, and 1.8 time more relative to Asp + Glu treatment. Thus, the
and Trigonelline. The cluster analysis showed that L-Ala, and excess of aminoacid content in the spraying Asp + Glu + Ala
Asp + Glu + Ala treatments were more different to the solution could have damaged the plants. In several cases, for
rest of treatments. instance, in Arabidopsis plants, it has been shown that amino
Frontiers in Plant Science | www.frontiersin.org 10 January 2021 | Volume 11 | Article 581234Alfosea-Simón et al. Foliar Aminoacid Application in Plants
FIGURE 6 | Concentration of GABA (A) and Trigonelline (B) (mg g- 1 dw) quantified by NMR in tomato leaves from the ‘Optima’ variety of tomato after a week from
the exogenous application of the treatment with AAs: Control (without AAs), Aspartic acid (Asp ac.), Glutamic acid (Glu ac.), L-Alanine (L-Ala), combination Asp + Glu
and combination Asp + Glu + Ala. In the ANOVA: *** indicates significant differences for p < 0.001. The different lower case letters indicate significant differences
(p < 0.05) between the means established by Ducan’s test. The vertical bar indicates the standard error of the mean (n = 4).
FIGURE 7 | Principal component analysis (PC1 and PC2) (A) and Cluster analysis (CA) (B) in tomato leaves from the ‘Optima’ variety of tomato after a week from the
exogenous application of the treatment with AAs: Control (without AAs), Aspartic acid (Asp ac.), Glutamic acid (Glu ac.), L-Alanine (L-Ala), combination Asp + Glu
and combination Asp + Glu + Ala.
acids as low as 100 µM applied via root caused damage in the root those from the Asp + Glu treatment. Thus, the simultaneous
growth (Ravelo-Ortega et al., 2021). Thus, low concentrations of effect of Asp + Glu could have enhanced the biochemical
amino acids in some plant species can have un-expected effects. reactions of photosynthesis. This has already been reported by
One of the reasons why the plants treated with Asp + Glu Lee et al. (2017) with the foliar application of Glutamic acid,
had a greater growth can be found in the results from the with positive effects observed on the photosynthetic rate and
physiological study. In this study (Figure 8), it was observed that stomatal conductance. In an experiment carried out in rice plants
one of the common responses of the plants when treated with under conditions of cadmium stress, it was determined that
any AAs treatment was the increase in stomatal conductance the foliar application of Asp also improved the photosynthetic
(gs ). However, this generalized response was not observed in rate and stomatal conductance (Rizwan et al., 2017). In our
the ACO2 . The only plants that had an increase in the CO2 experiment in tomato plants, the simultaneous application of
assimilation rate, in parallel to the opening of stomata, were Asp + Glu was necessary to enhance ACO2 . In addition, in these
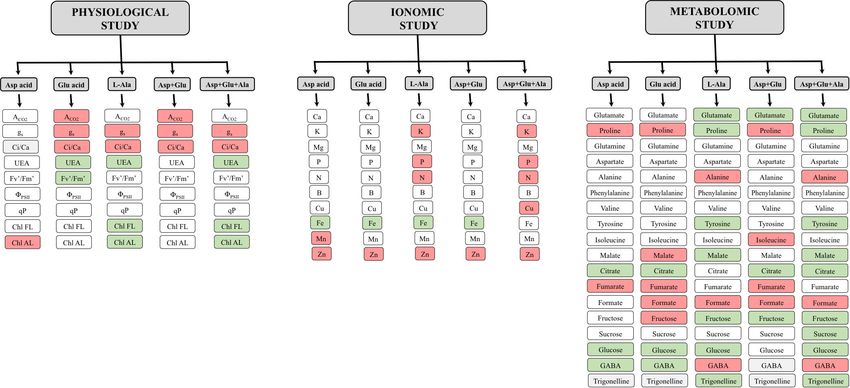
Frontiers in Plant Science | www.frontiersin.org 11 January 2021 | Volume 11 | Article 581234Alfosea-Simón et al. Foliar Aminoacid Application in Plants FIGURE 8 | Summary of the relative results with respect to the control obtained after the foliar application of the AA treatments: Control (without AAs), Aspartic acid (Asp ac.), Glutamic acid (Glu ac.), L-Alanine (L-Ala), combination Asp + Glu and combination Asp + Glu + Ala. The red or green color indicate a significant increase or reduction, respectively, of the concentration of the metabolite in plants from the AA treatments compared with the control treatment. The white color indicates that no significant differences were found between the control and the corresponding AA treatment. plants, ACO2 and gs had similar increases (as a percentage), K, P and N concentration. This could be due to a concentration relative to control plants. Thus, the WUE was maintained similar effect, as the dry weight of the shoot decreased. However, as this to the control plants, resulting in the maintenance of a good effect was not observed in the concentration of Ca and Mg, it balance between the CO2 captured and water lost by the plants. should not be discarded that the L-Ala amino acid could have On the other hand, the application of L-Ala seems to have influenced the absorption and transport of the nutrients in plants. altered the non-stomatal factors of photosynthesis (biochemical Nevertheless, the increase in K, P and N with respect to Ca factors), as indicated by the decrease in the assimilation rate and Mg could have created nutritional imbalances which may of CO2 in plants treated with L-Ala and Asp + Glu + Ala in have caused a decrease in the growth of the shoots. Another parallel to the decrease in the Ci/Ca ratio (Farquhar and Sharkey, possible reason for the highest leaf N concentration observed in 1982). In plant cell culture studies, evidence has been shown the Asp + Glu + Ala treated plants could be due to the high N about the harmful effects of L-Alanine. Chen et al. (2006) in concentration (0.75 mg N L−1 ) of the solution sprayed relative to cell cultures of V. labrusca and V. vinifera observed that the the rest of treatments. application of L-Ala to the growth media caused the death of In the metabolomics study, it was observed that the most cells due to the activation of Phenylalanine ammonium lyase, significant change observed after the application of the AAs 4-hydroxylase cinnamic acid, the expression of the stilbene Aspartic acid, Glutamic acid and their Asp + Glu mixture, synthase gene, and the accumulation of stilbenes. Nevertheless, occurred in the concentration of Proline. The Asp and Glu the applications of L-Ala to crops has barely been studied, except treatments, and their Asp + Glu mixture increased the in the Plumbago indica crop, where the application of Alanine concentration of this amino acid, and this increase was greater (5mM) combined with chitosan (150 mg L−1 ) improved its with the Asp + Glu mixture. Proline is an AA with multiple production (Jaisi and Panichayupakaranant, 2020). functions. It has the ability to act as an osmoprotector, and The ionomics study indicated that the AAs applied to the plays a role in osmotic adjustment, deactivation of free oxygen tomato plants of the variety ‘Optima’ did not induce changes radicals, regulation of the absorption of nutrients, and can in the absorption of nutrients relative to control plants, as the also induce the CO2 assimilation rate (Pervaiz et al., 2019). concentrations of macronutrients and micronutrients in plants These functions are especially important when the plants suffer from any of the treatments were within the normal range for this adverse environmental conditions. In the Mediterranean area, crop (Watanabe et al., 2016). However, some foliar treatments the typical greenhouse conditions can make temperature be a with amino acids are able to increase or decrease the absorption limiting factor in tomato cultivation. Therefore, the increase of of diverse macronutrients and micronutrients as indicated by proline in these plants could have exerted a protective role that Sainju et al. (2003). The data from our experiment showed that favored the increase in the CO2 assimilation rate and the plant’s the plants treated with L-Ala (L-Ala and Asp + Glu + Ala) had growth. In addition, glutamate, aside from being a precursor an altered nutritional status as in these plants it was increased the of proline, is also related to the production of glutathione Frontiers in Plant Science | www.frontiersin.org 12 January 2021 | Volume 11 | Article 581234
Alfosea-Simón et al.                                                                                            Foliar Aminoacid Application in Plants

and arginine. These two compounds are involved in oxidative                 concentration of glucose at similar values as those of the control,
metabolism, directly as glutathione or indirectly as arginine,              the individual application decreased its concentration. This
as they activate PAL activity (Ben-Rejeb et al., 2014; Zheng                could indicate that the simultaneous application of Asp + Glu
et al., 2011). On the contrary, the application of L-Ala and                improved the capture and assimilation of CO2 in the plants,
Asp + Glu + Ala decreased the concentration of proline, and                 improving the growth of these plants, where proline could have
this response coincided with a decrease of ACO2 and decreased               played an important role in increasing the performance of the
shoot growth. These results suggest that Asp + Glu improved                 photosynthetic system. For the tricarboxylic acid pathway, it
the physiological and morphological parameters of the plants                was observed that the application of this Asp + Glu treatment
through the synthesis of proline, while Ala altered the metabolism          induced a reduction in the concentration of citrate, and an
of the plants by reducing the concentration of proline, and                 increase in the concentration of fumarate, which could have
therefore reducing their growth.                                            modulated the ACO2 and gs regulation in plants under this
    In plants, the AAs Glutamate and Aspartate are precursors               treatment. Some studies have revealed a negative correlation
of up to eleven AAs. The reaction of Glutamate + Oxaloacetate               between the concentrations of fumarate and gas exchange
produces Aspartate + α-ketoglutarate. This reaction is reversible,          through the opening of stomata (Nunes-Nesi et al., 2007;
so that in the biosynthesis pathways, the AAs from glutamate                Araújo et al., 2012).
(such as Alanine, Valine, Leucine, Glutamine, Proline and                       Another of the responses that differentiated the treatments
Arginine) are connected with those from Aspartate (such as                  that contained L-Ala with those that did not have this AA,
Asparagine, Methionine, Threonine, Isoleucine and Lysine)                   was observed in the concentrations of GABA and Trigonelline.
(Forde and Lea, 2007). The application of Glutamate and                     The GABA increased while the Trigonelline decreased with
Aspartate and their mixture did not increase the foliar                     respect to the control, and this response was greater when L-Ala
concentration of these AAs, but were metabolized to increase                was applied with the Asp + Glu mixture. GABA is a non-
the concentration of proline. Instead, the application of L-Ala             protein amino acid with multiple functions in plants, playing
individually or in a mixture increased the concentration of L-Ala           an important role in metabolic processes such as signaling,
in leaves. This AA was not metabolized, so that the increase                interconnection between Carbon and Nitrogen metabolisms and
in concentration could have caused damages to the cells, as                 the tolerance to different stresses such as low light intensity,
observed in Chen et al. (2006) in cell cultures. Another of                 salinity, and lack of nitrogen, drought or temperature (Ramos-
the alterations produced by the application of L-Ala was the                Ruiz et al., 2019). The increase in GABA observed in plants
decrease in Tyrosine. This AA is the precursor of secondary                 treated with L-Ala could be the result of some type of stress
metabolites derived from the p-Coumaroyl-CoA pathway,                       produced by this amino acid, unchaining a protection response
which produces compounds such as coumarins, flavonoids,                     related with GABA. In these plants, this response was not
isoflavonoids, stilbenes, aurones, cutin, suberin, sporopollenin,           enough to counter the stress created, and therefore, led to
catechins, proanthocyanidins, lignans, lignins, phenylpropenes,             a decrease in growth. The concentration of Trigonelline also
acylated polyamines and many other alkaloid derivatives. These              increases in the plant as a response to different stresses,
compounds are related with the antioxidant protection capacity              mainly salinity, drought or UV light (Cho et al., 1999; Cho
of the cells and with the mechanisms of protection of plants                et al., 2003; Willmon et al., 2017). However, the application
against plagues and diseases.                                               of L-Ala in this experiment decreased its concentration. It is
    In the metabolomics study it was also observed that some                important to point out that the increased in GABA and the
compounds from the pentose phosphate pathway, such as                       decrease of Trigonelline are found in plants suffering some
fructose, sucrose, glucose and formate, as well as the tricarboxylic        abiotic stress, so that these metabolites could be used as
acid pathway (citrate, malate and fumarate), were affected. For             biomarkers to detect the possible negative effects of these AAs
the individual application of Asp, Glu and L-Ala and their                  in tomato plants. However, more research is needed to verify
mixture Asp + Glu, different responses were observed in the                 this hypothesis.
pentose phosphate pathway and the tricarboxylic acid one,                       The different changes observed in the metabolic processes
which demonstrate that the mix of amino acids has a different               of the plants utilized in the present research could be due
effect than the AA applied individually. The mixtures that                  that the AAs, aside from having physiological functions, may
contained L-Ala produced a decrease in the concentration of                 also be involved in the metabolism of plants in signaling
fructose, sucrose and glucose, malate and citrate. This could               processes (Häusler et al., 2014). It has been described that
suggest that the L-Ala applied at a concentration of 15mM                   plants have glutamate receptors (GLRs) that could be activated
produces alterations in the metabolism of C such as in ACO2 ,               not only by glutamate, but also by other AAs such as Serine,
which could have caused a decrease in the growth of the                     Alanine, Methionine, Tryptophan, Phenylalanine, Leucine,
shoot. Therefore, the causes of L-Ala toxicity in tomato plants             Asparagine, Threonine, Cysteine, Glycine, Tyrosine, and
should be studied further, using as the report from Chen et al.             Peptides (Vincill et al., 2012; Forde and Roberts, 2014). The
(2006) a reference, where it was observed that AAs can activate             activation of these receptors could unchain a series of signaling
the enzymes Phenylalanine ammonium lyase, 4-hydroxylase                     mechanisms in processes related to the absorption of nitrogen
cinnamic acid, the expression of the stilbene synthase gene, and            by the roots (Miller et al., 2008), growth and architecture
the accumulation of stilbenes. In the case of Asp, Glu, and their           of the roots (Weiland et al., 2016), antioxidant metabolism
mixture, it was observed that while the mixture maintained the              (Hildebrandt et al., 2015; Weiland et al., 2016), regulation of

Frontiers in Plant Science | www.frontiersin.org                       13                                   January 2021 | Volume 11 | Article 581234
You can also read