The Mineral Profile of Polish Beers by Fast Sequential Multielement HR CS FAAS Analysis and Its Correlation with Total Phenolic Content and ...
←
→
Page content transcription
If your browser does not render page correctly, please read the page content below
molecules
Article
The Mineral Profile of Polish Beers by Fast Sequential
Multielement HR CS FAAS Analysis and Its
Correlation with Total Phenolic Content and
Antioxidant Activity by Chemometric Methods
Elżbieta Zambrzycka-Szelewa 1 , Edyta Nalewajko-Sieliwoniuk 1, * , Mariusz Zaremba 1 ,
Andrzej Bajguz 2 and Beata Godlewska-Żyłkiewicz 1, *
 1   Faculty of Chemistry, University of Bialystok, Ciołkowskiego 1K, 15-245 Białystok, Poland;
     elazamb@uwb.edu.pl (E.Z.-S.); zaremba_mariusz@onet.pl (M.Z.)
 2   Faculty of Biology, University of Bialystok, Ciołkowskiego 1J, 15-245 Białystok, Poland; abajguz@uwb.edu.pl
 *   Correspondence: e.nalewajko@uwb.edu.pl (E.N.-S.); bgodlew@uwb.edu.pl (B.G.-Ż.)

 Academic Editor: Błażej Kudłak

 Received: 19 June 2020; Accepted: 20 July 2020; Published: 27 July 2020

 Abstract: Beer is the most common alcoholic beverage worldwide, and is an excellent source of
 macro- and microelements, as well as phenolic compounds. In this study, a fast method for the
 determination of Na, K, Mg, Ca, Fe, Mn, and Cu in beer was developed using flame atomic absorption
 spectrometry. The precision of this method was between 0.8 and 8.0% (as the relative standard
 deviation (RSD)), and limits of detections were in the range of 0.45 (Mn)–94 µg/L (Na). Among
 the macroelements tested in the beer samples, K was found at the highest concentration, whereas
 Na was found at the lowest concentration level. Beer also turned out to be a good source of Mg
 and K. The total phenolic content (TPC) was determined by the Folin–Ciocalteu method, while the
 antioxidant activity was estimated by the ABTS method. The results show remarkable variations
 in the mineral content, TPC, and antioxidant activity across the beer types and brands. Moreover,
 the relations between the type, color, refraction index, antioxidant activity, extract, alcohol, mineral,
 and the total phenolic contents were investigated using the factor analysis of mixed data (FAMD)
 combined with hierarchical clustering on principal components (HCPC).

 Keywords: sequential multielement determination; phenolic compounds; antioxidant activity; beer;
 chemometric analysis

1. Introduction
     Beer is one of the most popular alcoholic beverages in the world. The consumption of beer
in Poland totals an average of 97 L per person and solidifies Poland’s place as the fourth-highest
consumption country in the European Union [1]. Compared to other alcoholic beverages, beer has a
higher nutritional value because it contains many macro- and microelements, as well as some vitamins,
carbohydrates, gluten, and antioxidants [2]. Metals in beer can originate from the brewing water,
malt grains, hops, fruits, and spices. Some salts (e.g., CaSO4 , MgSO4 , ZnSO4 , and CaCl2 ) are added
throughout the brewing process in order to control pH, adjust the taste, improve efficiency, and enhance
the fermentation performance. Sources of metals in beer have been studied, and several investigators
have examined their fate during the brewing, fermentation, and clarification processes [3,4]. It is
known that numerous metals play an important role in the physiological processes of yeast. Metals
like Zn, Fe, and Cu are cofactors in over 100 enzymatic reactions; they govern protein synthesis and
the phospholipid composition of membranes in yeasts. They are important for yeast growth and
metabolism, as they influence the fermentation rate and stabilize enzyme, protein, and membrane

Molecules 2020, 25, 3402; doi:10.3390/molecules25153402                         www.mdpi.com/journal/molecules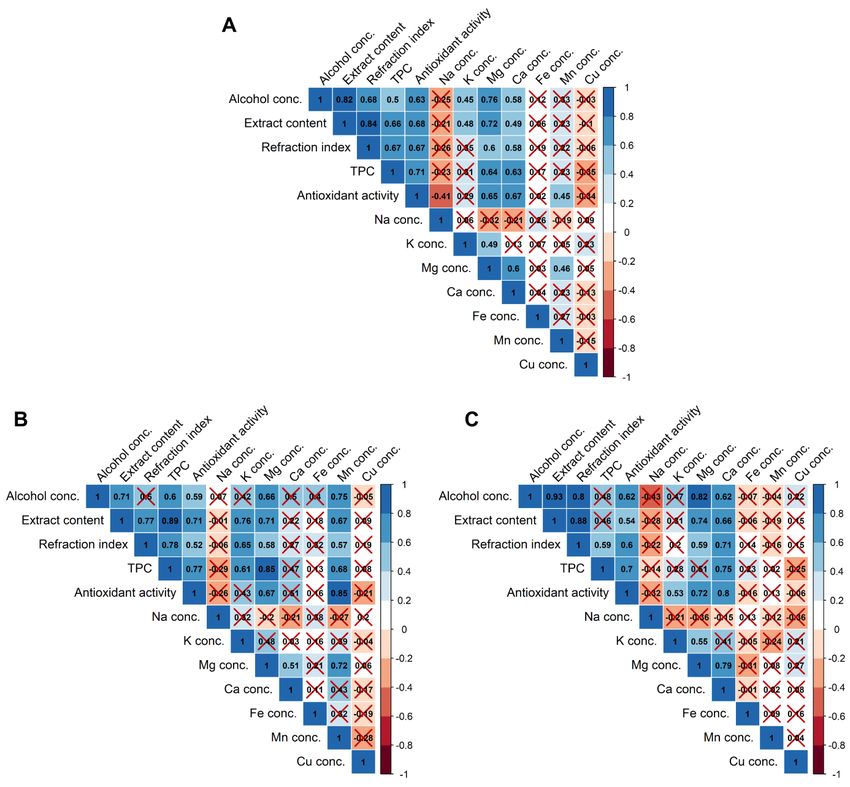
Molecules 2020, 25, 3402                                                                             2 of 24

systems. Moreover, certain elements can affect the quality and taste of the final beer products [2].
It is known that high Fe content reduces yeast activity and causes the metallic taste of beer, whereas
dissolved Cu reduces sulfur flavors and aromas in beer due to sulfide reactions. Moreover, the oxidizing
properties of Fe, Cu, and Mn may decrease the shelf-life of the final beer [5]. Some metals, especially Pb
and Cd, may be harmful above a certain concentration. The total allowed content of metals in brewing
liquors and beer is regulated, so the analysis of metals is essential.
      Beer is a complex mixture of compounds with antioxidant activity, originating mainly from
raw materials, but also formed during the brewing process [6]. Natural antioxidants present in raw
materials include phenolic compounds, Maillard reaction products (reductones and melanoidins),
thiols, sulfites, sugars, carotenoids, vitamins, and chelating agents. Phenolic compounds, which are
products of the secondary metabolism of plants, are responsible for 55.0–88.1% of the total antioxidant
capacity of beer. They display many health benefits and protect our bodies against cardiovascular
diseases, certain types of cancers, and aging-related disorders [7]. Different types and brands of
beers have similar phenolic profiles. However, significant variations between the total and individual
phenolic contents are most likely due to a difference in the variety and quality of raw materials, as well
as dissimilar malting and brewing processes. Beer is generally considered one of the major sources of
phenolic compounds; its total content usually exceeds 100 mg gallic acid equivalents (GAE) per liter.
Around 80% of the phenolic compounds originate from barley malt, and the remaining 20% are derived
from hops. Phenolic compounds have an influence on beer color, foam, and colloidal and sensory
properties. Moreover, through metal chelation and free radical scavenging, phenolic compounds
protect beer against oxidative staling and improve its physical stability and flavor. Phenolics in beer
include several classes of compounds, such as phenolic acids, flavanols, proanthocyanidins, flavones,
prenylchalcones, flavanones, alpha-acids, and stilbenes.
      The most popular method for determining the total phenolic content (TPC) in beer is the
Folin–Ciocalteu (FC) assay, which is based on the reduction of the FC reagent (a mixture of
phosphomolybdate and phosphotungstate) by phenolics and the measurement of the absorbance
at 725–760 nm [8]. The FC reagent does not only react with phenolic compounds, but also reacts
with other reducing substances (amino acids, aldehydes, ketones, amines, nucleotides, proteins,
thiols, carbohydrates, and vitamins), therefore, the assay enables one to measure the overall reducing
capacity of beers. However, because of the fact that phenolic compounds are the most abundant
antioxidants in beers, FC assays give a rough approximation of the total phenolic content. For proper
evaluation of the total antioxidant activity of beers, spectrometric analytical methods, such as
2,20 -azinobis(3-ethylbenzothiazoline-6-sulfonic acid) diammonium salt radical cation scavenging
activity (ABTS) assay, 1,1-diphenyl-2-picrylhydrazyl (DPPH) radical scavenging activity assay, oxygen
radical absorbing capacity (ORAC) assay, and ferric reducing antioxidant power (FRAP) assay are
used due to their simplicity, sensitivity, and short time of analysis.
      Typical techniques used for the determination of metals in beers include flame atomic absorption
spectrometry (FAAS) [9–11], graphite furnace atomic absorption spectrometry (GFAAS) [12,13], inductively
coupled plasma optical emission spectrometry (ICP-OES) [9,10,14,15], and inductively coupled plasma
mass spectrometry (ICP-MS) [3,16–18]. Since direct aspiration of beer results in flame/plasma fluctuations,
the formation of solid deposits on the burner head [9,12], or clogging of the nebulizer, the analysis of
metals is usually performed in digested samples. Digestion of beer was carried out using concentrated
HNO3 [16,17], or mixtures of HNO3 and 30% H2 O2 [9,11,15,19], H2 SO4 and H2 O2 [10], and HF [3] in open
and closed systems. In order to minimize the influence of organic residue on the efficiency of atom/ion
formation of elements, the standard addition method is usually recommended for calibration.
      The typical sensitivities of FAAS do not allow the adoption of this strategy when determining
major and trace elements. Other drawbacks of the classical line-source FAAS technique are the
single-element character and narrow range of calibration curves. The development of high-resolution
continuum source flame atomic absorption spectrometry (HR CS FAAS) allowed for sequential
multielement analyses that are particularly important for routine laboratories dedicated to large-scale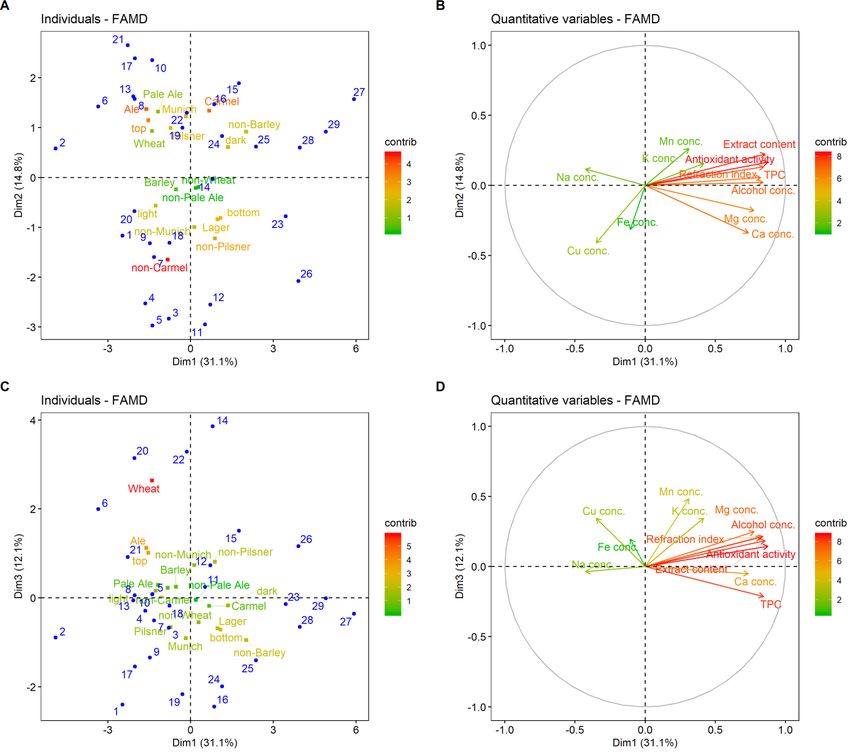
Molecules 2020, 25, 3402                                                                              3 of 24

food control because of time and analytical cost reduction. Using this technique, it is also possible
to determine each analyte under optimized conditions in a single run, as the flame composition,
stoichiometry, and burner height can be changed very fast. This approach is clearly preferable to the
simultaneous determination of elements under compromised conditions. Moreover, the intensity of
the Xe lamp (continuous source) is practically the same in the whole spectrum; thus, less sensitive
lines can be used for the determination of elements. This is beneficial as the sensitivity might be
accommodated in such a way that all the elements of interest can be monitored sequentially without
the need for diluting the samples. Furthermore, it is also possible to use side pixels to decrease
sensitivity [20–22]. For all these reasons, HR CS FAAS is considered an appropriate tool for performing
the fast multielement determination of metals in various samples. Although several methods have been
developed for sequential determination of elements in soil extracts [21], digested soils [23], digested
plant leaves [24,25], seawater [26], or apple juices [27], the HR CS FAAS technique has not been applied
to the analysis of beer samples yet.
      A literature review reveals that there are studies that describe different correlations occurring
in beer. The influence of the beer type and place of origin on the alcohol and metal contents was
investigated by Alcázar et al. [28] and Rodrigo et al. [18]. Wyrzykowska et al. [16] studied the
interdependencies among trace metals in beers. Alcázar et al. [9] examined the correlations between
the mineral content and the type of beer (lager, dark, and low alcoholic). Moura-Nunes et al. [29]
investigated the impact of the type and style of beer, ethanol content, refractive index, and bitterness
on the content of phenolic compounds. While Polak et al. [30] studied the influence of the color, the
type, and the content of the extract and alcohol on the antioxidant activity of beers. Nevertheless, there
is only one paper describing the mineral and the total phenolic contents in beer samples [31]. However,
the correlations between these analytes were not investigated.
      The objectives of this study were:

•    To develop the fast FAAS method for sequential determination of macro- and microelements in
     beers, which could be used in routine laboratories for food analysis,
•    To study the total phenolic content and antioxidant properties of Polish beers in relation to the
     type, color, alcohol and extract contents, and method of fermentation,
•    To investigate the possible relationship between the macro- and microelements and
     phenolic compounds.

     For the purpose of this study, 29 beers produced by leading Polish brewery companies and small
local breweries were analyzed. The relations between the type, color, refractive index, antioxidant
activity, extract, alcohol, mineral, and total phenolic contents were investigated using the factor analysis
of mixed data (FAMD) combined with hierarchical clustering on principal components (HCPC).

2. Results and Discussion

2.1. Development of Sequential Methods for the Determination of Macro- and Microelements in Beer
      HR CS FAAS can be considered a suitable tool for performing fast multielement analyses in
various matrices. However, determination of macro- and microelements in beer in a single run may
be difficult as their concentrations differ by 2–3 orders of magnitude [2,32]. In order to avoid these
problems, the measurement conditions were optimized for spectral lines of different sensitivities,
i.e., main spectral lines (100% intensity) of Zn, Fe, Cu, Mn, Ca, and secondary spectral lines of Na
(0.48% intensity), K (0.5% intensity), and Mg (4.3% intensity). Initially, the flame composition, ratio of
air-acetylene flow rates, and burner height were adjusted for each element individually in order to
obtain the highest sensitivity of measurements. Sequential analysis of elements was performed in the
following order: Cu, Zn, Fe, Mg, Na, K, Mn, and Ca using optimal measurement conditions (listed
in Section 2.4). Since the analytical line of Zn overlaps with the molecular absorption band of NO
if the air-acetylene flame is used for atomization [24], all elemental standards were prepared in 1%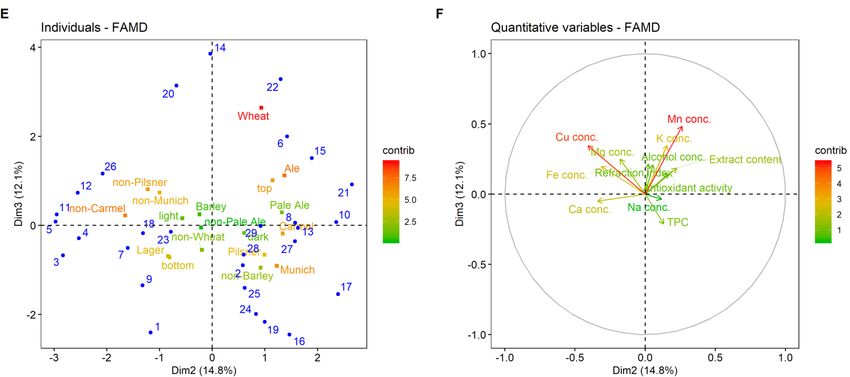
Molecules 2020, 25, 3402                                                                              4 of 24

HCl. The influence of wavelength integrated absorbance on the sensitivity of element determination
was studied by varying the number of pixels from 1 to 11, i.e., from CP (central pixel) to CP ± 9.
The optimal number of measurement pixels was selected based on the background signal, repeatability
of measurements, and limit of detection of each analyte. The characteristic parameters of the method,
such as the linear range of the calibration graphs, working calibration range, precision, limit of detection,
and limit of quantification were also estimated for each element. For evaluation of calibration graph
linearity, multielemental standards in the concentration range of 0.01–20 mg/L (for microelements) or
1–200 mg/L (for macroelements) were prepared. Typical linear correlation coefficients of calibration
graphs were higher than 0.998. The limit of detection (LOD) was defined as 3SDblank/a, where SD is
the standard deviation of the blank measures, and a is the slope of the calibration graph. The limit
of quantification (LOQ) was calculated as 10SDblank/a. The within-day precision of absorbance
measurements, expressed as the relative standard deviation (RSD) for six independent measurements
of the standard solution of the target element, was below 3.2%. The between-day precision, calculated
as the RSD (in %) of calibration graph slopes recorded in 5 different days, was below 8%. The main
figures of merit of sequential determination of eight elements by HR CS FAAS are shown in Table 1.
This method is sensitive and very fast, as the determination of eight elements in one sample takes
under 7 min.
     In order to decrease the sensitivity of Mg determination and concurrently increase the linearity
of the calibration graph used for the sequential multielement determination in beer, a two side pixel
registration approach was tested. Typically, for the best sensitivity, the central pixel approach is
preferred. When higher masses of analyte are introduced into the flame, the use of side pixels may
become advantageous [21,24]. Therefore, the mathematical subtraction of absorbance of Mg registered
for CP ± 1 and CP was carried out (i.e., absorbance was measured using the sum of the detector pixels
100 and 102). This operation is possible due to the fact that the software is capable of storing reference
spectra and of subtracting spectra from these recorded for the sample. As a result, the sensitivity of Mg
measurements decreased by about 60%, whereas the linearity of the calibration graph was extended
from 7 to 12 mg/L. Such an approach allows for the determination of higher analyte concentrations due
to an extension of the working range of HR CS FAAS. The parameters obtained for the determination
of Mg at 202.582 nm using a different number of pixels are presented in Table S1 from Supplementary
Material. The limit of detection and precision of the method based on the registration of two side
pixels (LOD equaled 77 µg/L) was worse than that obtained for methods based on the registration of
three or five pixels (e.g., 58 µg/L and 60 µg/L, respectively) due to the increased noise that was added
to the total integrated absorbance. However, this methodology allowed for sequential determination of
three macroelements: K, Na, and Mg in beer samples. The reproducibility of results was below 2.8%.
     The effect of the beer matrix on the determination of elements using the developed method was
examined for two different beer samples (13 and 19) containing medium concentrations of extract,
alcohol, and sugar (see Table 2). The concentration of elements in each beer (10-fold diluted in 1% HCl)
was determined using two calibration techniques: the calibration graph and the standard addition
method (using four standard additions). Slopes of both calibration functions were the same in the
range of analytical error for K, Na, and Mg. The concentration of elements in the beers that were
obtained by two calibration methods varied less than 4% (0.7% for Mg, 2% for K, and 4% for Na).
Therefore, the external calibration graph method might be recommended for sequential determination
of K, Na, and Mg by HR CS FAAS in beer samples diluted with 1% HCl or HNO3 . The repeatability of
results, calculated as RSD (in %) of the concentration of analyte determined in three independent beer
samples, was below 2%.
     The strong interference of the beer matrix on the atomization of Ca was eliminated by the addition
of 1% La as a releasing agent [25]. In this way, the slope of the calibration graph for Ca decreased by
30% (Table 1), but the results obtained by two calibration methods were consistent (within 5%).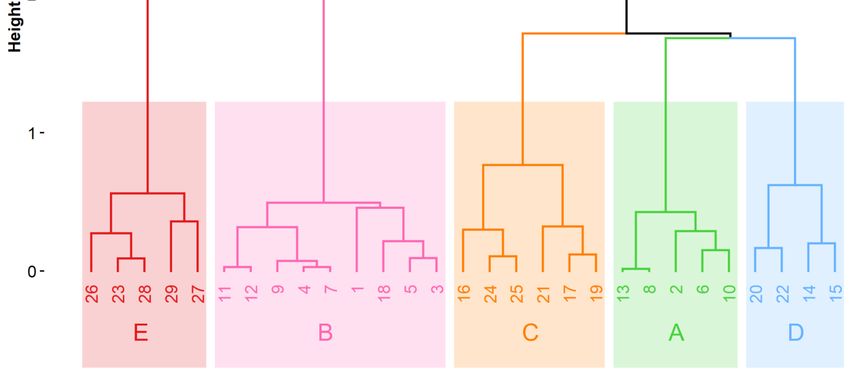
Molecules 2020, 25, 3402                                                                                                                                                           5 of 24

      Table 1. Instrumental parameters and analytical characteristics of methods for determination of target macro- and microelements by high-resolution continuum source
      flame atomic absorption spectrometry (HR CS FAAS). Sequential determination of Na, K, and Mg in beer was performed for samples diluted with 1% HCl; sequential
      determination of Mn, Fe, and Cu was performed in samples of beer digested with HNO3 + H2 O2 .

              Wavelength,   Number of     Slope,   Linear Calibration      Working Calibration     LOD 1 ,   LOQ 2 ,      Precision, %      Between-Day         Reproducibility in Beer,
  Element
                 nm           Pixels      L/mg        Range, mg/L             Range, mg/L           µg/L      µg/L           (n = 7)     Precision, % (n = 5)         % (n = 3)
                                                                   Sequential Determination of 8 Elements in 1% HCl
     Na          330.2370       5         0.0127        1.0–40.0                 1.0–66.0            12        40             0.9                5.1                      1.8
     K           404.4140       3         0.0046         10–200                  10–200              34       128             0.6                8.0                      1.1
     Mg          202.5820       5         0.0729         1.0–7.0                 1.0–12.0            24        80             2.3                1.4                      1.1
     Ca          422.6728       5         0.0538         1.0–8.0                 1.0–35.0           3.6        12             3.2                3.8                       -
     Mn          279.4820       7         0.5611        0.05–0.6                 0.05–2.5           0.26      0.88            0.6                3.7                       -
     Fe          248.3281       7         0.2029        0.05–2.0                 0.05–6.1           3.5        11             0.4                2.7                       -
     Cu          324.7542       3         0.2765        0.01–1.2                 0.01–2.6            16        54             2.3                5.2                       -
     Zn          213.8572       3         0.8715        0.01–0.5                 0.01–1.6           1.7        5.7            2.1                4.8                       -
                                                           Sequential Determination of 3 Microelements in 10% HNO3
     Mn          279.4820       7         0.6172        0.05–0.6                 0.05–2.2           0.45      1.52            0.6                4.5                      0.9
     Fe          248.3281       7         0.2110        0.05–2.0                 0.05–6.1           2.8        9.4            0.9                3.6                      1.9
     Cu          324.7542       3         0.2889        0.01–1.2                 0.01–2.6           6.7       22.4            2.2                4.7                      4.5
                                                                        Determination of Ca in 1% HCl + 1% La
     Ca          422.6728       5         0.0365         0.5–20                      -               85       285             0.9                1.3                      7.3
                                                             1   LOD—limit of detection, 2 LOQ—limit of quantification.
Molecules 2020, 25, 3402 6 of 24
Table 2. (A) Type and style, (B) physicochemical parameters, the total phenolic content, antioxidant
activity and (C) concentration of elements of Polish beers analyzed in this study (n = 3).
Type of Malt Fermentation
No. Type Color
Pilsner Barley Pale Ale Munich Wheat Carmel Method
1 Lager + bottom pale
2 Ale 1 + + + + top pale
3 Lager + bottom pale
4 Lager + bottom pale
5 Lager + bottom pale
6 Ale 1 + + + + + top pale
7 Lager + + bottom pale
8 Ale 1 + + + + top pale
9 Lager 1 + + + bottom pale
10 Ale 1 + + + + + top pale
11 Lager + bottom pale
12 Lager + bottom pale
13 Ale 1 + + + + top pale
14 Ale + + top pale
15 Ale 1 + + top pale
16 Lager + + + bottom dark
17 Ale 1 + + + + top dark
18 Lager 1 + top dark
19 Lager 1 + + + + bottom dark
20 Ale 1 + + top dark
21 Ale 1 + + + + + top dark
22 Ale 1 + + + top dark
23 Lager 2 + + bottom dark
24 Lager 2 + + + bottom dark
25 Lager 2 + + + + bottom dark
26 Lager 3 + bottom dark
27 Lager 3 + + + bottom dark
28 Lager 3 + + + bottom dark
29 Lager 3 + + bottom dark
1 craft beers, 2 bock, 3 porter.
(A)
Alcohol Conc. Density Extract Refractive Total Phenolic Antioxidant Activity
No. pH
(% v/v) (g/mL) (%) Index Content (mg/L) ± SD (µmol TE/L) ± SD
1 4.28 4.2 1.0045 10 1.340 518 ± 5 51.6 ± 0.7
2 4.27 4.3 1.0069 10 1.340 484 ± 15 46.1 ± 3.1
3 4.09 5.2 1.0040 11.3 1.341 613 ± 8 80.5 ± 4.3
4 4.27 6 1.0062 12 1.341 540 ± 10 54.9 ± 2.4
5 4.21 6 1.0075 12.1 1.343 542 ± 12 56.2 ± 1.2
6 4.54 5.3 1.0104 12.5 1.343 529 ± 30 57.1 ± 2.3
7 4.25 6 1.0083 13.2 1.342 598 ± 2 66.8 ± 0.9
8 4.45 5.2 1.0096 13.8 1.345 630 ± 15 61.2 ± 0.5
9 4.46 5 1.0097 13.8 1.344 682 ± 37 53.2 ± 2.1
10 4.33 5.5 1.0040 14 1.342 660 ± 18 104 ± 2
11 4.25 6.5 1.0102 14.5 1.344 763 ± 17 81.2 ± 0.7
12 4.42 7.4 1.0121 14.5 1.343 786 ± 11 74.3 ± 2.2
13 4.38 6 1.0027 15 1.342 625± 21 58.9 ± 3.9
14 4.42 6 1.0177 16 1.346 896 ± 10 104 ± 1
15 4.49 8.4 1.0155 18.1 1.347 859 ± 5 89.4 ± 0.8
16 4.21 4.1 1.0213 11.9 1.343 1044 ± 36 103 ± 2
17 4.15 5 1.0071 12.8 1.341 743 ± 8 76.3 ± 1.1
18 4.19 5.2 1.0259 14.8 1.347 759 ± 12 67.7 ± 1.8
19 4.26 5.5 1.0115 12.8 1.343 816 ± 2 76.0 ± 1.6
20 4.25 5.6 1.0070 13.1 1.343 473 ± 3 72.8 ± 0.5
21 3.91 5.2 1.0065 13.5 1.340 627 ± 25 55.4 ± 0.5
22 4.19 6.4 1.0150 14.8 1.345 307 ± 16 108 ± 2
23 4.32 6.5 1.0156 15.1 1.346 1185 ± 15 146 ± 2
24 4.12 7 1.0127 16 1.345 708 ± 16 69.9 ± 2.2
25 4.53 6.5 1.0193 16 1.345 894 ± 22 108 ± 1Molecules 2020, 25, 3402 7 of 24
Table 2. Cont.
Alcohol Conc. Density Extract Refractive Total Phenolic Antioxidant Activity
No. pH
(% v/v) (g/mL) (%) Index Content (mg/L) ± SD (µmol TE/L) ± SD
26 4.50 8 1.0225 18.1 1.348 927 ± 25 123 ± 1
27 4.36 9.5 1.0121 21 1.348 1266 ± 24 142 ± 2
28 4.15 8.9 1.0231 22 1.351 974 ± 5 106 ± 1
29 4.14 9.2 1.0140 22 1.349 1108 ± 28 145 ± 3
Overall mean 4.29 6.19 1.0118 14.64 1.344 743 84.1
Min 3.91 4.10 1.0040 10.00 1.340 307 46.1
Q1 4.19 5.20 1.0070 12.80 1.342 598 55.9
Q2 4.27 6.00 1.0104 14.00 1.343 708 76.0
Q3 4.42 6.50 1.0155 16.00 1.346 894 104
Max 4.54 9.50 1.0259 22.00 1.351 1266 146
Q1 —lower quartile; Q2 —median; Q3 —upper quartile.
(B)
Metal conc. (mg/L) ± SD Metal conc. (µg/L) ± SD
No.
Na K Mg Ca Fe Mn Cu
1 21.7 ± 0.2 469 ± 4 80.2 ± 1.2 41.3 ± 2.3 69.5 ± 0.6 108 ± 0 30.1 ± 1.8
2 46.8 ± 0.1 481 ± 3 64.0 ± 1.0 31.5 ± 0.6 220 ± 4 67.3 ± 0.3 70.5 ± 4.8
3 16.6 ± 0.3 410 ± 3 106 ± 1 103 ± 0 63.6 ± 5.2 144 ± 0 55.1 ± 3.0
4 74.2 ± 1.3 595 ± 2 108 ± 1 67.8 ± 3.9 159 ± 2 122 ± 2 63.2 ± 1.8
5 25.8 ± 0.1 515 ± 6 97.7 ± 0.3 45.8 ± 0.8 1872 ± 2 146 ± 1 33.3 ± 0.1
6 44.5 ± 0.5 541 ± 4 87.1 ± 1.0 30.3 ± 0.7 150 ± 0 145 ± 1 84.1 ± 2.9
7 70.3 ± 1.6 533 ± 2 131 ± 2 41.9 ± 1.3 419 ± 3 159 ± 3 53.8 ± 3.6
8 74.0 ± 2.0 685 ± 8 99.6 ± 1.0 47.8 ± 1.1 193 ± 1 127 ± 2 65.6 ± 0.8
9 30.4 ± 1.0 585 ± 3 122 ± 3 34.5 ± 1.0 159 ± 1 76.2 ± 0.7 85.8 ± 3.1
10 32.3 ± 0.3 609 ± 2 110 ± 1 38.9 ± 3.8 301 ± 3 155 ± 0 36.1 ± 2.3
11 33.6 ± 0.2 515 ± 4 122 ± 2 108.0 ± 6 365 ± 6 148 ± 2 76.7 ± 4.5
12 21.3 ± 0.3 554 ± 1 158 ± 2 53.0 ± 1 153 ± 3 181 ± 3 75.9 ± 2.7
13 49.4 ± 0.8 640 ± 5 99.5 ± 0.2 32.6 ± 2.4 135 ± 1 125 ± 1 63.3 ± 1.5
14 20.3 ± 0.8 792 ± 11 141 ± 1 58.2 ± 1.5 157 ± 5 235 ± 2 53.3 ± 2.3
15 46.4 ± 1.1 815 ± 1 131 ± 1 56.0 ± 1.9 397 ± 2 225 ± 2 38.4 ± 1.4
16 22.5 ± 0.4 367 ± 10 106 ± 2 63.1 ± 0.3 252 ± 2 277 ± 1 21.0 ± 0.7
17 43.5 ± 0.6 536 ± 5 84.3 ± 2.7 27.3 ± 0.3 135 ± 1 65.4 ± 0.2 13.3 ± 1.1
18 61.0 ± 1.4 427 ± 6 95.8 ± 0.1 54.2 ± 1 508 ± 6 81.4 ± 0.5 43.5 ± 1.9
19 54.2 ± 1.1 520 ± 13 112.4 ± 0.9 42.6 ± 0.4 238 ± 10 153 ± 1 20.0 ± 0.3
20 7.75 ± 0.04 528 ± 6 102 ± 2 19.1 ± 1.6 1199 ± 13 181 ± 1 68.5 ± 0.3
21 63.6 ± 2.3 428 ± 10 108 ± 0 43.3 ± 4.6 272 ± 6 255 ± 1 33.3 ± 2.2
22 32.8 ± 0.2 512 ± 4 120 ± 0 56.4 ± 3.5 62.4 ± 1.7 277 ± 1 40.8 ± 0.5
23 31.0 ± 1.1 624 ± 2 127 ± 1 117.2 ± 4.1 362 ± 0 151 ± 1 37.3 ± 1.7
24 10.9 ± 0.1 491 ± 3 123 ± 4 50.3 ± 3.5 134 ± 2 126 ± 2 53.0 ± 2.7
25 15.0 ± 0.3 689 ± 17 140 ± 1 93.1 ± 3.4 116 ± 5 114 ± 2 33.7 ± 5.7
26 34.0 ± 1.2 742 ± 5 169 ± 0 114 ± 0 220 ± 17 144 ± 6 66.9 ± 9.2
27 17.6 ± 0.1 855 ± 16 155 ± 1 103 ± 2 286 ± 13 207 ± 10 41.3 ± 0.7
28 32.9 ± 0.5 519 ± 17 113 ± 1 84.3 ± 1 303 ± 3 141 ± 1 12.1 ± 0.1
29 17.5 ± 0.4 491 ± 3 134 ± 1 66.5 ± 0.1 140 ± 0 174 ± 0 21.7 ± 0.6
Overall mean 36.3 568 115 59.4 312 156 48.0
Min 7.75 367 64.0 19.1 62.4 65.4 12.1
Q1 21.3 491 99.6 41.3 140 125 33.3
Q2 32.8 533 112 53.0 220 146 43.5
Q3 46.8 624 131 67.8 303 181 65.6
Max 74.2 855 169 117 1872 277 85.8
Q1 —lower quartile; Q2 —median; Q3 —upper quartile.
(C)
Using the two calibration methods, the concentration of microelements in beers varied
approximately 10% for Fe, 12% for Mn, 34% for Cu, and 44% for Zn. A similar effect of the
beer matrix on analytical signals of Mn, Fe, and Cu was observed by Bellido-Milla et al. [10]. This effect
was minimized through the digestion of samples with nitric acid. Therefore, in order to overcome
the matrix effect and avoid using the standard addition method, beer samples were digested in aMolecules 2020, 25, 3402 8 of 24
conventional open vessel with nitric acid and hydrogen peroxide on a hot plate [11,33]. The final
product was a clear solution in a pale yellow color. Concentrations of Fe, Cu, and Mn in such digested
beer samples determined by HR CS FAAS using both calibration procedures were in good agreement
(differences below 5%). However, due to a serious interference of nitric acid on the determination
of Zn, this element was excluded from further studies. The analytical characteristic of a sequential
method for determination of Fe, Cu, and Mn in 10% nitric acid is presented in Table 1.
Due to a lack of reference material of beer with certified concentrations of elements, the trueness
of developed methods was verified by the determination of target elements in the certified reference
material of mixed Polish herbs (MPH-2). The MPH-2 material was selected since it contains similar
concentrations of elements to beer samples. The results presented in Table S2 from Supplementary
Material demonstrated good accuracy of developed methods. Recoveries of macroelements were in
the range of 97.4–100.6%, while microelements were in the range of 91.6–103.7%. The repeatability
of the determination of elements expressed as the relative standard deviation of three independent
analyses of the same beer sample was in the range of 1.1–7.3%.
In summary, due to the serious interference of the beer matrix on the analytical results, two methods
were developed for sequential determination of macro- and microelements in beer. For sequential
determination of Na, K, and Mg, beer samples were simply diluted with 1% HCl, while before
sequential determination of Fe, Mn, and Cu, beer samples were submitted to a wet mineralization
procedure. The external calibration procedure based on standard solutions prepared in 1% HCl
(for macroelements) or 10% HNO3 (for microelements) was applied for quantification of investigated
elements in beer samples. The addition of a La modifier is crucial for accurate determination of Ca in
beer. The analytical parameters (in terms of sensitivity, precision, and LOD) of developed methods for
sequential determination of macro- and microelements are similar or better in comparison to those
obtained in other papers [11,21,24].
2.2. Determination of the Total Content of Macro- and Microelements in Beer
The total content of macro- and microelements in investigated beer samples was determined
according to the procedures described in Sections 3.4.1 and 3.4.2. The samples were analyzed in
triplicate. The results of HR CS FAAS assays are presented in Table 2. Based on the obtained results,
it was concluded that K was found in the beer samples at the highest concentration level among the
macroelements. Its concentration in beer was in the range from 367 ± 10 mg/L (beer 16) to 855 ± 16 mg/L
(beer 27). On the basis of the results obtained in this study, it could be concluded that the analyzed
beers may serve as a significant source of K for humans. According to the dietary reference intakes
recommended by US Food and Drug Administration [34] the intake levels for K should be about
3500 mg/day for adults. This means that 500 mL of beer (one bottle) covers from 5.3 to 12% of the
daily US norms. Similar studies carried out by Rajkowska et al. [35] on Polish beers also revealed
high concentrations of K (from 172 to 518 mg/L) in comparison to beers from countries such as
Portugal, Thailand, Italy, Vietnam, Romania, Spain, and Germany [17,28,36], but overall lower than
the values obtained in this study. Higher content of K was only found in beers from Britain (from 135
to 1100 mg/L) [17]. The level of K may vary depending on a different class of yeast used during the
production process (which are a significant source of K), as well as a different quality of resources [16].
The level of K has to be strictly controlled, because a potassium concentration higher than 500 mg/L may
inhibit the activity of enzymes, causing a salty taste of beer and thus reducing its quality [36]. On the
contrary, the lowest contents among the macroelements were found for sodium. The concentration
of this metal ranged from 7.75 ± 0.04 mg/L (beer 20) to 74.2 ± 1.3 mg/L (beer 4). A low sodium
concentration in beer affects the sweetness and smoothness of its taste. According to the US standards,
the intake of sodium for humans should be about 2.4 g a day [34]. Therefore, one bottle of beer produced
in Poland may cover up to 1.5% of the daily need for this element. The concentration of calcium in the
tested beer samples ranged from 19.1 ± 1.6 (beer 20) to 117 ± 4 mg/L (beer 23). Comparing these values
to the norms of recommended calcium intake, which are 1000 mg per day [34], it turns out that oneMolecules 2020, 25, 3402 9 of 24
500 mL bottle of beer may cover up to 5.9% of the daily requirement in terms of this element. Calcium
had no significant effect on the taste of beer. The concentration of magnesium was in the range from
64.0 ± 1.0 (beer 2) to 169 ± 0 mg/L (beer 26). Such Mg concentration values can cause a bitter taste in beer.
However, taste also depends on the ratio of calcium and magnesium concentration in this beverage [37].
While comparing the obtained results with the daily needs, it was concluded that a single bottle of
beer covers between 8.0% and 21.1% of the daily requirement of magnesium, which is 400 mg/day
for adults [34]. Comparing the results obtained in this study with the values found in the literature
(Table 3), it can be concluded that all macroelement concentrations were within the ranges obtained for
beers from other countries. Only in the case of K its concentration was almost the same for each kind
of beer. While bottom-fermented beers contained higher concentrations of Mg (125 ± 22 mg/L) and Ca
(73.9 ± 28.9 mg/L) when compared to top-fermented beers (Mg: 103 ± 20 mg/L, Ca: 41.6 ± 12.7 mg/L,
Na: 42.2 ± 18.4 mg/L), they also contained lower concentrations of Na (31.5 ± 19.0 mg/L). A similar
situation was observed for dark beers, especially porters and bocks, which also contained higher
concentrations of Mg (143 ± 24 mg/L (porters), 130 ± 9 mg/L (bocks)) and Ca (91.7 ± 20.7 mg/L (porters),
86.9 ± 33.9 mg L−1 (bocks)) and lower concentrations of Na (25.5 ± 9.2 mg/L (porters), 19.0 ± 10.6 mg/L
(bocks)) compared to pale beers (Mg: 110.5 ± 24.4 mg/L, Ca: 52.7 ± 23.9 mg/L, Na: 31.7 ± 18.2 mg/L).
Rodrigo et al. [18] found that lagers (bottom-fermented beers) had the lowest content of Ca, K, Mg,
and dark beers (stout/porter), as well as the highest content of Mg. While the beer style did not have a
significant effect on the concentration of Na.
Among the microelements tested, Fe was present in investigated beer samples at the highest
concentration levels, ranging from 62.4 ± 1.7 to 1872 ± 2 µg/L. Taking into account the US recommendations,
the intake of Fe should be about 18 mg/day for adults [34]. Therefore, one bottle of beer may cover up to
5.2% of the daily need for this element. However, high Fe concentration in beer has a negative impact
on its quality. A concentration above 0.3 mg/L causes a grey color of beer foam [2]. The metallic taste
of beer becomes noticeable when the concentration of Fe exceeds 0.5 mg/L. This threshold value was
exceeded by 3 of the tested beers (beers 5, 18, and 20). A concentration higher than 1 mg/L (beers 5 and
20) caused beer haze and accelerated the oxidation of organic compounds, leading to flavor changes of
this beverage. Mn is the second microelement with the highest concentrations found in the tested beer
samples. The concentration of this metal was in the range of 65.4 ± 0.2 (beer 17)–277 ± 1 µg/L (beer 16).
In small concentrations (Molecules 2020, 25, 3402 10 of 24
Table 3. Concentration of elements (mg/L) in beers manufactured in different countries; ranges, mean (m), and median values (M) in brackets.
Country of Origin Na K Mg Ca Fe Mn Cu Reference
Poland 0.045–0.530 0.053–0.47 0.029–0.150
[16]
(n = 30) (0.130) M (0.160) M (0.060) M
Brazil
0.11–0.348 0.038–0.155 [12]
(n = 4)
Poland 172–518 92–220 0.05–0.45 0.03–0.15 0.01–0.09
[35]
(n = 18) (309)m (132)m (0.14) m (0.12) m (0.04) m
Poland
0.208–0.345 0.070–0.165 0.072–0.114 [11]
(n = 6)
Germany 30.4–77.7 442.8–570.3 66.8–126.7 45.9–95.8 0.07–1.41 0.05–0.26
(n = 15) (46.3)M (493.8) M (105.6) M (61.6) M (0.42) M (0.18) M
[28]
Portugal 8.4–129.6 255.2–443.1 58.3–113.8 28–93 0.05–0.88 0.06–0.19
(n = 18) (24.1) M (354) M (88.8) M (54.8) M (0.24) M (0.13) M
Spain 251–563.5 43.1–210.4 21.8–108.5 0.03–0.3 0.03–0.35
(n = 35) (425.3) M (94) M (48.2) M (0.16) M (0.14) M
Distributed in
29.8–197.0 22.5–84.7 11.2–62.2 0.2–4.2 0.0042–0.2317 0.026–0.073 [17]
Romania (n=20)
Britain 21.90–230 135–1100 60–200 40–140
Spain 3.95–103 22.9–496 42.0–110 9.0–86.2 [17]
Germany 1.19–120 22.9–496 23.7–266 3.80–108
Portugal (n = 4) 19–191 38–52
Thailand (n = 8) 109–125 43–121
[36]
Italy (n = 4) 143–145 62–105
17.4–81.9
Vietnam (n = 6) 112–135 90–204
(46.8) M
Distributed in UK 19.1–53.2 239.8–626.2 57.3–99.8 24.1–61.5
0.198–4.073 0.09–0.35 0.003–0.633
(n = 125) (41)m (451) m (78) m (52) m
Germany (n = 13) (19.1) m (450.2) m (79.5) m (41.7) m (0.579) m (0.13) m (0.400) m
[18]
Belgium (n = 19) (49.7) m (504.2) m (83.3) m (54.8) m (4.073) m (0.35) m (0.633) m
UK (n = 53) (48.3) m (436.5) m (73.6) m (61.5) m (0.554) m (0.14) m (0.003) m
USA (n = 14) (26.8) m (626.2) m (99.8) m (38.7) m (0.489) m (0.25) m (0.006) m
n—number of beer samples; m mean; M median.Molecules 2020, 25, 3402 11 of 24
The results showed remarkable variations in mineral content between different types and brands
of beers, with differences varying from a factor of 2 (K) to a factor of 30 (Fe). Concentrations of macro-
and microelements in beer mainly depend on the quality of natural resources used in the brewing
process (cereal, hops, yeast, water, and soil), application of different methods to process the raw
material (type of fermentation), as well as the presence of environmental contaminants [16]. Taking
into account the fact that several tested beer samples had high concentrations of iron and manganese,
which had a negative impact on beer quality, a systematic monitoring of the content of these metals
should be performed during the technological process of beer production.
2.3. Determination of the Total Phenolic Content and the Total Antioxidant Activity
The total content of phenolic compounds in beer samples was determined by the FC method
(described in Section 3.4.3), while the antioxidant activity was estimated by the ABTS method (described
in Section 3.4.4). The samples were analyzed in triplicate. The results of the spectrophotometric assays
are given in Table 2. The TPC of the beer samples was in the range of 307 ± 16 (beer 22)–1266 ± 24 mg/L
(beer 27). The average concentrations of TPC in pale and dark beers were 648 ± 127 and 845 ± 269 mg/L,
respectively. The TPC was significantly higher in dark beers (Tables 2 and 4). The highest values were
measured in porter (927–1108 mg/L) and bock (894–1185 mg/L) beers. Our findings are in agreement
with those of Dabina-Bicka et al. [38], Mitić et al. [7], and Piazzon et al. [39], who also observed a higher
TPC in dark beers. The average concentrations of TPC in ale pale and dark beers were 687 ± 140
and 582 ± 192 mg/L, respectively. While the average concentrations of TPC in lager pale and dark
beers were 630 ± 103 and 991 ± 178 mg/L, respectively. Neto et al. [40] and Vinson et al. [41] have
found that ale group beers showed higher TPC and antioxidant activity compared to lager group beers.
Pérez-Ráfols et al. [42] found that in general, ale beers were 15% richer in overall phenolic compounds.
However, the authors did not specify what type of beers (pale, dark) was investigated. Contrary to the
results obtained by other researchers [43], craft beers from small breweries did not contain a higher
content of phenolic compounds. The results obtained by a FC assay were similar to those obtained for
Polish beers by Pieszko et al. [44] (222–1185 mg/L) but higher than those obtained by Ditrych et al. [45]
(115–408 mg/L), most likely due to the use of different methods for TPC determination. There are several
studies on the content of phenolic compounds in beers from different countries. Dabina-Bicka et al. [38]
found that in Latvian beers, values of TPC ranged from 301 to 864 mg/L, while Bertuzzi et al. [43]
estimated TPC in Italian beers were within the range of 205–841 mg/L. Moura-Nunes et al. [29] found
that Brazilian beer TPC was in the range of 164–572 mg/L, whereas Zhao et al. [46] reported that
Chinese beers contained TPC in the range of 152–339 mg/L. In addition, Mitić et al. [7] found that
Serbian beer TPC values were from 328 to 545 mg/L, whilst Pai et al. [47] reported TPC values of
160–620 mg/L in Indian beers. Nino-Medina et al. [48] found that Mexican beers contained TPC in the
range of 174–274 mg/L. The content of phenolic compounds may vary depending on the quality and
quantity of raw materials, the malting and brewing processing parameters, and the TPC evaluation
methods used in the studies [44,49].
The antioxidant activity of investigated beer samples, determined by the ABTS method,
also exhibited considerable differences ranging from 46.1 ± 3.1 (beer 2) to 146 ± 2 µmol/L (beer 23).
The ABTS•+ scavenging activity of pale beers was in the range of 46.1 ± 3.1–104 ± 2 µmol/L. Dark beers
revealed higher antioxidant capacity, ranging from 55.4 ± 0.5 to 146 ± 2 µmol/L, compared to light
beers (Tables 2 and 4). The highest values were obtained for bock (69.9–146 µmol/L) and porter
(106–145 µmol/L) beers. Our findings are in agreement with those described in the literature [6,30].
Higher antioxidant properties of dark beers might be related to the use of dark malt, which contains
heat-induced substances such as melanoidins and reductones that are formed by the Maillard reaction
during kilning and roasting processes [6]. Similarly to TPC, the average antioxidant capacity of
pale ale beers was higher (73.9 ± 21.0 µmol/L) than that of pale lager beers (64.8 ± 12.5 µmol/L).
In the case of dark beers, the average antioxidant capacity of ale type beers was lower than that of
lager type beers (Table 2). However, Polak et al. [30] stated that the kind of fermentation (bottom inMolecules 2020, 25, 3402 12 of 24
ale, top in lager type beers) did not affect the antioxidant activity of beers. The obtained values of
antioxidant activity were lower than those reported in the literature by Polak et al. [30] in Polish beers
(711–3328 µmol/L), Mitić et al. [7] in Serbian beers (140–350 µmol/L), Nino-Medina et al. [48] in Mexican
beers (140–230 µmol/L), Moura-Nunes et al. [29] in Brazilian beers (400–3020 µmol/L), Bertuzzi et al. [43]
in Italian beers (300–600 µmol/L), and Zhao et al. [46] in Chinese beers (550–1950 µmol/L). The differences
can be related to higher amounts of natural antioxidants present in raw materials (including phenolic
compounds, carotenoids, thiols, and vitamins), the brewing process itself, or different procedures used
for the determination of the total antioxidant capacity of beer samples.
Table 4. Hypothesis testing for the content of total phenolic compounds (TPC) and antioxidant activity.
Question: Does a Parameter in X Type of Beers Follow Normal Distribution?
Statistical Test
Shapiro–Wilk Test
Name:
Parameter X W Statistics p-Value Answer
TPC Light color (n = 15) 0.92480 0.2279 Yes
TPC Dark color (n = 14) 0.98313 0.9890 Yes
TPC Top fermentation (n = 12) 0.97288 0.9385 Yes
TPC Bottom fermentation (n = 17) 0.94575 0.3928 Yes
Antioxidant activity Light color (n = 15) 0.89193 0.0717 Yes
Antioxidant activity Dark color (n = 14) 0.91033 0.1593 Yes
Antioxidant activity Top fermentation (n = 12) 0.90478 0.1828 Yes
Antioxidant activity Bottom fermentation (n = 17) 0.89343 0.0528 Yes
Question: Does a Parameter in X and Y Types of Beers Have the Same Variance?
Statistical Test
F Test
Name:
Parameter X Y F Statistics p-Value Answer
TPC Light color Dark color 0.22285 0.0087 No
TPC Top fermentation Bottom fermentation 0.51929 0.2736 Yes
Antioxidant activity Light color Dark color 0.36796 0.0744 Yes
Antioxidant activity Top fermentation Bottom fermentation 0.41894 0.1479 Yes
Question: Does a Parameter in X and Y Types of Beers Follow the Same Distribution?
Statistical Test
Kolmogorov–Smirnov Two-Sample Test
Name:
Parameter X Y D Statistics p-Value Answer
TPC Light color Dark color 0.51905 0.0263 No
TPC Top fermentation Bottom fermentation 0.42157 0.1195 Yes
Antioxidant activity Light color Dark color 0.52857 0.0349 No
Antioxidant activity Top fermentation Bottom fermentation 0.26961 0.6860 Yes
Question: Does a Parameter in X and Y Types of Beers Have Equal/Lower Means?
Statistical Test
Welch Two-Sample t-Test
Name:
Parameter X Y t Statistics p-Value 1 p-Value 2 Answer
TPC Light color Dark color −2.4920 0.0225 0.0113 Lower
TPC Top fermentation Bottom fermentation −2.5150 0.0182 0.0091 Lower
Antioxidant activity Light color Dark color −3.1999 0.0043 0.0021 Lower
Antioxidant activity Top fermentation Bottom fermentation −1.5201 0.1402 0.0701 Equal
1 H0 —equal means, H1 —unequal means; 2 H0 —equal or greater means, H1 —lower means.
The highest values of TPC and antioxidant activity were found in dark beers, especially porters
and bocks. Therefore, dark beers, consumed in a limited amount, could be a rich source of phenolic
antioxidants in our diet. The results showed remarkable variations in TPC as well as antioxidant activity
across beer brands. The results of TPC and ABTS assays differed by factors of 4 and 3, respectively,
which is similar to the variation registered by Zhao et al. [6,46]. In studies by Ditrych et al. [45],
the differences in antioxidant activity of beers varied even by up to a factor of 12, which shows that
producers may considerably improve the antioxidant properties of their products and improve their
bioactivity through an appropriate selection of raw materials and changes in the brewing process.
2.4. Chemometric Analysis
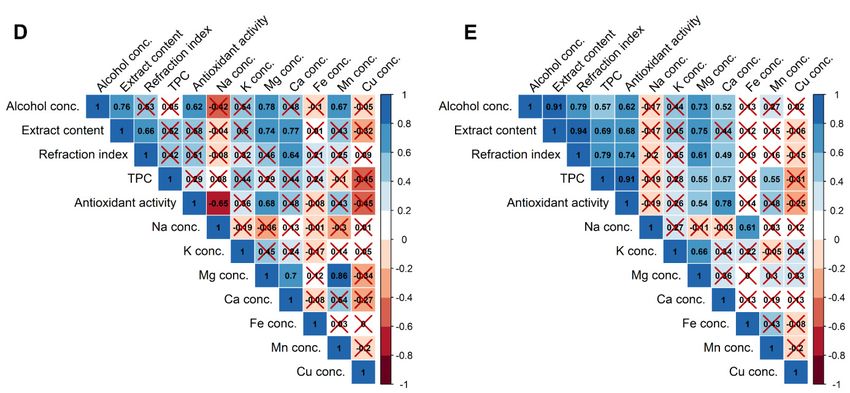
For unfiltered beers, strong, or very strong (according to Evans [50]) positive rank correlations were
found between, e.g., antioxidant activity vs. alcohol concentration, extract content, refractive index, TPC,Molecules 2020, 25, 3402 13 of 24
and Mg and Ca concentration; alcohol concentration vs. extract content, refractive index, antioxidant
activity, and Mg concentration; and extract content vs. refractive index, TPC, antioxidant activity, and Mg
concentration (Figure 1A). The influence of parameters such as the type of fermentation, color, the content
of alcohol, and extract on the antioxidant properties of beers was also investigated by Polak et al. [30]
by using two-way hierarchical clustering and an analysis of variance. They found that the antioxidant
activity of beers depends significantly on the content of the extract and the color of the beer, which is in
agreement with our findings. However, they stated that neither the kind of fermentation nor the alcohol
content affects the antioxidant activity of beers. Moura-Nunes et al. [29] used PCA in order to discriminate
beer samples according to ethanol content, bitterness, and refractive index. They also used the PLS
method to correlate physicochemical attributes (density, ethanol content, bitterness, and refractive index)
with antioxidant activity of beers. They found that similar to this study, TPC and antioxidant capacity of
beers were correlated with ethanol concentration and refractive index. This study revealed that some of
the rank correlations exist irrespectively to the data filtering by color and fermentation method (e.g.,
alcohol concentration vs. extract content and Mg concentrations and extract content vs. refractive index).
However, some correlations exist only for specific types of beers. TPC shows a monotonic relationship
with antioxidant activity and Mg for pale (Figure 1B), dark (Figure 1C), and bottom-fermented beers
(Figure 1E). The correlation between TPC and Mg in dark beers was also described by Rodrigo et al. [18],
who studied the influence of style and origin on the mineral content of beers from the United Kingdom.
Moreover, a positive correlation was found for antioxidant activity and Mn for pale beers (Figure 1B).
This is in agreement with the results obtained by Sulaiman et al. [51]. Relationships between antioxidant
activity and Mg and Ca for dark (Figure 1C) and bottom-fermented beers (Figure 1E); Mg and Mn
for pale (Figure 1B); and top-fermented beers (Figure 1D); and Na and Fe for bottom-fermented beers
(Figure 1E) were found. Only one negative and strong correlation was reported between antioxidant
activity and Na concentration in top-fermented beers (Figure 1D).
One of the objectives of this study was to evaluate the correlation between metal and total phenolic
content in beers. A literature review shows that such relationships might exist for some matrices.
For example, Kostic et al. [52] found a correlation between Mn, Fe, and TPC in extracts of Origanum
vulgare L., as well as between the amount of flavonoids and Zn, Cu, and Mn in extracts of Delphinidum
consolida L. Perna et al. [53] demonstrated a positive correlation between TPC and metals such as Fe,
Co, Cr, Zn, and Pb in honey. Our studies revealed that with regard to beer, there were no correlations
between TPC and investigated macro- and microelements (except for Mg, Ca, and Mn in some types of
beers), which may indicate that the main phenolic compounds present in beer do not form complexes
with the metals tested. The investigations performed by Pohl et al. [54] using sorption columns
of different properties revealed that a majority of the Cu in beer (74–82%) was present in residual
fraction. Out of the remaining Cu, 10-14% was present in the form of hydrophobic species (including
phenolic-bound species), and 12–13% was present as cationic or free Cu. Mn was mainly present in
cationic form, and only 0.3–8.2% was identified as organically bound [11,32]. Only Fe was to a large
degree associated with organic compounds (31–56%), probably the phenolics, phytic acids, and low
molecular weight organic acids. However, the stability constants of the Fe-tannic acid complex were
decreased by about 8-12 orders of magnitude at pH 5.0 and lower [55]. The pH of the 29 tested beer
samples was in the range of 3.91–4.54.
Factor maps for the first three dimensions (principal components) obtained from FAMD,
representing individuals (different beers) and different categories (qualitative and quantitative
variables), are presented in Figure 2. Individuals with negative Dim1 values were generally ale,
top-fermented beers with higher than average concentration of Na (beers 2, 6, 8, 13, and 17). Positive
values of this dimension indicate caramel, bottom-fermented beers with higher than average values of
antioxidant activity, TPC, and Mg concentration (beers 23–25 and 27–29). Individuals with positive
Dim2 values were generally described as top-fermented, ale, pilsner, Munich, and caramel style of beers
(beers 6, 8, 13, 16, 19, 22, and 27; Figure 2A). For example, beers 25–29 have higher than average values
of extract content, antioxidant activity, TPC, and other eigenvectors with positive Dim1, while beers 6,Molecules 2020, 25, 3402 14 of 24
8, 13, and 20 show the opposite (Figure 2A,B). Beers lying in the first and second quadrant, like beers 14,
20, and 22 of Figure 2E, generally had higher than average Mn concentration, while those in the third
and fourth quadrant beers 3, 9, 16, 19, 24, and 25, had lowered Mn concentration. Similarly, beers lying
in the second and third quadrant of Figure 2E had higher concentrations of Cu. These results are
similar to the outcomes of Alcázar et al. [9], who stated that Mn, Mg, and K were the most important
variables for beer
Molecules classification
2020, 25, purposes.
x FOR PEER REVIEW 16 of 27
FigureFigure 1. Correlation
1. Correlation heatmap
heatmap for unfiltered
for unfiltered beer
beer parameters(A;
parameters (A;nn=
= 29),
29), pale (B;nn==15),
pale(B; dark
15), n =n = 14),
(C;(C;
dark
14), top-fermented
top-fermented (D; n = (D;
12),n and
= 12),bottom-fermented
and bottom-fermented (E;(E;nn== 17)
17) beers.
beers.The colored
The and labeled
colored scale scale
and labeled
codes are for the value of the Spearman’s rank correlation coefficient rs. Positive correlations are blue,
codes are for the value of the Spearman’s rank correlation coefficient rs . Positive correlations are blue,
while negative correlations are red. However, red crosses show insignificant correlations (p ≥ 0.05).
while negative correlations are red. However, red crosses show insignificant correlations (p ≥ 0.05).
Factor maps for the first three dimensions (principal components) obtained from FAMD,
representing individuals (different beers) and different categories (qualitative and quantitativeMolecules 2020, 25, 3402 15 of 24
Molecules 2020, 25, x FOR PEER REVIEW 18 of 27
Figure
Figure 2. Factor
2. Factor mapsmaps
for for
the the
firstfirst
threethree dimensions
dimensions (factors)
(factors) obtained
obtained fromfrom the factor
the factor analysis
analysis of
of mixed
mixed
data. data.Individual
(A,C,E): (A,C,E): Individual
(different(different beers
beers listed listed 2)
in Table in in
Table
blue2)and
in blue and qualitative
qualitative variable
variable categories
categories
colored colored
according according
to their to their
contribution to contribution to dimensions.
dimensions. (B,D,F): (B,D,F):
Quantitative Quantitative
variables coloredvariables
according
colored according to their contribution
to their contribution to dimensions. to dimensions.
Cluster analysis is the chemometric method exploited for multivariate data interpretation.
The clusters (groups of similarity) can be obtained with respect to the objects of interests (which are
described by various variables) or with respect to variables identifying the objects. The chemometric
data interpretation in the present study was based on an input matrix consisting of 29 objects (beerMolecules 2020, 25, 3402 16 of 24
samples) described by 6 dimensions of the input data matrix obtained from the FAMD model.
The variables taken into account are listed in Table 5 (qualitative variables) and Table 6 (quantitative
variables). The graphical output of the hierarchical clustering on principal components is a dendrogram
shown in Figure 3. HCPC clustered beers into five groups—clusters A-E. All the beers assigned to
the cluster A were an ale, pilsner, had a pale color, and were top-fermented. This cluster also had
60% of the pale ale beers, while the remaining 40% of beers were non-pale ale. The Ca and Mg
concentration values in this cluster were lower than average. In cluster B, beers had an extract content
and antioxidant activity lower than the average. This cluster contained non-caramel style and lager
beers from bottom fermentation (88.88%) with a pale color (88.88%). The cluster C represents Munich,
pilsner, and caramel style beers with a dark color. Cu concentration was lower than average in the
C cluster. Beers assigned to the D cluster were the ale type from top fermentation, and 75% of them
were wheat. They also had higher than average concentrations of Mn. The cluster E contained only
dark beers with antioxidant activity, TPC, extract content, refractive index, alcohol concentration,
Ca concentration, and Mg concentration higher than average. Overall, 37.93% of beers were ale, while
the remaining 62.07% were lager. About 50% of the beers had a pale color. Most of the beers represented
non-wheat style (82.76%) and/or non-pale ale (86.21%). Among the 29 beers tested, 13 beers were
from small breweries (nine of them from the brewery located in Bialystok). Beers from the small
local brewery had lower than average content of Ca, Mg (beers 2, 6, 8, 10, and 13; cluster A), and Cu
(beers 17, 19, and 21; cluster C), as well as lower extract content and antioxidant activity (beer 9;
cluster B; Figure 3). Beer 18 from another small brewery (cluster B) revealed lower than average extract
content and antioxidant activity, while beers 15, 20, and 22 (cluster D) exhibited higher than average
Mn content.
Table 5. Results for the hierarchical clustering on principal components. Description of each cluster by
the categories. Only categories that characterize each cluster are shown (p-value < 0.05). Values of
the v-test are sorted from strongest to weakest significance in the construction of the given cluster, i.e.,
the higher the positive or the lower the negative value is the better/stronger description of the cluster it
has. Cla/Mod indicates a ratio of beers with a specific category (modality) found in a cluster (class) to all
beers with this category in the dataset (%). Mod/Cla indicates a ratio of beers having a specific category
to all beers in a cluster. Global shows the percentage of beers having a specific category in the dataset.
Cluster Category Cla/Mod Mod/Cla Global v-Test p-Value
A Type = Ale 45.455 100 37.931 2.887 0.004
A Fermentation method = top 41.667 100 41.379 2.713 0.007
A Style Pale Ale = Pale Ale 75 60 13.793 2.558 0.011
A Color = light 33.333 100 51.724 2.237 0.025
A Style Pilsner = Pilsner 31.25 100 55.172 2.088 0.037
A Style Pilsner = non-Pilsner 0 0 44.828 −2.088 0.037
A Color = dark 0 0 48.276 −2.237 0.025
A Style Pale Ale = non-Pale Ale 8 40 86.207 −2.558 0.011
A Fermentation method = bottom 0 0 58.621 −2.713 0.007
A Type = Lager 0 0 62.069 −2.887 0.004
B Style Carmel = non-Carmel 69.231 100 44.828 3.972 0.00007
B Type = Lager 50 100 62.069 2.817 0.005
B Color = light 53.333 88.889 51.724 2.576 0.010
B Style.Munich = non-Munich 50 88.889 55.172 2.346 0.019
B Fermentation method = bottom 47.059 88.889 58.621 2.120 0.034
B Fermentation method = top 8.333 11.111 41.379 −2.120 0.034
B Style.Munich = Munich 7.692 11.111 44.828 −2.346 0.019
B Color = dark 7.143 11.111 48.276 −2.576 0.010
B Type = Ale 0 0 37.931 −2.817 0.005
B Style Carmel = Carmel 0 0 55.172 −3.972 0.00007You can also read