An Indoor Crowd Movement Trajectory Benchmark Dataset
←
→
Page content transcription
If your browser does not render page correctly, please read the page content below
1

                   An Indoor Crowd Movement Trajectory
                            Benchmark Dataset
                                Ying Zhao, Xin Zhao, Siming Chen, Zhuo Zhang, and Xin Huang

                                                                           meeting halls, by using indoor trajectory data, which enables
   Abstract—In recent years, technologies of indoor crowd                  reliable and humanized services (e.g., anomaly detection,
positioning and movement data analysis have received widespread            indoor navigation, and hotspot recommendation [28]–[34]) in
attention in the fields of reliability management, indoor navigation,      building management. In particular, amid the recent COVID-19
and crowd behavior monitoring. However, only a few indoor
                                                                           pandemic, indoor trajectory data have shown their considerable
crowd movement trajectory datasets are available to the public,
thus restricting the development of related research and                   research value for epidemic prevention and control [35]–[38].
application. This paper contributes a new benchmark dataset of                High-quality data are vital to boost the development of data
indoor crowd movement trajectories. This dataset records the               science. In recent years, numerous open-source datasets of
movements of over 5000 participants at a three-day large                   outdoor crowd trajectories, such as transportation management,
academic conference in a two-story indoor venue. The conference            population mobility management, and safety monitoring of
comprises varied activities, such as academic seminars, business           major incidents, have empowered the rapid development of
exhibitions, a hacking contest, interviews, tea breaks, and a              related fields [39]–[52]. However, open-source indoor crowd
banquet. The participants are divided into seven types according           trajectory datasets are currently rare mainly due to the following
to participation permission to the activities. Some of them are
                                                                           three reasons. (1) Short-range positioning technologies are not
involved in anomalous events, such as loss of items, unauthorized
accesses, and equipment failures, forming a variety of spatial–            as mature and popular as GPS. (2) Indoor scenes are more
temporal movement patterns. In this paper, we first introduce the          private and sensitive and easily trigger privacy problems
scenario design, entity and behavior modeling, and data generator          compared with outdoor scenes. (3) Providing complete,
of the dataset. Then, a detailed ground truth of the dataset is            customized, and vivid stories in real-world indoor crowd
presented. Finally, we describe the process and experience of              trajectory data is difficult.
applying the dataset to the contest of ChinaVis Data Challenge                Therefore, creating and using simulation data is a feasible
2019. Evaluation results of the 75 contest entries and the feedback        solution. Simulation data are not restricted to hardware devices
from 359 contestants demonstrate that the dataset has satisfactory
                                                                           of indoor trajectory data collection. These data do not trigger
completeness, and usability, and can effectively identify the
performance of methods, technologies, and systems for indoor               privacy problems and can be embedded in dramatic stories,
trajectory analysis.                                                       thereby fulfilling most research requirements. However,
                                                                           creating high-quality indoor crowd trajectory data is difficult.
   Index Terms—Benchmark dataset, indoor crowd movement                    The challenges mainly come from three aspects. (1) The
trajectory, reliability and safety management.                             movements of each individual in the real world are affected by
                                                                           various objective and subjective factors, such as physical
                                                                           strength, current locality, crowd density, and subjective interest.
                         I. INTRODUCTION                                   (2) Indoor environments generally have compact structures,

H    UMAN daily activities generate massive amounts of
     crowd trajectory data in either indoor or outdoor
     environments [1]–[18]. GPS (global position system)
                                                                           diverse compositions, and complex functionalities. (3) The
                                                                           crowd distribution in an indoor space is constantly changing.
                                                                           Thus, such changes must conform to the structures and
technologies based on global positioning satellites support the            functionalities of the physical indoor space.
collection of outdoor trajectory data. Short-distance positioning             This paper introduces an indoor crowd trajectory benchmark
technologies, such as RFID, Bluetooth, UWB, and WLAN                       dataset called Indoor Crowd Movement Trajectory Dataset
[19]–[25], are the main approaches to obtain indoor trajectory             2019 (ICMTD-2019) [53]. The scene of the dataset was set at a
data because GPS signals will be interfered with or blocked by             fictitious international cyber security academic conference. The
buildings. The increase in crowd trajectory data availability              conference, which lasted for three days with more than 5000
offers new opportunities of analysis and assessment for                    people comprised three major parts, namely academic seminars,
reliability engineering [26], [27]. Analysts can discover human            business exhibitions, and hacking contests. Moreover, a series
movement patterns and behavior characteristics in indoor                   of social activities, such as tea breaks, interviews, and a banquet,
scenes, such as offices, subways, hospitals, shopping malls, and           were conducted. Each participant or organizer wore a smart

   This manuscript has been accepted by IEEE Transactions on Reliability      Siming Chen (Corresponding author) is with School of Data Science, Fudan
(08/2021).                                                                 University, Shanghai 200433, China (e-mail: simingchen3@gmail.com).
   Ying Zhao and Xin Zhao are with the School of Computer Science and         Zhuo Zhang and Xin Huang are with Qi An Xin Technology Group Inc.,
Engineering, Central South University, Changsha 410083, China (e-mail:     Beijing      100015,     China       (e-mail:     zhangzhuo@qianxin.com;
zhaoying@csu.edu.cn; zhaoxin567@csu.edu.cn).                               huangxin@qianxin.com).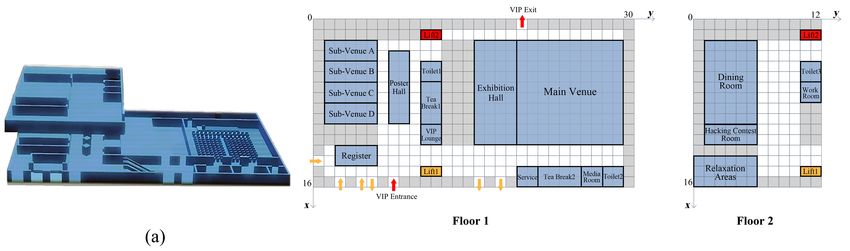
2

badge to capture his/her movements in the public areas of the          traffic situation and reduce the hazards of marine navigation [1].
venue during the conference. Consequently, the ICMTD-2019              The EPFL Mobility [2], [3], and T-Drive taxi trajectories
dataset included the following: (1) trajectories of 5256 people        datasets [4], [5], are high-precision GPS data of taxis that are
in the venue during the three days, the conference schedule, and       widely used in traffic flow analysis and traffic network
venue map (refer to the supplementary materials of the paper);         optimization. The basketball shot image dataset [6] is used to
(2) varied movement patterns of various types of participants as       analyze the correctness of basketball shot trajectory, which has
the conference schedule proceeds as planned; (3) diverse               good significance in guiding basketball training. The USCD [7]
abnormal events, such as equipment failure, loss of items,             and WorldExpo'10 datasets [8], which provide trajectory data
personnel ultra vires, and congestion in the venue, which often        of pedestrians captured by surveillance cameras, have been
lead to troubles to participants and organizers. All these             extensively used for outdoor crowd behavior analysis.
movement patterns and abnormal events were comprehensively                At present, few indoor trajectory benchmark datasets are
presented in the ground truth (refer to the supplementary              available due to the immaturity of indoor positioning
materials of the paper).                                               technologies, complex and compact structures of indoor spaces,
   This paper presents the comprehensive process of modeling           and susceptibility to privacy issues. The Mall dataset [10]–[13],
and generation of the dataset. First, the scene is determined          a real indoor trajectory dataset, provides the movement
through on-site investigations on a real-world large convention        information of 60,000 people captured by surveillance cameras
center and in-depth interviews with experienced academic               in a shopping mall. However, it is hard for real-world data to
conference organizers. Then, models are established to describe        include complete storylines with diverse events.
three main types of entities in the scene, namely characters,             IEEE VAST Challenge 2016 dataset is a synthetic indoor
activities, and locations. Next, methods to drive, constrain, and      trajectory dataset highly related to our dataset [14], [15]. It
control the behaviors of each character are proposed. Finally, a       offers employee trajectories and environment sensing data (e.g.,
program-driven data generation tool is designed to generate the        concentration levels of carbon dioxide and hazium) in an office
ICMTD-2019 dataset.                                                    building. It can be used to investigate indoor crowd behaviors
   The dataset had been evaluated by an established data               and their correlations with indoor environment shifts.
challenge named the 2019 ChinaVis Data Challenge [54], [55].           Compared to IEEE VAST Challenge 2016 dataset, the first
The challenge attracted 359 contestants and received 75                strength of our dataset is that our venue map is fine-grained with
submissions. The analysis difficulties of movement patterns            8*8m2 grids whereas the building map of IEEE VAST 2016
and abnormal events contained in the dataset were examined on          dataset is divided by coarse-grained functional areas. Second,
the basis of these submissions. The feedbacks were collected           our dataset involves more than 5,000 people but IEEE VAST
from the returned questionnaires from the contestants to               Challenge 2016 dataset only has 125 employees. Third, our
evaluate the quality, usability, and rationality of the dataset. The   scenario includes a vivid storyline with 34 parallel conference
results showed that the ICMTD-2019 dataset had a complete              activities and 12 anomalous events.
scene design and a reasonable and realistic modeling of
                                                                       B. Trajectory data generation
characters and activities in the scene. The various spatial–
temporal movement patterns and vivid storylines of the dataset            The generation methods of simulated trajectory data can be
stimulated the enthusiasm of the contestants for data analysis         roughly divided into data- and program-driven methods. Data-
and helped identify the effectiveness of data analysis methods,        driven methods generate simulated trajectories in scenes similar
technologies, and systems employed by the contestants.                 to those of existing trajectory data. For example, Lerner et al.
Analyzing user behaviors in the academic conference as a               [61] extracted the trajectories of moving objects from videos
complex system is vital for reliability and safety management.         and then generated new trajectories based on the extracted ones.
Especially, with the proposed open-sourced data, more                  Lee et al. [62] built an agent model based on the crowd
algorithms can be tested and evaluated for pattern seeking and         trajectories obtained from videos and then generated
anomaly detection [56]–[58]. Researchers and practitioners in          trajectories of a virtual crowd. Pappalardo et al. [63]
reliability management can be benefit from the situation               constructed a trajectory simulator to learn patterns hidden in
awareness of patterns and anomalies [59], [60].                        various movement logs to generate simulated trajectories.
   Overall, this paper provides the following contributions: (1)       Implementing data-driven methods is easy, and generated
an indoor crowd movement trajectory benchmark dataset, (2) a           trajectories contain the movement patterns of referenced real
set of indoor crowd movement behavior modeling and data                moving objects. However, the diversity of patterns and scenes
generation methods, and (3) a series of experiences in using the       is restricted by references, and the expandability of the data
dataset to evaluate approaches on indoor crowd movement                patterns is limited.
trajectory analysis.                                                      Program-driven methods generate trajectories of moving
                                                                       objects by designing models, algorithms, or tools. Compared
                      II. RELATED WORK                                 with data-driven methods, program-driven approaches can
                                                                       independently construct scenes and freely control data
A. Previous trajectory benchmark data                                  complexity. However, the difficulty of program-driven
   Numerous outdoor trajectory benchmark datasets are                  methods mainly lies in ensuring the closeness of the simulated
available due to their mature outdoor positioning technologies         scenes and movement patterns to the real world. Jensen et al.
and developed relevant research fields. For example, vessel            [64], [65] used a random algorithm to identify the next position
trajectories implied in Automatic Identification Systems (AIS)         of a moving object and then prompted the object to move to a
data are crucial to obtain a good understanding of the maritime        random target position through the Dijkstra algorithm.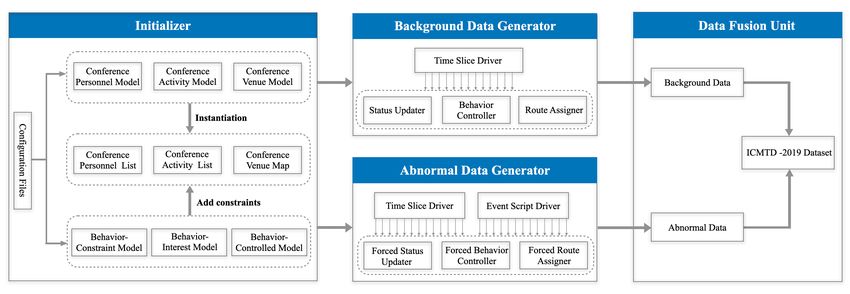
3

However, the random algorithm does not consider the moving                                          TABLE I
characteristics of the object. Huang et al. [66] materialized a                 DESCRIPTION OF THE CONFERENCE PERSONNEL MODEL
trajectory data generation tool, namely IndoorSTG, which
defines the degree of interest of a moving object in each spatial        Type       Attributes     Description             Range
position to determine its next position. However, this tool is                                      Conference
limited to produce diverse movement patterns. Li et al. [67]                           PID                                    -
                                                                                                 personnel number
built a tool named Vita to generate multiple types of indoor                         Gender           Gender                   -
                                                                         Basic
trajectories in a certain building by using distribution control       Attributes
                                                                                      Age              Age                     -
models of movements. Users can customize the number of                                Job           Occupation                 -
                                                                                                                    0, 1, 2, … ,6 (Section
moving objects, their maximum speed, and life cycles by                               Type        Personnel type
                                                                                                                             VII)
adjusting parameters. However, the tool cannot guarantee the                           MS         Motion status        [Moving, Stay]
                                                                        Status
structures and functionalities of complex indoor spaces, and the       Attributes      BS         Behavior status
                                                                                                                      [Absent, Focused,
generated data are not embedded into vivid story plots.                                                                   Occupied]
   The ICMTD-2019 dataset introduced in this paper is
generated by a program-driven method. Compared with the              difficult to detect. Thus, the proposed dataset can be used to
above-mentioned indoor crowd trajectory generation methods,          evaluate the capability and effectiveness of methods,
the proposed method considers various objective and subjective       technologies, and systems used by data analysts.
factors that drive movements of people, builds a set of entity-
representation and behavior-constraint models to ensure the                               IV. ENTITY MODELING
diversity and reality of movement patterns, and embeds a
                                                                        Three entity models are designed to describe the characters
variety of scheduled social activities and unexpected events into
the data, to the best of our knowledge, which have not been          of people, conference activities, and venues (indoor spaces in
previously conducted.                                                the scene). These models are comprehensively explained below.
                                                                     A. Conference personnel model
                    III. SCENARIO DESIGN
                                                                        The conference personnel model describes each individual in
   Four basic principles are identified in this paper to guide the   the scene with five basic attributes and two status attributes, as
scene definition. (P1) Realistic: the scene must be close to the     shown in Table I. The basic attributes, which have fixed values
real world although it is fictional; (P2) Universality: the scene    during the conference, specify the identity, background, and
must be universal and easy to understand; (P3) Diversity: the        type of an individual. Seven personnel types are pre-defined,
scene must contain a wealth of entity objects, events, and           and each type has its participation permissions (Section VII).
storylines; (P4) Challenging: the scene must be relatively           The status attributes depict the motion and behavior statuses of
difficult to stimulate the enthusiasm for analysis and promote       an individual at a time, updating once per second by default.
the research of relevant topics.                                     Two motion statuses are available: moving and stay. Three
   The scene of the ICMTD-2019 dataset is set in a large             behavior statuses are also available: not in the venue (Absent);
international cybersecurity academic conference. Multiple real-      in the venue and actively participating in a certain conference
world cyber security academic conferences are used as a              activity (Focused), such as attending an academic seminar out
reference to ensure realism and universality (P1 and P2), and        of personal interests; passively participating in a certain
coordination is made with one venue manager and two                  conference activity (Occupied), which generally occurs in
academic conference organizers during the entire scene design        conference personnel with specifically assigned tasks,
process. Seven types of personnel, including VIP guests,             including seminar chairs and keynote speakers.
ordinary guests, visitors, media reporters, hacking contest
participants, staff, and exhibitors, are designed with specific      B. Conference activity model
participation permissions and different movement patterns to            A conference schedule, which has 12 academic activities in
ensure diversity (P3). A two-story indoor venue space, which         the main venue, 22 academic activities in the sub-venues, and a
can accommodate more than 5000 people, is also designed on           hacking contest, is designed with reference to two real-world
the basis of the actual venue of a real-world large international    cyber security academic conferences. The schedule also
conference center. Space contains the main venue, a sub-venues       includes exhibitions, tea breaks, lunches, media interviews, and
area, an exhibition area, a contest area, and other functional       a banquet. The detailed schedule is presented in the
areas, including service desks, canteens, coffee break areas,        supplementary materials of this paper. A conference activity
leisure areas, and restrooms, as well as other rooms for related     model is designed to describe each activity from four aspects,
types of personnel, such as VIP lounges, media rooms, and            namely basic, permission, priority, and status attributes, as
work rooms, to rest and work. Two real-world international           shown in Table II. The basic attributes depict the name, start
cyber security academic conferences are considered to design         time, end time, and location of an activity, which are fixed
many parallel conference activities, such as keynotes, academic      during the conference. The permission attribute indicates the
seminars, business exhibitions, a hacking contest, and               types of conference personnel that is allowed to participate in
symposiums. Twelve abnormal events are designed to increase          an activity.
difficulty (P4). Some of these events involve fine-grained              For example, exhibitions allow all types of personnel to visit,
spatial–temporal patterns and complex correlations, which are
4
Fig. 1. Indoor structure of conference venue: (a) 3D model; (b) 2D top view and functional zones
TABLE II TABLE III
DESCRIPTION OF THE CONFERENCE ACTIVITY MODEL DESCRIPTION OF THE VENUE SPACE MODEL
Type Attributes Description Range Type Attributes Description Range
Name of X Abscissa [0, 30]
AName conference - Basic
Y Ordinate [0, 16]
activity Attributes
Basic Floor Floor [floor1, floor2]
Attributes Tstart Start time - Max moving
Tend End time - Capacity Speed 0–4 m/s
speed
Attributes
Location Location - Capacity Max capacity 0–400
Permission Personnel type Conference personnel Current
Permission Number 0–400
Attribute allowed to attend types Status capacity
Priority Attributes Current list of
Pr Priority 0, 1, 2, … ,6 StayList -
Attribute personnel
Status Completion
EP [0,1]
Attribute progress
4 m/s after onsite investigations and measurements. The
capacity values of grids in different functional zones are set
whereas the hacking contest only permits the attendance of differentially. For instance, the capacity is high for the corridor,
contestants and staff. The priority attribute represents the but low for the VIP lounge. In addition, the diversity of capacity
priority of each conference activity. For example, academic values leads grids in different functional areas to have different
activities are generally prioritized over exhibitions to attract max moving speeds. The larger the capacity in a grid, the lower
conference personnel. The status attribute outlines the the max moving speed. Status attributes, including the real-time
completion progress of an activity, which is determined by the capacity and personnel list, depict the current accommodation
current time, start time and end time of an activity. status of a grid with an updating frequency per second.
C. Conference venue model
V. BEHAVIOR MODELING
Fig. 1 shows the 3D model and the 2D top view of the indoor
space of the conference venue. An area of 8 × 8 square meters People at the conference will participate in various activities
is used as a space unit to divide the venue space considering the in different areas of the building. Such participation behaviors
typical communication distance (1–15m) of UHF-RFID are modeled in this section. Our model design draws on the
positioning devices [68]. Fig. 1(b) shows that the indoor space experience of venue managers and conference organizers as
of the venue is equally divided into non-overlapping grids. well as the existing researches on crowd modeling, crowd
Where the grids marked in red represent the special access for simulation, and behavior modeling [70]–[74].
VIPs. Therefore, coordinates can be used to depict the spatial A. Behavior-constraint model
structure and functional zones of the venue, and also to facilitate The behavior-constraint model describes four objective
the description of the trajectory. factors that can affect crowd movements in the venue, as shown
A space model is built to describe the basic, capacity, and in Table IV. Time constraints define the venue opening hours
status attributes of a space unit, namely a grid, as shown in of three days. Conference personnel can only move to the venue
Table III. The basic attributes refer to the location information during the opening hours. Permission constraints define the
of a grid. The capacity attributes describe the maximum number types of personnel that are allowed to enter a certain functional
of people that a grid can accommodate and the max speed that zone in the venue. For example, VIP lounge only allows VIP
allows people to pass through. A grid is stipulated to guests to enter.
accommodate 0 to 400 people with an allowable speed of 0 to Energy constraints limit how long people can continually5
TABLE IV TABLE V
DESCRIPTION OF THE BEHAVIOR-CONSTRAINT MODEL DESCRIPTION OF THE BEHAVIOR-INTEREST MODEL
Type Attributes Description Range Type Attributes Description Range
T1 Opening hours on day1 7:30–18:00 CIV Current interest value [0, 1]
Time
T2 Opening hours on day2 8:00–19:30 Personal IDR Interest decay ratio [0, 1]
Constraints
T3 Opening hours on day3 7:30–13:00 Interest IRR Interest recovery ratio [0, 1]
Permission Personnel authority Features IVmin Lowest interest [0, 1]
PAR -
Constraints restriction IVmax Highest interest [0, 1]
E Energy value [0, 1] Activity CAV Current attracting value [0, 1]
Energy Emin Min energy value [0, 1] Attractiveness ADR Attractiveness decay ratio [0, 1]
Constraints EDR Energy decay rate [0, 1] Features ADT Attractiveness decay trend [−1, 1]
ET Exit target value [0, 1]
Capacity SC Saturation of capacity [0, 1]
Constraints SR Speed ratio [0, 1]
V. Personal interest features determine the real-time interest of
an individual in a certain conference activity. These features
comprise the following: CIV, which depicts the current interest
stay in the venue. E represents the current energy value of an
value; interest decay ratio (IDR) and interest recovery ratio
individual. The energy value of an individual is upon daily
(IRR), which control the change in CIV; and IVmin and IVmax,
entrance to the venue, and the value gradually decreases as the
which define the value range of CIV. Activity attractiveness
time of stay increases. An energy constraint function is defined features determine the real-time attracting value of an activity
to simulate the change in E, as shown in Formula 1: to an individual. These features comprise CAV, which depicts
Ei, t = (1 − EDRi )(Ei, t-1 − Emini ), (1) the current attracting value, an ADR and ADT, which control the
change in CAV. The IDR, IRR, IVmin, and IVmax of each
where Ei, t and Ei, t-1 represent the energy value of person i at individual to each activity and the ADR and ADT of each
time t and t-1, respectively, EDRi is the energy decay rate of activity to each individual are preset in accordance with the
person i, and Emini is the minimum energy value of person i. basic attributes of each individual and activity. That is, people
This formula shows that Ei, t is gradually close to the minimum in the venue have diverse preferences for conference activities.
energy value Emini under the influence of the EDRi . Moreover, The product of CIV and CAV is defined as the interest
an exit target value ET, which is usually slightly larger than Emin , matching value (IMV) of an individual to an activity. That is,
is set for an individual. A lower Ei than the ETi means that the CIV and CAV jointly motivate an individual to decide activity
energy of person i is insufficient, prompting person i to leave switching. Two calculation methods are designed to simulate
the real-time changes in CIV and CAV.
the venue. The initial Emin , EDR, and ET of each conference
personnel are randomly generated based on their age; for (1) CIV calculation
example, a young person generally has a slow energy decay rate People generally tend to be curious of the unfinished
conference activities that they have not yet participated in.
and a small Emin .
Therefore, the CIVs of an individual to such activities are
Capacity constraints control the number of people and their
stipulated to increase gradually. Formula 3 provides the
moving speeds in a space unit. The real-time crowd saturation
calculation method of such CIV.
SC of a grid is the ratio of the current capacity to the maximum
capacity. The entrance of additional people is prohibited when CIVi, j, t = (IRRi, j − 1)(CIVi, j, t-1 − IVmax i, j ), (3)
the saturation is equal to 1. The real-time speed ratio (SR) of a
space unit is the ratio of the currently allowed maximum where CIVi, j, t and CIVi, j, t-1 respectively represent the CIVs of
moving speed to the pre-defined maximum moving speed. The participant i to to-be-attended activity j at time t and t-1, IRRi, j
currently allowed maximum moving speed is 4 m/s. A speed refers to the interest recovery ratio of participant i to activity j,
constraint function is defined to control the change in SR, as and IVmax i, j represents the highest interest of participant i to
shown in Formula 2: activity j. For example, the interest of a person in the main
SRx, y, z, t = cos#2π SCx, y, z, t / (SCx, y, z, t +1) 2 $ , SC ∈ [0,1] (2) venue to the exhibition would gradually increase in a non-linear
manner before reaching the preset maximum.
where SRx, y, z, t and SCx, y, z, t respectively represent the speed Moreover, feelings of people to the activity that they are
ratio and crowd saturation of a space unit located on coordinate currently participating are categorized into two: gradual loss of
x, y of z-floor at time t. This formula shows that SR gradually interest or consistent high interest. Thus, the CIVs of an
decreases with the increase in SC in the monotonic interval of individual to the currently-participating activity may gradually
the cosine function. The product of SR and Speed is the current decline, remain the same, or even rise. The attractiveness decay
speed of a person. trend (ADT) is designed to simulate such phenomena. Formula
4 offers the calculation method of such CIV.
B. Behavior-interest model
The behavior-interest model describes the subjective factors CIVi, current, t = (IDRi, current − 1)(1 − ADTi, current )
that drive crowd movements in the venue. The subjective
factors in this scene fall into two main aspects, namely personal × (CIVi, current, t-1 − IVmin i, current ), (4)
interest and activity attractiveness features, as shown in Table6
where CIVi, current, t and CIVi, current, t-1 respectively represent the following: (1) updating the status attributes and the energy
CIVs of participant i to the currently-participating activity at value of each individual; (2) updating the status attributes of
time t and t-1, IDRi, current is the interest decay ratio of each activity; (3) updating the status attributes, saturation, and
participant i to the currently-participating activity, IVmin i, current the current maximum moving speed of each space unit; (4)
updating the interest and attracting values of each activity to
represents the lowest interest of participant i on the activity, and
each participant. The six control strategies ensure the
ADTi, current refers to the attractiveness decay trend of
reasonability of every moving decision-making as follows.
participant i to the activity. Notably, ADTi, current can be Strategy 1: Decision on admission time. This strategy
negative; that is, participant i indicates enjoyment to the current determines the time of each day when the participants first enter
activity and willingness to stay until the end. the venue. The CIVs and CAVs of the crowd and all venue
(2) CAV calculation activities are initialized when the opening of the venue, the
The attractions of conference activities can be affected by activity of the highest matching interest value is selected for
their progresses. A conference activity at the beginning is each individual, and a slightly earlier or later time than the
generally more appealing to people who have not been involved starting time of the activity is set as their entry time.
than the activity near the end. Formula 5 offers the calculation Strategy 2: Judgment of loss of interest. This strategy is
method of such CAV. employed to control the person who is present at an activity to
( t#Tstart j ) decide to leave as their interest fades away. A global control
CAVj, i, t = CAVj, i, t-1 (1 − ADRj, i )[1 − (T ], (5) constant, namely LIV (interest value for losing), is introduced.
end j #Tstart j )
If the current interest matching value of an individual to their
where CAVj, i, t and CAVj, i, t-1 respectively represent the CAV of ongoing activity is lower than the LIV, then these individuals
participant i to activity j at time t and t-1, ( t − Tstart j ) ⁄ ( Tend j − will tend to leave the activity and choose to turn to another
Tstart j ) is the progress of activity j, and ADRj, i represents the available activity based on strategy 3.
attractiveness decay ratio of activity j to participant i. Strategy 3: Decision of activity switching. This strategy
Moreover, an activity is growing less intriguing for people traverses the interest matching values of the conference
already present. Formula 6 offers the calculation of such CAV. personnel who need to switch conference activities at the
moment to all conference activities to determine their next
( t#Tstart j )
CAVj, current, t = CAVj, current, t-1 [1 − (T ], (6) moving destination. A global control constant, namely SIV
end j #Tstart j ) (interest value for switching), is introduced to determine if the
current interest matching value of an individual is sufficiently
where CAVj, current, t and CAVj, current, t-1 respectively represent
large to prompt participation in an available activity as a
the CAV of activity j for participants involved at time t and t-1, switching target. If multiple optional activities reaching the
and ( t − Tstart j ) ⁄ ( Tend j − Tstart j ) is the progress of activity j. MIV value simultaneously are available, then the individual will
The factor of ADR is disregarded in this part to avoid a double switch to the activity with the highest interest matching value.
impact on the calculation of the interest matching value. Strategy 4: Preemption of high-priority activities. This
The two aforementioned calculation methods require special strategy is leveraged to control the people who are currently
settings for the conference personnel who need to participate in participating in a certain activity to decide leaving due to the
some activities passively, such as seminar chairs and keynote start of another activity with high priority. If the current interest
speakers. Their CIV and CAV values to corresponding activities matching value of an individual to an available activity reaches
are set at the maximum, and the factors affecting the changes in the MIV value, the individuals will immediately turn away from
CIV and CAV values, such as IDR, IRR, ADR, and ADT, are set the current activity for the new target activity based on the
at 0. These settings ensure the participation of relevant priority attribute of conference activities. For example, when a
participants in specific conference activities during the data keynote whose priority is far above the exhibition starts, a
generation process. participant will immediately stop watching and turn to the main
The subjective factors, which motivate each participant to venue when the participant is watching the exhibition and is still
decide the next movement (e.g., to stay at the current activity, highly interested in the exhibition because his/her current
to turn to the next activity, or to leave the venue), are simulated interest matching value for the keynote has reached the MIV.
through the above calculations and settings. However, their Strategy 5: Decision of exiting time. This strategy
behavioral decisions are also dictated by objective factors, for determines the exiting time of participants and mainly includes
which the behavior-controlled model is designed. three assessment criteria: (1) the current energy value of a
C. Behavior-controlled model participant is less than the minimum; (2) the interest matching
values for all activities do not reach the MIV value; (3) the
The behaviors of people may change because of the external current time is close to the venue closing time.
environment (e.g., opening of an activity) and internal interests Strategy 6: Overall control of movements. The movements
(e.g., interest changes). A behavior-controlled model is of participants will be constrained by the saturation and the
proposed to simulate the conference schedule and control maximum speed of each space unit when they enter or leave the
crowd movements as the schedule proceeds. This model venue or switch activities.
comprises a four-part updating operation and six control
strategies. The four-part updating operation aims to update the
values of status attributes of conference personnel, conference
activities, and indoor space units. The operation includes the7
Fig. 2. Workflow of data generator
In the initialization, three groups of parameters need to be set.
VI. DATA GENERATION The first group of parameters (e.g., the types of people, the time
A data generator of indoor crowd movement trajectories was and location of each conference activity, and the capacity of
designed in accordance with the results of entity and behavior each grid), as listed in tables I, II, and III, is related to the three
modeling. The data generator was developed using the node.js entity models. The second group is the quantity parameters (e.g.,
development environment on a Linux computer system. Fig. 2 the number of persons to be generated) that are set during the
shows that the data generator comprises four modules, namely entity instantiation. The third group is the behavior control
initializer, background data generator, abnormal data generator, parameters, such as LIV and SIV, set in the behavior models.
and data fusion unit. The four modules are introduced as B. Background data generation
follows.
The background data generator simulates the normal
A. Initialization behaviors of all conference personnel during the conference to
The initializer creates and initializes the three entity and three generate the background data. The output of this generator is a
behavior models. Moreover, the initializer uses configuration CSV file, which records the movements of normal behaviors of
files to set the attributes of the models. Its output is a profile file all conference personnel. The background data generator has
that includes a conference personnel list, a conference activity four sub-modules, namely time slice driver, status updater,
list, a conference venue map, and three initial behavioral behavior controller, and route assigner, as shown in Fig. 2. The
models. The initialization process has the following main steps. background data generation process has the following main
Step 1: Set data types and their data fields. steps.
Step 2: Create and initialize conference personnel, conference Step 1: The time slice driver bins the entire opening time of
activity, and conference venue models. the conference venue by seconds and simulates the time to go
Step 3: Instantiate the conference personnel model, forward.
conference activity model, and the conference venue to Step 2: The status updater for a certain time bin updates the
generate a conference personnel list, activity list, and venue various statuses and attribute values of conference personnel,
map, respectively. activities, and space units.
Step 4: Create and initialize a behavior-constraint model. First, Step 3: The behavior controller determines whether each of
time and capacity constraints are added to the conference venue the conference personnel needs to switch conference activities
map. Then, an energy constraint based on the basic attributes of in the time bin. The behavior controller creates the next target
each individual in the conference personnel list is added. Last, activity for each one who needs to switch based on the six
a permission constraint is added to each activity in the moving decision-making strategies. We regard the venue map
conference activity list. with grids as a graph in which a node represents a grid and an
Step 5: Create a behavior interest model and initialize the edge represents the relation between two adjacent grids. The
interest of each individual in each activity and the attractiveness route assigner adopts the shortest breadth-first path-finding
of each activity to each individual. algorithm [69] to allocate a path from the current activity to the
Step 6: Create and initialize a behavior-controlled model and target activity after considering the real-time saturation and
set the three global control constants, namely LIV, SIV, and speed constraints of each passing grid. Also, some random
MIV. perturbations are added to the path to make the actual
Step 7: Integrate all the initialization results to generate a movements realistic.
profile file, which can be further tuned manually. For example, Step 4: The time slice driver simulates the movements of
we adjust the value of the attractiveness parameter associated conference personnel in the time bin. Then, the time slice driver
with an abnormal activity to ensure it perform abnormally. starts a new time bin and returns to step 2.8
TABLE VI
MOVEMENT PATTERNS OF SEVEN TYPES OF CONFERENCE PERSONNEL
Type Basic Movement Patterns
Takes the VIP channel for entry; no need to sign in; usually rests in the VIP lounge; mainly focuses on the activities in the main
VIP guest
venue and sub-venues; often sits in the front row of the venue;
Sign-in required for entry; mainly moves in the main venue, sub-venues, exhibition halls, and poster areas; independently
Ordinary guest
participates in conference activities based on personal interests;
Similar to ordinary guests but not authorized to enter the main venue and unavailable to lunches and dinners provided by the
Visitor
hosts;
Media reporter Sign-in for entry; rests and works in the media room; often goes to other areas to conduct live broadcasts and interviews;
Hacking contestant Sign-in for entry; mainly moves in the hacking contest area;
Enters the venue in advance to be ready for work; distributed throughout the venue, with own fixed working places and scopes of
Staff
responsibility; often enters and exits the work room and haves lunch in that area;
Exhibitor Sign-in for entry; mainly moves in the exhibition area.
C. Abnormal data generation
VII. GROUND TRUTH
Twelve abnormal events are defined in the scene (Section
VII). An event script is used to describe the event storylines and A. Background
record the involved persons, conference activities, and moving China Intelligence Cyber Security Conference is a fictitious
routes. The output of the generator is a CSV file that records the academic conference in the field of intelligent cyber security.
movements of these abnormal behaviors. The abnormal data The conference, which lasted for three days, invited numerous
generator has five sub-modules, namely time slice driver, event senior experts to give keynotes and set-up a series of academic
script driver, forced status updater, forced behavior controller, activities related to six popular topics, including data security,
and forced route assigner, as shown in Fig. 2. These modules IoT security, mobile security, privacy protection, smart venue,
work together to generate data case by case for each abnormal and smart security technology innovation. The conference also
event. The abnormal data generation process comprises the hosted a large business exhibition and a hacking contest,
following main steps. combined with a variety of social activities, such as tea breaks,
Step 1: The time slice and event script driver simulate the interviews, and a banquet. The detailed schedule of the
timeline of each abnormal event by time bin. conference is provided in the supplementary materials of this
Step 2: The forced status updater for a certain event forcibly paper. Every participant and organizer wore a smart badge
changes the status and attribute values of relevant persons and during the conference to capture their movements in the public
activities when the timeline of the event begins. areas of the venue.
Step 3: The forced behavior controller for the events ensures
B. Conference personnel
that the relevant persons appear at the preset activity and time
in the script. The forced route generator ensures that the A total of 5256 people, which can be classified into seven
relevant persons walk along with the predefined route when types of personnel with different venue permissions and
moving to the target activity. movement patterns, attended the conference as shown in Table
VI.
D. Data fusion
C. Abnormal events
The data fusion unit integrates the background and abnormal
data. Possible conflicts in the two types of data are observed in Twelve notable abnormal events were found during the
the data fusion. For example, a person related to an abnormal conference. These events and involved figures are introduced
event may have his trajectories in the background and abnormal as follows.
data at a certain time. The principle of prioritizing the retention E1: Copy of name badge. Personnel A used a copy of the
of trajectories in abnormal events is adopted to eliminate such name badge of VIP guest B (PID-16632) and wore the copied
conflicts and ensure the smooth connections of the two types of badge to enter the VIP lounge, staying in the lounge for
data. The fused data are sorted in chronological order after the approximately one hour. Personnel A was suspected of theft.
conflicts are eliminated. Moreover, when an individual focuses E2: Item missing. VIP guest C (PID-11260) rested in the VIP
on a conference activity without movements, they will generate lounge after lunch and frequently went to the service desk for
a number of trajectory points at the same position within a inquiry of a possibly missed item. Personnel A was suspected
continuous period of time. Therefore, we remove such duplicate to had stolen the item of VIP C because personnel A stayed in
trajectory points and save the trajectories of individuals the VIP lounge for a long time and hurriedly left the venue after
entering a position to reduce the size of the dataset and VIP C entered.
emphasize the movement behaviors of conference personnel in E3: Equipment failure. On the second day of the conference,
the venue, ultimately to obtain the final ICMTD-2019 dataset. sensors (SID-10715, 10716, 10717, 10718, 10815, 10816,
10817, and 10818) failed from 13:33:21 to 13:56:15, resulting
in missing sensing data.
E4: Personnel ultra vires. The VIP lounge and the media
room were dedicated to VIP guests and media reporters,
respectively. Other types of personnel were not authorized to9
TABLE VII
IMPORTANCE, DISCOVERY RATE, ACCURACY AND DIFFICULT LEVEL OF ABNORMAL EVENTS
Abnormal Event Illustration Importance Discovery Rate Accuracy Difficulty
E1 Copy of name badge 32% 21.9% Simple
E2 Item missing 1.3% 1.0% Difficult
Important
E3 Equipment failure 12.0% 8.7% Medium
E4 Personnel ultra vires 2.7% 1.8% Difficult
E5 Packed sub-venues 6.7% 6.2% Medium
E6 Venue congestion 44.0% 21.0% Simple
Moderate
E7 Book signing 24.0% 19.2% Medium
E8 Group visit 8.0% 3.3% Difficult
E9 Forgotten badge 2.7% 1.7% Difficult
E10 Early exit of hacking contest 5.3% 4.7% Difficult
General
E11 Staff lateness 20.0% 15.6% Medium
E12 Staff lunch turns 5.3% 2.7% Difficult
enter these areas. However, two media reporters (PID-11201 E12: Staff lunch turns. The staff in the venue were divided
and 16473) acted beyond their authority to enter the VIP lounge into two groups to have lunch alternately at the work room, and
at 9:00–9:20 and 10:30–10:50, respectively, on the first day of their dining times were 11:40–12:10 and 12:10–12:40.
the conference; a VIP guest (PID-13344) entered the media
room at 12:29:04–12:39:50 on the second day. VIII. EVALUATION
E5: Packed sub-venues. Three sub-venue activities drawn the A two-phase evaluation was conducted to verify the
attention of unexpectedly numerous participants. These
completeness, usability, and validity of the ICMTD-2019
activities were the Internet of Things Security Forum held at
dataset. The first phase was an internal test, in which an
Sub-venue B at 14:00–16:15 on the second day, the Mobile independent test team was invited to test the dataset
Security Forum held at Sub-venue B from 9:30–11:30 on the
completeness and analyze the movement patterns of various
third day, and the Intelligent Security Technology Innovation
groups of people and abnormal events without knowing the
Forum held in Sub-venue A at 10:30–11:30 on the third day.
ground truth. The test results showed that the ICMTD-2019
E6: Venue congestion. The spaces of tea break areas,
dataset has good completeness and usability and it behaves
restrooms, and corridors were limited, and the staff failed to consistently with the ground truth. The second phase was an
guide crowd movements effectively, resulting in congestions external test, in which the ICMTD-2019 dataset was used by
during tea breaks.
ChinaVis Data Challenge 2019 [54]. The external test will be
E7: Book signing. A book signing was held in the exhibition
comprehensively discussed below.
hall at 13:00–14:30 the second day, with a large number of
participants gathering in the hall. A. Evaluation process
E8: Group visit. During the conference, four visiting groups ChinaVis Data Challenge 2019 invited researchers,
toured the exhibition hall and poster area of the venue at 10:00– developers, and amateurs who used their most effective
11:00, 15:00–16:00 on the first day and 10:00–11:00, 15:00– methods, techniques, and tools to analyze the ICMTD-2019
16:00 on the second day, respectively. Visiting groups dataset. Their data analytics tasks included the following: (1)
generally acted collectively, with a size of approximately 100 inferring the schedule of the conference; (2) analyzing the types
people. of conference personnel in the venue and summarizing the
E9: Forgotten badge. VIP guest G (PID-19929) was the chair movement patterns of each type; (3) identifying at least five
of the hacking contest. At 9:00 on the second day, VIP guest G abnormal events; (4) summarizing the deficiencies in
came to the hacking contest venue and forgot the badge on the conference organization and management. Contestants were
podium until the end of the contest around 17:30 when VIP required to submit analysis results and demonstration videos.
guest G returned to the podium to get the badge back and then The organizing committee of the data challenge invited experts
left the venue. of public security and visual analytics to review the entries
E10: Early exit of hacking contestants. The hacking contest jointly. Each entry was randomly assigned to four to six experts
was divided into two parts: basic and additional assessments. who gave scores and comments from the five aspects of
The basic assessment was conducted in the morning of the first analysis quality, visual design, interaction design, originality,
and second days of the conference, whereas the additional and scalability according to the ground truth and personal
assessments were held in the afternoon of the first and second experience. The entry score was based on a five-point system,
days and the morning of the third day, adopting a knockout with five being the best and one the worst. The supplementary
system. Thus, some contestants left the venue soon after being materials of this paper provide the introduction of some entries.
eliminated. Three types of feedback in the course of the data challenge were
E11: Staff lateness. Staff should enter the venue in advance. collected to evaluate the effectiveness of the ICMTD-2019
However, some staff, including: PID-18347, 10345, 14859, dataset: (1) expert review comments and scores; (2) discovery
18059, 12856, 11396, 14678, 10762, and 17576, were late. rate and accuracy of the abnormal event analysis of the entries;10
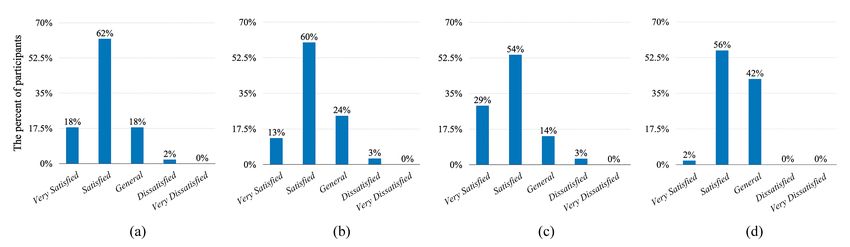
Fig. 3. Questionnaire results from the contestants of China Vis Data Challenge 2019. (a) Scene design satisfaction; (b) Dataset overall quality satisfaction; (c)
Review results satisfaction; (d) Task setting difficulty satisfaction.
(3) questionnaire of the contestants. The evaluation results will and medium-difficult events can be found in many entries.
be presented below. Several high-difficulty events were also found to challenge the
contestants.
B. Evaluation results
Simple events obtained relatively high discovery rates and
1) Analysis quality evaluation accuracies, with distinctive crowd movement patterns. The
A total of 75 entries from 359 contestants were received. The contestants can identify abnormal events by observing the
expert review results indicate that the average score of the overall distributions of trajectories in the venue, such as
entries was 2.7 points, and the average variance was 0.5 points. discontinuous or repeated trajectories (E1) and large-scale
Among these results, 32 entries were scored above 2.7 points, crowd gathering (E6). For moderately difficult events, the
mainly concentrating between 3.0–3.5 points. The average contestants must analyze crowd movements and their
scores of the five aspects (i.e., analysis quality, visual design, distributions from a fine-gained time and space granularity,
interaction design, originality, and scalability) were 2.7, 2.8, 2.7, such as missing data (E3) and gatherings of small groups of
2.6, and 2.6, respectively. The results reveal that a majority of people (E5 and E7). Moreover, the contestants must to correctly
contestants completed most of the data analytics tasks. The identify personnel types with unique movement trajectories,
overall difficulty of the ICMTD-2019 dataset was moderate, such as the lateness of some staff (E11). The analysis challenges
and data users can effectively analyze most of the preset of difficult events originate from two aspects. (1) The
movement patterns and abnormal events in the data. contestants must correctly and completely identify the
In addition, we invited domain experts to assess the permissions and movement patterns of all types of conference
importance of each abnormal event according to the severity of personnel and then recognize the VIP lounge, media room,
threat it posed to venue management. The 12 abnormal events hacking contest area, tea break area 1, tea break area 2, and
were divided into 4 important events, 4 moderate events and 4 work room that were not disclosed in the map provided in the
general events. Important events (E1–E4) usually brought data challenge. For example, E4 required contestants to identify
severe threats to venue security or personal safety. Moderate the media room and VIP lounge, as well as the corresponding
events (E5–E8) usually led to crowding in the venue and media reporters and VIP guests who were allowed to enter. (2)
therefore may put the safety of persons at risk. General events The contestants were expected to determine sudden changes of
(E9–E12) did not directly affect persons and activities in the movement patterns and combine them with other abnormal
venue. events, including E2, E9, and E10, to explore the hidden truth
2) Event difficulty evaluation jointly. For instance, E2 required recognition of the frequent
The discovery rate and accuracy of the 12 abnormal events movements of an individual between the VIP lounge and the
were calculated for each entry. The discovery rate was the ratio service during a short time and combination of the clue of E1.
of the number of entries from which an abnormal event was 3) Subjective evaluation
found to the total number of entries. The accuracy was the The subjective feedback of the contestants on the scene
average completeness of the information concerning abnormal design of the dataset, the overall quality of the dataset, the
event identification (i.e., time, locations, persons, and event results of the entry review, and the difficulty of analysis tasks
contents) of all entries. The results indicate that the difficulty of were collected in the form of questionnaires. A total of 55 valid
correct analysis of each event was depicted on the basis of the answers were received, and the results are shown in Fig. 3.
accuracy indicator. The events with an accuracy larger than Approximately 80% of the contestants were satisfied with the
20%, between 5.0% and 20%, and less than 5.0% were simple, scene design of the dataset (Fig. 3(a)). These contestants
medium-difficult, and difficult events, respectively. Table VII believed that the scene was realistic, the background was
shows that the 12 abnormal events were classified into two completed, and the design of characters, events, and spatial
simple, four medium-difficult, and six difficult events. structure was reasonable. Approximately 73% of these
Consequently, the difficulty of the abnormal events embedded contestants commented that the overall quality of the ICMTD-
in the ICMTD-2019 dataset was varied and reasonable. Simple 2019 dataset was good (Fig. 3 (b)). Moreover, the dataset size11
and time span were moderate, containing many interesting clues REFERENCES
and rich temporal and spatial patterns of crowd movements, [1] P. Chen, G. Shi, S. Liu, and M. Gao, “Collision Avoidance Situation
which can elicit the enthusiasm of people for analysis. Matching with Vessel Maneuvering Actions Identification from Vessel
Approximately 83% expressed satisfaction with review scores Trajectories,” Int. J. Perform. Eng., vol. 15, no. 6, pp. 1499–1507, 2019.
[2] J. Yuan, Y. Zheng, X. Xie, and G. Sun, “Driving with knowledge from
and comments (Fig. 3(c)), which showed the fairness and the physical world,” in Proc. 17th ACM SIGKDD Int. Conf. Knowl.
rationality of expert views of the entries. Approximately 58% Discov. Data Min., San Diego, California, USA, 2011, pp. 316–324.
believed that the analytics tasks were slightly challenging (Fig. [3] J. Yuan, Y. Zheng, C. Zhang, et al., “T-drive: driving directions based
3(d)), which can identify the effectiveness of the methods, on taxi trajectories,” in Proc. 18th GIS Proc. ACM Int. Symp. Adv. Geogr.
Inf. Syst., San Jose, California, pp. 99–108, 2010.
technologies, and systems. [4] M. Piorkowski, N. Sarafijanovic-Djukic, and M. Grossglauser,
“CRAWDAD dataset epfl/mobility[Online]”.
IX. CONCLUSION Available: https://crawdad.org/epfl/mobility/20090224, Accessed on:
Feb 2009
This paper introduces a benchmark dataset of crowd [5] M. Piorkowski, N. Sarafijanovic-Djukic, and M. Grossglauser, “A
movement trajectories in smart venues. The scene design, Parsimonious Model of Mobile Partitioned Networks with Clustering,”
modeling process, and generation method of the dataset and its in Proc. 1st Int. Conf. COMmun. Syst. NETw., pp. 258–267, 2009.
[6] J. Zhou and W. Fu, “Quality Evaluation of Degraded Basketball Video
ground truth are elaborated. In addition, the application of the Image Restoration based on Classification Learning,” Int. J. Perform.
ICMTD-2019 dataset in ChinaVis Data Challenge 2019 is Eng., vol. 16, no. 3, pp. 392–400, 2020.
comprehensively presented to verify the completeness, [7] J. Herrera, D. Work, R. Herring, X. Ban, and A. Bayen, “Evaluation of
usability, and validity of the dataset. The results show that the Traffic Data Obtained via GPS-Enabled Mobile Phones: the Mobile
Century Field Experiment,” Transp. Res. Pt. C-Emerg. Technol., vol. 18,
ICMTD-2019 dataset presents good completeness and usability, pp. 568–583, 2009.
and can effectively identify the performance of methods, [8] A. B. Chan, Z. Liang, and N. Vasconcelos, “Privacy preserving crowd
technologies, and systems for indoor trajectory analysis. monitoring: Counting people without people models or tracking,” in
This work still has some limitations. First, in terms of the Proc. IEEE Conf. Comput. Vis. Pattern Recogn., pp. 1–7, 2008.
[9] C. Zhang, H. Li, X. Wang, and X. Yang, “Cross-scene crowd counting
scalability of the data generator, on the one hand, all parameters via deep convolutional neural networks,” in Proc. IEEE Conf. Comput.
of the proposed data generator can be adjusted, making it Vis. Pattern Recogn., pp. 833–841, 2015.
convenient to generate new data. Specially, an arbitrary number [10] C. C. Loy, S. Gong, and T. Xiang, “From Semi-Supervised to Transfer
of participants can be set to generate new data of different sizes. Counting of Crowds,” in Proc. IEEE Int. Conf. Comput. Vision, pp.
2256–2263, 2013.
On the other hand, the scene and the map of our data generator [11] K. Chen, S. Gong, T. Xiang, and C. C. Loy, “Cumulative Attribute Space
cannot support major changes that may result in the redesign of for Age and Crowd Density Estimation,” in Proc. IEEE Conf. Comput.
the entity and behavior models, which is the main limitation of Vis. Pattern Recogn., pp. 2467–2474, 2013.
this work. [12] C. C. Loy, K. Chen, S. Gong, and T. Xiang, “Crowd Counting and
Profiling: Methodology and Evaluation,” in Modeling, Simulation and
Second, the three behavior models are relatively simple, Visual Analysis of Crowds, New York, 2013, pp. 347–382.
leading to difficulties in achieving a complete representation of [13] K. Chen, C. C. Loy, S. Gong, and T. Xiang, “Feature Mining for
the complexity and diversity of human behaviors in the real Localised Crowd Counting,” in Proc. Br. Mach. Vis. Conf., Guildford,
world. A lot are worth doing to improve the behavior modeling. Surrey, UK, 2012.
[14] IEEE Vast Challenge 2016 homepage [Online].
For example, the energy of a person in a venue can be recharged Available: http://www.vacommunity.org/VAST+Challenge+2016
briefly by taking a short break. [15] IEEE Vast Challenge 2016 benchmark [Online].
Finally, a square area of 8 × 8 m2 is considered to be a space Available: http://www.cs.umd.edu/hcil/varepository
unit when modeling the venue space, but such division is still [16] Y. Zhao, K. Yang, S. Chen, et al., “A benchmark for visual analysis of
insider threat detection,” Sci. China-Inf. Sci., to be published. DOI:
of relatively large granularity, making it hard to reflect high- 10.1007/s11432-019-2776-4.
precision movement patterns. [17] Z. Wei, R. Jiang, X. Wei, et al., “Novel indoor positioning system based
In future work, we will be devoted to designing data on ultra-wide bandwidth”, Vis. Comput. Ind. Biomed. Art, vol. 3, no. 1,
generation methods with less constraints by the scenario. We pp. 1, 2020.
[18] Z. Zhou, L. Meng, T. Cheng, et al., “Visual Abstraction of Large Scale
will take into account more human factors in order to simulate Geospatial Origin-Destination Movement Data,” IEEE Trans. Vis.
realistic and diverse human behaviors. Furthermore, high- Comput. Graph., vol. 25, no. 1, pp. 43–53, 2019.
precision indoor spaces will be considered to produce subtle [19] D. Dardari, P. Closas, and P. M. Djurić, “Indoor Tracking: Theory,
movement patterns and characteristics. At last, the combination Methods, and Technologies,” IEEE Trans. Veh. Technol., vol. 64, no. 4,
pp. 1263–1278, 2015.
of data- and program-driven methods should be a good [20] Y. Yang, “Wireless Sensor Node Location based on IGWO-LSSVM,”
direction for benchmark data simulation. Int. J. Performability Eng., vol. 16, no. 9, pp. 1434–1442, 2020.
[21] S. S. Saab and Z. S. Nakad, “A Standalone RFID Indoor Positioning
ACKNOWLEDGMENT System Using Passive Tags,” IEEE Trans. Ind. Electron., vol. 58, no. 5,
pp. 1961–1970, 2011.
Thanks to all the organizers, reviewers, and participants of [22] A. Yassin, Y. Nasser, M. Awad, et al., “Recent Advances in Indoor
ChinaVis Data Challenge 2019. Thanks to Qi Ma, Xueshi Wei Localization: A Survey on Theoretical Approaches and Applications,”
IEEE Commun. Surv. Tut., vol. 19, no. 2, pp. 1327–1346, 2017.
and Chenhua Xie from Qi An Xin Technology Group Inc. for [23] S. Feldmann, K. Kyamakya, A. Zapater, and Z. Lue, “An Indoor
their fruitful discussions. The work is supported in part by the Bluetooth-Based Positioning System: Concept, Implementation and
National Natural Science Foundation of China (No.61872388 Experimental Evaluation,” in Proc. Int. Conf. Wireless Netw., pp. 109–
113, 2003.
and 62072470). The ICMTD-2019 dataset is available at [24] M. Wang, Y. Lin, Q. Tian, et al., “Transfer Learning Promotes 6G
https://github.com/csuvis/IndoorTrajectoryData/ and Wireless Communications: Recent Advances and Future Challenges”,
http://www.chinavis.org/2019/english/challenge_en.html. IEEE Trans. Reliab., vol. 70, no. 2, pp. 790–807, 2021.You can also read