GB RETAIL AND LEISURE MARKET ANALYSIS - FULL YEAR 2020 - PUBLISHED MARCH 2021 BY LOCAL DATA COMPANY
←
→
Page content transcription
If your browser does not render page correctly, please read the page content below

GB RETAIL AND LEISURE
     MARKET ANALYSIS
              F U L L YE A R 20 20

               PUBL ISHED M A R CH 2021
              BY L OCA L DATA COM PA NY
                   COPY R I G HT 2021
 No part of this report may be reproduced or distributed without consent

                      www.localdatacompany.com
G B RETAIL AND LEIS U RE MA RK E T A NA LYS IS - F UL L Y EAR 2 0 2 0

         FO R EWO R D

         2020 was a year like no other, as the pandemic             future relationship with the EU.
         impacted all aspects of our personal and professional
         lives. This created one of the toughest trading            With the rapid pace of change in the market, it is
         climates for the retail sector, with all stakeholders      important to note that these figures do not include
         having to rethink, adapt and show resilience in the        the closures that will happen as a result of the sale
         face of a catalogue of challenges.                         of Arcadia and Debenhams in January 2021. This
                                                                    activity will be captured alongside the other recent
         This report focuses on the 12 months of 2020, which        announcements including Thorntons and John
         we must not forget was unaffected by the pandemic          Lewis in our H1 2021 report, which will also track
         until March. These first months of the year were           the much-anticipated reopening of the market,
         filled with relative vibrancy after the general election   which begins on 12th April 2021 (correct at time of
         provided some much-needed certainty on the UK’s            writing).

                                                                          Local Data Company Ltd, 13-19 Vine Hill, London, EC1R 5DW. All Rights Reserved.
Page 2                                                                    +44 (0) 20 3111 4393 | team@localdatacompany.com | www.localdatacompany.com
G B RETAIL AND LEIS U RE MA RK E T A NA LYS IS - F UL L Y EAR 2 0 2 0

                 C O NT E NT S

     4            ABOUT LOCAL DATA COMPANY                                        46   2021 OUTLOOK
                                                                                       Openings and closures
     7            KEY FINDINGS                                                         Vacancy rates

     10           INTRODUCTION                                                    49   CONCLUSION
                  Openings and closures
                  Temporary closures
                                                                                  50   COMMENTARY
                  Vacancy rates
                                                                                       Lucy Stainton, Head of Retail and Strategic
                  Failures and job losses                                              Partnerships

     18           LOCATIONS
                                                                                  51   METHODOLOGY
                  Openings and closures by location type
                  Vacancy rates by location type
                                                                                  52   GLOSSARY
                  Regional vacancy rates
                  Persistent vacancy
                  Redevelopment activity
                  Case study – West Byfleet
                  Hyper-localisation
                  Case study - Heckmondwike

     29           SECTORS
                  Net change
                  Top 10 growing categories
                  Top 10 declining categories
                  Multiples vs independents

     39           BRANDS
                  CVA/Administration activity
                  Case study – reoccupation of former stores
                  Expanding brands

Local Data Company Ltd, 13-19 Vine Hill, London, EC1R 5DW. All Rights Reserved.
+44 (0) 20 3111 4393 | team@localdatacompany.com | www.localdatacompany.com
                                                                                                                                     Page 3
G B RETAIL AND LEIS U RE MA RK E T A NA LYS IS - F UL L Y EAR 2 0 2 0

         A B O UT T H E L O C A L D ATA C OMPANY

         The Local Data Company is the UK’s most accurate            data is underpinned by our proprietary technology
         retail location insight company. We physically track        stack which supports the field research and quality
         every retail and leisure business across the country.       control processes. This technology enables us to
         Our data powers strategy and decision making for            provide our clients with unrivalled insight on over
         our clients working across retail, leisure, out-of-         680,000 retail and leisure businesses, access to
         home media, investment, property and financial              location insight dashboards and footfall tracking
         services.                                                   capabilities.

         Our team of field researchers record the occupancy          Our team of analysts and sector experts is committed
         status of every business on a regular basis. This           to understanding the unique challenges our clients’
         frequency enables us to track how the market is             businesses face and applying our comprehensive
         changing in close to real-time. The accuracy of our         data to support their strategic objectives.

         OUR PRODUCTS

         RICH, ACCURATE DATA
         Our database contains over 680,000 addressable,
         field-researched points of interest including over
         400,000 independent premises and every chain
         retail and leisure brand across the UK.

         ANALYTICS
         Local Data Online provides fast and accurate access
         to market trends, competitor insights and portfolio
         analysis tailored to your business.

         STRATEGY
         For over fifteen years our dedicated insight team has
         been working in partnership with clients committed
         to investing in retail via a range of strategic projects.

         FOOTFALL TECHNOLOGY
         Accurate counting and analysis of footfall trends is
         invaluable. Our proprietary technology stack provides
         this at a granular level, enabling forensic insights into
         flows and trends around a physical space.

                                                                          Local Data Company Ltd, 13-19 Vine Hill, London, EC1R 5DW. All Rights Reserved.
Page 4                                                                    +44 (0) 20 3111 4393 | team@localdatacompany.com | www.localdatacompany.com
G B RETAIL AND LEIS U RE MA RK E T A NA LYS IS - F UL L Y EAR 2 0 2 0

           PROJECTS WE WORK ON INCLUDE:                                           BUSINESSES WE WORK WITH:

           •     Location planning and strategy
           •     Due diligence
           •     Store rationalisation
           •     Competitor and market tracking
           •     Investment strategy and asset management
           •     Anti-money laundering
           •     Alt-data projects
           •     COVID-19 impact analysis
           •     Portfolio strategic realignment

                “
                After opening a number of successful dark kitchens and with home delivery being

                an even more critical part of our strategy due to the covid-19 pandemic, Chopstix

                Group enlisted LDC to support the expansion of our dark kitchen network. LDC

                analysed the existing sites to establish drivers of performance and used this as a

                framework for identifying what the market capacity was for this concept as well as

                providing us with a list of locations to target. It was critical for us to work with live

                and accurate data for this project, and the experienced team at LDC helped up carve

                out a strategic plan of action against set against a complex market background.
                                                                                                             “
                JOHN L AKE

                MANAGING DIRECTOR, CHOPSTIX GROUP

Local Data Company Ltd, 13-19 Vine Hill, London, EC1R 5DW. All Rights Reserved.
+44 (0) 20 3111 4393 | team@localdatacompany.com | www.localdatacompany.com
                                                                                                                 Page 5
G B RETAIL AND LEIS U RE MA RK E T A NA LYS IS - F UL L Y EAR 2 0 2 0

     L OCA
    LOC  ALL DDATA
                ATAC OCO
                       M PA NY RESE ARC H M ETHODOLOGY
                          MPANY
    DATA R E S E A R C H
    ME T H O D O L O G Y

         Our field
         research
         coverage
                                       70 different data variables
         includes:
                                          collected including:
        680K
         retail                                               • Brand
      and leisure            Every high                         name
      businesses            street, retail                    • Address
                              park and                        • Geocode
        400K                  shopping                        • Website
     independent                centre                        • Telephone
      businesses             across the                         number                                                                Data is
                              country is                                                                                            analysed by
         3,200              visited either                                                                                         LDC’s Quality
       GB retail             on a 6 or 12                                                                                          Control Team
      destinations          month cycle.

                                                                                       Live data is uploaded
                                   24 hour                                         in real time each day to the                    80k updates
                                   update                                         secure Local Data Company                         processed
                                   cycles                                                     server                                per month

                                                                         Database of over
                                                                          680K premises
                       Products:
                                                                            including:        Equalling in excess
                                 Online                        400k
                                                           independent                          of 1.2 million
                                 Insight
                                                            businesses      4,800     10 year unique records
                               Dashboards
                                                                           national     time
                                                                           brands      series
                                                  Rich,
                                                 Accurate
                                                   Data
                                                                      Strategic
                                                                     Consulting

         The Local Data Company is the only business tracking the huge change taking place across

         the GB retail and leisure market in near real-time.

         Contact us at team@localdatacompany.com or visit www.localdatacompany.com to find

         out more about accessing data and insights on the post-covid landscape.

                                                                                  Local Data Company Ltd, 13-19 Vine Hill, London, EC1R 5DW. All Rights Reserved.
Page 6                                                                            +44 (0) 20 3111 4393 | team@localdatacompany.com | www.localdatacompany.com
G B RETAIL AND LEIS U RE MA RK E T A NA LYS IS - F UL L Y EAR 2 0 2 0

           KEY FIN D IN GS

           1.                                                                     4.
           EXPOSURE TO COMPARISON RETAIL LED                                      CHALLENGES AHEAD FOR OWNERS OF
           TO INCREASED RISK FOR SHOPPING                                         VACANT DEPAR TMENT STORE SPACE
           CENTRES
                                                                                  With the announcements that Debenhams will close
           Shopping Centres were the most negatively                              and John Lewis will shutter more stores, landlords
           impacted of all location types in 2020, with a net                     have a challenging task ahead in finding reoccupiers
           loss in occupied units of 5.4%. The retail mix within                  for large-format space. Of the House of Fraser,
           these asset types tends to comprise of more ‘non-                      Debenhams or Beales department stores that
           essential’ retailers than other location types. On                     closed between January 2017 and December 2019,
           average, 57% of units in Shopping Centres are                          only 24% had found new occupiers with no capital
           Comparison Goods stores, much higher than the                          investment required by the end of 2020. 30% of
           average for the High Street at 28%. The risk that this                 the former department stores saw some structural
           creates for Shopping Centres is evident by data on                     change either being demolished or split into smaller
           the Comparison Goods retail sector, which declined                     units. This is likely to be the favoured approach for
           by -6,984 units in 2020, accounting for 62% of the                     the 124 Debenhams stores that closed at the end
           total stores that were lost in 2020.                                   of 2020.

           2.                                                                     5.
           LACK OF COMMUTER AND                                        TOURIST    FUTURE DEMAND FOR RETAIL SPACE IS
           FOOTFALL HIT CITIES HARD                                               THE KEY FACTOR IN RETAIL REVIVAL
           The Vacancy Rate across City Centres increased                         Despite the challenges in 2020, 39,060 stores
           by 2.5% to 16.1% in 2020, the fastest jump seen                        opened their doors for the first time. 42% of these
           across all town profiles analysed. The move to                         were prior to the pandemic with the rate of opening
           remote working, loss of international tourists and                     after March at an all-time low. Total online retailing
           cancellation of major sporting events and concerts                     values increased by 46.1% in 2020 when compared
           which are key City Centre attractions, collectively                    to 2019 (Source: ONS). This jump is likely to have a
           created a sharp downturn in footfall. Two town                         longer-term impact in 2021 as retailers opt for fewer
           profiles which benefited from the pandemic were                        stores. However, locations suited to support online
           Villages and Commuter Towns where vacancy                              operations such as those out of town and on retail
           increased by just 0.4% and 1.2% respectively, both                     parks will boost store openings across 2021.
           below the national average increase of 1.6%.

           3.
           SLOWDOWN      IN   REDEVELOPMENT
           ACTIVITY AS THE PROPER TY MARKET
           ENTERED A DEEP FREEZE
           There was a slowdown in property redevelopment
           activity for the first time in five years, with the number
           of retail and leisure units being converted for other
           use such as office and residential dropping by
           16%. This was due to operational delays caused by
           restrictions during lockdown, landlords and investors
           delaying plans due to market uncertainty and many
           businesses being unwilling to commit the capital
           needed to complete work.

Local Data Company Ltd, 13-19 Vine Hill, London, EC1R 5DW. All Rights Reserved.
+44 (0) 20 3111 4393 | team@localdatacompany.com | www.localdatacompany.com
                                                                                                                                           Page 7
G B RETAIL AND LEIS U RE MA RK E T A NA LYS IS - F UL L Y EAR 2 0 2 0

         T R AC K I N G FOOT FALL T R EN DS ACROSS A RE COVE RIN G M ARKET
         LOCAL DATA COMPANY’S 2 ND GENERATION FOOTFALL TECHNOLOGY

         THE CHALLENGE                                             OUR PRODUCT

         When the ‘non-essential’ retail market reopens            The latest generation of Local Data Company
         across UK high streets, shopping centres and              Footfall Sensor achieves a marketing-leading level
         retail parks, measurement of how and when footfall        of accuracy, capturing ground-truth data on footfall
         returns is key to understanding the long-term impact      trends without relying on proxies or generalising
         of the COVID-19 pandemic and what future strategy         trends based on smaller data samples.
         should be for occupiers, local authorities, landlords
         and other retail stakeholders.
                                                                   Our proprietary technology uses low-level radar
                                                                   waves to count people walking within a set field of
                                                                   vision. It has been tested to perform within a +/-
                                                                   5% error margin and works consistently 24/7, in all
                                                                   weather conditions.

         SENSOR                                                    BASE STATION

         Sensors have been designed to sit discreetly in a store environment and are installed by fully trained engineers,
         briefed to cause minimum disruption during their visit.

         THE OUTPUT
         The unique benefit of our footfall data is not just       Data is available each Monday for the previous week
         the market-leading accuracy of our technology, but        in a range of formats: raw data files, via our online
         our ability to combine this with powerful, historical     insight platform, or as bespoke reports produced by
         insight on 680,000 retail and leisure units. Adding       our insight team.
         our contextual data enables us to tell the full story –
         not just how footfall is changing, but why.

                                                                          Local Data Company Ltd, 13-19 Vine Hill, London, EC1R 5DW. All Rights Reserved.
Page 8                                                                    +44 (0) 20 3111 4393 | team@localdatacompany.com | www.localdatacompany.com
G B RETAIL AND LEIS U RE MA RK E T A NA LYS IS - F UL L Y EAR 2 0 2 0

           USE CASES
           It’s not only strategically important to track footfall                portfolio of stores or a location can support a range
           as part of the COVID-19 recovery effort. Having an                     of long-term strategic activities.
           accurate and robust source of footfall data on a

Local Data Company Ltd, 13-19 Vine Hill, London, EC1R 5DW. All Rights Reserved.
+44 (0) 20 3111 4393 | team@localdatacompany.com | www.localdatacompany.com
                                                                                                                                          Page 9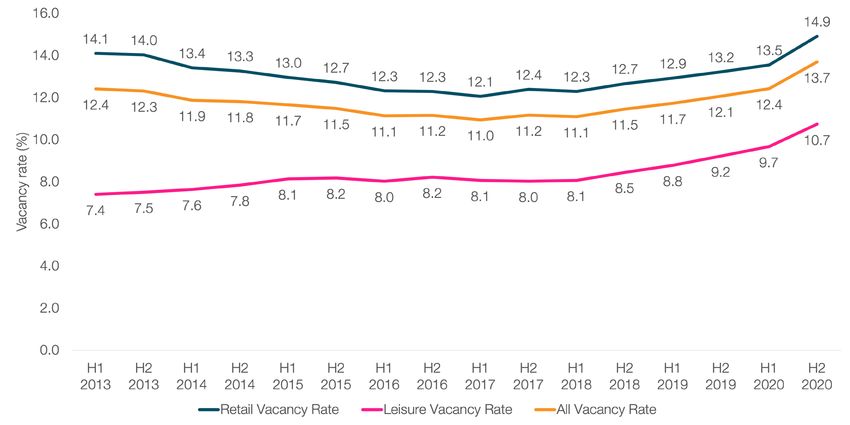
G B R ETAIL AND LEISU RE MA RK E T A NA LYS IS - F U LL Y E AR 2 0 2 0

                       INTRO D UCTION

                                                                          Local Data Company Ltd, 13-19 Vine Hill, London, EC1R 5DW. All Rights Reserved.
Page 10                                                                   +44 (0) 20 3111 4393 | team@localdatacompany.com | www.localdatacompany.com
G B RETAIL AND LEIS U RE MA RK E T A NA LYS IS - F UL L Y EAR 2 0 2 0
I NT R O D UC T IO N
2020 was the year defined by one word: COVID-19. This report will provide evidence for some of the
A new Coronavirus spread across the world at a trends noted anecdotally across the year and will
rapid pace, landing in the UK in January and causing highlight not only the intense challenges faced by the
indeterminate damage to both the nation’s health market, but the green shoots of growth for a select
and the economy. The retail and leisure market was group of winners. Our prediction is that the road to
at the core of this damage, hitting the headlines recovery is on the horizon, but for occupiers and
daily; from panic buying to the Eat out to Help Out landlords alike, the situation will get worse before it
scheme and, creeping into 2021, the sad news of gets better.
two high street giants, Debenhams and Arcadia
falling into administration and shutting up (physical)
shop for good.
Local Data Company Ltd, 13-19 Vine Hill, London, EC1R 5DW. All Rights Reserved.
+44 (0) 20 3111 4393 | team@localdatacompany.com | www.localdatacompany.com
Page 11G B R ETAIL AND LEISU RE MA RK E T A NA LYS IS - F U LL Y E AR 2 0 2 0
O P E NI N GS A ND CLOS U R ES
The retail and leisure market was one of the sectors Retail and leisure openings were down by 13% as
which was hit the hardest by the pandemic, evident many businesses paused expansion plans. There
from the 50,379 closures across GB in 2020. were 39,060 openings in 2020; the lowest number
However, this was down 6.8% on the previous since we started reporting on this metric in 2013.
year which might surprise many, but there are two Of the 39,060 openings, 43% occurred in the first
reasons for this: three months of the year. The slowdown in openings
resulted in a net loss of 11,319 units, once again, the
highest number since our records began.
• Potent Government support schemes including
the business rates holiday and protection from
evictions put the property sector into a deep
freeze. These measures enabled most retailers
to keep their head above water as landlords
50,379
took the hit on rental collections; only 54% of
retail rents were collected within 14 days of the
last December rents day according to Re-leased
(Source: Re-leased, 2021). This equated to a
year-on-year decline of 18%.
• The temporary closure of the ‘non-essential’ retail
market depressed closures as well as openings,
with total activity (openings + closures) down by CL OSURE S
9.6% compared to 2019. ACROSS G B IN 202 0
ANNUAL MARKET ACTIVITY (OPENINGS + CLOSURES), 2013 - 2020
Figure 1: Number of openings and closures across GB, 2013 - 2020 (Source: Local Data Company)
Local Data Company Ltd, 13-19 Vine Hill, London, EC1R 5DW. All Rights Reserved.
Page 12 +44 (0) 20 3111 4393 | team@localdatacompany.com | www.localdatacompany.comG B RETAIL AND LEIS U RE MA RK E T A NA LYS IS - F UL L Y EAR 2 0 2 0
T E M P O R ARY CLOS UR ES
The introduction of the first UK lockdown in March following the first round of national restrictions. June
2020 brought with it a term we would become very and July saw the biggest increases in ‘non-essential’
familiar with, as only stores deemed ‘essential’ by units reopening, with many occupiers adapting
the government were legally able to remain open. operations and store infrastructure in order to meet
Those classified as ‘non-essential’ had to close strict social distancing guidelines. The peak of the
until the virus was brought back under control. Just recovery came in September when 83% of units
19.5% of occupiers on GB high streets fell into that were eligible to reopen had done so and some
the ‘essential’ classification and just 15.4% within businesses were encouraging staff to begin the
shopping centres, which reflects the scale of the return to the office. Albeit this was short-lived with
shut down at the time. a tightening of restrictions returning fairly promptly.
Some essential retailers closed stores initially and
reopened fairly promptly once stores had been
Figure 2 shows the gradual recovery of the market adapted to meet COVID guidelines, represented in
as occupiers were given staggered dates to reopen Figure 2 by the 3% reopening rate seen in April.
REOPENING RATE BY MONTH OF VISIT
Figure 2: Monthly reopening rate across GB by month of field research visit across 2020 (Source: Local Data Company)
Analysis of the units surveyed by our field team in the first lockdown. This ‘frozen market’ will have to
September and October 2020, prior to the second thaw in 2021, with the end of the various support
national lockdown in November and circuit breaker packages for businesses and holiday on business
in Wales, showed that 3.6% of businesses had failed rates likely to force their hand. This is likely to result
to reopen and had not vacated their premises since in another jump in closures for the year.
Local Data Company Ltd, 13-19 Vine Hill, London, EC1R 5DW. All Rights Reserved.
+44 (0) 20 3111 4393 | team@localdatacompany.com | www.localdatacompany.com
Page 13G B R ETAIL AND LEISU RE MA RK E T A NA LYS IS - F U LL Y E AR 2 0 2 0
VAC A NC Y
Vacancy Rates increased significantly across the of 2020, the GB average All Vacancy Rate (retail and
board in 2020. With the reopening of the retail sector leisure combined) was 13.7% - the highest on Local
starting on the 15th June, closure activity and the Data Company records (which began in 2013). This
first visible impact of the pandemic on occupancy equates to a 1.6% increase across the year - the
became evident halfway through the year. At the end biggest annual jump in vacancy ever recorded.
HISTORICAL VACANCY RATES
Figure 3: Historical Vacancy Rates by type, 2013 - 2020 (Source: Local Data Company)
For context, even in 2018, widely coined the ‘Year of The Leisure Vacancy Rate (excludes retail units)
the CVA’, the Vacancy Rate only increased by 0.3%, increased by 1.5% in 2020 ending the year in double
emphasising the scale of the challenges faced by digits for the first time ever (10.7%). After years of
the sector in 2020. growth, the leisure bubble burst resulting in an
increase in vacancy of 0.9% in 2019 as many casual
dining brands rationalised their estates. Arguably,
The Retail Vacancy Rate (excludes leisure units) the hospitality sector was one of the worst affected
increased by 1.7% in 2020, the biggest year-on-year by the pandemic, being one of the last sectors to
jump since records began in 2011, ending the year reopen on the 4th July. Despite the brief relief in the
at 14.9%. This was the highest vacancy has been form of the Eat Out to Help Out scheme, operators
since September 2012 as many high street retailers were also hit by restrictions including the curfew and
closed stores for good including Cath Kidston, the rule of six which impacted operating hours and
Oasis, Warehouse and T/M Lewin. Retail closures party sizes, making trading more challenging.
will continue to hit the headlines throughout 2021
with the sale of Debenhams and the Arcadia brands
without their estate of bricks-and-mortar stores
signposting further decline before things improve.
Local Data Company Ltd, 13-19 Vine Hill, London, EC1R 5DW. All Rights Reserved.
Page 14 +44 (0) 20 3111 4393 | team@localdatacompany.com | www.localdatacompany.comG B RETAIL AND LEIS U RE MA RK E T A NA LYS IS - F UL L Y EAR 2 0 2 0
Local Data Company Ltd, 13-19 Vine Hill, London, EC1R 5DW. All Rights Reserved.
+44 (0) 20 3111 4393 | team@localdatacompany.com | www.localdatacompany.com
Page 15G B R ETAIL AND LEISU RE MA RK E T A NA LYS IS - F U LL Y E AR 2 0 2 0
FA I L U R E S AND JOB LOSS ES
109,407 jobs were lost in 2020, 47% more than due to failure or a CVA compared to 5,793 in 2008,
the same figure at the height of the last recession in which is evidence of the scale of some of the stores
2008 (Source: Centre for Retail Research). Despite affected by the pandemic.
this, fewer stores were impacted with 5,214 closing
NUMBER OF STORES AND EMPLOYEES AFFECTED BY FAILING COMPANIES
Figure 4: Number of stores affected and companies failing in the retail sector, 2007 - 2020 (Source: Centre for Retail Research,
January 2021)
Additionally, the pool of potential buyers with the 53% of ‘at risk’ stores ended up closing, up from
appetite to take on a struggling retail business is low. 36.9% in 2019 (Source: Centre for Retail Research).
Data from the Centre for Retail Research shows that
109,407 JOBS WE R E
L OSTIN 202 0
Local Data Company Ltd, 13-19 Vine Hill, London, EC1R 5DW. All Rights Reserved.
Page 16 +44 (0) 20 3111 4393 | team@localdatacompany.com | www.localdatacompany.comG B RETAIL AND LEIS U RE MA RK E T A NA LYS IS - F UL L Y EAR 2 0 2 0
Donate
You can help us be there #forthefour by
donating what you can. Visit
retailtrust.org.uk/forthefour-donate
Corporate donors can contact
Claire Greenwood at
cgreenwood@retailtrust.org.uk
Championing the health of retail
Join us!
Join the conversation about health
While one in four adults in the UK will and wellbeing in the retail industry.
experience a mental health problem at
some point in their lifetime, we believe we 10-11 Our virtual event will take place
should be there #forthefour in four MAY during Mental Health Awareness
colleagues who will experience a setback or Week. Join us to create health,
life event. happiness and hope for everyone
involved with retail.
Join us! Be there #forthefour Register at
retailtrust.org.uk/forthefour retailtrust.org.uk/forthefour
retailTRUST is a registered charity in England and Wales (1090136) and in Scotland (SC039684). Company No 4254201 (Company
Local Data Company Ltd, 13-19 Vine Hill, London, EC1R 5DW. All Rights Reserved.
limited+44
by (0)
Guarantee) Registered England & Wales. Registered office: Marshall Estate, Hammers Lane, London, NW7 4DQ.
20 3111 4393 | team@localdatacompany.com | www.localdatacompany.com
Page 17G B RETAIL AND LEIS U RE MA RK E T A NA LYS IS - F UL L Y EAR 2 0 2 0
LOC ATIONS
Local Data Company Ltd, 13-19 Vine Hill, London, EC1R 5DW. All Rights Reserved.
Page 18 +44 (0) 20 3111 4393 | team@localdatacompany.com | www.localdatacompany.comG B RETAIL AND LEIS U RE MA RK E T A NA LYS IS - F UL L Y EAR 2 0 2 0
LOCATIO NS
This section of the report provides a more detailed Standalone units are those that sit outside of the
review of the impact of the pandemic across various three other location types such as supermarkets,
location types and asset classes; High Streets, hardware stores and furniture retailers, which are
Shopping Centres, Retail Parks and Standalone as often located outside the main town centre boundary
well as a review of how redevelopment activity was in residential areas.
impacted in 2020.
O P E NI N GS A ND CLOS UR ES BY L OCATION TYPE
Shopping Centres have been the most negatively 1.5% loss in 2019. Standalone locations were more
impacted of all location types in 2020, with a net resilient in 2020 as the benefits of being accessible
loss in occupied units of 5.4%. There was a marginal by car and their proximity to residential hubs met the
reversal in the negative trajectory for Standalone needs of the population under lockdown.
locations with a net loss of 1.3% compared to the
PERCENTAGE NET CHANGE IN OCCUPIED UNITS BY LOCATION TYPE, 2018 - 2020
Figure 5: Percentage net change in occupied units by location type, 2018 - 2020 (Source: Local Data Company)
SHO PP I N G CENT RES HAVE BE E N THE
M O ST NEGAT IV ELY IMPACTE D OF AL L
L O C AT I O N T Y P ES
Local Data Company Ltd, 13-19 Vine Hill, London, EC1R 5DW. All Rights Reserved.
+44 (0) 20 3111 4393 | team@localdatacompany.com | www.localdatacompany.com
Page 19G B RETAIL AND LEIS U RE MA RK E T A NA LYS IS - F UL L Y EAR 2 0 2 0
VAC A NC Y R AT ES BY LOCATION TYPE
The sharpest increase in vacancy was seen in distancing measures, due to the indoor nature of the
Shopping Centres, rising from 14.4% at the end assets. Shopping Centres were also the last to open
of 2019 to 17.1% at the end of 2020. This reflects following the first lockdown, especially in Scotland,
an incredibly tough year for Shopping Centres as where they were only able to reopen from the 13th
they faced the biggest challenges around crowd July.
management and implementing rigorous social
HISTORICAL VACANCY RATE BY LOCATION TYPE, 2013 - 2020
Figure 6: Historical vacancy rate across GB, by location type H1 2013 - H2 2020 (Source: Local Data Company)
Shopping Centres also have the lowest percentage Vacancy on Retail Parks increased by 1.9%, hitting
of retailers classified as ‘essential’ which resulted in double digits for the first time ever and High Streets
huge proportions of large schemes shutting down saw the smallest increase in vacancy of all three
for months at a time. On average only 15.4% of location types (+1.6%).
Shopping Centre units are classified as ‘essential’
compared to an average of 28.7% for Retail Parks.
Additionally, Shopping Centres are the most exposed
to Comparison Goods retail, which was struggling
ON AVE RAG E ON LY
15.4%
to compete with online, even before the pandemic
pushed even more consumers to shop in this way.
On average, 57% of units in Shopping Centres are
Comparison Goods stores, significantly more than
the average for the High Street (28%).
OF SHOPPIN G CE NTRE UN ITS A R E
CL ASSIF IE D AS ‘E SSE NTIA L ’
Local Data Company Ltd, 13-19 Vine Hill, London, EC1R 5DW. All Rights Reserved.
Page 20 +44 (0) 20 3111 4393 | team@localdatacompany.com | www.localdatacompany.comG B RETAIL AND LEIS U RE MA RK E T A NA LYS IS - F UL L Y EAR 2 0 2 0
R E G I O N AL VACANCY RAT E S
The Vacancy Rate in Wales increased the most of all region were some of the most resilient, due to the
GB nations and regions, rising from 16.4% to 19% in fact that many are less exposed to leisure, with
2020. Wales was one of the slowest locations to be 14.4% of units in this category compared to the GB
released from lockdown, which was felt especially average of 16.2%. Vacancy increased in Shopping
hard across Shopping Centres in the nation, wher Centres in the North West by just 1.1% compared to
the Vacancy Rate increased rapidly from 15.4% at a GB average of 2.7%.
the end of 2019 to 21.8% at the end of 2020.
The second highest Vacancy Rate increase was
The North West saw the least movement in this seen in the South West, rising from 11.8% to 13.9%
metric, with a small increase in Vacancy Rate of in 2020.
0.6% across the year. Shopping Centres in this
REGIONAL VACANCY RATE, 2019 VS 2020
Figure 7: Regional vacancy rates, 2019 vs 2020. (Source: Local Data Company)
Local Data Company Ltd, 13-19 Vine Hill, London, EC1R 5DW. All Rights Reserved.
+44 (0) 20 3111 4393 | team@localdatacompany.com | www.localdatacompany.com
Page 21G B RETAIL AND LEIS U RE MA RK E T A NA LYS IS - F UL L Y EAR 2 0 2 0
PE R S IST ENT VACANCY
In 2020, the pandemic impacted both short-term to double from 0.8% in 2019 to 1.9% at the end of
and long-term vacancy, as the lack of activity in the 2020. The recent demand for Retail Park space is
market suppressed demand for space, leading to likely to see some units find new occupiers in the
many vacant units remaining as such. form of acquisitive brands looking to expand their
out-of-town portfolio. However, the risk is that not all
of these units will find new tenants, particularly those
Across GB High Streets, the percentage of units that on Retail Parks that lack strong anchor tenants,
had been vacant for more than three years increased or lack a diverse retail and leisure mix enhanced
by 0.5%. Retail Parks saw the smallest increase by grocery which has performed well during the
in long-term vacancy at 0.4%, however the flurry pandemic. Therefore, some units are likely to remain
of failures across this sector in 2018 (Mothercare, vacant for many years to come unless redevelopment
Maplin and Toys ‘R’ Us) caused the percentage of or a change of use is considered.
units lying vacant for between two and three years
PERSISTENT VACANCY BY LOCATION TYPE, 2020
Figure 8: Persistent vacancy rate by location type and length of time vacant, 2020 (Source: Local Data Company)
SOM E UN ITS ARE L IKE LY TO RE M AIN
VACANT F OR M ANY YE ARS TO COM E
U N L E SS RE DE VE L OPM E NT OR A CHAN G E
OF USE IS CONSIDE RED .
Local Data Company Ltd, 13-19 Vine Hill, London, EC1R 5DW. All Rights Reserved.
Page 22 +44 (0) 20 3111 4393 | team@localdatacompany.com | www.localdatacompany.comG B RETAIL AND LEIS U RE MA RK E T A NA LYS IS - F UL L Y EAR 2 0 2 0
R E D E V E LOP MENT ACT IV IT Y
Redeveloping and repurposing retail property is had jumped by 385% since 2015. Inevitably, this
increasingly being discussed as a way to combat dipped by 16% in 2020 as the market was shut
the rising numbers of vacant units as consumer down and many investment projects were paused
demand changes. This strategy offers investors due to the uncertainty caused by the pandemic. In
and developers the opportunity to create innovative 2020, over 1 in 5 units that were redeveloped were
mixed-use schemes or change the use case for located in Greater London (23.9%) and the West
an asset, such as reworking it as a logistics or Midlands saw the biggest slowdown in this activity
warehousing hub. LDC data show that the pace of indicating that there will be regional differences in
redevelopment increased significantly in 2019 and demand for alternative uses.
NUMBER OF UNITS BEING REDEVELOPED, 2015 - 2020
Figure 9: Redevelopment activity by number of units across GB, 2015 - 2020 (Source: Local Data Company)
Local Data Company Ltd, 13-19 Vine Hill, London, EC1R 5DW. All Rights Reserved.
+44 (0) 20 3111 4393 | team@localdatacompany.com | www.localdatacompany.com
Page 23G B RETAIL AND LEIS U RE MA RK E T A NA LYS IS - F UL L Y EAR 2 0 2 0
C ASE ST UDY – WEST BY FLE E T
West Byfleet is in the top 20 towns across the demolished completely. This resulted in the Vacancy
country in regard to pace of redevelopment activity Rate improving drastically from 16% in 2019 to 5.3%
in 2020. Situated in Surrey, it is a key commuter town in 2020. Some of the brands that closed prior to the
with a journey time of 30 mins into London Waterloo, units being demolished were Costa, Londis, Boots
making it an attractive location for investment. and LloydsPharmacy.
More than a third of the total activity (openings and The proposed new mixed-use redevelopment
closures) in West Byfleet were units undergoing scheme will contain 255 residential units, 300 sqm
redevelopment or being taken out of the retail market. for a new community hub or library and up to 5,000
A total of 20 units were removed with 18 being sqm of retail and leisure space.
Figure 10: Station approach, West Byfleet prior to the demolishment (Source: Local Data Company)
As with most redevelopment plans, the West Byfleet as the surrounding oversupply of retail property is
scheme still features retail and leisure at its core. addressed. These new units are likely to attract a
This reflects the confidence from town planners strong tenant line up due to the immediate catchment
that physical retail and leisure still has a place providing a ready customer base for convenience,
in the community, and how attractive it still is to service and leisure operators to reinvigorate the local
developers in terms of income and stability - as long economy.
Figure 11: Artist’s impression of the future of West Byfleet (Source: Altitude Real Estate Limited)
Local Data Company Ltd, 13-19 Vine Hill, London, EC1R 5DW. All Rights Reserved.
Page 24 +44 (0) 20 3111 4393 | team@localdatacompany.com | www.localdatacompany.comG B RETAIL AND LEIS U RE MA RK E T A NA LYS IS - F UL L Y EAR 2 0 2 0
HY PE R - L OCA LIS AT I ON
With national lockdowns and ongoing restrictions service and convenience offer and higher balance
rendering consumers largely confined to their of independent retailers were more resilient in 2020,
immediate locality, the concept of hyper-localisation seeing an increase in vacancy of 0.4% compared
has been a key talking point across 2020. to the GB average of 1.6%. This is further evident
when assessing changes to Vacancy Rates across
City Centres, which have seen footfall plummet as
This trend can be evidenced through analysis of workers and student populations have been working
change in Vacancy Rates for different profiles of remotely. The Vacancy Rate across City Centres
town. Village locations, which are more residential increased by 2.5% to 16.1% in 2020, the highest of
with a smaller comparison retail offering, a larger all town profiles analysed.
VACANCY RATE BY TOWN PROFILE, 2019 VS 2020
Figure 12: Vacancy rate by town profile across GB, 2019 - 2020 (Source: Local Data Company)
The move to remote working was a catalyst for Commuter towns have been able to sustain higher
the significant loss of shops and hospitality outlets levels of weekday footfall and spend, with home
across City Centres, as the supporting retail workers visiting coffee and takeaway food stores
provision lost customers almost overnight. However, across the week. Pre-pandemic, these visits would
the surrounding commuter towns have benefitted have been within proximity to their office.
from this shift to home working, as this profile saw
vacancy increase by 1.2%, below the GB average
THE VACANCY RATE
of 1.6%.
ACROSS CITY CE NTRE S
2.5%
INCRE ASE D BY
Local Data Company Ltd, 13-19 Vine Hill, London, EC1R 5DW. All Rights Reserved.
+44 (0) 20 3111 4393 | team@localdatacompany.com | www.localdatacompany.com
Page 25G B RETAIL AND LEIS U RE MA RK E T A NA LYS IS - F UL L Y EAR 2 0 2 0
C ASE ST UDY – HECK MONDWIKE
The town of Heckmondwike in West Yorkshire has home for the majority of the pandemic. 46.5% of
remained resilient during the pandemic, reflected by the working population in the local authority area
a drop in vacancy in 2020. The town sits 9 miles south are in the three top occupation groups associated
west of Leeds, 2.8 miles from nearby Dewsbury. with white collar workers (Source: Office of National
The catchment for the town is mainly comprised Statistics).
of commuters, who would have been working from
R E TA I L M IX
81.7% of the units in Heckmondwike are independent ‘essential’, above the national average of 2 in 10,
which is significantly above the GB average of 65% which will have sustained a higher volume of footfall
and has increased by 5.4% since 2017. Additionally, during the lockdowns.
3 in 10 of the town’s retailers are classified as
BUSINESS TYPE MIX IN HECKMONDWIKE, 2017 VS 2020
Figure 13: Business type mix across Heckmondwike town centre, 2017 & 2020 (Source: Local Data Company)
N O N - ES SEN T I A L V S . E S S E NT I A L
R ETAIL M IX IN HE CK MOND WI K E
Key retailers in the town centre across the
town centre that are week and throughout
classified as ‘essential’ lockdowns.
are food and discount
chains Morrison’s, Lidl
and Poundstretcher,
with these brands able
to attract footfall to the
Figure 14: Percentage of non-essential vs essential retail in
Heckmondwike as of March 2020 (Source: Local Data Company)
Local Data Company Ltd, 13-19 Vine Hill, London, EC1R 5DW. All Rights Reserved.
Page 26 +44 (0) 20 3111 4393 | team@localdatacompany.com | www.localdatacompany.comG B RETAIL AND LEIS U RE MA RK E T A NA LYS IS - F UL L Y EAR 2 0 2 0
Key retailers in the town centre that are classified as fallen into administration is limited and the town was
‘essential’ are food and discount chains Morrison’s, able to attract new, independent occupiers across
Lidl and Poundstretcher, with these brands able to leisure, service and comparison retail categories.
attract footfall to the town centre across the week
and throughout lockdowns.
Additionally, the town had reopened 95% of the
‘non-essential’ retail outlets that were forced to close
Vacancy in Heckmondwike decreased by 3.3% in in the first lockdown in September, 9% above the
2020, despite the ongoing restrictions impacting GB average of 85%, demonstrating that the level of
the retail and leisure units in the town. Exposure to footfall was enough to sustain trade over the course
national chains that have undergone CVAs or have of the pandemic.
VACANCY RATES IN HECKMONDWIKE, 2015 - 2020
Figure 15: Historical Vacancy Rate in Heckmondwike, 2015 - 2020 (Source: Local Data Company)
In total five units did not reopen after the first
REOPENING RATE OF NON-ESSENTIAL
lockdown. This equates to 5% of the total units that
UNITS IN HECKMONDWIKE
were forced to close due to their ‘non-essential’
status. Of the five units, only one remains vacant,
with the other four finding new occupiers.
95%
H E C K MONDWI K E REOP ENED
O F N O N-ESS ENT IAL RETA IL
Figure 16: Reopening rate of non-essential retailers in Heckmondwike
as of October 2020 (Source: Local Data Company)
Local Data Company Ltd, 13-19 Vine Hill, London, EC1R 5DW. All Rights Reserved.
+44 (0) 20 3111 4393 | team@localdatacompany.com | www.localdatacompany.com
Page 27G B RETAIL AND LEIS U RE MA RK E T A NA LYS IS - F UL L Y EAR 2 0 2 0
SEC TORS
Local Data Company Ltd, 13-19 Vine Hill, London, EC1R 5DW. All Rights Reserved.
Page 28 +44 (0) 20 3111 4393 | team@localdatacompany.com | www.localdatacompany.comG B RETAIL AND LEIS U RE MA RK E T A NA LYS IS - F UL L Y EAR 2 0 2 0
SECTO RS
This section of the report reviews net change across the Local Data Company, quantifying the varying
the four top-level retail classifications (Leisure, performance across different corners of the market
Service, Comparison Goods and Convenience) in 2020 and historically.
and the 400 retail and leisure categories tracked by
NE T C HA NGE
Net change data across the four top-line categories moved online, with most retailers reliant on digital
tracked show a clear divergence between ‘essential’ channels for revenue during periods of lockdown.
(mainly Convenience and Service) and ‘non-essential’ With the majority of social events cancelled, there
retail (mainly Comparison Goods and Leisure). were fewer reasons for consumers to purchase new
outfits and other personal grooming items, which
also had a significant impact on fashion and beauty
The Comparison Goods market declined by a net businesses. The Shirtmakers category was one of
6,984 units in 2020, which is mainly a result of the most impacted by the pandemic, with limited
the fact that this sector was forced to close for a demand for workwear alongside the demise of T.M
large proportion of the year. The pandemic has Lewin resulting in this category shrinking by 62% in
also accelerated the pace at which this sector the year.
HISTORICAL NET CHANGE IN OCCUPIED UNITS BY RETAIL CLASSIFICATION,
2012-2020
Figure 17: Net change in units by retail classification across GB, 2012 - 2020 (Source: Local Data Company)
The impact on the leisure sector has been much category which continued to be negatively impacted
discussed and data reflects the stories that were by a change in legislation back in 2019. The Pizza
told by occupiers across the year. Pubs (-833), Italian Takeaway and Fast Food categories conversely both
Restaurants (-309), Take Away Food Shops (-245) appeared in the fastest growing categories list as the
and American Restaurants (-130) saw the highest demand for takeaways skyrocketed.
numbers of closures, following Bookmakers – a
Local Data Company Ltd, 13-19 Vine Hill, London, EC1R 5DW. All Rights Reserved.
+44 (0) 20 3111 4393 | team@localdatacompany.com | www.localdatacompany.com
Page 29G B RETAIL AND LEIS U RE MA RK E T A NA LYS IS - F UL L Y EAR 2 0 2 0
There was a marginal slowdown in the decline of
both the Service and Convenience categories (which
are mostly comprised of ‘essential’ occupiers) in
2020. The Convenience category decreased by 618
stores, the lowest decline since 2016, driven by the
higher demand for local grocery stores as travel was
limited. Not all Convenience categories benefitted
from the change in consumer behaviour, with the
loss in Newsagents continuing at the same pace
seen previously. Newsagents were disadvantaged
by their lack of fresh produce, small footprint which
made social distancing difficult and the decline in
the paper newspaper and magazine market which
is increasingly moving towards digital subscription
models. Others previously relied on the high volumes
of footfall passing through transport hubs, which
was very low for most of 2020.
There was a slowdown in the decline of the Service
category, with the net loss reducing to 1,077 in
2020, compared to 1,460 in 2019. Estate agents
accounted for 56% of the total net decline, losing
605 units in the year, however this figure was also
down on the previous year (-827). This slowdown
is in part due to the stamp tax holiday introduced
in July, designed to help stimulate recovery of the
economy. The scheme has been a success, with
residential property transactions up 26% in 2020
(Source: Zoopla) despite mass job losses and the
onset of the recession.
Local Data Company Ltd, 13-19 Vine Hill, London, EC1R 5DW. All Rights Reserved.
Page 30 +44 (0) 20 3111 4393 | team@localdatacompany.com | www.localdatacompany.comG B RETAIL AND LEIS U RE MA RK E T A NA LYS IS - F UL L Y EAR 2 0 2 0
Making town
centre property
marketing easier
At Completely Retail we understand there has
never been a more challenging time for retail,
with vacancy levels at an all time high, especially
on the High Street. Local Authorities and Business
Improvement Districts (BIDs) are doing all they can
to bring life back into town centres.
Each BID page contains:
y A comprehensive list of all available
properties to rent within the BID
district on CompletelyRetail.co.uk,
the UK’s leading retail property
portal.
y Unlimited detail, property contacts,
Using our retail expertise and relationships
photos, brochures, plans with
with Agents and Landlords we want to help BIDs
properties shown in context on a
market their empty shops to prospective retails
town centre map.
and get the High Street buzzing again.
y Help and advice from local property
We have thousands of national and local retail
experts for local businesses and
brands searching CompletelyRetail.co.uk every
entrepreneurs looking to acquire their
week looking for their perfect premises. To make
first shop in your town centre.
the process easier for them, we will create a
page allowing visitors to see each district as a y Links to other useful local resources,
destination with glorious detail on every available shopping centres, local authority etc.
unit. There is also information about the major
shopping centres, with links to, and useful advice
from, local retail property experts.
Further details
If you would like further information
email sales@completelygroup.com
CompletelyRetail.co.uk Read more about our BID campaign at:
www.completelyretail.co.uk/BIDS
Local Data Company Ltd, 13-19 Vine Hill, London, EC1R 5DW. All Rights Reserved.
+44 (0) 20 3111 4393 | team@localdatacompany.com | www.localdatacompany.com
Page 31G B RETAIL AND LEIS U RE MA RK E T A NA LYS IS - F UL L Y EAR 2 0 2 0
TO P 1 0 GR OWI NG CAT EGORIE S
Despite an intensely challenging year, some things of DIY haircuts. New Barber units were seen across
remain constant. Once again, Barbers topped the all location types, including Retail Parks which
fastest growing list for the 4th consecutive year, increased by 35%. Units increased across Shopping
with growth of 800 units, 18 more than 2019. The Centres (+9%), High Streets (+6%) and Standalone
reopening of barbers and hairdressers at the start (+5%) also.
of July was a huge relief to many, following months
TOP 10 GROWING CATEGORIES IN 2020
Figure 18: Top 10 growing retail categories across GB by net change in units, 2020 (Source: Local Data Company)
The real success story of 2020 was Convenience The Fast Food Takeaway category also saw a
Stores; after four years of decline, this category reversal in fortunes for the better, moving from
entered the top 10 fastest growing list for the first decline in 2019 (-117) to growth in 2020 (+267). 87%
time since 2015. The category grew by 149 units of this growth was driven by independent openings
across the year, feeling the benefit of the increase in across High Streets and Standalone locations, with
localised shopping, the ‘essential’ nature of their offer entrepreneurs taking advantage of the spike in
and the increased demand for grocery shopping due demand for food delivery.
to the shutdown of the hospitality sector. The ONS
reported a 4.4% annual growth in food sales in 2020
(Source: ONS Retail Sales, December 2020) which Gyms was a surprising category to enter the top
reflects this trend. 10 growth categories, given this sector was one
of the last to reopen following the first lockdown.
When they did reopen, many had to invest in refits
Supermarkets also feature in the top 10 fastest to ensure that they could meet the strict government
growing list, alongside a huge surge in demand for protocols. Again, the growth of gyms was largely
online delivery; the ONS reported that online food driven by independents, taking advantage of the
sales were up 79.3% in 2020. Despite this, the relaxed planning laws to open yoga studios, boxing
physical store network grew by 101, indicating that gyms and Pilates centres at a time when the public
bricks and mortar is still a key part of the growth had a renewed focus on health and wellbeing. Some
strategy for Supermarket brands. national chains saw growth in 2020, including Pure
Gym, The Gym, Anytime Fitness and Snap Fitness.
Local Data Company Ltd, 13-19 Vine Hill, London, EC1R 5DW. All Rights Reserved.
Page 32 +44 (0) 20 3111 4393 | team@localdatacompany.com | www.localdatacompany.comG B RETAIL AND LEIS U RE MA RK E T A NA LYS IS - F UL L Y EAR 2 0 2 0
TO P 1 0 GR OWI NG CAT EGORIE S – SURVIVAL RATE S
Survival rates is the measurement of the length of time Grocers had the lowest rate of survival at 62%. 100%
occupiers within retail categories remain operational of this category is independent, which tend to have
before shutting up shop for various reasons. This lower survival rates when compared to multiples.
metric can help to determine how resilient categories Grocers include mini marts and ethnic food stores
are and the likelihood of long-term survival. For this located in high density residential locations.
analysis, we review the occupiers within the top 10
growing categories that opened in 2017 and are still
operational 3 years on to determine how resilient the Interestingly, the only subcategory that saw
new units which opened in 2020 are likely to be. Of independents outperform multiples was Beauty
the 10 fastest growing categories, 7 saw more than Salons, where independents had a survival rate of
75% of new stores survive for at least three year 71% compared to multiples at 68%. This is mainly
after opening. due to the fact that limited businesses in this
category have been able to reach scale, with the
largest beauty salon operator only having 50 units
Supermarkets had the highest survival rate with nationwide.
90% still operational three years from opening, rising
to 96% when considering multiples alone. 72% of
independent supermarkets were still operational
three years from opening.
PERCENTAGE OF UNITS IN TOP 10 FASTEST GROWING CATEGORIES STILL
OPERATIONAL AFTER THREE YEAR S, 2017-2020
Figure 19: 3 year survival rate of the top 10 fastest growing categories, 2017- 2020 (Source: Local Data Company)
Local Data Company Ltd, 13-19 Vine Hill, London, EC1R 5DW. All Rights Reserved.
+44 (0) 20 3111 4393 | team@localdatacompany.com | www.localdatacompany.com
Page 33G B RETAIL AND LEIS U RE MA RK E T A NA LYS IS - F UL L Y EAR 2 0 2 0
TO P 1 0 D ECLI NING CAT EGO RIE S
Bookmakers continued to close in 2020, with a 2020 brought about further challenges for the Pubs
loss of 944, the highest rate of decline seen for any sector with lengthy periods of closure, limitations on
category in one year. The shakeout in this market group sizes and curfews restricting trading. Pubs
is mainly due to the changes to regulations of fixed declined by 833 in 2020, however many are still
odd betting terminals which came into effect in April temporarily closed following the first lockdown in
2019. The sector has seen 1,677 units close since March 2020, so this figure is somewhat diluted, and
this date. William Hill accounted for almost half of we expect to see further decline in this space.
these closures (832).
TOP 10 DECLINING CATEGORIES IN 2020
Figure 20: Top 10 declining retail categories across GB by net change in units, 2020 (Source: Local Data Company)
Another regular feature in the top 10 declining list The loss of Mobile Phone stores was mainly driven
is Fashion Stores, with many businesses falling by Carphone Warehouse, which closed 531 stores
into administration, launching CVAs or estate in March, however this was not a response to the
rationalisation programmes in 2020 including pandemic, but a strategic decision with Dixon
Cath Kidston, Warehouse, Oasis, Roman, M&Co, Carphone to combine its Carphone Warehouse
Peacocks and New Look. concept with its large format concepts, Curry’s and
PC World.
Retail sales across the fashion sector declined by
RE TAIL SAL ES
25.1% in 2020 according to the ONS (Source: Office ACROSS THE FASHIO N
25.1%
of National Statistics, 2021) – the highest annual SE CTOR DE CL IN E D BY
decline across all retail categories. The number of
Women’s Clothes Stores also fell (-390) resulting
in the overall decline across the Fashion & General
Clothing category equating to 1,846 for the year.
Local Data Company Ltd, 13-19 Vine Hill, London, EC1R 5DW. All Rights Reserved.
Page 34 +44 (0) 20 3111 4393 | team@localdatacompany.com | www.localdatacompany.comG B RETAIL AND LEIS U RE MA RK E T A NA LYS IS - F UL L Y EAR 2 0 2 0
MU LT I PL E S VS I ND EP END ENTS
Accelerating the trend seen since 2014, the It should be noted that 2020 data does not include
multiples market declined considerably faster than the failures of Arcadia or Debenhams which occurred
independents in 2020 – declining by a net 9,877 in early 2021. We expect the 2021 to push the figures
units compared to 1,442 for independents. The to a record once more, with market turbulence set to
contrast is even greater reviewing the figures in get worse before it gets better. There was a 7% drop
percentage terms, as independents make up 65% in overall activity (openings plus closures) across
of the total retail and leisure market. The multiples multiples in 2020, a figure driven mostly by a 21%
market shrank by 4.5%, compared to independents drop in openings.
at just 0.4%. Despite the record decline, the year-
on-year acceleration was not at fast as the increase
seen in 2017/2018 with the huge volume of CVAs
that took place in 2018.
NET CHANGE IN OCCUPIED UNITS BY BUSINESS TYPE, 2013 - 2020
Figure 21: Net change in occupied units by business type across GB, 2013 - 2020 (Source: Local Data Company)
Closures of independent units also slowed by 11% in • The extension of the lease forfeiture moratorium
2020, as businesses relied on government support allowed occupiers to continue to trade 2020
measures, both of which are likely to end in 2021: safe in the knowledge that they could not be
evicted from the premises.
• The business rates holiday that was offered
to all occupiers to the end of March 2021 It remains to be seen what success these initiatives
had the desired effect in 2020 and allowed have had in terms of securing a longer term future
more independent occupiers to weather the for these businesses. It could well be likely that a
challenges thrown at them during the course of second wave of closures occurs, especially across
the pandemic. independent businesses as the true impacts of the
pandemic are felt.
Local Data Company Ltd, 13-19 Vine Hill, London, EC1R 5DW. All Rights Reserved.
+44 (0) 20 3111 4393 | team@localdatacompany.com | www.localdatacompany.com
Page 35G B RETAIL AND LEIS U RE MA RK E T A NA LYS IS - F UL L Y EAR 2 0 2 0
Behaviours moving online
≠ buying online
Nick Brackenbury, Co-Founder & CEO at NearSt
One of the most discussed retail trends of 2020 was the tidal wave of shopper behaviours
moving online, as millions of people were pushed to experiment with getting the products
they want in new ways. As an industry though we have conflated behaviours moving online
with buying online, and in doing so overlooked another even more important change in
how people shop that will have a massive positive impact on the high street.
Shoppers are going online to find products locally
We all know that people are buying more online - ecommerce sales grew by 40% in 2020
- but there has been an even more dramatic increase in people going online to find
products locally.
At NearSt we power live in-store inventory in places like Google for thousands of retailers,
and each month see millions of searches for products in local stores. That’s a person tapping
into Google things like “who has gluten free flour in stock” or “where can I get men’s brown
brogues size 8” and seeing a product in search results that’s stocked nearby.
During the first lockdown these searches for in-store product availability jumped by 7x
compared to their February 2020 levels and jumped again to 8x that level during the
November and December restrictions.
NearSt Local Product Search Index. 1 = Feb 2020 average.
Local Data Company Ltd, 13-19 Vine Hill, London, EC1R 5DW. All Rights Reserved.
Page 36 +44 (0) 20 3111 4393 | team@localdatacompany.com | www.localdatacompany.comG B RETAIL AND LEIS U RE MA RK E T A NA LYS IS - F UL L Y EAR 2 0 2 0
Are these temporary or permanent changes?
While one might initially think that these changes are only driven by lockdown restrictions,
our data suggest there is significant long term adoption happening.
During the summer, when there were very few restrictions in place, local product search
levelled off at 3x its pre-pandemic levels. In the first lockdown many people suddenly
discovered they could easily check local in-store product availability in Google, and
continued doing it as a matter of convenience post-lockdown. Today we are sitting at 4.5x
pre-pandemic levels of local product searches.
What this means for high street shops
Retailers have an incredible opportunity to capture shoppers who are searching and
browsing online, and direct them with intuitive convenience to their local store. Shoppers
have a ton of goodwill towards their local high streets, and today there is an opportunity to
make acting on that goodwill genuinely more convenient than shopping online, using the
web to drive really meaningful footfall.
Today Google is the most advanced of the platforms enabling shops to offer this local in-store
availability to shops, but other tech titans like Facebook and Uber are rapidly developing
offerings of their own.
While the rise of ecommerce may have dominated the headlines in 2020, I firmly believe
that 2021 will be the year we’re all talking about the rise of local product discovery online,
where the web is a driver rather than detractor of growth on the high street. And that is truly
something to be optimistic about.
NearSt is a retail technology company that drives footfall for
high street retailers. Their technology makes in-store inventory
visible online in places like Google and Facebook, and is a
Global Google technology partner.
To find out more visit near.st.
Local Data Company Ltd, 13-19 Vine Hill, London, EC1R 5DW. All Rights Reserved.
+44 (0) 20 3111 4393 | team@localdatacompany.com | www.localdatacompany.com
Page 37G B RETAIL AND LEIS U RE MA RK E T A NA LYS IS - F UL L Y EAR 2 0 2 0
BRA N DS
Local Data Company Ltd, 13-19 Vine Hill, London, EC1R 5DW. All Rights Reserved.
Page 38 +44 (0) 20 3111 4393 | team@localdatacompany.com | www.localdatacompany.comG B RETAIL AND LEIS U RE MA RK E T A NA LYS IS - F UL L Y EAR 2 0 2 0
BR A N DS
C VA / A D M INIST R AT ION ACTIVITY
A fresh wave of occupiers launched a CVA or fell into In order to understand the likely long-term impact of
administration in 2020 as the pandemic proved to CVA/administration activity, analysis was completed
be the final straw for many already facing challenges. on the current status of units impacted by these
This has and will continue to result in many store processes in 2018. Figure 22 lists the percentage
closures as occupiers look to exit any locations of units which had been reoccupied as of January
which are not viable in the current trading climate. 2021. In total, of the 776 units that closed, 434 have
been reoccupied, 272 remain vacant and 69 have
been redeveloped (merged, split or demolished).
PERCENTAGE OF STORES THAT CLOSED IN 2018 DUE TO CVA/ADMINSTRATION
THAT ARE CURRENTLY OCCUPIED
Figure 22: Percentage of former stores reoccupied since CVA closures, as of January 2021 (Source: Local Data Company)
Local Data Company Ltd, 13-19 Vine Hill, London, EC1R 5DW. All Rights Reserved.
+44 (0) 20 3111 4393 | team@localdatacompany.com | www.localdatacompany.com
Page 39You can also read