Urbanization Effects on Biodiversity Revealed by a Two-Scale Analysis of Species Functional Uniqueness vs. Redundancy
←
→
Page content transcription
If your browser does not render page correctly, please read the page content below
ORIGINAL RESEARCH
                                                                                                                                                published: 24 March 2020
                                                                                                                                           doi: 10.3389/fevo.2020.00073

                                             Urbanization Effects on Biodiversity
                                             Revealed by a Two-Scale Analysis of
                                             Species Functional Uniqueness vs.
                                             Redundancy
                                             Anna Kondratyeva 1,2*, Sonja Knapp 3,4 , Walter Durka 3,5 , Ingolf Kühn 3,5,6 , Jeanne Vallet 7 ,
                                             Nathalie Machon 1 , Gabrielle Martin 8 , Eric Motard 9 , Philippe Grandcolas 2 and
                                             Sandrine Pavoine 1*
                                             1
                                              Centre d’Ecologie et des Sciences de la Conservation (CESCO), Muséum National d’Histoire Naturelle, Département
                                             Homme et Environnement, Centre National de la Recherche Scientifique, Sorbonne Université, Paris, France, 2 Institut
                                             Systématique Evolution Biodiversité (ISYEB), Muséum National d’Histoire Naturelle, Département Origines et Evolutions,
                                             CNRS, Sorbonne Université, EPHE, Paris, France, 3 Department Community Ecology, Helmholtz Centre for Environmental
                                             Research—UFZ, Halle (Saale), Germany, 4 Department of Ecology, Technische Universität Berlin, Berlin, Germany, 5 German
                                             Centre for Integrative Biodiversity Research (iDiv), Halle-Jena-Leipzig, Leipzig, Germany, 6 Martin Luther University
                                             Halle-Wittenberg, Geobotany and Botanical Garden, Halle (Saale), Germany, 7 Conservatoire Botanique National du Bassin
                                             Parisien (CBNBP), Muséum National d’Histoire Naturelle, Sorbonne Université, Paris, France, 8 Institut Méditerranéen de
                                             Biodiversité et d’Ecologie marine et continentale (IMBE), Univ Avignon, Aix Marseille Univ, CNRS, IRD, UT Site Agroparc,
                            Edited by:       Avignon, France, 9 Institut d’Ecologie et des Sciences de l’Environnement de Paris (IEES), Sorbonne Université, Paris, France
                   Heikki Martti Setälä,
         University of Helsinki, Finland
                        Reviewed by:         Urbanization is one of the most intensive and rapid human-driven factors that threat
                           John Kress,       biodiversity. Finding an indicator of species community responses to urbanization is
    Smithsonian National Museum of
    Natural History (SI), United States
                                             crucial for predicting the consequences of anthropogenic land cover changes. Here,
                     Andreas Prinzing,       we develop a framework that relies on functional originality. A species is original or
      University of Rennes 1, France         equivalently distinct, regarding its traits, if it possesses rare trait values in a community
                *Correspondence:             of species. The most original species have the greatest contributions to the trait diversity
                  Anna Kondratyeva
      anna.kondratyeva@edu.mnhn.fr           of that community. We studied plant species originality, in light of observed changes
                   Sandrine Pavoine          in the level of species richness, along an urbanization gradient in the region of Paris,
          sandrine.pavoine@mnhn.fr
                                             France. To evaluate potential impacts of urbanization on species assemblages, we
                   Specialty section:        simultaneously considered the local community and regional pool as reference scales
         This article was submitted to       where to calculate the originality of each species. Then, for each community, we
                        Urban Ecology,
                                             calculated the mean and skewness of local and regional originalities and the ratio of
                a section of the journal
    Frontiers in Ecology and Evolution       local to regional originality, providing indication on how functionally diverse a community
      Received: 23 September 2019            is, how original it is compared to other communities of the region, how evenly distributed
         Accepted: 04 March 2020             species were in the local and regional functional space, and whether regionally-redundant
         Published: 24 March 2020
                                             species become original locally due to limiting similarity. The mean functional originality
                            Citation:
  Kondratyeva A, Knapp S, Durka W,
                                             increased with urbanization at both local and regional scales, although this increase
Kühn I, Vallet J, Machon N, Martin G,        vanished in communities with high species richness. The skewness of originalities
         Motard E, Grandcolas P and
                                             increased from zero to positive values with species richness in built-up areas and the
Pavoine S (2020) Urbanization Effects
        on Biodiversity Revealed by a        ratio of local-to-regional originality increasing along the urbanization gradient, except
       Two-Scale Analysis of Species         in species-rich communities. Here our results suggest that urban plant communities
            Functional Uniqueness vs.
 Redundancy. Front. Ecol. Evol. 8:73.
                                             are composed of both locally and regionally unique urbanophile species, suggesting
      doi: 10.3389/fevo.2020.00073           processes that limit niche overlap to allow species coexistence. In richer communities,

Frontiers in Ecology and Evolution | www.frontiersin.org                            1                                                  March 2020 | Volume 8 | Article 73
Kondratyeva et al.                                                                                                               Plant Uniqueness in the City

                                             these unique species coexist with regionally-redundant species the occurrence of which
                                             could be stochastic. Our conceptual framework shows that species originality can inform
                                             on environmental processes that influence biodiversity during community assembly. It
                                             is flexible enough to be extended to other regions and other contexts complementing
                                             diversity metrics in the research of the mechanisms by which human activities impact
                                             species assemblages.

                                             Keywords: biodiversity measure, community assembly, disturbance, environmental filtering, functional trait,
                                             originality measure, spatial scale

INTRODUCTION                                                                      environmental stressors, human preferences and historical
                                                                                  and socioeconomic factors (Williams et al., 2009; Aronson
The United Nations (2018) predicted that by the year 2050,                        et al., 2016). Species assemblages are driven by multiple
68% of the global human population would live in urban                            interacting processes (e.g., stochasticity, facilitation, competition,
areas, constantly growing in surface. As a key aspect of the                      adaptation). Among them, many ecological studies in the last
anthropization of natural areas, urbanization comes with a                        two decades have opposed environmental filtering (abiotic
complex mix of changes, including land-use modifications and                      factors), which restricts trait-based dissimilarity between
environmental disturbances, which increase the pressure on                        species (Zobel, 1997), to the local distribution of resources and
local remnant species diversity (Gaston, 2010) and induce the                     inter-specific interactions (biotic factors) that may also restrict
assembly of novel ecological communities (Swan et al., 2011).                     trait-based dissimilarity between species if species with similar
Studies of urban biodiversity mainly focused on describing                        traits that provide high fitness exclude others, or inversely, limit
species composition and species richness (e.g., Balmford et al.,                  coexistence of species sharing similar traits to avoid competition
2001; Araújo, 2003), species distribution and abundance (e.g.,                    (e.g., McArthur and Levins, 1967; Stubbs and Wilson, 2004).
Aronson et al., 2016; Deguines et al., 2016; Guetté et al.,                       These processes altogether shape levels of species and trait-based
2017), but also species trait distribution and/or phylogenetic                    diversity of communities (e.g., Williams et al., 2009; Swan
positions (e.g., Knapp et al., 2008a; Williams et al., 2015;                      et al., 2011; Aronson et al., 2016). The mechanisms by which
Kalusová et al., 2017). To date, it has been largely acknowledged                 communities are assembled in disturbed environments may
that cities, representing a high spatial heterogeneity of green                   however be fundamentally different from those acting in the
spaces, can harbor an important amount of plant and animal                        least disturbed environments (Mason et al., 2011; de Bello et al.,
species (Kühn et al., 2004; Godefroid and Koedam, 2007;                           2013). Changes in community assembly mechanisms leave a
Pautasso et al., 2011) and that cities play an important role                     signature in community diversity patterns. The trait composition
in biodiversity conservation (Kowarik, 2011; Ives et al., 2016;                   of local communities would thus be a product of abiotic and
Soanes and Lentini, 2019). However, a likely negative effect                      biotic filtering of traits from the regional pool (Zobel, 2016;
of urbanization was observed at large, global scales, expressed                   Spasojevic et al., 2018). At the local scale, the selection of specific
by functional homogenization (McKinney, 2006), decreasing                         traits in urban habitats could lead to reduced functional diversity
phylogenetic diversity (e.g., Ricotta et al., 2009; Ibáñez-Álamo                  (Lososová et al., 2016; La Sorte et al., 2018; Fournier et al., 2019).
et al., 2017), narrowing the spectrum of present functional                       For example, plant species favored in urban areas are often
traits (e.g., Williams et al., 2015) but with still often a positive              drought/heat-tolerant, photophile species with increased height
effect on an increasing plant and animal species richness                         and competitive ability compared to species from other areas
(Kühn et al., 2004; Godefroid and Koedam, 2007; Pautasso                          (see e.g., Williams et al., 2015). The share of the same non-native
et al., 2011). The analysis of the diversity of functional traits                 human-introduced species within urban habitats could also
(i.e., functional diversity) in cities is particularly important as               decrease the functional diversity of urban communities at
functional traits are those traits that influence the way species                 the landscape scale (e.g., Sodhi et al., 2019). However, some
respond to environmental conditions or the way they contribute                    studies observed trait divergence in urban areas compared to
to ecosystem properties (Lavorel and Garnier, 2002). At smaller                   surrounding areas, which they explained by habitat heterogeneity
spatial scales, contradictory effects of urbanization on species and              at the large landscape scale and by niche differentiation through
functional diversity have sometimes been observed depending on                    interspecific competition at the local community scale (e.g.,
the location and on the taxa under study (e.g., Kühn and Klotz,                   Concepción et al., 2015).
2006; McKinney, 2006; Vimal and Devictor, 2014; Ibáñez-Álamo                          The hierarchical filtering of species from a regional pool to
et al., 2017). A comprehensive analysis of species responses                      local communities is still poorly understood in urban areas,
to urbanization and their contribution to community diversity                     mostly because of a multitude of factors acting at the same time
across spatial scales is still lacking.                                           (Williams et al., 2015). Thus, a comprehensive analysis of species
    Characterized by strong environmental changes, urbanized                      responses to urbanization and their contribution to community
areas incorporate a set of human-induced processes, such                          functional diversity across spatial scales is lacking. To evaluate
as habitat transformation and fragmentation, increasing                           species-specific responses to urbanization, there is a need for a

Frontiers in Ecology and Evolution | www.frontiersin.org                      2                                            March 2020 | Volume 8 | Article 73
Kondratyeva et al.                                                                                                       Plant Uniqueness in the City

metric estimating the contribution of each species to biodiversity,         between local urban built-up areas and other land cover types
accounting for ecological differences between coexisting species            (forest, semi-natural area, agricultural area, green urban spaces).
at multiple spatial scales. Such a species-specific value can be            We develop our expectations of how the functional originality
obtained by originality metrics. In contrast to the widely-used             of species may vary along an urbanization gradient in Table 1.
diversity metrics measured at the level of a species set, originality       These expectations are structured into four main scenarios,
metrics give a value to each species in a set. Pavoine et al.               explained by patterns of mean local originalities and mean
(2005) defined species originality as a general term unifying a             regional originalities in communities. Species richness, skewness
multitude of concepts related to the contribution of a species              of originalities and the ratio of local to regional originalities
to biodiversity: distinctiveness, distinctness, isolation or else           then help to refine these scenarios, and identify key potential
uniqueness (see e.g., Redding et al., 2014; Pavoine et al., 2017;           processes that could drive species assemblages. To address urban
Kondratyeva et al., 2019). The idea that certain species contribute         community assembly, we thus analyzed mean and skewness of
disproportionately to functional diversity of a community is                local and regional species originality in plots distributed among
based on the assumption that they possess a set of unusual                  land cover types along an urbanization gradient. This enabled us
biological characters unshared by the rest of species community             to investigate three main questions:
(Redding et al., 2015). Indeed, a species is original if it has
                                                                            1. How does urbanization and species richness influence species’
rare biological characteristics within a reference set of species
                                                                               regional and local originality and to what extent do these
(Pavoine et al., 2017). Such rare characteristics can be trait
                                                                               factors interact?
values that only few species share (Mouillot et al., 2013a; Brandl
                                                                            2. Which biological traits characterize the most original species
et al., 2016; Pavoine et al., 2017). Therefore, originality is a
                                                                               at regional scale and at local scale across different land
relative measure and can be described as a gradient (Violle et al.,
                                                                               cover types?
2017; Kondratyeva et al., 2019), with two extreme, yet unlikely
                                                                            3. How can regional and local species originality inform on
cases: unique species on one side, not sharing any biological
                                                                               community assembly processes in an urbanization context?
characteristic with others (100% of unique contribution to the
diversity of a set) and redundant species on another side, sharing
all of its characters with other species (0% of unique contribution         MATERIALS AND METHODS
to the diversity of a set).
    When studying community assembly, species have to be                    Study Area
considered at least at two key spatial scales: the local community          We analyzed plant community data sampled across the Île-
and the regional species pool. Indeed, the regional species pool            de-France region by the participants of the national citizen
constitutes the set of species that could potentially colonize              science survey, Vigie-flore (http://www.vigienature.fr/fr/vigie-
and establish within a community (Zobel, 1997; Lessard et al.,              flore), which constitutes a large national dataset of plant
2012). Measured at different spatial scales, species originality,           occurrences in diverse habitats. The Île-de-France region
i.e., species relative contribution to biodiversity, could reveal           occupies a territory of 12,100 km² and is the most inhabited
signatures of scale-dependent ecological processes of community             region of France, with 12.1 million inhabitants. It includes the
assembly. Indeed, a measure of species originality allows the               city of Paris, which is the French capital and largest city with 2.2
comparison of a species’ trait values to the values of all other            million inhabitants in 2016, and ∼1,300 other cities and towns
species in a regional pool or all other species in a local                  with varying human populations (min = 27, max = 119,645,
community, adapting the measurement of species originality                  median = 1318, Institut Paris Region, 2018). This region benefits
to the spatial scale of interest. For example, species that are             from having the highest sampling effort within the Vigie-flore
functionally redundant at the regional scale may co-occur                   program as well as a detailed land cover geodatabase.
locally because they are adapted to the same environmental
conditions, which would lead to local and regional redundancy               Land Cover Data
for these species. However, they could inversely never co-occur             We used vectorized 1/5000 GIS maps of land cover in Île-
locally, being distributed in different areas/communities to avoid          de-France from Institut Paris Region (2018), available for
competition, which would lead to regional redundancy but                    two time periods (2009 to 2011 and 2012 to 2017). We
local originality for these species. Thus, functional originality           used land cover categories recovering the totality of the
(trait-based dissimilarity) of species in local communities is              region (Figure 1): (1) forests (24% of Île-de-France area),
influenced by abiotic filtering and determines species local biotic         (2) semi-natural area (2%, including open green spaces
interactions and coexistence (Cornwell and Ackerley, 2009; de               and riverbanks), (3) agricultural areas (50%), (4) green
Bello et al., 2012).                                                        urban areas (6%, including urban parks, gardens, lawns, and
    To date, few studies have compared processes of urban                   cemeteries), (5) urban built-up areas (16%, including individual
community assembly based on functional trait values at local                housing, collective housing, industrial and business areas,
and regional levels (see e.g., Fournier et al., 2019). Therefore,           facilities, quarries, dumps and worksites, and transportation
our aim here was to explore the impact of urban environmental               infrastructures), and (6) water (2%, excluded from the following
conditions on plant species functional originality at two spatial           analysis). A detailed description of each category is available
scales: the local plant communities and the regional species                online (https://www.institutparisregion.fr). Using the ArcGIS R
pool. We also analyzed how species’ originality values varied               software for geographical data manipulation (Environmental

Frontiers in Ecology and Evolution | www.frontiersin.org                3                                          March 2020 | Volume 8 | Article 73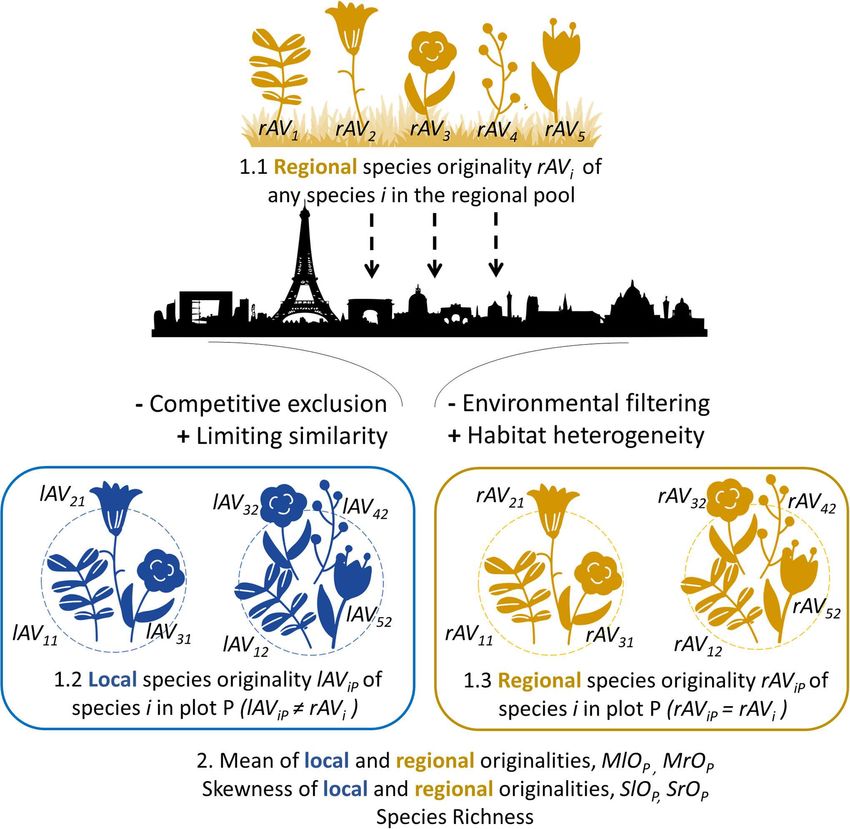
Kondratyeva et al. Plant Uniqueness in the City
TABLE 1 | Scenarios which could explain each combination of patterns between (mean) local and regional functional originality of the same species along the
urbanization gradient.
With urbanization, regional functional originality
increases decreases
†
With urbanization, local increases Scenario 1.1.1. Coexistence of several combinations of Scenario 1.2. Unexpected scenario : if species
functional originality regionally-original traits of urbanophile* species, e.g., allowing species occurring in local urban areas are drawn among the
coexistence in resource-limited locations by decreasing competition species which have the most redundant traits in the
among species, reflecting limiting similarity [in urban plots, zero region, then we expect these species to have similar
skewness of local originalities§ , local to regional originalities ≥1 and trait values at local scale as well. Their regional
moderate to low species richness expected]; redundancy is thus expected to lead to their local
Scenario 1.1.2. Coexistence of (regionally and locally) original redundancy.
urbanophile* species (adapted to urban conditions) with redundant
species (e.g., under stochasticity of colonization and survival of plant
individuals if species have similar fitness levels and resources
allowing their coexistence) [in urban plots, positive skewness of species
originalities, local to regional originalities ≈1# and high species richness
expected];
Scenario 1.1.3. Coexistence, in urban plots, of (regionally and locally)
original urbanophile* species with regionally-redundant, but
locally-original species (e.g., if species with high fitness exclude less
competitive species with redundant traits due to resource limitations,
leading to high functional diversity) [in urban plots, zero skewness of
local originalities, positive skewness of regional originalities# , local to
regional originalities >1 and high species richness expected]
decreases Scenario 2.1. Local urban conditions allow the persistence of Scenario 2.2. Urban conditions filter out the most
urbanophile* species with a limited diversity in trait values due to their original species adapted to other types of land cover
high fitness leading to the competitive exclusion of less adapted (or (e.g., forest, agriculture) but maladapted to the
less competitive) species. Urban communities are thus expected to be urban constraints (environmental filtering). In this
mostly composed of urbanophile* species with similar traits, but these scenario, the most regionally original species would
trait values are different from those observed in other land cover types not be urbanophile but on the contrary specialists of
(e.g., forest, agriculture) making urban species redundant at the local other land cover types of the region. As a result, the
level but original at the regional level due to the presence of other land mean of regional and local originalities in urban plots
cover types (environmental heterogeneity). [In urban plots, zero would be both low. [In urban plots, zero skewness
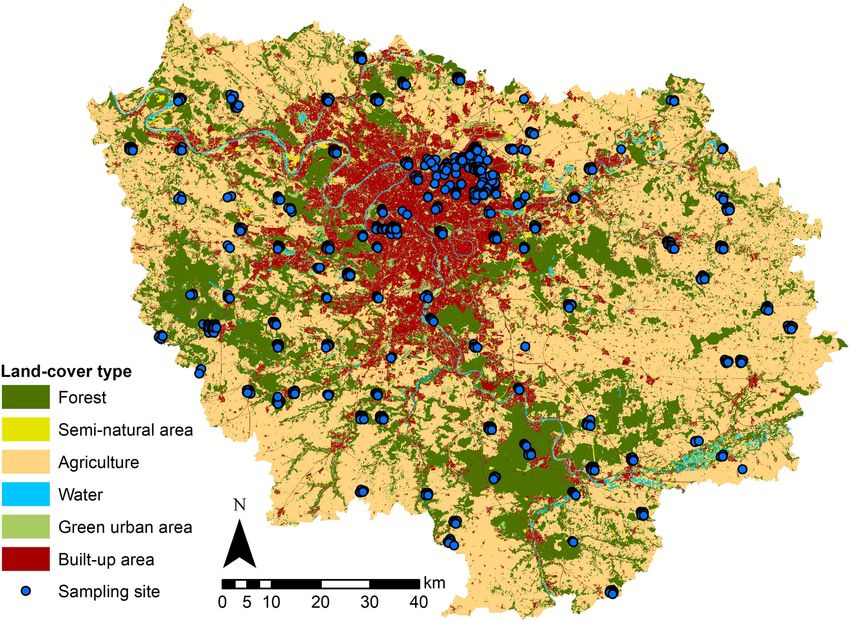
skewness of species originalities& , local to regional originalitiesKondratyeva et al. Plant Uniqueness in the City FIGURE 1 | Land cover and spatial distribution of the sampling plots (spatial resolution of 12.5 meters). The map shows the Île-de-France region, including its largest city Paris and ∼1,300 other cities and towns, which are represented by built-up areas [red, 16%, including individual housing (8%), collective housing (2%), industrial and business areas (2%), facilities (1%), quarries, dumps and worksites (0.5%) and transportation infrastructure (2.5%)]. The built-up areas and other land cover types that correspond to forests (dark green; 24% of total area), semi-natural areas (green yellow, 2%), agricultural areas (beige, 50%), green urban spaces (bright green, 6%) and rivers and water points (blue, 2%) were extracted from data from the Institut Paris Region (2018). The blue dots represent the 2,362 sampling plots of Vigie-flore from 2009 to 2017 (superimposed for the same plot surveyed in different years). We removed some species from the initial species dataset: (1) Species Biological Characteristics species occurring in plots with 1 or 2 species only that were To assemble as much trait data as possible, we standardized excluded for computational reasons (see explanation above); species taxonomic nomenclature among datasets by using (2) species, which are not included in the Île-de-France plant several synonymous names and updating them by using The species list established by the Conservatoire Botanique National Plant List (http://www.theplantlist.org/), the Tela Botanica du Bassin Parisien (CBNBP, 2016) which were probably plant website of the French botanist’s network (https://www.tela- identification mistakes; (3) species that rely on human assistance botanica.org/) and Flora Gallica (Tison and de Foucault, (strictly cultivated or planted species); (4) Pteridophytes, because 2014). We finally kept species names as found in Vigie-flore they need specific descriptors of their morphology (for example, data with a taxonomical reference TAXREF V5.0 (https:// they have spores and not fruits, fronds and not leaves etc.) inpn.mnhn.fr/programme/referentiel-taxonomique-taxref). We and were not always identified by many amateur botanists; collected information on the biological traits of each species from (5) woody species, because they take more time to respond several databases (Table S1): the BiolFlor database on biological to environmental changes in urban areas than herbaceous and ecological traits of the German flora (Klotz et al., 2002), species and because of their outlying trait values compared to LEDA database of life-history traits of the Northwest European many herbaceous species. Woody and herbaceous species were flora (Kleyer et al., 2008), TRY global database of plant traits distinguished following the LEDA trait database (Kleyer et al., (Kattge et al., 2011), Ecoflora database of British Isles (www. 2008). ecoflora.co.uk, Fitter and Peat, 1994), and Catminat database of Frontiers in Ecology and Evolution | www.frontiersin.org 5 March 2020 | Volume 8 | Article 73
Kondratyeva et al.                                                                                                       Plant Uniqueness in the City

French flora (Julve, 1998) along with numerous botanical garden             species, local originality varies depending on the composition of
resources across Europe (e.g., POWO, 2019). The data included               plots, whereas regional originality will be constant over all plots
three binary (life span, pollen vector, seed dispersal mode),               (Figure 2). Let R designate the region (here defined as the union
one ordinal (type of reproduction), one circular (beginning of              of all sampled plots). NP is the number of species in plot P, NR
flowering), and six quantitative traits (seed weight, leaf dry              the regional number of species, and dij is the functional distance
matter content, leaf size, specific leaf area, plant height, and            between species i and j. The regional originality of species i is
duration of flowering). We selected traits related to dispersal,            calculated as follows:
establishment, reproduction and persistence, as each group of
traits can be differently selected by diverse urban filters. We                                            1    X
                                                                                               rAVi =                dij
selected traits that are widely used in functional ecology studies                                       NR − 1  j∈R
for their presumed roles in the context of urbanization (Knapp
et al., 2010; Williams et al., 2015; Kalusová et al., 2017) and that        If species i occurs in plot P, its local originality in plot P is
were available for the majority of our species. We investigated             calculated as follows:
the correlations among all retained biological traits to avoid
potential collinearity. Highly correlated traits were not retained if                                      1    X
                                                                                               lAViP =               dij
the absolute values of Pearson correlation coefficient were larger                                       NP − 1  j∈P
than 0.7 (Dormann et al., 2013). In complement to the biological
traits, we calculated species urbanity following Hill et al. (2002),        To determine which species are the most original, we ranked
which is an environmental association and not a trait per se (sensu         species by their regional and local functional originality values.
Garnier et al., 2017). We used species urbanity a posteriori to             We also searched for species that were original at the local
link species urban preferences with their functional originality            scale although they were not at the regional scale. To do so, we
values. We calculated species urbanity as the mean percentage               calculated, for each species i and each plot P where it occurred,
of urbanized area in all grid cells where the species occurred.             the ratio of this species’ local originality value to its regional
In addition, we used the native status of the species that was              originality value (lAViP / rAVi ) (Figure 2).
extracted from the Île-de-France plant species list established
by the Conservatoire Botanique National du Bassin Parisien                  Community-Level Metrics
(CBNBP, 2016) to compare the originality of native and non-                 In order to assess how urbanization filters species from the
native species. A species was defined as non-native if it was               regional pool (Table 1), we first calculated the mean of the
introduced by humans into the region after the year 1,500 AD.               regional species originalities, MrOP , taken from regionally
                                                                            calculated values (rAVi ) but only for species composing plot P
Data Analyses                                                               (Figure 2):
All statistical analyses were performed with R software version
3.6.0 (R Core Team, 2019), and for statistical significance, we                           1 X            1 X       1    X
                                                                               MrOP =            rAVi =                      dij
                                                                                         NP  i∈P        NP   i∈P NR − 1  j∈R
considered a nominal type-I error α = 0.05.

Species Originality                                                         Then, for plot P, we also calculated the mean of the local
In order to determine the originality of each species, we                   originalities (lAViP ) of its species, MlOP :
used the metric named AV for “average” which represents the
average dissimilarity between a focal species and all others                                 1 X             1   1    X
                                                                                  MlOP =            lAViP =                  dij
in a set (Pavoine et al., 2017). The “AV” metric requires a                                 NP  i∈P         NP NP − 1  i,j∈P
matrix of dissimilarity between species. Here we calculated
dissimilarities in species trait values, hereafter referred to as           MlOP turns out to be a measure of the local functional diversity
functional distances. For that, we first log-transformed the most           within plot P, equal to the index previously named “average of
asymmetrically distributed quantitative traits (canopy height, leaf         the pairwise distances” (Heemsbergen et al., 2004; Petchey and
size, and mean seed weight) to ensure a bell-shaped distribution            Gaston, 2006; APWD). The advantages of our formulations of
of values. We then used the mixed-variable coefficient of                   MlOP over APWD are first, the possibility to partition MlOP into
dissimilarity (Pavoine et al., 2009) associated with the most               species-specific originality values in order to assess the respective
appropriate coefficients to estimate functional distances between           contribution of each species to functional diversity and second,
pairs of species: the Jaccard metric (Jaccard, 1901) for binary             the possibility to extend this formulation to have a local mean
traits, the Podani metric (Podani, 1999) for ordinal traits and the         of species originalities measured across different spatial scales
Manhattan metric (Gower, 1971) for quantitative traits.                     (notably the local scale with MlOP and the regional scale with
   Using the functional distances between species, we calculated            MrOP ). Thus, species responses to environmental factors can be
the functional originality scores of each species with the                  studied across spatial scales, measured by their originality, as
distinctDis function of the R package adiv (Pavoine, 2018).                 shown in Table 1 and Figure 2.
Following Redding et al. (2015), for each species, we calculated               In addition, to test if the observed variations in local MrOP
a regional originality score considering all species in our dataset         and MlOP were due to filtering of many or few highly original
(rAVi ) and, for each plot P, a local originality score considering         species, we calculated the skewness (index b1 in Joanes and Gill,
only the species observed in the plot (lAViP ). Thus, for a given           1998, implemented in the R package e1071, Meyer et al., 2019)

Frontiers in Ecology and Evolution | www.frontiersin.org                6                                          March 2020 | Volume 8 | Article 73
Kondratyeva et al. Plant Uniqueness in the City
FIGURE 2 | Scheme of our methodological framework for the analysis of species originality at regional and local spatial scales. We illustrate this framework with a
theoretical set of five plant species. First, the functional originality of species is calculated at the regional scale considering all species from the regional pool (1.1, rAVi )
and these values are reported for each species in a local plot P (1.3, rAViP = rAVi ); originality values are also calculated at the local scale considering only species from
a local plot P (1.2, lAViP ). Finally, community metrics are measured for each plot P (2): the mean of regionally-measured originality values (MrOP = mean of rAViP values
over i) and their skewness (SrOP = skewness of rAViP values over i), the mean of locally-measured originality values (MlOP = mean of lAViP values over i) and their
skewness (SlOP = skewness of lAViP values over i), and the species richness (number of species). To illustrate potential effects of urbanization (represented by the city
silhouette) on plant species communities, we indicated four key possible processes acting on the assembly of urban communities with potential positive or negative
effect on community metrics (see Table 1 for a detailed description of possible scenarios of functional originality patterns in urban communities).
of the functional originalities in each plot P, noted as SrOP for Negative skewness of originality (=left-skewed originality)
regional originalities and SlOP for local originalities: represented scenarios with many species of high originality
(approaching uniqueness) and few species of low originality
(approaching redundancy). In contrast, positive skewness
(NP − 1)3/2 i∈P (rAVi − MrOP )
3
P
of originality (=right-skewed originality) represented
SrOP =
NP
P 2 3/2
many species of low originality and a few highly original
i∈P (rAVi − MrOP )
3 species (Figure S1). Close-to-zero skewness represented
(NP − 1)3/2 i∈P lAVi − MlOP
P
a balanced distribution between redundant and unique
SlOP = 2 i3/2
NP
hP species. Skewness measures of the shape of the originality
i∈P lAVi − MlOP distribution in a plot can complement mean measures to
Frontiers in Ecology and Evolution | www.frontiersin.org 7 March 2020 | Volume 8 | Article 73Kondratyeva et al. Plant Uniqueness in the City
identify potential processes of community assembly as shown to include a phylogenetic correlation structure in the residuals
in Table 1. of the model of species functional originality explained by
We then created a dataset without non-native species (85 species traits, assuming a Brownian motion model of trait
species) and recalculated all local and regional originality scores evolution across the phylogenetic tree (functions corBrownian
and all community-level metrics (species richness and mean and gls from packages ape, Paradis and Schliep, 2018, and nlme,
and skewness of the originalities) to assess the contributions of Pinheiro et al., 2019, respectively). We used DaPhnE (Durka
non-native species to originality. Finally, the species richness and Michalski, 2012), a dated phylogeny that is resolved to
was calculated per plot for both datasets (complete and the species level and covers the vascular flora of the British
without non-natives). Isles, Germany, the Netherlands and Switzerland and thus
all taxa from the LEDA and BiolFlor trait databases. We
Statistical Modeling pruned the final tree to only include our regional species pool
In order to estimate the effects of urbanization filters, species (Table S2). Species with missing trait values were removed
richness and survey year on local community assembly and from each model. Species traits were centered and scaled so
diversity, we modeled the variation in community-level metrics that the coefficients of the GLS models were comparable.
with the complete dataset and the only native species dataset In order to visualize the GLS model results, we applied a
with generalized mixed linear models (GLMM) in the R package principal component analysis (PCA) to the coefficients of GLS
glmmTMB (Brooks et al., 2017). The mean of regional MrOP and models. We also modeled species originality explained by
local MlOP originalities, the skewness of regional SrOP and local species urbanity, native status and species frequency (number
SlOP originalities and the ratio of local to regional originality of times that species occurred locally across the years) with
lAViP /rAVi were modeled with a Gaussian distribution, while GLS models.
the species richness was modeled with a negative binomial
distribution and a quadratic link between the mean and RESULTS
the variance. We included as fixed explanatory variables: the
percentage of built-up areas in 1 km² cell where a given plot Community-Level Metrics
was located (urbanization), the species richness (except for the The results of GLMM applied to the complete dataset are
model where species richness was a response variable) and the presented in Tables 2, 3. We observed a significant positive effect
survey year, which was transformed by subtracting its minimum of urbanization percentage on mean regional and local originality
value to allow the comparison between units of variables. We values (MlO and MrO). Species richness had a significant positive
also included an interaction effect between urbanization and effect only on MlO: the higher species richness was, the more
species richness as both could simultaneously influence species the species differed in their traits within plots and thus the more
originality. The IDs of the grid cells and the IDs of the plots they were functionally original at the local scale. There was,
were modeled as random nested variables to account for the however, a significant interaction effect between urbanization
pseudoreplication of the plots sampled in the same locations but and species richness, such that the positive effect of urbanization
in different years. To test how species originality varies between on MlO and MrO tended to decrease with increasing species
land cover types we fitted the same GLMM by replacing the richness and vice versa to the point of becoming negative for
percentage of built-up areas by a categorical variable indicating the highest levels of species richness (Figure 3). Local functional
the land cover type where each plot was located. diversity MlO significantly decreased with the year of survey; so
Backward selection of variables was based on Akaike the proportion of redundant species increased locally (Table 2).
information criterion (AIC) values, where the lowest AIC value Using land cover types, we similarly observed that both MlO
denoted the model we selected. We calculated the marginal and and MrO were greater in built-up areas than in any other land
conditional R² values as proposed in Nakagawa and Schielzeth cover types. We also observed the significant interaction effect
(2013). The marginal R² value describes the proportion of between species richness and land cover types so that MlO and
variance explained by fixed covariables only. The conditional R² MrO in built-up areas decreased with increasing species richness,
value describes the proportion of variance explained by fixed and whereas it increased with increasing species richness in other
random covariables. We tested for spatial independence in the land cover types (Table 3). The models relying on land cover type
residuals of the GLMM. We used the local indicator of spatial also confirmed that local functional diversity MlO significantly
association (Anselin, 1995), and visualized it with a correlogram decreased with the year of survey (Table 3).
of 500 m increments for neighborhood definition. The P-value Skewness in functional originalities (both local SlO and
was assessed based on 999 randomizations with the R package regional SrO) increased from close-to-zero to positive values with
ncf (Bjørnstad and Falck, 2001). No spatial autocorrelation was species richness (Figure 4) and skewness in regional originalities
detected in the residuals of the models, and thus, no correction increased with urbanization percentage (Table 2). The models
was required (Figure S2). relying on land-cover rather than urbanization percentage
In order to assess which traits characterize the most underline that skewness increase with species richness is higher
functionally original species at regional scale and at local scale in forested, agricultural and built-up areas than in urban green
we modeled, in each land cover type, species regional originality areas and semi-natural areas (Table 3). The sampling year was
(rAVi ) and the local originalities (lAViP ) averaged over all not linked with the skewness of functional originality in any
plots, with generalized least squares (GLS). GLS allowed us model (Table 3).
Frontiers in Ecology and Evolution | www.frontiersin.org 8 March 2020 | Volume 8 | Article 73Kondratyeva et al. Plant Uniqueness in the City
TABLE 2 | Results for the generalized linear mixed models (GLMM) that were run on the complete dataset (native + non-native species), including community level metrics
(mean and skewness of local and regional functional originalities and species richness) and the species-specific ratio of functional local originality to regional originality.
Intercept Urbanization (U) Species richness (SR) Sampling year U × SR R2 c R2 m
Mean local trait-based originality 4.7 · 10−1 *** 7.7 · 10−4 *** 9.9 · 10−4 *** −8.3 · 10−4 ** −2.4 · 10−5 *** 0.44 0.14
Mean regional trait-based originality 5.2 · 10 −1
*** 2.8 · 10 −4
*** −2.1 · 10 −5NS
−1.3 · 10 −4NS
−9.8 · 10−6 *** 0.64 0.10
Skewness of local trait-based originality 9.2 · 10−2 *** 7.5 · 10−4NS 2.6 · 10−2 *** −2.3 · 10−3NS Excluded 0.22 0.14
Skewness of regional trait-based originality −2.1 · 10−2NS 1.5 · 10−3 *** 3.4 · 10−2 *** −2.7 · 10−3NS Excluded 0.34 0.20
Species richness 1.9*** 4.5 · 10−3 *** Omitted −4.1 · 10−3NS Omitted 3.7 · 10−2 2.3 · 10−3
Local/regional trait-based originality 9.1 · 10−1 *** 7.3 · 10−4 *** 1.8 · 10−3 *** Excluded −1.0 · 10−3 *** 0.46 0.06
The estimated coefficients and their significance levels are shown for the explanatory variables that remained after backward selection of variables based on Akaike information criterion
(AIC) values, including urbanization percentage, species richness, the interaction (U × SR) between urbanization and species richness, and the sampling year. The value “excluded”
means that the explanatory variable was not retained in the final model according to the Akaike criterion, except for the last model on local/regional originality where the year was excluded
because of a default of convergence. The mention “omitted” means that the explanatory variable was not considered for an obvious reason: because it was already used as a response
variable. The conditional and marginal R2 values describe the proportion of variance explained by the fixed (R2 c ) and random + fixed (R2 m ) covariables. P-values: NS, non-significant
(P > 0.050); **0.001 < P ≤ 0.010; ***P ≤ 0.001.
Finally, species richness of the plots slightly increased along with earlier flowering date, longer flowering duration, higher SLA
the urbanization gradient and did not change significantly across and LDMC values, as well as with biannual and pluriannual life
the years (Table 2). More specifically, species richness in built- span (Figure 5). To the contrary, regional functional originality
up areas was significantly lower than in urban green areas and decreased in species with seed dispersal by wind, animals,
semi-natural areas and higher than in agricultural and forested humans or water; with insect and self-pollination and with
areas (Table 3). However, the conditional and marginal R² values perennial life span. Relatively similar patterns were found for
of the models of species richness were all low, indicating that the local functional originality particularly in built-up areas,
the position of a plot along the urbanization gradient was a poor although some correlations were not significant (Figure 5, see
predictor of species richness. Table S5 and Figure S4 for details). In particular, the first axis
Removing 85 non-native species (representing 14.6% of the of PCA applied to the coefficients of GLS models explained
regional pool), which occurred in 709 out of 2,362 sampling 79% of total variation indicating strong similarities in the traits
plots, had a minimal effect on the coefficients of the previous that explain species functional originality across the land cover
models (Tables S3, S4). We found two differences. First, the year types (Figure 5). The second and third axes show more subtle
of sampling had a significant negative effect on the mean of differences between land cover types: notably, compared to the
regional functional originalities (the effect was not significant average trends across all land covers, species dispersed by animals
with the complete dataset). Second, the increase in skewness were more functionally original in forested areas; perennial
of local functional originality with species richness was not species were more original in agricultural and forested areas;
significantly different in urban green spaces compared to the and species pollinated by insects were less original in agricultural
built-up areas (lower increase in urban green spaces obtained areas (Figure S4 and Table S5).
with the complete dataset), while the increase in skewness of The functional originality of the 85 non-native species were
regional functional originality with species richness was lower in on average significantly higher than those of natives at regional
agricultural areas than in the built-up areas (equivalent increase scale and at local scale in all land cover types (Table S6 and
with the complete dataset). Figure S5). The regional originality (and local originality in
urban green space) decreased with species frequency (number
of plots where a species occurred). Local functional originality
Species Originality increased with species urbanity in green urban areas and built-
The ratio of local-to-regional functional originality (lAViP /rAVi ) up areas (Table S6). Finally, we ranked species by their local and
increased significantly with urbanization percentage and species regional functional originalities and provide the top 5% most
richness and it was higher in built-up areas than in other land original in Table S7.
cover types (Tables 2, 3). Due to the interaction with species
richness, the positive effect of urbanization on the ratio of local-
to-regional originality decreased in richer plots and vice versa DISCUSSION
(Table 2 and Figure S3): the increase of the ratio with species
richness was significant only in forested and agricultural plots Urbanization affects natural ecosystem filters at multiple scales
(Table 3). We also found that Spearman’s correlation between (Aronson et al., 2016) consequently changing community
the mean of the local functional originalities of a species functional structure and trait distributions (Williams et al.,
and its regional functional originality was highly significant 2015). However, it is still unclear how species are filtered
(r = 0.78, p < 0.001). by urbanization across spatial scales and how each species
According to GLS models with species traits as covariables, contributes to community diversity. We suggest a promising
we found that regional functional originality increased in species framework that relies on the originality values calculated for
Frontiers in Ecology and Evolution | www.frontiersin.org 9 March 2020 | Volume 8 | Article 73Kondratyeva et al. Plant Uniqueness in the City
plant species relative to the co-occurring species within a local
The GLMM was used by contrasting each level of the land-cover variable to a reference baseline. We chose the urban built-up area as this reference land-cover level. This means for example, that the mean local functional originality is
lower by −5.9 · 10−2 units in agricultural plots than in urban built-up plots. Each land cover type was considered alone and in interaction with species richness (interaction noted “*SR”). The mention “omitted” means that the explanatory
variable was not considered for an obvious reason: because it was already used as a response variable. The conditional and marginal R2 values describe the proportion of variance explained by the fixed (R2 c ) and random + fixed
10−3
0.13
0.12
0.14
0.20
5.2 ·
0.06
R2 m community or within a regional pool (Table 1). Our approach
proposes a way to reveal signatures of potential processes that
TABLE 3 | Results for the generalized linear mixed models (GLMM) that were run on the complete dataset (native + non-native species) to explain five community level metrics (mean and skewness of local and
act on local community assembly: simultaneously giving a value
10−2
0.42
0.62
0.22
0.34
3.5 ·
0.45
R2 c
to each species at two spatial scales, local and regional. Indeed,
the ecological meaning of species originality is scale-dependent.
−1.6 · 10−2 * −2.4 10−3NS −2.7 · 10−2 **
−1.1 · 10−2 * −5.0 · 10−3NS −2.3 · 10−2 *
1.9 · 10−3 *** 2.8 · 10−3 *** 1.9 · 10−3 ***
1.1 · 10−3 *** 9.0 · 10−4 *** 1.0 · 10−3 ***
natural*SR
−2.4 · 10-4
While a species can be functionally redundant at the regional
Omitted
Semi-
scale, the very same species can have a high functional originality
NS
at the local scale, if it is the sole representative species of its
trait values in a local community. For example, competition may
1.6 · 10-3***
Agriculture*SR Urban green Forest*SR
increase local originality if species with similar traits exclude
Omitted each other (see e.g., Table 1, scenario 1.1.3). Inversely, while a
species can be functionally original at the regional scale, the
3.4 · 10−4NS very same species can have a low functional originality in a
area*SR
Omitted
local community, if for example rare, extreme environmental
conditions in the community allow the existence of a few,
atypical species that share similar trait values, which are rare at
the regional scale (see Table 1, scenario 2.1). These originality
−5.2 · 10−3NS
−9.4 · 10−3NS
regional functional and species richness), and the species-specific ratio of functional local originality to regional originality by different land cover types.
2.4 · 10−3 ***
1.0 · 10−3 ***
1.0 · 10−3 **
patterns can be translated into community-level metrics, by
Omitted
calculating the mean and the skewness of species regional
or local originalities (Ricotta et al., 2016; Kondratyeva et al.,
2019) and the ratio of local to regional originalities (Table 1).
Compared to more traditional studies centered on diversity
−1.0 · 10−4NS
−2.2 · 10−3NS
−3.2 · 10−3NS
−4.5 · 10−3NS
−8.0 · 10−4 **
10−4 ***
indices, our framework allows the identification of the traits
−9.8 ·
Year
which drive species originality at the regional and at the local
scales, considering different land cover types. Our study allowed
Species richness
both the development and a first application of such a framework
−1.6 · 10−3 ***
−1.1 · 10−3 ***
3.3 · 10−2 ***
4.4 · 10−2 ***
5.5 · 10−4NS
of species originality to a real dataset extracted from a citizen
Omitted
(SR)
(R2 m ) covariables. P-values: NS, non-significant (P > 0.050); *0.010 < P ≤ 0.050; **0.001 < P ≤ 0.010; ***P ≤ 0.001.
science program.
As expected, highly original species at the regional scale
were the least frequent (found in a low number of plots).
Species functionally-original at local and regional scales
2.1 · 10−1NS
1.6 · 10−1NS −1.9 · 10−2NS 1.6 · 10−1NS
3.0 · 10−1 *
natural
10−2 ***
10−2 ***
10−2 ***
Semi-
−5.7 ·
−3.1 ·
−4.5 ·
were urbanophile, i.e., found more frequently in the urban
environmental conditions than in the surrounding non-urban
environment, which corresponds to scenarios 1.1.1, 1.1.2, and
2.9 · 10−2NS
1.1.3 in Table 1. Urbanophile species are often restricted to some
10−2 ***
10−2 ***
10−1 ***
10−2 ***
Forest
−7.2 ·
−2.6 ·
−2.9 ·
−6.3 ·
specific urban habitats or urban ecological conditions, thus,
even in urban areas they are often scarce (Hill et al., 2002; Vallet
et al., 2016). We identified trait values associated with species
−2.8 · 10-2***
Agriculture Urban green
−2.0 · 10−1 ** 3.0 · 10−1 ***
1.3 · 10−1NS
originality and part of these trait values were previously found
10−2 ***
10−2 ***
−4.5 ·
−2.6 ·
area
to be favored in urban environment: early and long flowering,
promoted by higher urban temperatures (Mimet et al., 2009);
annual and biannual life span more adapted to rapidly changing
5.0 · 10−2NS
−1.8 · 10−2NS 6.3 · 10−3NS
urban environments (Duncan et al., 2011); wind-pollination
10−2 ***
10−2 ***
10−2 ***
−5.9 ·
−2.2 ·
−4.5 ·
in absence of animal pollinators (Lososová et al., 2006); higher
specific leaf area values favoring plant competitive abilities in
high soil nutrient conditions present in urbanized areas (Song
5.4 · 10−1 ***
5.4 · 10−1 ***
9.7 · 10−1 ***
5.0 · 10−2NS
Intercept
et al., 2019). High leaf dry matter content (LDMC) indicates a
2.2***
slower growth rate and longer life span as an adaptation to rarely
disturbed environments (Cornelissen et al., 2003) contrary to
low LDMC values more likely to be observed in areas disturbed
Mean regional functional
Local/regional functional
Species richness (SR)
by urbanization (Cornelissen et al., 2003; Knapp et al., 2008b).
Skewness of regional
Mean local functional
functional originality
functional originality
Skewness of local
Higher LDMC values observed in more original species in
built-up areas could thus be related to a few urbanophobe or
urbanoneutral species that remain in the urbanized areas. The
originality
originality
originality
fact that both local and regional originalities increased with
urbanization suggests that original urbanophile species may have
Frontiers in Ecology and Evolution | www.frontiersin.org 10 March 2020 | Volume 8 | Article 73Kondratyeva et al. Plant Uniqueness in the City FIGURE 3 | Variation in (A) mean regional functional originality and (B) mean local functional originality (local functional diversity) according to the percentage of urbanization within a 1 km² grid cell (grid cell corresponds to the Vigie-flore protocol) and species richness with the complete species dataset (natives and non-natives). One data point represents one species plot. The colors represent a scale of species richness (SR) going from blue for low SR (minimum of 3 species) to red for high SR (maximum of 50 species). Colored curves represent the estimated trends of an interaction between urbanization and SR for 5 (blue), 25 (salmon), and 40 (red) species retrieved from the mean originality GLMM models. FIGURE 4 | The skewness of the (A) regional and (B) local functional originality according to the species richness (SR) in each species plot of the complete dataset. One data point represents one plot. The black curve represents the estimated trend retrieved from the skewness of generalized mixed linear models. different combinations of those original trait values, leading to could be responsible for the observed increase in functional increased functional diversity within urban communities. originality and diversity in built-up areas. Nevertheless, in our Non-native species are often promoted in areas disturbed by dataset non-natives represented 14% of the total species pool, urbanization (Kowarik, 2008). We thus searched whether they which could not be sufficient to contribute substantially to the Frontiers in Ecology and Evolution | www.frontiersin.org 11 March 2020 | Volume 8 | Article 73
Kondratyeva et al.                                                                                                                              Plant Uniqueness in the City

 FIGURE 5 | Analysis of the coefficients of the generalized least squares (GLS) models applied to species functional originalities with traits as explanatory variables. As
 indicated in the main text, we performed one model for the regional originality and one for each of the land cover types. Then, we applied a principal component
 analysis (PCA) on the table with land cover types as columns, traits as rows and the coefficients of the GLS models as entries (Table S5). The left part of the figure
 displays a dot plot with the coordinates of land covers and of traits on the first axis of the PCA. Next to the dot plot, a table indicates which traits significantly
 increased (black squares) or decreased (white squares) with species functional originality. The absence of a square indicates that species functional originality was
 found independent of the trait.

community diversity, and their removal in our data hardly                                non-native species. This increase corresponds to the scenarios
influenced community structure and diversity. Moreover, our                              1.1.1, 1.1.2, and 1.1.3 in Table 1 where high regional originality
586 species set was a sample of the whole Île-de-France region                           in urban areas may be due to urban conditions allowing
flora, where more than 2,064 vascular plant species have been                            the persistence of species with unique traits not observed,
recorded (CBNBP, 2016). Thus, probably many non-native                                   or observed less frequently in other land cover types (e.g.,
species were missing at the regional scale in our study, as the                          forest, agriculture) (e.g., Williams et al., 2009). Regionally-
Vigie-flore program does not aim to provide an exhaustive                                original species in that case tend to be urbanophile and their
sampling of the flora of Île-de-France region. Nevertheless, we                          originality results from the environmental heterogeneity of the
found that non-native species were more functionally original                            region. Our analyses of the skewness of species originalities,
than native species at both the local and regional scales.                               of the ratio of local to regional originalities and of species
Non-native species which are frequent in urban areas, have                               richness complemented those of the mean originality to
some specific environmental preferences, making them highly                              distinguish between the three alternative scenarios (1.1.1, 1.1.2,
original specialists within urban habitat patches (McKinney,                             and 1.1.3 in Table 1). Locally, interspecific interactions, such
2006; Godefroid and Ricotta, 2018). They may thus contribute                             as competition between species for limited resources, limit
partly to the observed increased originality in urban areas. As                          the functional similarity between species (Stubbs and Wilson,
removing non-native species from our data set had a minimal                              2004). This limitation may restrict the number of species and
effect on the results of our models, the increased originality in                        increase functional originality in the most urbanized areas,
built-up areas also emerges from the non-random distribution                             promoting several combinations of urbanophile traits (Scenario
of native species among the different land cover types of                                1.1.1, Table 1). The same originality pattern would also arise
the region.                                                                              from facilitation interactions between species, making plant
    We indeed observed an increase with urbanization of both                             communities to function interdependently (Lortie et al., 2004).
mean local and mean regional originality with and without                                However, mean originality decreased with species richness in

Frontiers in Ecology and Evolution | www.frontiersin.org                            12                                                   March 2020 | Volume 8 | Article 73
You can also read