Methods for Identifying Species Complexes Using a Novel Suite of Multivariate Approaches and Multiple Data Sources: A Case Study With Gulf of ...
←
→
Page content transcription
If your browser does not render page correctly, please read the page content below

ORIGINAL RESEARCH
                                                                                                                                            published: 11 August 2021
                                                                                                                                      doi: 10.3389/fmars.2021.663375

                                            Methods for Identifying Species
                                            Complexes Using a Novel Suite of
                                            Multivariate Approaches and Multiple
                                            Data Sources: A Case Study With
                                            Gulf of Alaska Rockfish
                                            Kristen L. Omori 1* , Cindy A. Tribuzio 2 , Elizabeth A. Babcock 3 and John M. Hoenig 1
                                            1
                                             Department of Fisheries Science, Virginia Institute of Marine Science, William & Mary, Gloucester Point, VA, United States,
                                            2
                                             Auke Bay Laboratories, Alaska Fisheries Science Center, National Marine Fisheries Service, National Oceanic
                                            and Atmospheric Administration, Juneau, AK, United States, 3 Department of Marine Biology and Ecology, Rosenstiel School
                                            of Marine and Atmospheric Sciences, University of Miami, Miami, FL, United States

                                            International and national laws governing the management of living marine resources
                                            generally require specification of harvest limits. To assist with the management of
                        Edited by:          data-limited species, stocks are often grouped into complexes and assessed and
             Natalie Anne Dowling,
   Oceans and Atmosphere (CSIRO),
                                            managed as a single unit. The species that comprise a complex should have similar
                          Australia         life history, susceptibility to the fishing gear, and spatial distribution, such that common
                       Reviewed by:         management measures will likely lead to sustainable harvest of all species in the
   José Lino Vieira De Oliveira Costa,      complex. However, forming complexes to meet these standards is difficult due to the
       University of Lisbon, Portugal
                        Lyall Bellquist,    lack of basic biological or fisheries data to inform estimates of biological vulnerability
           The Nature Conservancy,          and fishery susceptibility. A variety of cluster and ordination techniques are applied to
                        United States
                                            bycatch rockfish species in the Gulf of Alaska (GOA) as a case study to demonstrate
                  *Correspondence:
                     Kristen L. Omori
                                            how groupings may differ based on the multivariate techniques used and the availability
                    komori@vims.edu         and reliability of life history, fishery independent survey, and fishery catch data. For GOA
                                            rockfish, our results demonstrate that fishing gear primarily defined differences in species
                   Specialty section:
         This article was submitted to
                                            composition, and we suggest that these species be grouped by susceptibility to the
          Marine Ecosystem Ecology,         main fishing gears while monitoring those species with high vulnerabilities to overfishing.
               a section of the journal
                                            Current GOA rockfish complex delineations (i.e., Other Rockfish and Demersal Shelf
          Frontiers in Marine Science
                                            Rockfish) are consistent with the results of this study, but should be expanded across the
        Received: 02 February 2021
           Accepted: 16 July 2021           entire GOA. Differences observed across species groupings for the variety of data types
         Published: 11 August 2021          and multivariate approaches utilized demonstrate the importance of exploring a diversity
                            Citation:       of methods. As best practice in identifying species complexes, we suggest using a
              Omori KL, Tribuzio CA,
  Babcock EA and Hoenig JM (2021)
                                            productivity-susceptibility analysis or expert judgment to begin groupings. Then a variety
     Methods for Identifying Species        of multivariate techniques and data sources should be used to identify complexes,
     Complexes Using a Novel Suite
                                            while balancing an appropriate number of manageable groups. Thus, optimal species
          of Multivariate Approaches
  and Multiple Data Sources: A Case         complex groupings should be determined by commonality and consistency among a
  Study With Gulf of Alaska Rockfish.       variety of multivariate methods and datasets.
          Front. Mar. Sci. 8:663375.
   doi: 10.3389/fmars.2021.663375           Keywords: stock complex, species assemblage, cluster analysis, ordination analysis, data-limited fisheries

Frontiers in Marine Science | www.frontiersin.org                                  1                                           August 2021 | Volume 8 | Article 663375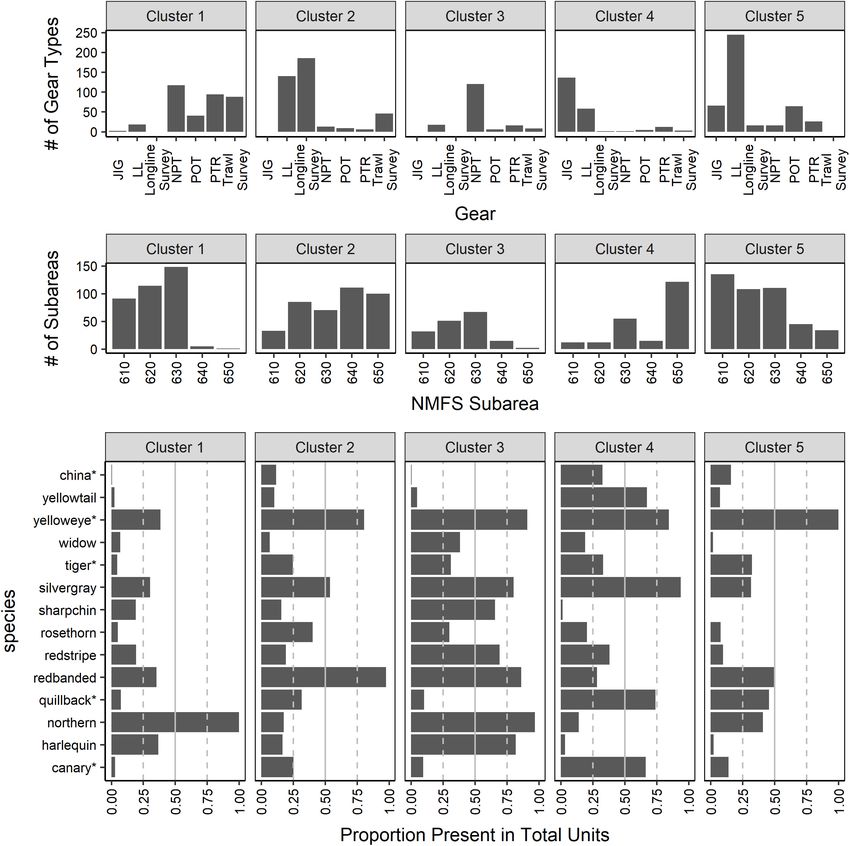
Omori et al.                                                                                             Multivariate Approaches for Species Complexes

INTRODUCTION                                                                 remains a difficult scientific problem. No single method has
                                                                             proven robust for all species complex grouping approaches, and
The requirement to implement catch limits for data-limited and               often development of species complexes relies on a combination
previously unassessed stocks resulting from recent international             of qualitative (i.e., expert judgement) and quantitative measures.
policies, such as the Magnuson-Stevens Reauthorization Act                   Productivity-susceptibility analysis (PSA) has been proposed
of 2006 (MSRA, 2007) and Common Fisheries Policy (CFP,                       as a tool for grouping data-limited species based primarily
2013), presents scientific and management challenges for regional            on expert judgment (Patrick et al., 2010; Cope et al.,
fishery management entities. Managing an aggregation of fish                 2011). A PSA bins information (i.e., life history values and
stocks or species as a single unit is one approach utilized by               impact by fisheries indicators) in productivity or susceptibility
fisheries managers in an attempt to comply with international                categories based on expert judgement. The rankings within
and federal laws (Jiao et al., 2009), reduce the number of                   each category are calculated into an overall vulnerability score,
required stock assessments (Koutsidi et al., 2016), and create               which is thereby used to summarize species into groups.
manageable harvest regulations. These aggregations, also known               However, PSA may not be as useful when forming complexes
as stock or species complexes, are often determined by similarity            with closely related species with poor quality data, because
in life history characteristics, vulnerability to the fishery, and           vulnerability rankings are likely to be too similar despite
geographic distributions (USOFR, 2009). Multiple stocks of a                 having the possibility of scoring differently in the susceptibility
single species being managed together are likely to have strong              categories. For example, Cope et al. (2011) determined that
similarities in life history and susceptibility, whereas complexes           vulnerability rankings from a PSA could not alone be used to
consisting of multiple species have more diverging characteristics           establish complexes for rockfish species in the United States
in productivity (i.e., life history traits), behavior, and habitat           West Coast groundfish fishery. A hierarchical tiered approach
preference. Species in a complex are typically caught in a                   was implemented by applying clustering analyses first using
multispecies fishery and often lack adequate data for a single               ecological distribution (i.e., depth and latitude), followed by using
species assessment (USOFR, 2009).                                            the vulnerability scores. Yet, the use of expert judgment for
    Assigning species to complexes can be a difficult, but                   scoring vulnerability was considered problematic for species with
critical task for implementing sustainable management of                     such poor quality data.
data-limited species. Complexes are often formed using a                        Alternately, multivariate techniques (e.g., cluster analyses and
combination of life history traits, trophic roles, and fishing               ordination methods) are a quantitative tool used for identifying
pressure (Shertzer and Williams, 2008). However, rarely is the               similarities among species when adequate species-specific data
full extent of this information available to adequately determine            are available. Of the few quantitative studies that have developed
the appropriateness of a complex grouping, and there can                     species complexes, the combination of expert judgment and
be a mismatch in groupings when using life history traits                    multiple data sources or multivariate approaches (or both) have
compared to fishery susceptibility (i.e., species caught together            typically been used to assign species to appropriate groups.
by the same gear types). Grouping species based on life history              For example, both ordination and clustering methods can be
characteristics, which represent the population’s productivity,              used to examine species assemblages using one data source
is important because species with similar growth and maturity                (e.g., Lee and Sampson, 2000; Williams and Ralston., 2002),
often demonstrate similar responses to fishing pressure (e.g.,               or multiple data sources with each dataset being analyzed
Farmer et al., 2016; DeMartini, 2019). From a management                     separately, summarized and compared to determine species
perspective, grouping by susceptibility to fishing gear (e.g.,               groupings (e.g., Shertzer and Williams, 2008; Pennino et al.,
multispecies fisheries) is often simpler than grouping by life               2016). Other studies have developed methods to quantitatively
history traits, because management by gear type is less easily               synthesize findings of species co-occurrence when using multiple
enforceable for complexes harvested by a variety of gears. Yet,              datasets. For example, Farmer et al. (2016) combined analysis
the potential for disproportionate impacts on the species within             of multiple catch data matrices along with a life history matrix
the complex exists when complexes are formed using gear                      to assign species to complexes by amalgamating the results
susceptibility and when selectivity or availability differs by species       from individual hierarchical cluster analyses into a weighted
(DeMartini, 2019).                                                           mean cluster association index. However, the weighted mean
    Aggregating species exclusively based on either life history or          cluster association index depended on each cluster analyses
fishery traits can lead to unsuitable groupings. For example, a              from each data source to produce clear, sensible results (i.e.,
complex formed on fishing vulnerability may group species with               no chaining, which is when single units branch and form their
divergent life history characteristics, and species that reproduce at        own cluster). The array of quantitative studies used to identify
earlier ages and are more fecund (i.e., have a higher productivity)          species complexes have focused primarily on associations or
are more resilient to fishing pressure compared to species that              similarities among species.
have lower fecundity and reproduce later in life (i.e., have a lower            Conversely, other studies examining potential species
productivity). Alternatively, grouping species only on similarities          complexes have grouped together similar catch units (i.e.,
in life history may be futile if the species are not vulnerable to the       within a specified area and temporal scale) based on similar
same fishing gear (e.g., Pikitch, 1991; Vinther et al., 2004).               species composition. Grouping species based on vulnerability
    Reconciling the need to balance fishery vulnerability and                to particular fishing gears allowed analysts to determine how
biological considerations for establishing species complexes                 different factors, such as depth (Rogers and Pikitch, 1992),

Frontiers in Marine Science | www.frontiersin.org                        2                                      August 2021 | Volume 8 | Article 663375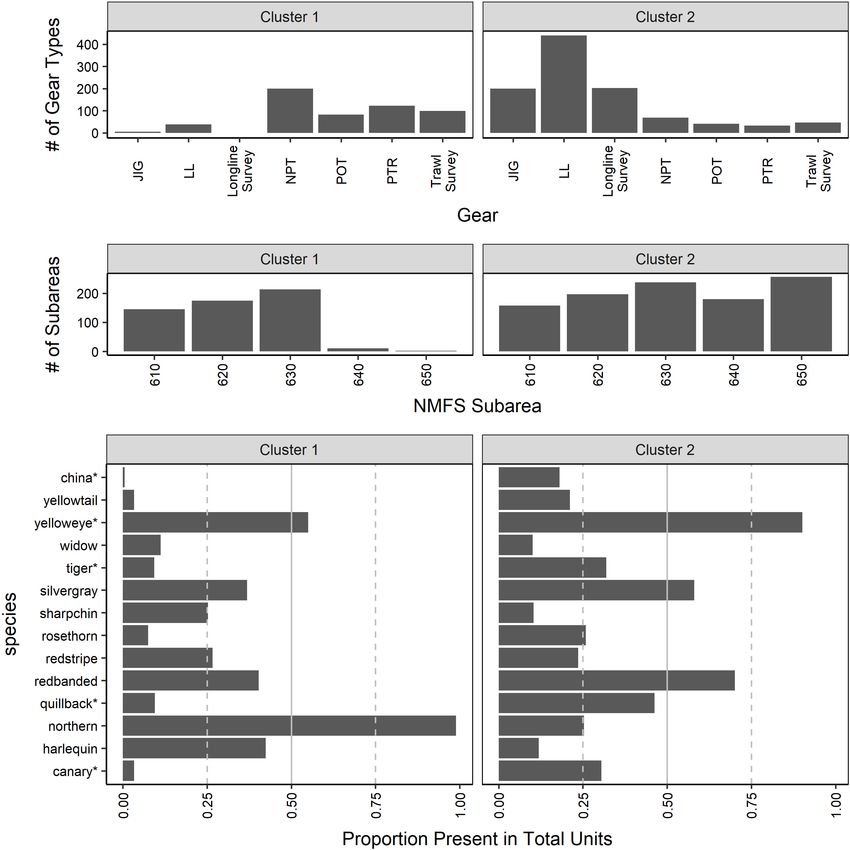
Omori et al. Multivariate Approaches for Species Complexes
influenced the species composition, while providing potential the fisheries (Ormseth and Spencer, 2011), which implies that
species assemblages based on fishery susceptibility that many the rockfish assemblages should be carefully monitored and
east management and enforcement. Koutsidi et al. (2016) managed judiciously. However, further quantitative analysis is
developed a unique method that combined biological traits warranted to identify whether current GOA complexes should
with fishing operation data to examine how the different be restructured.
fishing sectors tended to catch species with similar biological In this study, the goal is to explore the consistency of various
traits. This study concluded that it could be advantageous to quantitative methods for identifying species complexes, while
consider functional biological traits in management decisions also providing an approach to aggregate data across different
for data-limited species that lack traditional assessments. spatial areas and gear types. The GOA Other Rockfish and
The method that Koutsidi et al. (2016) applied required Demersal Shelf Rockfish species are used as a case study,
knowledge of a variety of life history, behavior, distribution, because identifying consistent species groupings has proven
ecology and habitat attributes in addition to species-specific difficult for these species. Most of the GOA rockfish species
catch data from the fisheries, which may not be available for are generally not targeted and have high discard rates due
data-limited species. to little economic value. A combination of life history traits,
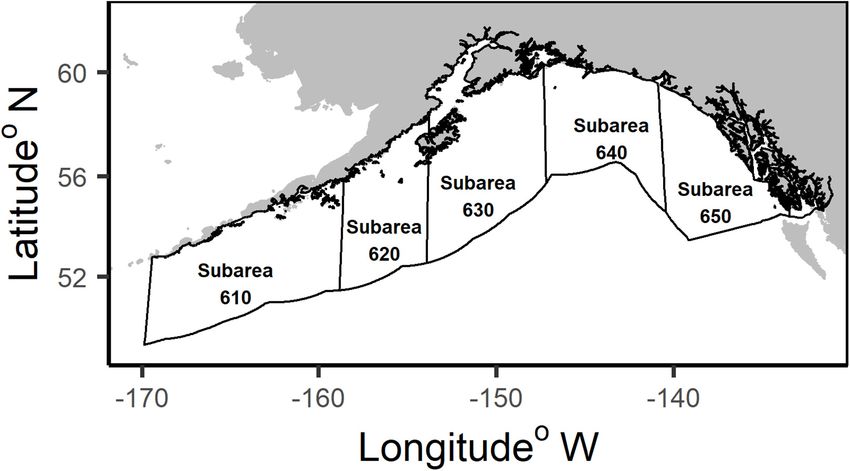
Management of several of the Gulf of Alaska (GOA) rockfish fishery dependent, and fishery independent data sources are
species (Figure 1) is an example where managers have identified used to assemble species complexes with hierarchical and non-
species complexes, but further quantitative analysis would be hierarchical clustering methods and ordination techniques. Two
desirable to validate these assignments. GOA rockfish (genus modes of analyses were implemented to the catch data for
Sebastes) are caught as bycatch (i.e., unintended catch that the clustering methods: (1) aggregate similar species together
is either discarded or retained) in a variety of fisheries. based on catch presence and abundance; (2) group similar
Rockfish in the GOA pose a unique challenge due to their sampling units based on common catch composition. The species
range in life history values, habitat preferences, and behavior. assemblages are compared across multivariate techniques and
Optimally, the rockfish in each complex should withstand data types to explore patterns of consistency and identify species
similar fishing pressures, have comparable distributions, and complexes for management. These results provide new insight
common productivity levels. Currently, most of the non- into how the data quality and quantitative methodology utilized
targeted rockfish in the GOA are assessed in two complexes: may influence groupings for implementing species complexes.
the Other Rockfish complex, which consists of species that Additionally, this is the first quantitative analysis to identify
are classified as the “slope,” “pelagic shelf,” and “demersal species complexes in the GOA.
shelf ” rockfish assemblages; and the Demersal Shelf Rockfish
complex, which separates the group of seven “demersal
shelf ” species from the remaining rockfish species in one MATERIALS AND METHODS
management area (North Pacific Fishery Management Council
(NPFMC), 2019). These complex delineations often combine Management Units and Species
species with different habitat preferences, which ultimately The GOA is partitioned into the National Marine Fisheries
affects their spatial distributions (i.e., based on gear selectivity Service (NMFS) subareas: 610, 620, 630, 640 and 650 (Figure 1).
and availability). Additionally, the species compositions of the These subareas are used in the analyses to examine differences
GOA rockfish complexes have undergone multiple changes in the species composition by area. The GOA Other Rockfish
throughout their management history. In 2011, a PSA indicated complex comprises 25 Sebastes species in the GOA management
that select GOA rockfish had high vulnerability scores due area. Seven of the 25 species are managed in a separate
to their low productivity and medium susceptibility level in complex (Table 1), Demersal Shelf Rockfish, in subarea 650,
but are included in the Other Rockfish complex in all
other subareas in the GOA. The State of Alaska assesses
the Demersal Shelf Rockfish in subarea 650, and manages
their catch in parallel with state waters fisheries for these
species. Additionally, northern rockfish (S. polyspinis) are
only included in the Other Rockfish complex in subareas
640 and 650 for management, but they are assessed as part
of a single species stock assessment for the entire GOA.
Northern rockfish catch data from all subareas are included
in our analyses for comparison, but are not a candidate
for reassignment.
Other Rockfish species vary widely in their distribution,
habitat selection, and life history traits. With an exception of
harlequin (S. variegatus), these rockfish in the GOA are at the
northern limits of their distribution, which span the U.S. West
FIGURE 1 | Map of the National Marine Fisheries Service (NMFS)
management subareas in the Gulf of Alaska.
Coast from Southern California to Alaska (Love et al., 2002).
Harlequin are found primarily in northern waters from British
Frontiers in Marine Science | www.frontiersin.org 3 August 2021 | Volume 8 | Article 663375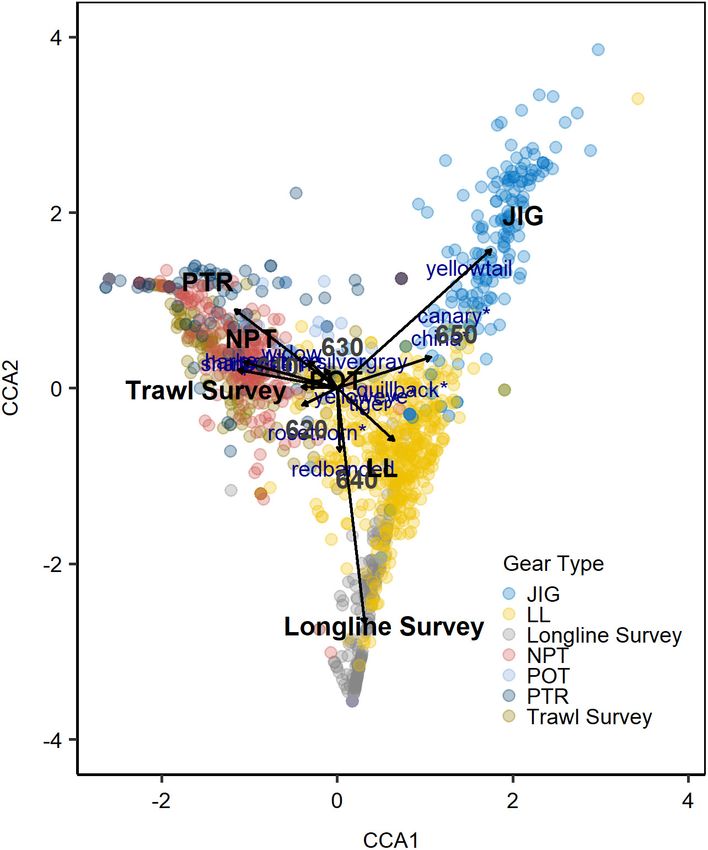
Omori et al.                                                                                            Multivariate Approaches for Species Complexes

Columbia to Alaska (Tribuzio and Echave, 2019). Species in                 the species. Other Rockfish species are incidentally caught in
the Other Rockfish complex occur in depths up to 800 m, but                other groundfish fisheries by five gear types including non-pelagic
typical are found in depths ranging from 100 to 275 m (Love                trawl (NPT), pelagic trawl (PTR), longline hook and line (LL),
et al., 2002). Adult habitats include high relief rocks, reefs or          pot (POT), and jig (JIG). The majority of the rockfish bycatch
crevices, low relief rocky bottoms, mudflats, vegetative areas,            species by biomass are caught in the trawling gear (NPT and
and mixed habitat (Johnson et al., 2003; Conrath et al., 2019).            PTR), which primarily targets pollock, Pacific cod, flounders, and
Some individuals are more solitary, whereas others tend to                 target rockfish species, in all subarea except 650. They are also
aggregate in mixed-species assemblages (Johnson et al., 2003). In          caught in fishery longline gear types (LL and JIG) in all subareas
general, rockfish species are characterized by their late maturity,        that target sablefish and Pacific halibut. Fisheries species-specific
longevity, and their ability to bear live young (Love et al., 2002;        catch information is gathered from the Alaska Regional Office
Beyer et al., 2015). However, there is a wide range of life history        Catch Accounting System (CAS) using data from 2010 (when
values within the Other Rockfish complex (Table 1; see section             quality data were first available for these rockfish species) to
“Life History Data”).                                                      2018. The sampling unit for the catch data is determined by
    The Other Rockfish complex consist of bycatch species                  each unique vessel trip identifier each week for each subarea
captured in more lucrative rockfish and other groundfish fisheries         as reported by fishermen, ranging from < 10 to over 8,000
using trawl and longline gear. More than half of the species               vessel trips for each gear type and subarea over the entire time
belonging to the Other Rockfish complex are rarely caught                  period. The CPUE input data used for the analyses are defined
(
Frontiers in Marine Science | www.frontiersin.org
Omori et al.
TABLE 1 | Life history characteristics for each Gulf of Alaska Other Rockfish (GOA OR) and Demersal Shelf Rockfish (DSR) species.
Common name Sebastes sp. Assessment Group Amax Amat Lmat (mm) L∞ (mm) k
blackgill S. melanostomus GOA OR 90 (OR/CA; 1) 21 (OR/CA; 1) 350 (OR/CA; 1) 548 (OR/CA; 1) 0.04 (OR/CA; 1)
bocaccio S. paucispinis GOA OR 45 (WA; 2) 4 (CA; 12) 450 (CA; 12) 909 (BC; 22) 0.088 (BC; 22)
canary S. pinniger DSR 71 (CA; 3) 9 (CA; 12) 480 (BC; 20) 580 (BC/WA/OR/CA; 23) 0.16 (BC/WA/OR/CA; 23)
Chilipepper S. goodie GOA OR 35 (OR/CA; 4) 2.5 (OR/CA; 4) 260 (OR/CA; 4) 575 (OR/CA; 4) 0.252 (OR/CA; 4)
China S. nebulosus DSR 78 (AK; 5) 4 (CA; 12) 270 (CA; 12) 450 (AK; 28) 0.19 (WA/OR/CA; 31)
copper S. caurinus DSR 50 (AK; 5) 6 (CA; 12) 340 (CA; 12) 400 (AK; 28) 0.13 (WA/OR/CA; 31)
darkblotched S. crameri GOA OR 105 (6) 8.4 (OR; 13) 365 (OR; 13) 455 (OR; 24) 0.185 (6)
greenstriped S. elongates GOA OR 54 (AK; 5) 8.5 (WA/OR/CA; 14) 230 (CA; 12) 355 (BC; 25) 0.115 (BC; 25)
harlequin S. variegatus GOA OR 34 (AK; 7) 9.0* 230 (AK; 20) 323 (AK; 7) 0.110 (AK; 7)
northern S. polyspinis Subareas: 640,650 72 (AK; 7) 13 (AK; 15) 360 (AK; 15) 404 (AK; 7) 0.155 (AK; 7)
pygmy S. wilsoni GOA OR 26 (BC; 5) 6.0* 183.9* 230 (AK; 28) 0.180*
quillback S. maliger DSR 90 (AK; 8) 5 (AK; 16) 260 (CA; 12) 610 (AK; 28) 0.113*
5
redbanded S. babcocki GOA OR 106 (AK; 5) 4 (CA; 12) 420 (BC; 20) 698 (BC; 22) 0.042 (BC; 22)
redstripe S. proriger GOA OR 55 (BC; 5) 8 (16) 290 (BC; 20) 420 (BC; 22) 0.15 (BC; 22)
rosethorn S. helvomaculatus DSR 87 (AK; 5) 8 (CA; 12) 210 (AK; 20) 319 (BC; 22) 0.079 (BC; 22)
sharpchin S. zacentrus GOA OR 58 (AK; 7) 10 (16) 270 (AK; 16) 350 (AK; 7) 0.122 (AK; 7)
silvergray S. brevispinis GOA OR 75 (AK; 7) 10 (BC; 17) 460 (BC; 16) 623 (AK; 7) 0.093 (AK; 7)
splitnose S. diploproa GOA OR 103 (BC; 9) 7 (CA; 12) 218 (WA/OR/CA; 21) 314 (BC; 9) 0.155 (BC; 9)
stripetail S. saxicola GOA OR 38 (30) 4 (CA; 18) 200 (BC; 20) 327 (CA; 18) 0.147 (CA; 18)
tiger S. nigrocinctus DSR 116 (AK; 5) 15.0* 391.1* 610 (AK; 28) 0.083*
vermilion S. miniatus GOA OR 60 (AK; 5) 6 (CA; 18) 330 (CA; 18) 688 (CA; 18) 0.164 (CA; 27)
widow S. entomelas GOA OR 60 (BC; 5) 5 (CA; 12) 370 (CA; 12) 516 (OR; 26) 0.15 (OR; 26)
Multivariate Approaches for Species Complexes
yelloweye S. ruberrimus DSR 117 (AK; 10) 22 (AK; 16) 475 (AK; 16) 644 (AK; 10) 0.046 (AK; 10)
yellowmouth S. reedi GOA OR 99 (BC; 5) 11 (BC; 32) 380 (BC; 20) 469 (BC; 32) 0.12 (BC; 32)
August 2021 | Volume 8 | Article 663375
yellowtail S. flavidus GOA OR 64 (BC; 11) 9 (WA/OR/CA; 19) 410 (WA/OR/CA; 19) 530 (BC; 22) 0.20 (BC; 22)
Assessment Group indicates the current species complex assignment. Life history values included are: maximum age (Amax ), age-at-maturity (Amat ), length-at-maturity (Lmat ), average maximum length (L∞ ) and von
Bertalanffy growth parameter, k. Regions or states (i.e., CA, California; OR, Oregon; WA, Washington; BC, British Columbia; AK, Alaska) and citation (in Appendix 1) are listed in parentheses.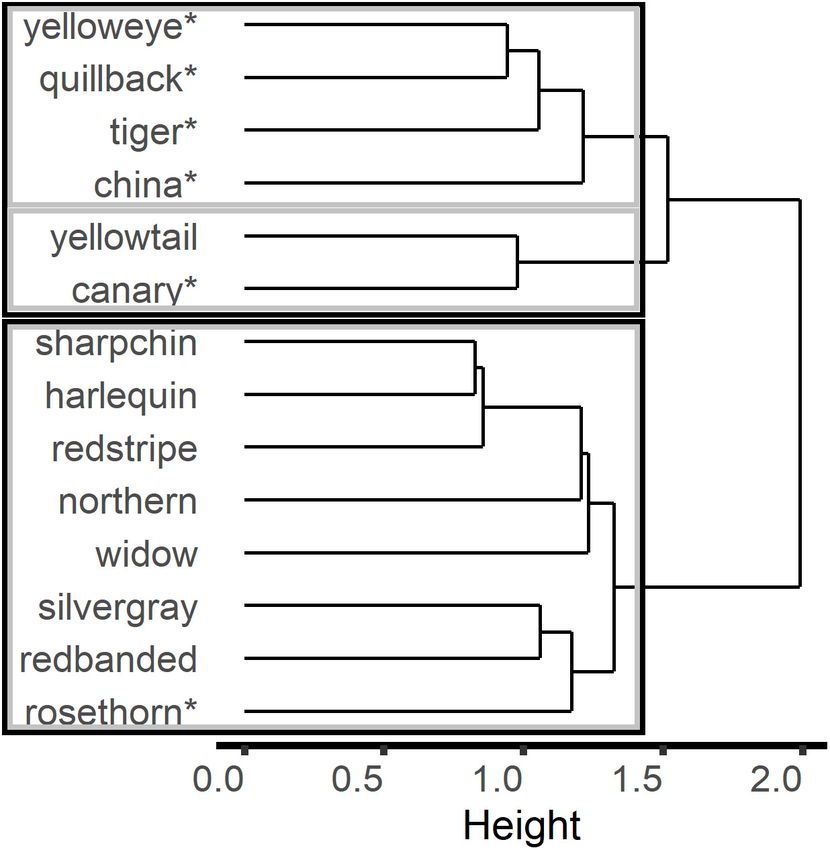
Omori et al.                                                                                         Multivariate Approaches for Species Complexes

k-mediods; the ordination technique that is implemented is                   The ordination techniques that were utilized to identify
either canonical correspondence analysis (CCA) or non-metric              relationships among species are CCA and NMDS. The CCA
multidimensional scaling (NMDS). These methods are described              technique is commonly used to examine species relationships and
in Manly (2005); Zuur et al. (2007) and Legendre and Legendre             environmental variables that influence community composition.
(2012). All analyses were conducted in the R software language            This analysis uses a set of weighted linear regressions to describe
(R Core Team, 2020).                                                      the relationship among species catch and explanatory variables
    Both hierarchical (Ward’s minimum variance) and non-                  (e.g., gear, depth, or location). It assumes that the species data
hierarchical (k-mediods) cluster analysis are implemented to              are unimodal and vary along the gradients of the explanatory
identify and compare consistency in species groupings. Ward’s             variables. Here, depth or depth bins, general substrate type,
minimum variance analysis is a hierarchical, agglomerative                gear, and NMFS subarea were included as factors in CCA when
clustering technique, which uses the centroid method to                   applicable. In contrast to CCA, NMDS accommodates different
iteratively group closest objects together (Ward, 1963). Ward’s           magnitudes in the data, because it preserves the order of the
analyses were conducted in R package “stats” (R Core Team,                distances rather than the magnitude of the distances. The NMDS
2020), and a bootstrap resampling method was applied to                   technique also does not assume an underlying response model
determine the stability of each grouping with 1000 bootstrap              (Legendre and Legendre, 2012). Both ordination methods were
samples in R package “fpc” (Hennig, 2007; Hennig, 2020).                  conducted using R package “vegan” (Oksanen et al., 2019) and
For each bootstrap sample, the new dataset was formed by                  the first two dimensions of ordination space were used for
drawing samples from the original dataset with replacement                visual representation.
and applying the Ward’s clustering analysis. The Jaccard
coefficient, J, was calculated to examine the similarity in the           Application of Multivariate Analyses
cluster membership between the original cluster with each                 Analyses of Life History Characteristics
bootstrap cluster. The mean Jaccard coefficient values, J̄, were          Both Ward’s and k-mediods analyses were applied to identify
computed for each cluster, where a higher value indicated more            species groupings based on life history characteristics using
stability in the cluster. A value of 0.75 or greater implies              R-mode. The input life history table used in the analysis had
that the original cluster is stable; values ranging from 0.6 to           species as the rows and life history characteristics as the columns
0.75 suggest there are patterns in the data, but uncertainty              with entries being the associated life history values. Three
in the cluster (Hennig, 2007). Dendrograms were used to                   versions of the life history table were used for the analyses:
aid in the interpretation of the results. The non-hierarchical            species-specific values for each characteristic when data were
cluster method, k-mediods, is a more robust variant of the                available (species with no information were removed from
traditional k-means (Kaufman and Rousseeuw, 1990). This                   this table, n = 21), species-specific values with missing values
k-mediods method finds optimal groupings by minimizing the                estimated from FishLife (Thorson et al., 2017, Table 1), and
distance between all objects and their nearest cluster center             binned data based on four percentile bins (0–25, 26–50, 51–
(mediod). The k-mediods analyses were conducted using R                   75, and 75–100%). Binned data allowed for data gaps and data
package “stats” (R Core Team, 2020). The optimal number of                uncertainty. The data in the species-specific life history tables
desired groupings for k-mediods was determined a priori using             were standardized by dividing each characteristic value by the
the average silhouette width (Rousseeuw, 1987) in R package               mean for each life history characteristic. The standardization
“factoextra” (Kassambara and Mundt, 2020). The silhouette                 process ensures the magnitude of the data are similar so that
width is the measure of quality of the clustering by examining            the life history values are weighted the same in the analyses.
the (dis)similarities of an object to the other objects within            The Euclidean distances were then calculated to develop the
the same cluster compared to objects belonging to other                   final dissimilarity matrix before Ward’s and k-mediods analyses
clusters (Rousseeuw, 1987), where the number of k clusters                were implemented. Lastly, NMDS was applied to the dissimilarity
selected is based on the highest average silhouette width. An             matrix to assist in visualizing the species groupings and show any
average silhouette width less than 0.25 signifies that there is           relationships among species and life history characteristics.
not enough structure in the data to support natural clusters
(Kaufman and Rousseeuw, 1990).                                            Sub-Unit Matrices of Catch and Survey Data
    Additionally, for either method it is possible to use either of       There are two scales of aggregation of the data, sub-unit and a
two different clustering techniques: R-mode (comparing variables          more aggregated ‘unit’ scale (Figure 2). At the ‘sub-unit’ scale,
or descriptors) or Q-mode (comparing objects; see Figure 2;               input data matrices had entries of presence/absence or CPUE
described in Legendre and Legendre, 2012). R-mode directly                of a species (represented in the rows) for a given sampling
identifies relationships among species (variables) by examining           unit (i.e., the smallest sampling unit of either haul, tow, or
species similarities based on the catch in each sampling unit,            set in the columns). A matrix was created for every area and
whereas Q-mode identifies clusters by grouping units based on             gear combination for all years combined. The application of the
commonality in species composition. Q-mode is particularly                multivariate methods for each individual data sub-unit matrix
useful for identifying groupings of sampling units (e.g., year            ensured that each gear in the fisheries and surveys and each area
and gear combinations) in multispecies catch data, but requires           are treated independently.
further analysis to examine species composition groupings within             Ward’s analysis, k-mediods and CCA were applied to
sampling units (e.g., Rogers and Pikitch, 1992).                          the commercial catch and survey matrices. The R-mode for

Frontiers in Marine Science | www.frontiersin.org                     6                                     August 2021 | Volume 8 | Article 663375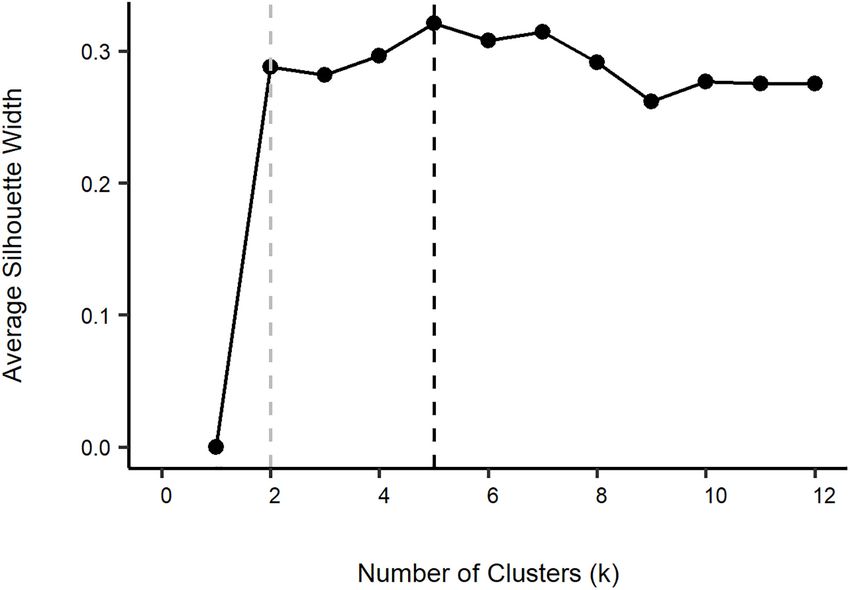
Omori et al.                                                                                                            Multivariate Approaches for Species Complexes

  FIGURE 2 | Design of the model analyses identifying data, clustering technique and input matrix structure for each aspect of the cluster analyses.

the cluster analyses was implemented for the sub-unit data                             for less common species and high valued positive catches for
matrices. The multivariate analyses using R-mode allowed direct                        prevalent species.
identification of species groupings for each gear type and NMFS                           Ward’s analysis and k-mediods were applied to the
subarea in the GOA when using the sub-unit matrix. Once                                proportions matrix using both R-mode and Q-mode. Similar
the data matrices were created, the CPUE sub-unit matrices                             to the R-mode application of the cluster analyses on the
were standardized using a root-root transformation to down-                            sub-unit matrices, the R-mode allows direct comparison of
weight highly abundant and prevalent species. Subsequently, the                        species relationships. The Q-mode, which used the transpose
dissimilarity matrices were computed using Sorensen distance                           of the proportions matrix as the input data, required more
for presence/absence data matrix and chi-square measure of                             detailed investigation to identify species groupings because
distance for the standardized CPUE sub-unit matrix prior to the                        clustering was by unit, not species. The species groupings that
application of cluster analyses. Other data standardizations and                       comprised each cluster were visually examined to determine
distance measures were implemented, but did not change the                             which characteristics (i.e., gear, subarea, month, season, and
results. The sub-unit CPUE input data matrices were assembled                          year) influenced the clustering. The proportions matrix (or
with the sub-units as rows and species as columns for the CCA.                         transpose thereof) already reduced the catch of species to
A chi-square transformation was applied on the data matrices                           comparable scales, thus, no standardization was necessary.
before implementing a CCA. External factors, such as depth,                            Chord distances were calculated to obtain the dissimilarity
latitude, longitude and substrate type, were included in the survey                    matrices for the proportions matrix prior to applying the cluster
catch analyses for each sub-unit.                                                      analyses. The Chord distance is a type of Euclidean distance
                                                                                       measure that can accommodate non-normalized data and is not
Proportion Matrix of Catch and Survey Data                                             sensitive to outliers (Shirkhorshidi et al., 2015). For the CCA, the
The second scale of aggregation was the aggregated ‘unit’ scale,                       proportions input matrix was assembled with the units as rows
which developed an input ‘proportions’ matrix. This proportions                        and species in the columns. A chi-square transformation was
matrix consolidated the individual sub-unit matrices into a                            applied before implementing a CCA. Gear and subarea for each
combined matrix. While in the ‘sub-unit’ matrices the columns                          unit in the proportions matrix was included as external factors.
represented the smallest sampling unit (i.e., haul, tow, or set),
the columns of the proportions matrix were defined as a ‘unit’,
which encompassed a temporal, spatial, and gear component.                             RESULTS
Here, each column was a unique combination of year, month,
subarea, and gear while rows were species. The gear indicates the                      Analyses of Life History Characteristics
gear types used in the commercial catch and fishery-independent                        The rockfish in the GOA have a wide range of life history
surveys, such that the gear categories are: NPT, PTR, LL, POT,                         values (Table 1). Results for Ward’s analysis and k-mediods on
and JIG for the fisheries gear and “trawl survey” and “longline                        the life history tables differed slightly, but provided the same
survey” for the NMFS surveys. The entries were the proportion                          general conclusion. The multivariate analyses on the life history
of tows that a species was present within that unit (i.e., the                         table supplemented with FishLife values are reported here; results
sum of tows with a species present divided by the total number                         based on the life history table with missing values and binned
of tows within the unit). The proportions matrix combined                              data are similar and reported in the Supplementary Material
data for all gear categories (i.e., commercial and survey gears)                       (Supplementary Figures 1, 2).
into a single matrix, which allowed the exploration of similarity                         Results from Ward’s analysis had weakly supported groupings
in the species catch composition among different gears and                             based on the bootstrap resampling for species with mid to lower
areas. The proportions matrix can also be useful to limit the                          values of length and ages associated with maturity, growth, and
impact of abundant and frequently caught species by reducing                           longevity (J values ranging from 0.63 to 0.69). The bootstrap
the difference between the number of null or zero catches                              resampling suggested patterns in the data for the grouping of

Frontiers in Marine Science | www.frontiersin.org                                  7                                            August 2021 | Volume 8 | Article 663375
Omori et al. Multivariate Approaches for Species Complexes
three or four clusters with similar J̄-values ranging from 0.63 (Supplementary Figure 4). This pattern is demonstrated in both
to 0.83, but the clusters lack stability. Only the low productive types of cluster analyses for all subareas of the GOA and all
species (i.e., tiger, blackgill, and yelloweye) remained in their gear types for both presence/absence and CPUE data matrices.
own grouping in both k = 3 or 4 clusters in Ward’s analysis However, these results should be interpreted with care, given the
with J values of 0.73 and 0.83, respectively. The NMDS plot with performance issues encountered. The ordination analyses (CCA)
results from Ward’s analysis represents three clusters, one with did not yield discernable groupings nor strong associations with
the low productivity group (i.e., high length and age values), the additional explanatory information (e.g., depth, longitude,
one with relatively higher productivity (i.e., lower length and age latitude, and substrate type; Supplementary Figure 5). Thus, the
values), and the third group with varying levels of productivity analyses using the sub-unit matrix were of limited insight for
(Figure 3A). When k = 4 clusters, two species, redbanded and grouping of species complexes.
bocaccio, separate into their own group; these two species have
low Amax and high Lmat and L∞ compared to the other species in
their cluster when k = 3. Proportions Matrix of Catch and Survey
Results from k-mediods split the rockfish into two clusters Data
based on the highest silhouette width of 0.30. The first cluster The exploratory runs with the proportions matrix indicated that
contained rockfish with life history values with high length and rare species should be excluded to provide better clustering
age values (i.e., low productivity). The second cluster consisted of performance. A total of 14 species remained in the unit
rockfish with medium to high productivity (Figure 3B). proportions matrix after rare species were excluded. The total
Comparing the results from the different clustering methods, number of species remained the same across analyses and modes.
the methods tended to group species by large or small lengths Aggregating the data into units (i.e., by year, month, subarea,
(L∞ and Lmat ) and younger or older maximum age (Amax ) and and gear) in the proportions matrix enabled the cluster analyses
age at maturity (Amat ), but most clusters were weakly supported. to find stronger relationships among the species using R-mode.
There were a few species that were placed in the same group Although the groupings from the k-mediods analysis using the
regularly. These species tend to fall on the ends of the rockfish unit aggregation led to similar results as using the sub-unit
productivity spectrum (i.e., all high or low values for age and matrix, Ward’s analyses tended to aggregate species by co-
length associated with maturity, growth, and longevity). For occurrence. The bootstrap resampling method indicated that
example, tiger, blackgill, and yelloweye rockfishes all have high k = 2 or 3 clusters were supported with J values ranging from
Lmat , Amat , L∞ , and Amax values (i.e., low productivity) and 0.69 to 0.84. For the two-cluster output, one stable cluster
were consistently clustered together for k-mediods and Ward’s (J̄ = 0.84) contained species that are only within the Other
analysis. There are other rockfish species that have opposing life Rockfish complex with the exception of rosethorn (Figure 4).
history characteristics. For example, splitnose has a high Amax , The other cluster aggregated species predominately found in the
but low L∞ , while bocaccio has low Amax and Amat and high Demersal Shelf Rockfish group (J̄ = 0.82). For the three-cluster
L∞ and Lmat . These species tended to waver between clusters output, the clustering data suggested that two species (i.e., canary
depending on the method and suggested number of clusters. and yellowtail could be weakly separated into their own group
Overall, larger, older rockfish tended to cluster together, but there (J̄ = 0.69), whereas these species are aggregated with the Demersal
is a wide variation and spread of life history values among and Shelf Rockfish cluster when k = 2 (Figure 4).
within the clusters resulting in no distinct support for clusters. The clustering and ordination analyses indicated that gear and
occasionally subarea influenced the groupings using Q-mode.
There did not appear to be any seasonal or temporal trends.
Sub-Unit Matrices of Catch and Survey Ward’s analysis performed poorly due to the common chaining
Data issue and there was no appropriate number of groupings found
Exploratory runs were performed with all methods applied to the based on the bootstrapping. Conversely, the k-mediods method
catch and survey data to determine whether results were robust to provided discernable groupings. The optimal number of clusters
the inclusion of rare species (i.e., species comprising less than 1% (k) for k-mediods was 5 based on the average silhouette width of
of total catch). Due to poor performance (i.e., lack of clustering 0.32. However, the optimal number of clusters based on where
and chaining in Ward’s analyses) in exploratory runs when rare the average silhouette width first reaches its asymptote was k = 2
species were included, it was determined that these species should at a silhouette width value of 0.29 (Figure 5). Thus, results from
be removed from further analyses of the catch and survey data. the k = 2 and k = 5 clusters are presented.
Species removal varied considerably for sub-unit analyses (see Results from k-mediods with k = 2 clusters yielded clearly
Supplementary Material 1 and Supplementary Figure 3 for defined groups differentiated primarily by gear type (Figure 6A).
species composition and sparseness across gears and subareas). The first cluster contained trawling gears (i.e., NPT, PTR, and
When each gear and area were analyzed separately using the the trawl survey), as well as the pot gear (POT). The second
sub-unit matrix, some analyses demonstrated poor performance cluster consisted of longline gear types (i.e., LL, JIG, and the
(e.g., high prevalence of chaining or lack of clustering). longline survey). Differences in subareas could also be discerned
Generally, results demonstrated that the more abundant and (Figure 6B); the first cluster mostly contained subareas 610,
more frequently caught species tended to group together, while 620, and 630, whereas cluster 2 comprised all subareas. The
the less abundant species also commonly clustered together division of subareas can be attributed to specific fishing gear in
Frontiers in Marine Science | www.frontiersin.org 8 August 2021 | Volume 8 | Article 663375Omori et al. Multivariate Approaches for Species Complexes
FIGURE 3 | NMDS plot of species’ clusters identified from life history values estimated from FishLife for missing values from (A) Ward’s hierarchical cluster analysis
and (B) k-mediods. In Ward’s analysis three or four clusters were supported by the bootstrapping resampling method; results with four clusters separated
redbanded and bocaccio into their own cluster.
FIGURE 5 | Average silhouette width from Q-mode k-mediods cluster analysis
using the proportions matrix with “units” (year-month-subarea-gear). The
suggested optimal number of clusters is k = 5 (black dashed line), but the
average silhouette width plateaus at k = 2 (gray dashed line).
FIGURE 4 | Results from Ward’s hierarchical cluster analysis using the
proportions matrix with “units” (year-month-subarea-gear) in R-mode where 2
(black lines) or 3 (gray lines) clusters are supported by the bootstrap
resampling method. The “*” indicates species that currently belong to the quillback and canary) had a higher proportion of presence in the
Demersal Shelf Rockfish complex. cluster associated with the longline gear (cluster 2; Figure 6C).
In comparison, most of the species that only belong to the
Other Rockfish complex (i.e., widow, sharpchin, redstripe and
certain subareas (Supplementary Figure 3). For example, NPT harlequin) were present in higher proportion in the cluster that
and PTR gear types do not fish in subarea 650, whereas JIG gear contained mostly all trawl gear and subareas 610, 620 and 630
is primarily used in subareas 630 and 650. (cluster 1; Figure 6C). For comparison, northern rockfish are
The majority of the species belonging to the Demersal caught in almost 100% of the units in cluster 1 (Figure 6C),
Shelf Rockfish complex (i.e., China, yelloweye, tiger, rosethorn, which is as expected because the northern rockfish is a target
Frontiers in Marine Science | www.frontiersin.org 9 August 2021 | Volume 8 | Article 663375Omori et al. Multivariate Approaches for Species Complexes FIGURE 6 | Results from Q-mode k-mediods using the proportions matrix with “units” (year-month-subarea-gear) to synthesize all gear types (fishing gear: jig [JIG], longline hook and line [LL], non-pelagic trawl [NPT], pot [POT], and pelagic trawl [PTR]; and surveys: longline and trawl) and subareas into one dataset when k = 2 clusters. In (A) the number of units where each gear type was present in each cluster is shown. In (B) the number of units where each subarea were present in each cluster is illustrated. In (C) the proportion of units (year-month-subarea-gear) that a species is present out of the total number of units assigned to each cluster is provided to represent the species composition in each suggested cluster when k = 2. Species that currently belong to the Demersal Shelf Rockfish complex are indicated by “*”. species, assessed separately, and caught solely by trawl gears in the total units in cluster 1 (affiliated with trawl gear; Figure 6C), subareas 610, 620, and 630. The northern rockfish results suggest whereas these two species were in 56% and 68% of the units in that the clustering is accurately reflecting the data. There were cluster 2 (affiliated with longline gear; Figure 6C). Additionally, some species that did not follow this pattern. Two species (i.e., yellowtail was present more frequently in the units in the cluster silvergray and redbanded) that were commonly found in all gear associated with longline gear (cluster 2; Figure 6C) than the types (Supplementary Figure 3), but belong only to the Other cluster associated with trawl gear (cluster 1; Figure 6C), despite Rockfish complex, were found in 41% and 46%, respectively, of the species only being assigned to the Other Rockfish complex. Frontiers in Marine Science | www.frontiersin.org 10 August 2021 | Volume 8 | Article 663375
Omori et al.                                                                                            Multivariate Approaches for Species Complexes

    Although the results when k = 5 clusters generated more                 on both life history and catch or survey data. Although each
mixed groupings compared to k = 2, there was some separation                multivariate approach has associated pros and cons, utilizing
among gear types (Figure 7A). The major fishery gears (i.e.,                multiple methods can help identify consistent trends across data
NPT, JIG, and LL) each separated into their own clusters with               and statistical approaches. The use of multiple data types and
some overlap between LL and JIG gear (i.e., clusters 3, 4, and              methods for identifying species complexes should be considered
5, respectively, in Figure 7A). Cluster 1 consisted of a mix                best practice for the management of data-limited fisheries.
of all trawl gear (fishery and survey), while cluster 2 included            Our results demonstrate that reliance on single methods or a
mostly all longline survey and LL units (Figure 7A). The                    single type of data may provide limited interpretations that
separation of subareas in the clusters followed a similar pattern           may lead to suboptimal species groupings and, ultimately, poor
to the k = 2 cluster results. Most clusters contained a mix of              management performance.
subareas (Figure 7B); however, some gear types do not fish in                  Specific to our case study, our analyses indicate that an
specific subareas.                                                          alteration in the complexes for management of these species
    There were several species that were abundant in most clusters          may be warranted. We suggest that the Demersal Shelf Rockfish
and some species that were specific to a few clusters when k = 5            species should be separated from the remainder of the Other
(Figure 7C). For example, yelloweye was present in 75% or                   Rockfish complex in all subareas in the GOA for assessment
more of the units in all but cluster 1 (Figure 7C). In contrast,            purposes. The remaining bycatch rockfish from this study can
harlequin was generally associated only with trawling gear types            be grouped together as one complex. There were no clear
and subareas 610, 620 and 630 (i.e., clusters 1 and 3; Figure 7C).          divisions of species based on the life history characteristics
Similar to the species composition when k = 2 clusters, many                due to the uncertainty and diversity in values, and unstable
of the Demersal Shelf Rockfish species were found in higher                 clustering among methods. The application of multiple methods
proportion in clusters associated with longline gear (LL, JIG, and          (clustering and ordination techniques, R- and Q-mode, and
longline survey in clusters 2, 4, and 5 covering all subareas; e.g.,        data structure) and examination of the catch and survey data
quillback). Yellowtail was found in higher proportion in clusters           provided a basis to develop possible complexes. Some methods
with JIG and LL (i.e., clusters 4; Figure 7C) and in low presence           were unsuccessful (e.g., sub-unit analyses), while others delivered
(i.e., < 10%) in clusters linked with longline survey and all trawl         sensible groupings (k-mediods in Q-mode for proportions
gear (Figure 7C).                                                           matrix). The rockfish groupings separated mainly by gear in our
    Although CCA results from the proportions matrix did                    analyses, which suggested that the assessment models providing
not reveal any species aggregations in ordination space, the                management advice for these complexes should incorporate the
results did reveal general groupings primarily by gear (Figure 8)           associated survey gear.
and secondarily by subarea (Supplementary Figure 6). The
groupings indicated that there were underlying differences in the
species composition by gear and subarea. The other variables                GOA Bycatch Rockfish Results and
(i.e., year, month, and temporal factors) did not influence the             Study Limitations
groupings and were excluded from further CCA analyses. About                Wide ranges in productivity and resilience of species’ populations
a third (36%) of the variation could be explained by the gear               are not uncommon when applying methods to identify species
and subarea variables, which suggested that these variables were            complexes (DeMartini, 2019). The life history cluster analysis
correlated with the species composition. The first axis, CCA1,              results indicated that rockfish in the GOA tended to group by
represented a strong gradient and explained ∼40% of the CCA                 higher (i.e., earlier age and smaller size at maturation) and lower
variation. The second axis, CCA2, explained ∼25% of the CCA                 (i.e., older age and larger size at maturation) productivity levels,
variation (Supplementary Table 1). Based on CCA1 and CCA2,                  but generally demonstrated a wide range in life history values.
the longline survey, LL and JIG all separated (Figure 8). The               A few rockfish species had conflicting levels of productivity with
various trawl gear units (NPT, PTR and trawl survey) appeared               different life history characteristics (e.g., long-lived with early
to be mixed in ordination space along the CCA axes. The                     age-at-maturity), which made it challenging to define a species
POT fisheries gear overlapped with both the trawl gears and                 with high or low productivity compared to other rockfish. The
LL (Figure 8). A few species are moderately associated to                   uncertainty in the life history values limits interpretation of the
specific gears according to the CCA results, such as yellowtail,            results. One source of uncertainty is that life history values were
canary and China rockfish to JIG, longline survey, and LL.                  borrowed from outside of the GOA when data were not available
Axis CCA1 separated subarea 650 from the other subareas                     and research suggests that there can be regional differences in
(Figure 8). However, all the other subareas were not affiliated             values (Boehlert and Kappenman, 1980; Gertseva et al., 2010;
with the CCA axes, indicating that gear types contributed to most           Keller et al., 2012). Additionally, studies for a given species often
of the variation.                                                           showed variability, making it difficult to place a species into
                                                                            high or low productivity groupings. Given the uncertainties in
                                                                            the data, the results did not yield definitive groups and were
DISCUSSION                                                                  deemed less reliable than the outputs of the cluster analysis using
                                                                            catch and survey data. Yet, based on PSA results, GOA rockfish,
Our analyses demonstrate the importance of exploring a variety              as a genus, fall in the lower productivity spectrum (Ormseth
of quantitative methods for determining species complexes based             and Spencer, 2011). Rockfish results from Ormseth and Spencer

Frontiers in Marine Science | www.frontiersin.org                      11                                      August 2021 | Volume 8 | Article 663375
Omori et al. Multivariate Approaches for Species Complexes
FIGURE 7 | Results from Q-mode k-mediods using the proportions matrix with “units” (year-month-subarea-gear) to synthesize all gear types (fishing gear: jig [JIG],
longline hook and line [LL], non-pelagic trawl [NPT], pot [POT], and pelagic trawl [PTR]; and surveys: longline and trawl) and subareas into one dataset when k = 5
clusters. In (A) the number of units where each gear type was present in each cluster is shown. In (B) the number of units where each subarea were present in each
cluster is illustrated. In (C) the proportion of units (year-month-subarea-gear) that a species is present out of the total number of units assigned to each cluster is
provided to represent the species composition in each suggested cluster when k = 5. Species that currently belong to the Demersal Shelf Rockfish complex are
indicated by “*”.
(2011) concur with the United States West Coast groundfish PSA challenge is the placement of rare or ubiquitous species into a
results (Cope et al., 2011) that included more rockfish species. species group using cluster analyses. We had a range of 3 to 13
Given that rockfish are generally less productive compared to the species included in the sub-unit cluster analyses depending on
other species in the GOA, they tend to be more vulnerable to the gear type and subarea due to the exclusion of rare species
fishing pressure. (species with < 1% of total catch). There were 11 of the 25 species
Each rockfish species faces different susceptibility to the widely that made up < 1% of the units (year-month-subarea-gear)
varying fisheries that operate in the GOA, but one particular with positive catch for the proportions matrix. The multivariate
Frontiers in Marine Science | www.frontiersin.org 12 August 2021 | Volume 8 | Article 663375Omori et al. Multivariate Approaches for Species Complexes
biologically informed clusters (e.g., balancing too few or too
many clusters that may result in a narrow or wide range of
species productivity), while balancing the practical management
of species that are exploited across varying gear types and
subarea. Using the k-mediods analysis, either two or five clusters
were recommended. The suggested k = 5 clusters identified
specific relationships among different gear types and occasionally
subareas. Some species appeared to be associated with only
a specific cluster (or clusters), whereas other species were
commonly found in all clusters. The rockfish that occur in
medium to high frequency in all or most of the clusters
are species that are found ubiquitously in the GOA and are
caught by most gear types. The results with k = 2 clusters
indicated that the species composition caught by longline
gear types clearly separated from trawling gear types. Overall,
the analysis of the catch and survey data indicated that
gear was the biggest contributing factor in grouping similar
units of rockfish species composition. NMFS management
subarea could have influenced the cluster results, as there was
a strong interaction between fishery gear and subarea (i.e.,
certain gears only operate in specific subarea). These analyses
suggest that rockfish species that are only predominately caught
by a specific gear could be assigned to a rockfish complex
that commonly associates with that gear for assessment and
management purposes.
These analyses, particularly the proportions matrix analyses,
FIGURE 8 | CCA results using the proportions matrix with units
(year-month-subarea-gear) plotted on the first two CCA axes. Gear type is
provided a way to examine the species composition from the
color coded, species are marked in blue text (with species currently assigned fishery catch with the survey data. Our results indicated that
to the Demersal Shelf Rockfish marked with “*”) and factors (i.e., gear and the trawl survey and trawl fisheries gear tended to be grouped
subarea) provided in black bold text. Gear types include fishing gear (jig [JIG], together more frequently than the longline gear types (i.e., the
longline hook and line [LL], non-pelagic trawl [NPT], pot [POT], and pelagic
longline survey, LL, and JIG). Williams and Ralston. (2002)
trawl [PTR]) and surveys (longline and trawl surveys).
found that the bottom trawl survey reflects the trawl fishery
sector well off the coast of California and Oregon, United States,
which includes non-pelagic and pelagic trawl, because it catches
methods in this study were unable to provide species association species that are typically found at the bottom (e.g., Keller,
or coexistence relationships for these rare species. Likewise, 2008) or distributed in the water column (e.g., widow rockfish,
species that are captured across many gear types and areas are Wilkins, 1986). In contrast, the longline survey is a fixed station
difficult to assign to groups. The clustering results did not indicate survey that targets primarily commercially important sablefish
specific species associations for these abundant rockfish. (Malecha et al., 2019). The longline survey did not always
Most of the clustering analyses also failed to provide consistent catch species typically caught in the longline fishery gear types
or reliable results when applied to each gear and subarea dataset (Supplementary Figure 3). Of the top five Other Rockfish
separately through application to the sub-unit matrix. When the species caught in the longline survey by numbers, only three are
various methods were applied to the sub-unit matrices there were designated in the Demersal Shelf Rockfish complex. This result
no clearly delineated relationships of commonly caught species suggests that the longline survey alone is not representative of the
or rarer species. We had anticipated that the finer-scale approach populations within the complex or caught by the longline gear
might provide insight into the co-occurrence among species. fisheries. If the Demersal Shelf Rockfish complex is extended to
However, the lack of identified co-occurrence relationships (i.e., all subareas of the GOA, other data resources will be needed to
similarities among species) with the sub-unit matrices was likely assess this assemblage. For example, the Demersal Shelf Rockfish
because the R-mode groups by similar catch in each unit or assessment utilizes submersibles to estimate abundance trends
sub-unit. As a result, the more abundant and more frequently to set quotas in NMFS subarea 650 (Olson et al., 2018). Studies
caught species are commonly grouped. Thus, the differences in have identified that commercial catch data do not necessarily
magnitude and frequency of the catch mask the less obvious reflect the species composition in the survey data (i.e., species
relationships among species. composition in the ecosystem; Lee and Sampson, 2000; Pennino
Aggregating all the datasets into a single data matrix et al., 2016), but surveys should include a broader diversity of
enabled gears, subareas, and temporal components to be species than that found in the commercial catch. Given the
compared, while major categories that influenced the groupings diversity of gear types utilized in the GOA, as well as specific gears
could be identified. The challenge is determining logical and fishing in habitat-specific areas (e.g., Rooper and Martin, 2012)
Frontiers in Marine Science | www.frontiersin.org 13 August 2021 | Volume 8 | Article 663375You can also read