Navajo Nation Region - First Things First
←
→
Page content transcription
If your browser does not render page correctly, please read the page content below
2016            NEEDS AND ASSETS REPORT

 Navajo Nation Region
Navajo Nation Regional Partnership Council

                                  2016

                Needs and Assets Report

                          Prepared by
    Community Research, Evaluation & Development (CRED)
The Frances McClelland Institute for Children, Youth, and Families
  John & Doris Norton School of Family and Consumer Sciences
            College of Agricultural and Life Sciences
                   The University of Arizona

                            Funded by
  First Things First Navajo Nation Regional Partnership Council

        Frances McClelland Institute for Children, Youth and Families
        John & Doris Norton School of Family and Consumer Sciences
                  College of Agricultural and Life Sciences
                         The University of Arizona
                               PO Box 210078
                          Tucson, AZ 85721-0462
                          Phone: (520) 621-8739
                            Fax: (520) 621-4979
                         http://ag.arizona.edu/fcs/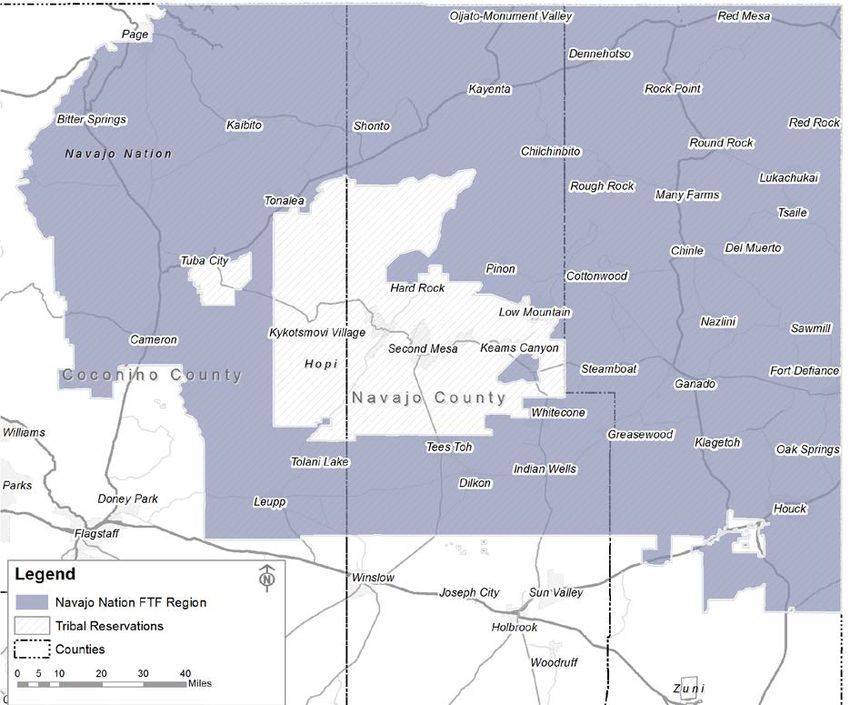
Navajo Nation Regional Partnership Council
48 West Highway 264, Suite 207, Quality Inn Office Complex, Post Office Box 2449, Window Rock, Arizona
86515
928.810.4306 | 877.803.7234 | azftf.gov

Chair
Dawn Yazzie                 Letter from the Chair
Vice Chair                  The past two years have been rewarding for the First Things First Navajo
Rhonda Etsitty              Nation Regional Partnership Council, as we delivered on our mission to
                            build better futures for young children and their families. During the past
Members
Benjamin Barney
                            year, we have touched many lives of young children and their families.
Victoria Begay              The First Things First Navajo Nation Regional Partnership Council will
Patricia Gonnie             continue to advocate and provide opportunities as indicated throughout
Valonia Hardy
                            this report.
Quincy Natay
Paula Seanez                Our strategic direction has been guided by the Needs and Assets reports,
Cotillion Sneddy            specifically created for the Navajo Nation Region in 2012, 2014 and the
                            new 2016 report. The Needs and Assets reports are vital to our continued
Regional Director
                            work in building a true integrated early childhood system for our young
Memarie Tsosie
                            children and our overall future. The Navajo Nation Regional Council
                            would like to thank our Needs and Assets vendor University of Arizona
                            Norton School of Family & Consumer Sciences for their knowledge,
                            expertise and analysis of the Navajo Nation region. The new report will
                            help guide our decisions as we move forward for young children and their
                            families within the Navajo Nation region.
                            Going forward, the First Things First Navajo Nation Regional Partnership
                            Council is committed to meeting the needs of young children by providing
                            essential services and advocating for social change.
                            Thanks to our dedicated staff, volunteers and community partners, First
                            Things First is making a real difference in the lives of our youngest
                            citizens and throughout the entire State.
                            Thank you for your continued support.

                            Sincerely,

                            Dawn Yazzie, Chair

                                                i
NAVAJO NATION Regional Partnership Council
48 W. Hwy. 264, Ste. 207,
Window Rock, AZ 86515
Phone: 928.810.4306
Fax: 928.810.4308
Dawn Yazzie, Chair
Rhonda Etsitty, Vice Chair
Benjamin Barney
Victoria Begay
Patricia Gonnie
Valonia Hardy
Quincy Natay
Paula Seanez
Cotillion Sneddy
Vacant
Vacant
Report Prepared by:
Frances McClelland Institute for Children, Youth and Families
John & Doris Norton School of Family and Consumer Sciences
College of Agriculture and Life Sciences
The University of Arizona
ii2016 Needs & Assets Report Navajo Nation Regional Partnership Council
Introductory Summary and Acknowledgments
Ninety percent of a child’s brain develops before kindergarten and the quality of a child’s
early experiences impact whether their brain will develop in positive ways that promote
learning. Understanding the critical l role the early years play in a child’s future success is
crucial to our ability to foster each child’s optimal development and, in turn, impact all
aspects of wellbeing of our communities and our state.
This Needs and Assets Report for the Navajo Nation Region helps us in understanding the
needs of young children, the resources available to meet those needs and gaps that may
exist in those resources. An overview of this information is provided in the Executive
Summary and documented in further detail in the full report.
The First Things First Navajo Nation Regional Partnership Council recognizes the
importance of investing in young children and ensuring that families and caregivers have
options when it comes to supporting the healthy development of young children in their
care. This report provides information that will aid the Council’s funding decisions, as well
as our work with community partners on building a comprehensive early childhood system
that best meets the needs of young children in our community.
It is our sincere hope that this information will help guide community conversations about
how we can best support school readiness for all children in the Navajo Nation region. This
information may also be useful to stakeholders in our area as they work to enhance the
resources available to young children and their families and as they make decisions about
how best to support children birth to 5 years old in our area.
Acknowledgments:
We want to thank the Arizona Department of Economic Security and the Arizona Child Care
Resource and Referral, the Arizona Department of Health Services, the Arizona Department
of Education, the Census Bureau, the Arizona Department of Administration- Employment
and Population Statistics, and the Arizona Health Care Cost Containment System for their
contributions of data for this report, and their ongoing support and partnership with First
Things First on behalf of young children.
To the current and past members of the Navajo Nation Regional Partnership Council, your
vision, dedication, and passion have been instrumental in improving outcomes for young
children and families within the region. Our current efforts will build upon those successes
with the ultimate goal of building a comprehensive early childhood system for the
betterment of young children within the region and the entire state.
iii2016 Needs & Assets Report Navajo Nation Regional Partnership Council
Table of Contents
Letter from the Chair ....................................................................................................................... i
List of Tables ............................................................................................................................... 3
List of Figures .............................................................................................................................. 4
Executive Summary......................................................................................................................... 5
The Navajo Nation Region ............................................................................................................ 12
Regional Description ................................................................................................................. 12
Data Sources ............................................................................................................................. 13
Population Characteristics ............................................................................................................ 17
Why it Matters .......................................................................................................................... 17
What the Data Tell Us ............................................................................................................... 18
Population and Households ...................................................................................................... 19
Living Arrangements for Young Children .................................................................................. 20
Race, Ethnicity, and Language .................................................................................................. 22
Economic Circumstances .............................................................................................................. 24
Why it Matters .......................................................................................................................... 24
What the Data Tell Us ............................................................................................................... 26
Poverty and Income .................................................................................................................. 27
Employment and Housing ......................................................................................................... 29
Economic Supports ................................................................................................................... 30
Educational Indicators .................................................................................................................. 32
Why it Matters .......................................................................................................................... 32
What the Data Tell Us ............................................................................................................... 33
Educational Attainment of the Adult Population ..................................................................... 34
Third-grade Test Scores ............................................................................................................ 35
Early Learning................................................................................................................................ 37
Why it Matters .......................................................................................................................... 37
What the Data Tell Us ............................................................................................................... 38
Early Care and Education .......................................................................................................... 41
Families with Children Who Have Special Needs ..................................................................... 43
Child Health ................................................................................................................................... 45
Why it Matters .......................................................................................................................... 45
What the Data Tell Us ............................................................................................................... 46
Mothers Giving Birth ................................................................................................................. 48
Infant Health ............................................................................................................................. 49
Health Insurance ....................................................................................................................... 50
Immunizations .......................................................................................................................... 50
Family Support and Literacy ......................................................................................................... 52
Why it Matters .......................................................................................................................... 52
What the Data Tell Us ............................................................................................................... 53
Communication, Public Information and Awareness, and Systems Coordination among Early
Childhood Programs and Services ................................................................................................ 54
22016 Needs & Assets Report Navajo Nation Regional Partnership Council
Why it Matters .......................................................................................................................... 54
What the Data Tell Us ............................................................................................................... 54
Appendix 1: Map of zip codes of the Navajo Nation Region ........................................................ 55
Appendix 2: Zip codes of the Navajo Nation Region .................................................................... 56
Appendix 3: Map of Elementary and Unified School Districts in the Navajo Nation Region ....... 58
Appendix 4: Data Sources ............................................................................................................. 59
List of Tables
Table 1.Population and households, 2010 ................................................................................... 19
Table 2. Population of children by single year-of-age, 2010 ....................................................... 19
Table 3. State population projections, 2015 & 2020 ................................................................... 20
Table 4. Children (ages 0-5) living in the household of a grandparent, 2010 ............................. 21
Table 5. Grandparents responsible for grandchildren (ages 0-17) living with them, 2009-2013
five-year estimate ......................................................................................................................... 22
Table 6. Race and ethnicity of the population of young children (ages 0-4), 2010 ..................... 22
Table 7. Race and ethnicity of the adult population (ages 18 and older), 2010 ......................... 22
Table 8. Household use of languages other than English, 2009-2013 five-year estimate .......... 23
Table 9. Federal poverty levels for families with young children (ages 0-4), 2009-2013 five-year
estimate ........................................................................................................................................ 28
Table 10. Parents of young children (ages 0-5) who are or are not in the labor force, 2009-2013
five-year estimate ......................................................................................................................... 29
Table 11. Vacant and occupied housing units, 2009-2013 five-year estimate ............................ 30
Table 12. Occupied housing units and costs relative to income, 2009-2013 five-year estimate 30
Table 13. Children (ages 0-5) receiving Temporary Assistance to Needy Families (TANF) ......... 30
Table 14. Children (ages 0-5) in the Supplemental Nutrition Assistance Program (SNAP) ......... 31
Table 15. Students eligible for free or reduced-price lunch, 2012-2014...................................... 31
Table 16. Results of the 2014 third-grade AIMS Math test .......................................................... 35
Table 17.Results of the 2014 third-grade AIMS Reading test....................................................... 36
Table 18. Head Start and Early Head Start centers and home-based programs, 2013-2014...... 41
Table 19. Enrollment in FACE programs on the Navajo Nation Region, 2013 ............................. 42
Table 20. Cost of full time child care in a child care center by percent of median family income
....................................................................................................................................................... 42
Table 21. Estimated number of children (ages 3 and 4) enrolled in nursery school, preschool, or
kindergarten, 2009-2013 five-year estimate ................................................................................ 43
Table 22. Growing in Beauty services in the Navajo Nation Region ............................................ 43
Table 23. Division of Developmental Disabilities (DDD) services to children (ages 0-2), 2013-
2014 .............................................................................................................................................. 43
Table 24. Division of Developmental Disabilities (DDD) services to children (ages 3-5), 2013-
2014 .............................................................................................................................................. 44
Table 25. Selected characteristics of mothers giving birth, 2013 ................................................ 48
Table 26. Selected characteristics of babies born, 2013 ............................................................. 49
Table 27. Immunizations for children in child care, school year 2014-15* ................................. 50
Table 28. Immunizations for children in kindergarten, school year 2014-15*............................ 51
32016 Needs & Assets Report Navajo Nation Regional Partnership Council
List of Figures
Figure 1. The Navajo Nation Region ............................................................................................. 13
Figure 2.Living arrangements for children (ages 0-5), 2009-2013 five-year estimate ................. 20
Figure 3.Heads of households in which young children (ages 0-5) live, 2010 .............................. 21
Figure 4. Language spoken at home, by persons ages 5 and older, 2009-2013 five-year estimate
....................................................................................................................................................... 23
Figure 5. Percent of population in poverty, 2009-2013 five-year estimate ................................ 27
Figure 6. Median annual family incomes, 2009-2013 five-year estimate ................................... 28
Figure 7. Average annual unemployment rates, 2009 to 2013 ................................................... 30
Figure 8. Level of education for the population ages 25 and older, 2009-2013 five-year estimate
....................................................................................................................................................... 34
Figure 9. Healthy People 2020 objective for mothers, compared to 2013 region and state data
....................................................................................................................................................... 48
Figure 10. Healthy People 2020 objectives for babies, compared to 2013 region and state data
....................................................................................................................................................... 49
Figure 11. Estimated percent of population without health insurance, 2009-2013 five-year
estimate ........................................................................................................................................ 50
42016 Needs & Assets Report Navajo Nation Regional Partnership Council
Executive Summary
Regional Description
The First Things First Navajo Nation Region is defined as the Arizona portion of the Navajo
Nation Reservation. The region covers nearly 16,000 square miles in the northeast corner of
the state, stretching across Apache, Navajo, and Coconino counties. The entire reservation,
which dates to the Navajo Treaty of 1868, includes lands in Utah and New Mexico, and is
divided into 110 chapters.
Data Sources
The information contained in this report comes from a variety of sources. Much of the data
was provided to First Things First by other state agencies: the Arizona Department of Economic
Security (DES), the Arizona Department of Education (ADE), and the Arizona Department of
Health Services (ADHS). Other data were obtained from publically available sources, including
the 2010 U.S. Census, the American Community Survey (ACS), and the Arizona Department of
Administration (ADOA).
Where available, tables and figures in this report include data for all Arizona reservations
combined in addition to data for the state of Arizona to allow for appropriate comparisons
between the region and other relevant geographies.
Population Characteristics
According to the U.S. Census the Navajo Nation Region had a population of 101,835 in 2010, of
whom 10,894 (11%) were children ages birth to 5 years. Twenty-four percent of households in
the region included a young child.
Nearly 40 percent of the households with young children (birth to 5) in the region (38%) are
single-female households. The proportion of young children living in a grandparent’s
household in the region (40%) is substantially higher than the percentage statewide (14%), but
the same as the percentage in all Arizona reservations combined (40%). For those children
living in a grandparent’s household, 57 percent live with a grandparent who is financially
responsible for them, and 13 percent of the children have no parent present in the home.
The vast majority (95%) of young children (ages 0-4) in the Navajo Nation Region are American
Indian. This proportion is similar to that of all Arizona reservations combined (92%), but differs
greatly from the statewide rate of six percent. The percentage of young children who are
Hispanic or Latino in the Navajo Nation is four percent, compared to nine percent in Arizona
reservations overall and 45 percent in the state as a whole. The race and ethnicity breakdown
among adults in the region is similar to that of young children, with most residents identifying
as American Indian (95%), and a somewhat smaller proportion of adults than children
identifying as Hispanic (1% versus 4%). In the state, however, only four percent of adults
identified as American Indian, and twenty-five percent as Hispanic or Latino. The ethnic
composition in the Navajo Nation is also reflected in a higher proportion of households that
report speaking a Native North American language (68%) compared to households statewide
52016 Needs & Assets Report Navajo Nation Regional Partnership Council
(2%). This proportion is substantially higher in the region compared to the rate in All Arizona
reservations combined (51%). According to the Navajo Nation Department of Dine Education’s
Office of Standards, Curriculum and Assessments Development “the Navajo Language is an
essential element of the life, culture, and identity of the Navajo people” and recognizes the
importance of preserving the language to ensure the survival of the Nation.
Economic Circumstances
The percentage of the total population living in poverty in the Navajo Nation Region (41%) is
similar to that across all Arizona reservations (42%), but substantially higher than the statewide
percentage (18%). In all these geographies, young children are consistently more likely to be in
poverty than members of the total population. Just over half (53%) of the children in the region
live in poverty, a slightly lower proportion than that in all Arizona reservations combined (56%)
but again higher than the state (28%). In addition to the families whose incomes fall below the
federal poverty level, a substantial proportion of households in the region, and across all
Arizona reservations are low income (i.e., near but not below the federal poverty level [FPL]).
Nearly three quarters (74%) of families with children aged four and under are living below 185
percent of the FPL in the region (i.e., earned less than $3,677 a month for a family of four),
compared to 77 percent in all Arizona reservations combined, and 48 percent across the state.
The median family income in the region ($31,443) is about the same as the median family
income across all Arizona reservations ($31,140).
The average unemployment rate in the region for the 2009-2013 period is 24.4 percent, higher
that the estimated 25 percent across all Arizona reservations combined and the average state
rate of 10.4 percent.
In January 2013, about 10 percent of children birth to seventeen in the region received
Temporary Assistance for Needy Families (TANF) benefits, which was about half the rate of
those receiving benefits in January 2011. The majority of young children in the region (79%)
receive Supplemental Nutrition Assistance Program (SNAP) benefits, compared to half of young
children statewide (51%). Eight Arizona Department of Education school districts in the Navajo
Nation Region have 90 percent or more of their population of students living within the region.
With the exception of the Tuba City Unified School District, where about half (54%) of students
are eligible for Free or Reduced Lunch, about 80 to 90 percent of the students in the districts
are eligible for lunch subsidies. The proportion of young children in the region receiving SNAP
benefits between 2012 and 2014 fell at a rate (9%) similar to the state (7%), but the proportion
eligible for free and reduced lunch has largely remained stable.
Educational Indicators
Children from the region attend schools in a number of Arizona Department of Education (ADE)
districts, and Bureau of Indian Education schools. Data are provided for the eight ADE districts
with at least 90 percent of the district within tribal lands. Students are considered to “pass”
Arizona’s Instrument to Measure Standards (AIMS) if they meet or exceed the standard. There
is wide variability in the math and reading passing rates for school districts in the Navajo Nation
62016 Needs & Assets Report Navajo Nation Regional Partnership Council
Region, with Tuba City having the highest passing rates and Chinle having the lowest passing
rates.
Early Learning
Child care and early education options to families in the Navajo Nation Region include: informal
care through family and friends, licensed and unlicensed child care through private non-profit
or for profit organizations, public preschool primarily for children with disabilities, the Bureau
of Indian Education (BIE) FACE program, child care through Child Care and Development Fund
program, and Head Start.
Center and home-based care
In the Navajo Nation Region, the Child Care and Development Fund system is one of the largest
providers of care for children ages 0-5. The Navajo Nation Division of Social Services Child Care
and Development Fund (CCDF) Program aims to “increase the availability and quality of child
care services for income eligible parents who are working, attending job training or an
educational program and/or for children who have special needs or are under protective
custody.” Over the course of the past two years, the Navajo Nation Division of Social Services
has worked closely with the Arizona Department of Economic Security to enhance child care
and achieve its mission.
In FY 2014 the Navajo Nation total CCDF funding was $8,636,524. The program served a total of
1,099 children ages 0 to 13 at either home-based or center-based settings. Of those, 720 (66%)
were children under the age of six.
In 2014, there were 20 child care centers under the CCDF Program across the entire Navajo
Nation, up from nine in 2011. Thirteen of those centers were located in the Arizona portion of
the Nation: four in the Fort Defiance Region (Little Miss Muffet, Fort Defiance Child Care
Center, Karigan Child Care Center and Leupp) and nine in the Chinle Region (Nooselti, Tsaile,
Many Farms, Cottonwood, Pinon, Rough Rock, Rock Point, Kiidoobaah I and II). Typical working
hours of these centers are 7:30 am to 5:30 pm, although the schedule may vary by location,
with some centers opening earlier.
Also in 2014, there were 127 home-based child care providers in the entire Navajo Nation. Of
those, 64 are located in Arizona and 63 in New Mexico. In addition, children also received care
at 10 non-CCDF child care centers in Arizona and five non-CCDF centers in New Mexico. These
providers cared for a total of 413 children in the Arizona portion of the Navajo Nation: 105 in
Fort Defiance, 33 in Chinle, 138 in Tuba City and 137 in Greasewood. As of February of 2015,
there were 150 children on the waiting list for CCDF slots. The CCDF Program has set up goals
and objectives around early literacy, nutrition and physical activities in their child care centers.
The program also emphasizes professional development for their staff.
Navajo Nation Early Head Start and Head Start Program
Head Start is an early education program that promotes school readiness by enhancing the
social and cognitive development of children through the provision of educational, health,
nutritional, social and other services to enrolled children and families. Early Head Start is a
72016 Needs & Assets Report Navajo Nation Regional Partnership Council
similar program targeted at families with children aged 0 to 3. The goal of the program is to aid
young mothers in being better teachers and caregivers for their children, and to enhance the
development of participating children. Until school year 2013-2014, the Early Head Start
Program provided both home-based and center-based care. In that year, there were 42
children enrolled in the program, 18 in the center-based option, and 16 in home-based services.
Starting in school year 2014-2015, only center-based services are being provided.
The Navajo Head Start is the largest tribal Head Start program in the United States. It is the
only educational program completely run by the Navajo Nation and is one of the largest
employers across the Nation. A major focus of the Navajo Head Start is Navajo Language
Recovery. The program assists predominantly English speaking Navajo children in learning
Navajo language, culture, history and traditions through a professionally developed home-
based curriculum that is aligned with the Diné Content Standards, established by the
Department of Diné Education.
In 2013-2014, the Navajo Head Start Program funded enrollment was 2,063 children. This
included 1,739 children in the center-based setting (four days per week) and 324 children in the
home-based option. A total of 66 Head Start centers were offering services in the 2013-2014
schools year.
FACE Program
Family and Child Education (FACE) is an early childhood and parental involvement program for
American Indian families in schools sponsored by the Office of Indian Education Programs,
Bureau of Indian Affairs. The goals of the FACE program include increasing family literacy;
strengthening family-school-community connections; promoting the early identification and
provision of services to children with special needs; and promoting the preservation of the
unique cultural and linguistic diversity of the communities served by the program. FACE
services and activities are currently taking place in 46 Bureau of Indian Education schools, 12 of
which are located in the state of Arizona.
FACE has both a center-based and a home-based component. The home-based component
includes personal visits and screenings by parent educators and is aimed at families with
children from birth to age three, although families can join the program from pregnancy on. In
the Navajo Nation, the home-based component is known as Baby FACE.
The FACE center-based preschool component includes an early childhood education program
for children aged three to five, adult education for the children’s parents, and Parent and Child
Time (PACT). In 2013, there were eight FACE programs serving families in the region located in
Chinle (2), Kayenta (2), Ganado (2) and Winslow (2). These programs provided services to a
total of 461 unique adults and 460 unique children through both their center-based and home-
based components. A small number of children and adults enrolled in both center-based and
home-based programs.
In the Navajo Nation Region, the AzEIP service provider is the tribally-operated Growing in
Beauty program, under the Navajo Nation Office of Special Education and Rehabilitation
82016 Needs & Assets Report Navajo Nation Regional Partnership Council
Services. There has been a substantial increase in the number of services provided between
2012 and 2014.
The number of DDD service visits for children aged 0-2 in the region decreased from 626 in
2013 to 306 in 2014. Across the sate there was also a decline in the number of service visits for
children in this age range. Service visits for children aged 3-5, however, increased in the region
in the same time period (from 814 to 1,201) while the statewide number of visits decreased.
Child Health
In 2013, there were 1,386 babies born to women residing in the Navajo Nation Region. About a
third (32%) of pregnant women in the region had no prenatal care during the first trimester, a
substantially higher rate than in the state as a whole (19%); the region’s rate does not meet the
Healthy People 2020 objective of fewer than 22.1 percent without care. Nine percent of
pregnant women in the region had fewer than five prenatal care visits, compared to five
percent in the state. A similar proportion of babies in the region (8%) and the state (9%) were
premature (less than 37 weeks), both meeting the Healthy People 2020 objective of fewer than
11.4 percent premature.
The majority of births in the region (94%) were paid for by a public payor (AHCCCS, Arizona’s
Medicaid, or the Indian Health Service), while just over half (55%) of births in the state fall into
that category. Of the babies born in 2013 to women in the region, six percent had low birth
weight (2.5 kg or less), a similar rate than the statewide rate of seven percent. Both the region
and state rates meet the Healthy People 2020 objective of fewer than 7.8 percent. A smaller
proportion of babies in the region were placed in neonatal intensive care compared to the state
(2% and 5%, respectively).
Seventeen percent of the young children in the Navajo Nation Region are estimated to be
uninsured. This rate is slightly lower than those of all Arizona reservations combined (20%), but
higher than the statewide rate (10%).
Although immunizations rates vary by vaccine, for each of the three key vaccines tracked, 97
percent or more of the children in selected child care and early education settings in the school
year 2014-2015 were immunized; these rates, which represent only ten child care centers in the
region, are slightly higher than those of the state. The Healthy People 2020 objective for
vaccination coverage for children ages 19-35 months for the DTAP, polio and MMR vaccines is
90 percent, so children in these child care centers meet the objective. However, because of
immunization requirements, the rates of immunization for children in child care may be higher
than immunization rates for children not in child care, so the rates across all children in the
Navajo Nation Region may not be as high. Almost all (99%) of the children enrolled in
kindergarten in selected schools in the region were vaccinated. The rates of religious (0.6%)
and personal belief (0.5%) exemptions from immunizations in the child care centers and schools
for which data were available were quite low (and lower than the state overall).
92016 Needs & Assets Report Navajo Nation Regional Partnership Council
Family Support and Literacy
Parental Involvement
The Navajo Nation Regional Partnership Council has recognized the importance of supporting
parental involvement in early childhood development by allocating funding to the “Parent
Outreach and Awareness” strategy. This strategy funds the “Early Literacy Companion Kit,”
which is distributed to parents at the three hospitals where women give birth on the Navajo
Nation Region. This kit includes culturally relevant materials such as a “Navajo Nursery
Lullabies.” Additionally, a component of this strategy funds the Reach Out and Read program in
the region.
Parenting classes are also available through the Navajo Nation Department for Self Reliance,
which offers the Motherhood is Sacred™ and Fatherhood is Sacred™ curricula, consisting of 12
four-hour sessions.
Home Visitation Programs
In FY 2014 the Navajo Nation Regional Partnership Council funded a home visitation program
through CPLC Parenting Arizona, a program of Chicanos Por La Causa (CPLP). The Home
Visitation program provides in-home services for families, and focuses on education about
topics such as parenting skills, child development, early literacy, and health, using the Parents-
As-Teachers curriculum.
Food Security
In March of 2015, the Navajo Nation was awarded a $2.4 million grant by the USDA to help fight
food insecurity as part of an initiative to end childhood hunger with a focus on rural areas. The
Navajo Nation Division of Health will implement the Food Access Navigation Project, using Food
Access Navigators to evaluate assets and gaps in food access in selected regions of the
reservation and to provide technical assistance for connecting eligible households to nutrition
assistance programs.
The Navajo Nation Regional Partnership Council also funds a strategy to support families facing
food insecurity in the region. A mobile food pantry service is available through St. Jude Food
Bank. Emergency food boxes are also distributed by St. Mary’s Food Bank Alliance.
Communication, Public Information and Awareness and Systems Coordination among Early
Childhood Programs and Services
Efforts to enhance the coordination among agencies and programs serving young children and
their families in the region include:
• Updates to the Navajo Nation Health, Education, and Human Service Committee, and
Navajo Nation Board of Education.
• Participation in networking meetings in the region (Navajo Head Start Health Service
Advisory Committee, Dilkon Community Networking, Tuba City Networking Meetings,
and Fort-A Team meetings, among others)
• First Things First-funded Grantee Coordination meetings
102016 Needs & Assets Report Navajo Nation Regional Partnership Council
• Development of the Early Education Coalition facilitated by the Regional Partnership
Council (since August of 2014)
112016 Needs & Assets Report Navajo Nation Regional Partnership Council
The Navajo Nation Region
Regional Description
When First Things First was established by the passage of Proposition 203 in November 2006,
the government-to-government relationship with federally-recognized tribes was
acknowledged. Each tribe with tribal lands located in Arizona was given the opportunity to
participate within a First Things First designated region or elect to be designated as a separate
region. The Navajo Nation was one of 10 tribes that chose to be designated as its own region.
This decision must be ratified every two years, and the Navajo Nation has opted to continue to
be designated as its own region.
The First Things First Navajo Nation Region is defined as the Arizona portion of the Navajo
Nation Reservation. The region covers nearly 16,000 square miles in the northeast corner of
the state, stretching across Apache, Navajo, and Coconino counties. The entire reservation,
which dates to the Navajo Treaty of 1868, includes lands in Utah and New Mexico, and is
divided into 110 chapters.
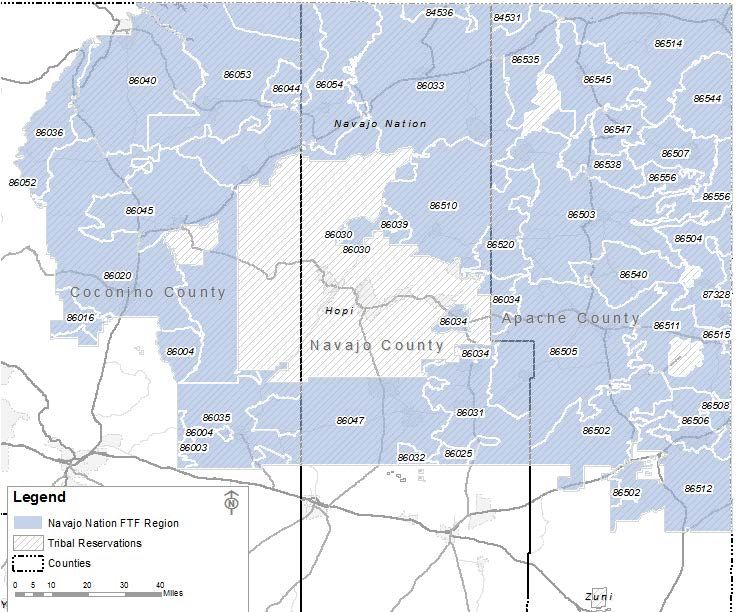
Figure 1 shows the geographical area covered by the Navajo Nation Region. Additional
information available at the end of this report includes a map of the region by zip code in
Appendix 1, a table listing zip codes for the region in Appendix 2, and a map of school districts
in the region in Appendix 3.
122016 Needs & Assets Report Navajo Nation Regional Partnership Council
Figure 1. The Navajo Nation Region
Source: U.S. Census Bureau (2010). TIGER/Line Shapefiles: TabBlocks, Streets, Counties, American Indian/Alaska Native Homelands. Retrieved
from http://www.census.gov/geo/maps-data/data/tiger-line.html
Data Sources
The data contained in this report come from a variety of sources. Some data were provided to
First Things First by state agencies, such as the Arizona Department of Economic Security (DES),
the Arizona Department of Education (ADE), and the Arizona Department of Health Services
(ADHS). Other data were obtained from publically available sources, including the 2010 U.S.
Census, the American Community Survey (ACS), and the Arizona Department of Administration
(ADOA).
The U.S. Census 1 is an enumeration of the population of the United States. It is conducted
every ten years, and includes information about housing, race, and ethnicity. The 2010 U.S.
1 U.S. Census Bureau. (May, 2000). Factfinder for the Nation. Retrieved from http://www.census.gov/history/pdf/cff4.pdf
132016 Needs & Assets Report Navajo Nation Regional Partnership Council
Census data are available by census block. There are about 115,000 inhabited blocks in
Arizona, with an average population of 56 people each. The Census data for the Navajo Nation
Region presented in this report were calculated by identifying each block in the region, and
aggregating the data over all of those blocks.
The American Community Survey 2 is a survey conducted by the U.S. Census Bureau each month
by mail, telephone, and face-to-face interviews. It covers many different topics, including
income, language, education, employment, and housing. The ACS data are available by census
tract. Arizona is divided into about 1,500 census tracts, with an average of about 4,200 people
in each. The ACS data for the Navajo Nation Region were calculated by aggregating over the
census tracts which are wholly or partially contained in the region. The data from partial
census tracts were apportioned according to the percentage of the 2010 Census population in
that tract living inside the Navajo Nation Region. The most recent and most reliable ACS data
are averaged over the past five years; those are the data included in this report. They are
based on surveys conducted from 2009 to 2013. In general, the reliability of ACS estimates is
greater for more populated areas. Statewide estimates, for example, are more reliable than
county-level estimates.
To protect the confidentiality of program participants, the First Things First Data Dissemination
and Suppression Guidelines preclude our reporting social service and early education
programming data if the count is less than ten, and preclude our reporting data related to
health or developmental delay if the count is less than twenty-five. In addition, some data
received from state agencies may be suppressed according to their own guidelines. The
Arizona Department of Health Services, for example, does not report counts less than six.
Throughout this report, information which is not available because of suppression guidelines
will be indicated by entries of “N/A” in the data tables.
2 U.S. Census Bureau (April, 2013). American Community Survey Information Guide. Retrieved from
http://www.census.gov/content/dam/Census/programs-surveys/acs/about/ACS_Information_Guide.pdf
142016 Needs & Assets Report Navajo Nation Regional Partnership Council
A note on the Census and American Community Survey data included in this report:
In this report we use two main sources of data to describe the demographic and socio-
economic characteristics of families and children in the region: the U.S. Census 2010 and the
American Community Survey. These data sources are important for the unique information
they are able to provide about children and families across the United States, but both of them
have acknowledged limitations for their use on tribal lands. Although the Census Bureau
asserted that the 2010 Census count was quite accurate in general, they estimate that
“American Indians and Alaska Natives living on reservations were undercounted by 4.9
percent.” 3 In the past, the decennial census was the only accessible source of wide-area
demographic information. Starting in 2005, the Census Bureau replaced the “long form”
questionnaire that was used to gather socio-economic data with the American Community
Survey (ACS). As noted above, the ACS is an ongoing survey that is conducted by distributing
questionnaires to a sample of households every month of every year. Annual results from the
ACS are available but they are aggregated over five years for smaller communities, to try to
correct for the increased chance of sampling errors due to the smaller samples used.
According to the State of Indian Country Arizona Report 4 this has brought up new challenges
when using and interpreting ACS data from tribal communities and American Indians in general.
There is no major outreach effort to familiarize the population with the survey (as it is the case
with the decennial census), and the small sample size of the ACS makes it more likely that the
survey may not accurately represent the characteristics of the population on a reservation. The
State of Indian Country Arizona Report indicates that at the national level, in 2010 the ACS
failed to account for 14 percent of the American Indian/Alaska Native (alone, not in
combination with other races) population that was actually counted in the 2010 decennial
census. In Arizona the undercount was smaller (4%), but according to the State of Indian
Country Arizona Report, ACS may be particularly unreliable for the smaller reservations in the
state.
While recognizing that estimates provided by ACS data may not be fully reliable, we have
elected to include them in this report because they still are the most comprehensive publically-
available data that can help begin to describe the families that First Things First serve.
Considering the important planning, funding and policy decisions that are made in tribal
communities based on these data, however, the State of Indian Country report recommend a
3U.S.
Census Bureau. (May, 2012). Estimates of Undercount and Overcount in the 2010 Census.
www.census.gov/newsroom/releases/archives/2010_census/cb12-95.html
4 Inter Tribal Council of Arizona, Inc., ASU Office of the President on American Indian Initiatives, ASU Office of Public Affairs
(2013). The State of Indian Country Arizona. Volume 1. Retrieved from
http://outreach.asu.edu/sites/default/files/SICAZ_report_20130828.pdf
152016 Needs & Assets Report Navajo Nation Regional Partnership Council
concerted tribal-federal government effort to develop the tribes’ capacity to gather relevant
information on their populations. This information could be based on the numerous records
that tribes currently keep on the services provided to their members (records that various
systems must report to the federal agencies providing funding but that are not currently
organized in a systematic way) and on data kept by tribal enrollment offices.
A current initiative that aims at addressing some of these challenges has been started by the
American Indian Policy Institute, the Center for Population Dynamics and the American Indian
Studies Department at Arizona State University. The Tribal Indicators Project 5 begun at the
request of tribal leaders interested in the development of tools that can help them gather and
utilize meaningful and accurate data for governmental decision-making. An important part of
this effort is the analysis of Census and ACS data in collaboration with tribal stakeholders. We
hope that in the future these more reliable and tribally-relevant data will become available for
use in these community assessments.
5 http://aipi.clas.asu.edu/Tribal_Indicators
162016 Needs & Assets Report Navajo Nation Regional Partnership Council
Population Characteristics
Why it Matters
The characteristics of families living within a region can influence the availability of resources
and supports for those families. 6 Population characteristics and trends in family composition
are often considered by policymakers when making decisions about the type and location of
services to be provided within a region such as schools, health care facilities and services, and
social services and programs. As a result of these decisions, families with young children may
have very different experiences within and across regions regarding access to employment,
food resources, schools, health care facilities and providers, and social services. It is important,
therefore, that decision-makers understand who their constituents are so that they can
prioritize policies that address the needs of diverse families with young children. Accurate and
up-to-date information about population characteristics such as the number of children and
families in a geographic region, their ethnic composition, living arrangements and languages
spoken can support the development or continuation of resources that are linguistically,
culturally, and geographically most appropriate for a given locale.
In addition to being affected by community resources, the likelihood of a child reaching his or
her optimal development can also be affected by the supports and resources available within
the family. 7,8 The availability of family resources can be influenced by the characteristics of the
family structure, such as who resides in a household and who is responsible for a child’s care.
Children living with and being cared for by relatives or caregivers other than parents, is
increasingly common. 9 Extended, multigenerational families and kinship care are more typical
in Native communities. 10,11 The strengths associated with this open family structure -mutual
help and respect- can provide members of these families with a network of support which can
6U.S. Department of Health and Human Services. Health Resources and Services Administration, Maternal and Child Health
Bureau. (2014). Child Health USA 2014. Population Characteristics. Retrieved from: http://mchb.hrsa.gov/chusa14/population-
characteristics.html
7Center for American Progress. (2015). Valuing All Our Families. Progressive Policies that Strengthen Family Commitments and
Reduce Family Disparities. Retrieved from: https://cdn.americanprogress.org/wp-content/uploads/2015/01/FamilyStructure-
report.pdf
8 Kidsdata.org. (n.d.). Summary: Family Structure. Retrieved from: http://www.kidsdata.org/topic/8/family-structure/summary
9U.S. Department of Health and Human Services. (2012). ASPE Report. Children in Nonparental Care: A Review of the Literature
and Analysis of Data Gaps. Retrieved from http://aspe.hhs.gov/basic-report/children-nonparental-care-review-literature-and-
analysis-data-gaps
10 Harrison, A. O., Wilson, M. N., Pine, C. J., Chan, S. Q., & Buriel, R. (1990). Family ecologies of ethnic minority children. Child
Development, 61(2), 347-362.
11 Red Horse, J. (1997). Traditional American Indian family systems. Families, Systems, & Health, 15(3), 243.
172016 Needs & Assets Report Navajo Nation Regional Partnership Council
be very valuable when dealing with socio-economic hardships. 12 Grandparents are often
central to these mutigenerational households. However, when caring for children not because
of choice, but because parents become unable to provide care due to the parent’s death,
physical or mental illness, substance abuse, incarceration, unemployment or underemployment
or because of domestic violence or child neglect in the family, grandparents may be in need of
specialized assistance and resources to support their grandchildren. 13
Understanding language use in the region can also contribute to being better able to serve the
needs of families with young children. Language preservation and revitalization have been
recognized by the U.S. Department of Health & Human Services as keys to strengthening
culture in Native communities and to encouraging communities to move toward social unity
and self-sufficiency. 14 Special consideration should be given to respecting and supporting the
numerous Native languages spoken by families, particularly in tribal communities.
What the Data Tell Us
According to the U.S. Census the Navajo Nation Region had a population of 101,835 in 2010, of
whom 10,894 (11%) were children ages birth to 5 years (see Table 1). Twenty-four percent of
households in the region included a young child. Nearly 40 percent of the households with
young children (birth to 5) in the region (38%) are single-female households (Figure 3). The
proportion of young children living in a grandparent’s household in the region (40%) is
substantially higher than the percentage statewide (14%), but the same as the percentage in all
Arizona reservations combined (40%) (see Table 4). For those children living in a grandparent’s
household, 57 percent live with a grandparent who is financially responsible for them, and 13
percent of the children have no parent present in the home (see Table 5).
The vast majority (95%) of young children (ages 0-4) in the Navajo Nation Region are American
Indian. This proportion is similar to that of all Arizona reservations combined (92%), but differs
greatly from the statewide rate of six percent. The percentage of young children who are
Hispanic or Latino in the Navajo Nation is four percent, compared to nine percent in Arizona
reservations overall and 45 percent in the state as a whole (see Table 6). The race and ethnicity
breakdown among adults in the region is similar to that of young children, with most residents
identifying as American Indian (95%), and a somewhat smaller proportion of adults than
12Hoffman, F. (Ed.). (1981). The American Indian Family: Strengths and Stresses. Isleta, NM: American Indian Social Research
and Development Associates.
13 Population Reference Bureau. (2012). More U.S. Children Raised by Grandparents. Retrieved from
http://www.prb.org/Publications/Articles/2012/US-children-grandparents.aspx
14U.S. Department of Health & Human Services, Administration for Native Americans. Native Languages
http://www.acf.hhs.gov/programs/ana/programs/native-language-preservation-maintenance
182016 Needs & Assets Report Navajo Nation Regional Partnership Council
children identifying as Hispanic (1% versus 4%) (see Table 7). In the state, however, only four
percent of adults identified as American Indian, and twenty-five percent as Hispanic or Latino
(Table 7). The ethnic composition in the Navajo Nation is also reflected in a higher proportion
of people aged five and older that report speaking a Native North American language (68%)
compared to the proportion of people statewide (2%). This proportion is substantially higher in
the region compared to the rate in All Arizona reservations combined (51%) (see Figure 4).
According to the Navajo Nation Department of Dine Education’s Office of Standards, Curriculum
and Assessments Development “the Navajo Language is an essential element of the life,
culture, and identity of the Navajo people” and recognizes the importance of preserving the
language to ensure the survival of the Nation. 15
Population and Households
Table 1.Population and households, 2010
HOUSEHOLDS WITH ONE
TOTAL POPULATION TOTAL NUMBER OF OR MORE CHILDREN (AGES
POPULATION (AGES 0-5) HOUSEHOLDS 0-5)
Navajo Nation Region 101,835 10,894 29,232 7,159 24%
Navajo Nation (entire) 173,667 18,335 49,946 12,119 24%
All Arizona Reservations 178,131 20,511 50,140 13,115 26%
Arizona 6,392,017 546,609 2,380,990 384,441 16%
Source: U.S. Census Bureau (2010). 2010 Decennial Census, Summary File 1, Tables P1, P14, P20.
Retrieved from: http://factfinder.census.gov
Note: Entries of “N/A” indicate percentages which cannot be reported because of data suppression, or are otherwise not available.
Table 2. Population of children by single year-of-age, 2010
AGES 0-5 AGE 0 AGE 1 AGE 2 AGE 3 AGE 4 AGE 5
Navajo Nation Region 10,894 1,800 1,736 1,811 1,849 1,812 1,886
All Arizona Reservations 20,511 3,390 3,347 3,443 3,451 3,430 3,450
Arizona 546,609 87,557 89,746 93,216 93,880 91,316 90,894
Source: U.S. Census Bureau (2010). 2010 Decennial Census, Summary File 1, Table P14.
Retrieved from: http://factfinder.census.gov
Note: Children age 0 were born between April 2009 and March 2010; children age 5 were born between April 2004 and March 2005.
Note: Entries of “N/A” indicate percentages which cannot be reported because of data suppression, or are otherwise not available.
15 Retrieved from: http://www.odclc.navajo-nsn.gov/About-Us
192016 Needs & Assets Report Navajo Nation Regional Partnership Council
Table 3. State population projections, 2015 & 2020
PROJECTED PROJECTED
POPULATION POPULATION POPULATION
(AGES 0-5) (AGES 0-5) (AGES 0-5) PROJECTED CHANGE
IN 2010 CENSUS IN 2015 IN 2020 FROM 2010 TO 2020
Arizona 546,609 537,200 610,400 12%
Sources: Arizona Dept. of Administration, Employment and Population Statistics, "2012-2050 State and county population projections" & 2010
U.S. Census
Note: Regional data were not available for this indicator.
Living Arrangements for Young Children
Figure 2.Living arrangements for children (ages 0-5), 2009-2013 five-year estimate
Source: American Community Survey, 5-year estimates (2009-2013), Tables B05009, B09001, B17006.
Retrieved from: http://factfinder.census.gov
20You can also read