San Carlos Apache Region - First Things First
←
→
Page content transcription
If your browser does not render page correctly, please read the page content below
2016            NEEDS AND ASSETS REPORT

 San Carlos Apache Region
San Carlos Apache Regional Partnership Council

                                  2016

                Needs and Assets Report

                          Prepared by
    Community Research, Evaluation & Development (CRED)
The Frances McClelland Institute for Children, Youth, and Families
  John & Doris Norton School of Family and Consumer Sciences
            College of Agricultural and Life Sciences
                   The University of Arizona

                             Funded by
First Things First San Carlos Apache Regional Partnership Council

        Frances McClelland Institute for Children, Youth and Families
        John & Doris Norton School of Family and Consumer Sciences
                  College of Agricultural and Life Sciences
                         The University of Arizona
                               PO Box 210078
                          Tucson, AZ 85721-0462
                          Phone: (520) 621-8739
                            Fax: (520) 621-4979
                         http://ag.arizona.edu/fcs/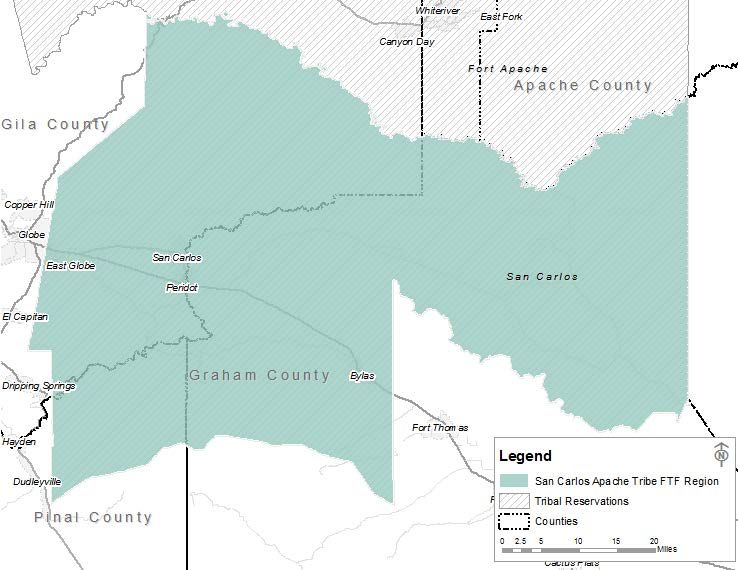
San Carlos Apache Regional Partnership Council
2250 Highway 60, Suite K, Miami, Arizona 85539
928.425.8172 | 877.803.7234 | azftf.gov

Chair                         February 10, 2017
Vernon Poncho
                              Message from the Chair:
Vice Chair                    The past two years have been rewarding for the San Carlos Apache
Flora Talas
                              Regional Partnership Council, as we delivered on our mission to build
Members                       better futures for young children and their families.
Mary Bendle
                              The San Carlos Apache Regional Partnership Council will continue to
Teri Gallenstein
                              advocate and provide opportunities as indicated throughout this report.
Isaiah May
Nolita April Noline           Our strategic direction has been guided by the Needs and Assets reports,
Delphine Rodriguez            specifically created for the San Carlos Apache Region. These reports are
Elliott Talgo, Sr.            vital to our continued work in building a true integrated early childhood
Regional Director             system for our young children and our overall future. The San Carlos
LaToya Beatty                 Apache Regional Partnership Council owes special gratitude to the San
                              Carlos Apache Tribal Council, the San Carlos Apache Tribe Education
                              Committee, community agencies, service providers and key stakeholders.
                              We would also like to thank our report vendor, The University of Arizona
                              Community Research, Evaluation & Development, The Frances McClelland
                              Institute for Children, Youth, and Families, John & Doris Norton School of
                              Family and Consumer Sciences, College of Agricultural and Life Sciences,
                              for their knowledge, expertise and analysis of the San Carlos Apache
                              Region.
                              Going forward, the First Things First San Carlos Apache Regional
                              Partnership Council is committed to meeting the needs of young children
                              by providing essential services and advocating for social change.
                              Thanks to our dedicated staff, volunteers and community partners, First
                              Things First is making a real difference in the lives of our youngest citizens
                              and throughout the entire State.
                              Thank you for your continued support.
                              Sincerely,

                              Vernon Poncho, Chair

                                                    i
2016 Needs & Assets Report San Carlos Apache Tribe Regional Partnership Council
Introductory Summary and Acknowledgments
Ninety percent of a child’s brain develops before kindergarten and the quality of a child’s
early experiences impact whether their brain will develop in positive ways that promote
learning. Understanding the critical l role the early years play in a child’s future success is
crucial to our ability to foster each child’s optimal development and, in turn, impact all
aspects of wellbeing of our communities and our state.
This Needs and Assets Report for the San Carlos Apache Tribe Region helps us in
understanding the needs of young children, the resources available to meet those needs
and gaps that may exist in those resources. An overview of this information is provided in
the Executive Summary and documented in further detail in the full report.
The First Things First San Carlos Apache Tribe Regional Partnership Council recognizes the
importance of investing in young children and ensuring that families and caregivers have
options when it comes to supporting the healthy development of young children in their
care. This report provides information that will aid the Council’s funding decisions, as well
as our work with community partners on building a comprehensive early childhood system
that best meets the needs of young children in our community.
It is our sincere hope that this information will help guide community conversations about
how we can best support school readiness for all children in the San Carlos Apache Tribe
region. This information may also be useful to stakeholders in our area as they work to
enhance the resources available to young children and their families and as they make
decisions about how best to support children birth to 5 years old in our area.
Acknowledgments:
We want to thank the Arizona Department of Economic Security and the Arizona Child Care
Resource and Referral, the Arizona Department of Health Services, the Arizona Department
of Education, the Census Bureau, the Arizona Department of Administration- Employment
and Population Statistics, and the Arizona Health Care Cost Containment System for their
contributions of data for this report, and their ongoing support and partnership with First
Things First on behalf of young children.
To the current and past members of the San Carlos Apache Tribe Regional Partnership
Council, your vision, dedication, and passion have been instrumental in improving
outcomes for young children and families within the region. Our current efforts will build
upon those successes with the ultimate goal of building a comprehensive early childhood
system for the betterment of young children within the region and the entire state.
ii2016 Needs & Assets Report San Carlos Apache Tribe Regional Partnership Council
Table of Contents
Letter from the Chair ....................................................................................................................... i
List of Tables ............................................................................................................................... 3
List of Figures .............................................................................................................................. 4
Executive Summary......................................................................................................................... 5
The San Carlos Apache Region ...................................................................................................... 13
Regional Description ................................................................................................................. 13
Data Sources ............................................................................................................................. 14
Population Characteristics ............................................................................................................ 18
Why it Matters .......................................................................................................................... 18
What the Data Tell Us ............................................................................................................... 20
Population and Households ...................................................................................................... 21
Living Arrangements for Young Children .................................................................................. 22
Race, Ethnicity, and Language .................................................................................................. 23
Economic Circumstances .............................................................................................................. 26
Why it Matters .......................................................................................................................... 26
What the Data Tell Us ............................................................................................................... 28
Poverty and Income .................................................................................................................. 30
Employment and Housing ......................................................................................................... 32
Economic Supports ................................................................................................................... 34
Educational Indicators .................................................................................................................. 36
Why it Matters .......................................................................................................................... 36
What the Data Tell Us ............................................................................................................... 37
Educational Attainment of the Adult Population ..................................................................... 38
Third-grade Test Scores ............................................................................................................ 39
Early Learning................................................................................................................................ 41
Why it Matters .......................................................................................................................... 41
What the Data Tell Us ............................................................................................................... 43
Early Care and Education .......................................................................................................... 45
Families with Children Who Have Special Needs ..................................................................... 46
Child Health ................................................................................................................................... 48
Why it Matters .......................................................................................................................... 48
What the Data Tell Us ............................................................................................................... 50
Mothers Giving Birth ................................................................................................................. 51
Infant Health ............................................................................................................................. 52
Health Insurance ....................................................................................................................... 54
Immunizations .......................................................................................................................... 54
Access to care ........................................................................................................................... 55
Family Support and Literacy ......................................................................................................... 56
22016 Needs & Assets Report San Carlos Apache Tribe Regional Partnership Council
Why it Matters .......................................................................................................................... 56
What the Data Tell Us ............................................................................................................... 57
Communication, Public Information and Awareness ................................................................... 61
Why it Matters .......................................................................................................................... 61
What the Data Tell Us ............................................................................................................... 61
Systems Coordination among Early Childhood Programs and Services ....................................... 62
Why it Matters .......................................................................................................................... 62
What the Data Tell Us ............................................................................................................... 62
Appendix 1: Map of zip codes of the San Carlos Apache Region ................................................. 64
Appendix 2: Zip codes of the San Carlos Apache Region.............................................................. 65
Appendix 3: Map of Elementary and Unified School Districts in the San Carlos Apache Region. 66
Appendix 4: Data Sources ............................................................................................................. 67
List of Tables
Table 1. Population and households, 2010.................................................................................. 21
Table 2. Population of children by single year-of-age, 2010 ....................................................... 21
Table 3. Children (ages 0-5) living in the household of a grandparent, 2010 ............................. 23
Table 4. Grandparents responsible for grandchildren (ages 0-17) living with them, 2009-2013
five-year estimate ......................................................................................................................... 23
Table 5. Race and ethnicity of the population of young children (ages 0-4), 2010 ..................... 23
Table 6. Race and ethnicity of the adult population (ages 18 and older), 2010 ......................... 24
Table 7. Household use of languages other than English, 2009-2013 five-year estimate .......... 25
Table 8. Federal poverty levels for families with young children (ages 0-4), 2009-2013 five-year
estimate ........................................................................................................................................ 30
Table 9. Parents of young children (ages 0-5) who are or are not in the labor force, 2009-2013
five-year estimate ......................................................................................................................... 33
Table 10. Vacant and occupied housing units, 2009-2013 five-year estimate ............................ 33
Table 11. Occupied housing units and costs relative to income, 2009-2013 five-year estimate 33
Table 12. Children (ages 0-5) receiving Temporary Assistance to Needy Families (TANF) ......... 34
Table 13. Children (ages 0-5) in the Supplemental Nutrition Assistance Program (SNAP) ......... 34
Table 14. Students eligible for free or reduced-price lunch, 2012-2014...................................... 35
Table 15. Results of the 2014 third-grade AIMS Math test ......................................................... 39
Table 16. Results of the 2014 third-grade AIMS Reading test ..................................................... 40
Table 17. Participation in center-based early childhood education programs ........................... 45
Table 18. AzEIP referrals and children served, 2014 ................................................................... 46
Table 19. Division of Developmental Disabilities (DDD) services to children (ages 0-2), 2013-
2014 .............................................................................................................................................. 46
Table 20. Division of Developmental Disabilities (DDD) services to children (ages 3-5), 2013-
2014 .............................................................................................................................................. 47
32016 Needs & Assets Report San Carlos Apache Tribe Regional Partnership Council
Table 21. Selected characteristics of mothers giving birth, 2013 ................................................ 51
Table 22. Selected characteristics of babies born, 2013 ............................................................. 52
Table 23. Immunizations for children in kindergarten, school year 2014-15*............................ 54
List of Figures
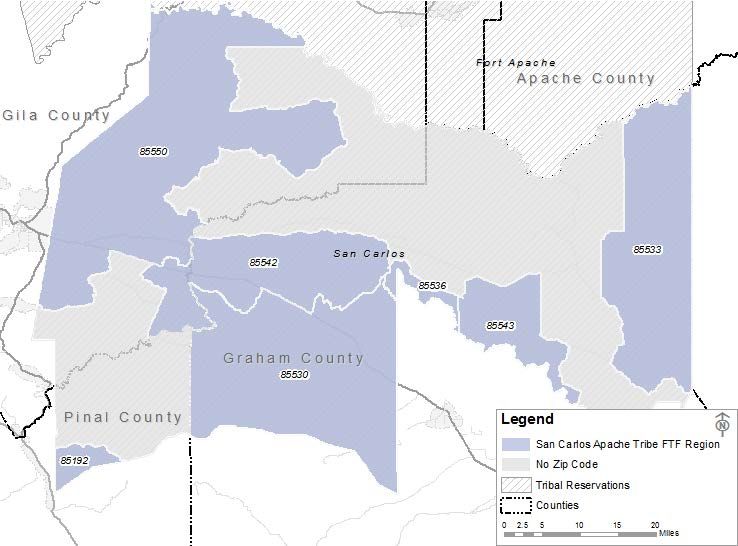
Figure 1. The San Carlos Apache Region ...................................................................................... 14
Figure 2. Living arrangements for children (ages 0-5), 2009-2013 five-year estimate ............... 22
Figure 3. Heads of households in which young children (ages 0-5) live, 2010 ............................ 22
Figure 4. Language spoken at home, by persons ages 5 and older, 2009-2013 five-year estimate
....................................................................................................................................................... 24
Figure 5. Percent of population in poverty, 2009-2013 five-year estimate ................................ 30
Figure 6. Median annual family incomes, 2009-2013 five-year estimate ................................... 31
Figure 7. Average annual unemployment rates, 2009 to 2013 ................................................... 32
Figure 8. Level of education for the population ages 25 and older, 2009-2013 five-year estimate
....................................................................................................................................................... 39
Figure 9. Parents’ and caregivers’ reported levels of concern for how well their children are
meeting developmental milestones (Parent and Caregiver Survey, 2014). ................................. 47
Figure 10. Healthy People 2020 objective for mothers, compared to 2013 region and state data
....................................................................................................................................................... 52
Figure 11. Healthy People 2020 objectives for babies, compared to 2013 region and state data
....................................................................................................................................................... 53
Figure 12. Estimated percent of population without health insurance, 2009-2013 five-year
estimate ........................................................................................................................................ 54
Figure 13. Percent of respondents who reported that necessary health care was delayed or not
received (Parent and Caregiver Survey, 2014). ............................................................................ 55
Figure 14. Reported frequencies of home literacy events: “How many days per week did
someone read stories to your child? How many days per week did someone tell stories or sing
songs to your child?” (Parent and Caregiver Survey, 2014). ........................................................ 60
Figure 15. Responses to the question "When do you think a parent can begin to make a big
difference on a child's brain development?” (Parent and Caregiver Survey, 2014). ................... 60
42016 Needs & Assets Report San Carlos Apache Tribe Regional Partnership Council
Executive Summary
Regional Description
The boundaries of the First Things First San Carlos Apache Region are defined to be those of the
San Carlos Apache Indian Reservation. The region covers almost 3,000 square miles in east-
central Arizona. Most of the region lies within Gila and Graham counties, although there is a
small, uninhabited section in Pinal County. The reservation, which was established in 1871, is
divided into four districts: Seven Mile Wash, Gilson Wash, Peridot, and Bylas.
Data Sources
The information contained in this report comes from a variety of sources. Much of the data
was provided to First Things First by other state agencies: the Arizona Department of Economic
Security (DES), the Arizona Department of Education (ADE), and the Arizona Department of
Health Services (ADHS). Other data were obtained from publically available sources, including
the 2010 U.S. Census, the American Community Survey (ACS), and the Arizona Department of
Administration (ADOA). In addition, regional data from the 2014 First Things First Parent and
Caregiver Survey are included.
Where available, tables and figures in this report include data for all Arizona reservations
combined in addition to data for the state of Arizona to allow for appropriate comparisons
between the region and other relevant geographies.
Population Characteristics
According to the U.S. Census the San Carlos Apache Region had a population of 10,068 in 2010,
of whom 1,435 (14%) were children ages birth to 5 years. Thirty-six percent of households in
the region included a young child.
Forty-three percent of the households with young children (birth to 5) in the region are single-
female households. The proportion of young children living in a grandparent’s household in the
region (47%) is substantially higher than the percentage statewide (14%), and also higher than
the percentage in all Arizona reservations combined (40%). For those children living in a
grandparent’s household in the region, 49 percent live with a grandparent who is financially
responsible for them, but only five percent of the children have no parent present in the home.
The vast majority (98%) of young children (ages 0-4) in the San Carlos Apache Region are
American Indian. This proportion is similar to that of all Arizona reservations combined (92%),
but differs greatly from the statewide percentage of six percent. The percentage of young
children who are Hispanic or Latino in the San Carlos Apache Region is five percent, compared
to nine percent in Arizona reservations overall and 45 percent in the state as a whole. The race
and ethnicity breakdown among adults in the region is similar to that of young children, with
most residents identifying as American Indian (95%), and a somewhat smaller proportion of
adults than children identifying as Hispanic or Latino (3% versus 5%). In the state, however,
52016 Needs & Assets Report San Carlos Apache Tribe Regional Partnership Council
only four percent of adults identified as American Indian, and twenty-five percent as Hispanic
or Latino. The ethnic composition in the San Carlos Apache Region is also reflected in a higher
proportion of households that report speaking a Native North American language (36%)
compared to households statewide (2%). This proportion, however, is lower in the San Carlos
Apache Region compared to the proportion in all Arizona reservations combined (51%). Apache
is the predominant native language spoken in the San Carlos Apache Region.
Economic Circumstances
Poverty rates for both the overall population and the population of young children are higher in
the San Carlos Apache Region than across all Arizona reservations combined and the state as a
whole. For the overall population, 51 percent of people in the region live in poverty, compared
to 42 percent across all Arizona reservations and 18 percent statewide. In all these
geographies, young children are consistently more likely to be in poverty than members of the
total population. Fifty-nine percent of the children in the region live in poverty, a slightly higher
proportion than that in all Arizona reservations combined and substantially higher than the
state percentage (56% and 28%, respectively). In addition to the families whose incomes fall
below the federal poverty level, a substantial proportion of households in the region, and
across all Arizona reservations are low income, i.e., near but not below the federal poverty level
(FPL). Eighty-three percent of families with children aged four and under are living below 185
percent of the FPL in the region (i.e., earned less than $3,677 a month for a family of four),
compared to 77 percent in all Arizona reservations combined, and 48 percent across the state.
The median family income in the region ($30,263) is about half of the median family income in
the state of Arizona ($58,897). The average unemployment rate in the region for the 2009-
2013 period is 29.8 percent, higher than both the estimated 25 percent across all Arizona
reservations combined and the average state rate of 10.4 percent.
Given the high poverty levels in the region, safety net programs such as the San Carlos Apache
Nnee Bich’o Nii Tribal Temporary Assistance to Needy Families program (TANF), the
Supplemental Nutrition Assistance Program (SNAP) and the school-based free or reduced-price
lunch program, are used by many families. In 2014, 27 percent of children in the region
received TANF benefits, while only four percent of children statewide did. There was, however,
a decline in the proportion of children receiving TANF benefits between 2012 and 2014. In
2014, 1,644 children birth to 5 received SNAP benefits in the region. This represents more than
100 percent of the children in this age range reported to be living in the region according to U.S.
Census 2010 (1,435). In comparison, only half of young children statewide (51%) participated in
SNAP. Three-quarters (75%) of the children attending the San Carlos Unified School District,
and nearly 90 percent (87%) of those in the Fort Thomas Unified School District, the only
Arizona Department of Education districts with 90 percent or more of their boundaries wholly
contained within in the region, were eligible for free or reduced lunch.
62016 Needs & Assets Report San Carlos Apache Tribe Regional Partnership Council
Educational Indicators
Adults aged 25 and older in the San Carlos Apache Region report similar levels of educational
attainment as all Arizona reservations combined, but lower levels than the state as a whole.
Twenty-eight percent of adults in the region have no high school diploma or GED compared to
29 percent in all Arizona reservations and 14 percent in the state. An estimated four percent of
adults in the region have a Bachelor’s or higher degree.
Children from the region attend schools in a number of Arizona Department of Education
school districts, but as noted above only two, the San Carlos Unified School District and the Fort
Thomas Unified School District, have 90 percent or more of their boundaries within the regional
boundaries. San Carlos Unified School District includes Rice Elementary and San Carlos
Secondary School. Fort Thomas Unified School District includes Fort Thomas Elementary, Fort
Thomas Junior/High School, Mount Turnbull Elementary and Mount Turnbull Academy. Data
are provided for both of these districts.
Students pass Arizona’s Instrument to Measure Standards (AIMS) if they meet or exceed the
standard. In the San Carlos Unified School District, about one quarter (24%) of third grade
students passed the AIMS math test and 39 percent passed the AIMS reading test. In the Fort
Thomas Unified School District, 61 percent passed the AIMS math test and 59 percent passed
the AIMS reading test.
Early Learning
Early care and education options available to parents of young children in the San Carlos
Apache Region include the Apache Kid Child Care Center, San Carlos Child Readiness Program,
San Carlos Head Start Program, and the school-based preschool at San Carlos Unified School
District.
Center and home-based care
Apache Kid Child Care Center provides services to children in the region at two sites, one in San
Carlos and the other in Bylas. Eligibility criteria for services include income (with preference for
low-income families), teen parents enrolled in high school, Tribal TANF clients, and parents in
the workforce. Cost of care is based on a sliding scale fee (in FY2012-2013 the average monthly
copayment per child was $58).
A recent addition to the early childhood education system in the region is the San Carlos Child
Readiness Program, funded through a four-year grant by the U.S. Department of Education as
part of the Demonstration Grants for Indian Children program. The Child Readiness Program
started to operate in the summer of 2013 and serves four year-old children at two sites, one in
Gilson Wash District and the other in Seven-Mile Wash District. There are no fees associated
with participating in the Child Readiness Program and it is not based on income.
Families in the region also utilize the services of unregulated home-based providers.
Recognizing the importance of high-quality home-based services, the San Carlos Apache
72016 Needs & Assets Report San Carlos Apache Tribe Regional Partnership Council
Regional Partnership Council funds the Family, Friend and Neighbor strategy. Through this
program, which is managed by the Apache Kid Child Care Center, home-based providers who
care for children ages 0 to 5 receive trainings from qualified Early Childhood Education
specialists. Training topics include: child safety, first aid/CPR, nutrition/food handlers class, and
child development among others. In addition, the program helps providers develop job-related
skills such as resume writing, computer literacy, and also planning for higher-education courses.
Providers also receive financial support for finger printing and drug testing so they can
eventually become regulated providers. According to program staff, transportation for
participants is one of the main barriers they encounter, as well as finding more families who are
willing to take advantage of services provided by program participants.
San Carlos Apache Head Start Program
Head Start is a comprehensive early childhood education program for pre-school aged children
whose families meet income eligibility criteria. The program addresses a wide range of early
childhood needs such as education and child development, special education, health services,
nutrition, and parent and family development. The San Carlos Apache Region is served by the
San Carlos Apache Head Start, which is a tribally-operated program providing services in Seven
Miles Wash, Gilson Wash, Peridot and Bylas. The San Carlos Apache Head Start serves a total of
233 children ages 3 and 4, although the vast majority of children enrolled in the program (88%)
are 4 years old. The program provides half-day double sessions, four days a week in 12
classrooms. The San Carlos Apache Head Start also has a kindergarten transition program.
Children with Special Needs
In the San Carlos Apache Region, the number of Division of Developmental Disabilities (DDD)
service visits for children aged 0-2 increased from 210 in 2013 to 263 in 2014.
The First Things First Family and Community Survey is a phone-based survey designed to
measure many critical areas of parents’ knowledge, skills, and behaviors related to their young
children. In 2014, First Things First conducted a modified version of the Family and Community
survey in six tribal regions including the San Carlos Apache Region, known as the First Things
First Parent and Caregiver Survey. This survey, conducted face-to-face with parents and
caregivers of young children living in the region, included a sub-set of items from the First
Things First Family and Community Survey, as well as additional questions that explored health
needs in tribal communities. A total of 224 parents and other caregivers responded to the
survey at a variety of locations across the San Carlos Apache Region.
The 2014 First Things First Parent and Caregiver Survey included a set of questions aimed at
gauging parents’ and caregivers’ concerns about their children’s development. Respondents
were asked to indicate how concerned they were about several developmental events and
stages in eight key areas. The three areas which revealed the greatest degree of concern for
respondents were “How well your child behaves” (42% worried), “How well your child talks and
makes speech sounds” (32% worried), and “How well your child gets along with others” (32%
82016 Needs & Assets Report San Carlos Apache Tribe Regional Partnership Council
worried). Across the eight areas, 16 percent of the respondents reported being “worried a lot”
about one or more areas, and 43 percent were “not worried at all” about all eight areas. The
remaining 41 percent were “worried a little” about at least one of the eight areas.
Child Health
In 2013, there were 293 babies born to women residing in the region. Almost half (48%) of
pregnant women in the region had no prenatal care during the first trimester; this percentage
does not meet the Healthy People 2020 objective of fewer than 22.1 percent without care.
Over one quarter of pregnant women in the region (27%) had fewer than five prenatal care
visits, compared to five percent in the state. A higher proportion of babies in the region (12%)
were premature (less than 37 weeks) compared to the state (9%). The region’s percentage is
slightly above the Healthy People 2020 objective of fewer than 11.4 percent premature.
The vast majority of births in the region (90%) were paid for by a public payor (AHCCCS,
Arizona’s Medicaid, or the Indian Health Service), while just over half (55%) of births in the state
fall into that category. Of the babies born in 2013 to women in the region, nine percent were
low birth weight (2.5 kg or less). This percentage was higher than the seven percent statewide,
placing it over the Healthy People 2020 objective of fewer than 7.8 percent. Four percent of
babies in the region were placed in neonatal intensive care, a similar proportion to the state as
a whole (5%).
According to the American Community Survey, over half (51%) of the young children in the San
Carlos Apache Region are estimated to be uninsured. This percentage is substantially higher
than those of all Arizona reservations combined (20%) and the statewide rate (10%).
Healthy People 2020 sets a target of 80 percent for full vaccination coverage among young
children (19-35 months). Data for the San Carlos Apache Tribe (FY2013) from the Indian Health
Service indicate that 74.7 percent of children 19-35 months have had the recommended
vaccine series (using series 4:3:1:3:3:1:4), which is below the Healthy People objective.
While immunizations rates vary by vaccine, the vast majority of children in kindergarten in the
region had been immunized; these rates, which represent only three schools in the region, are
higher than those of the state. While there were no religious/personal belief exemptions, there
were medical exemptions from immunizations in the San Carlos Apache Region schools for
which data were available at 0.5%.
Family Support and Literacy
The 2014 Parent and Caregiver Survey collected data about parent and caregiver knowledge of
children’s early development and their involvement in a variety of behaviors known to
contribute positively to healthy development, including two items about home literacy events.
Twenty-one percent of survey participants reported that someone in the home read to their
child six or seven days in the week prior to the survey. A slightly larger proportion (30%)
92016 Needs & Assets Report San Carlos Apache Tribe Regional Partnership Council
reported that the child was not read to, or read to only once or twice during the week. In
comparison, telling stories or singing songs took place more frequently. In more than three-
quarters of the homes (78%), children were hearing stories or songs three or more days per
week.
The First Things First 2014 Parent and Caregiver Survey also included an item aimed at eliciting
information about parents’ and caregivers’ awareness of their influence on a child’s brain
development. Just under half of the respondents in the region recognized that they could
influence brain development prenatally or right from birth. A sizeable proportion (27%)
responded that a parent’s influence would not begin until after the infant was 7 months old.
Raising young children in the region: positive aspects and challenges
Parents and caregivers of young children who participated in the First Things First 2014 Parent
and Caregiver Survey were asked what they liked best about raising young children in their
community. Their responses are summarized below in order of most to least cited. The
majority of survey respondents indicated the thing they liked best about raising children in their
community was the ability to teach children about Apache culture, Apache heritage, and the
Apache language. Parents and caregivers also appreciated the ability to raise children in a
community where other members of their family were close by to offer support and guidance.
Survey participants also highlighted the fact that their community is “close-knit,” with many
indicating that they felt safe and supported in their community and that their children had
friends to play with. Parents also pointed out that they value the programs available to young
children, specifically the Boys and Girls Club and Young Warriors. Lastly, respondents indicated
that they enjoyed being able to take their children outdoors to do recreational activities,
including participating in sporting events, playing at parks and playgrounds, and going hunting
and fishing.
Parents and caregivers were also asked about the most difficult aspects of raising children in
the San Carlos Apache Region. The majority of survey participants perceive the high rates of
drug and alcohol use in the community as one of the most challenging aspects of raising young
children in the region. Many survey respondents shared a sense that drugs and alcohol
impeded on parents’ ability to raise their children, and blamed drugs and alcohol use for
making the community less safe. Other safety concerns named by parents and caregivers
included peer pressure, violence and gang activity, bullying in schools, and other environmental
concerns such as driving too fast through areas where children are present, stray dogs, and
hazardous trash. Many parents and caregivers indicated that poverty in general poses a large
challenge to families raising children young children in the region. For example, survey
respondents expressed concerns about being unable to find work, adequate housing, and being
able to access other needed goods and services. Other respondents specifically mentioned the
difficulties they experience being single-parents or being a grandparent raising grandchildren.
Parents and caregivers reported that lack of available childcare, services for children with
special needs, and opportunities to teach children more about the Apache culture are also
102016 Needs & Assets Report San Carlos Apache Tribe Regional Partnership Council
challenging aspects of raising young children in the region. Additionally, while some
respondents indicated they liked the programs and activities available for children and families
in their community, other survey participants pointed out that there are not enough programs
and activities for children and families in their community. The differences in opinion in regards
to activity opportunities, community safety, and other issues, are likely due to the fact that
parents and caregivers who participated in the survey reside in different areas of the San Carlos
Apache Region.
Most important things that would improve young children’s lives
The First Things First 2014 Parent and Caregiver Survey also included an item asking parents
what they thought were the most important things that should happen in order to improve the
lives of children and families in the San Carlos Apache Region. The need for parents to be
actively involved in the lives of their children was the most common response to this question.
In relation to parent involvement, a handful of survey respondents stated they felt parenting
classes for parents would be beneficial for the children and families in the community. In
addition to parent involvement, many survey respondents felt that providing children with a
safe environment was very important. More specifically, parents and caregivers felt children
should be given the opportunity to grow up in adequate housing and in an environment free
from violence. Some survey respondents recommended increasing the number of law
enforcement officials in order to increase feelings of security in the community. Survey
respondents also felt that the community would benefit from additional activities for children
and families, including activities where elders could interact with children. Parents and
caregivers also indicated that culture preservation programs were important and needed so
that children could have more opportunity to learn the Apache language and culture.
Additionally, some survey respondents reported feeling that the community would benefit
from more healthcare services and activities that promoted living a healthy lifestyle. Increasing
the number of childcare facilities was also highly recommended by survey takers who indicated
that many families with young children struggle when their children are on waiting lists for
childcare. Other recommendations made by parents and caregivers included: providing more
opportunities for job training and higher education, better/additional transportation services in
the community, providing more areas for children to play, building more playgrounds and parks
or repairing and cleaning-up the playgrounds and parks that already exist. Lastly, some
respondents recommended increasing awareness about the public services and programs that
are available in the community so that community members will know more about the services
that exist and how to access those services.
Communication, Public Information and Awareness
In SFY2016 the San Carlos Apache Regional Partnership Council coordinated the production of
the 2016 Resource Calendar, which provides contact information for all the programs,
departments and agencies providing services to young children in the region. The calendar has
112016 Needs & Assets Report San Carlos Apache Tribe Regional Partnership Council
been distributed to parents in the region and can be accessed online at
http://www.azftf.gov/RC029/Documents/2014_SCA_Resource_Calendar.pdf.
Systems Coordination among Early Childhood Programs and Services
Key informants indicated that an asset in the region is the ability of programs serving young
children to work together in the organization of successful community events such as health
fairs. At the same time, key informants also pointed out that additional collaboration among
service providers and agencies in the region could be enhanced. Information sharing is often a
barrier to collaboration among programs and services in the region.
The San Carlos Apache Regional Partnership Council supports coordination efforts in the region
through its San Carlos Apache Early Childhood Development and Health Collaborative. The
Collaborative brings together representatives from tribal, state and federal programs serving
families in the region. Members meet every other month to exchange information about their
programs, network and strengthen collaborative relationships among them. Services and
programs funded by the San Carlos Apache Regional Partnership Council are also showcased
during the Collaborative meetings. In addition, the Collaborative produces a newsletter that
provides information about their activities, upcoming events and meetings, and also includes
relevant information on various early childhood-related topics. During SFY2016, members of
the Early Childhood Development and Health Collaborative have also engaged in series of
discussion around building the early childhood system in the region.
122016 Needs & Assets Report San Carlos Apache Tribe Regional Partnership Council
The San Carlos Apache Region
Regional Description
When First Things First was established by the passage of Proposition 203 in November 2006,
the government-to-government relationship with federally-recognized tribes was
acknowledged. Each tribe with tribal lands located in Arizona was given the opportunity to
participate within a First Things First designated region or elect to be designated as a separate
region. The San Carlos Apache was one of 10 tribes that chose to be designated as its own
region. This decision must be ratified every two years, and the San Carlos Apache has opted to
continue to be designated as its own region.
The boundaries of the First Things First San Carlos Apache Region are defined to be those of the
San Carlos Apache Indian Reservation. The region covers almost 3,000 square miles in east-
central Arizona. Most of the region lies within Gila and Graham counties, although there is a
small, uninhabited section in Pinal County. The reservation, which was established in 1871, is
divided into four districts: Seven Mile Wash, Gilson Wash, Peridot, and Bylas.
Figure 1 shows the geographical area covered by the San Carlos Apache Region. Additional
information available at the end of this report includes a map of the region by zip code in
Appendix 1, a table listing zip codes for the region in Appendix 2, and a map of school districts
in the region in Appendix 3.
132016 Needs & Assets Report San Carlos Apache Tribe Regional Partnership Council
Figure 1. The San Carlos Apache Region
Source: U.S. Census Bureau (2010). TIGER/Line Shapefiles: TabBlocks, Streets, Counties, American Indian/Alaska Native Homelands. Retrieved
from http://www.census.gov/geo/maps-data/data/tiger-line.html
Data Sources
The data contained in this report come from a variety of sources. Some data were provided to
First Things First by state agencies, such as the Arizona Department of Economic Security (DES),
the Arizona Department of Education (ADE), and the Arizona Department of Health Services
(ADHS). Other data were obtained from publically available sources, including the 2010 U.S.
Census, the American Community Survey (ACS), and the Arizona Department of Administration
142016 Needs & Assets Report San Carlos Apache Tribe Regional Partnership Council
(ADOA). In addition, regional data from the 2014 First Things First Parent and Caregiver Survey
are included.
The U.S. Census 1 is an enumeration of the population of the United States. It is conducted
every ten years, and includes information about housing, race, and ethnicity. The 2010 U.S.
Census data are available by census block. There are about 115,000 inhabited blocks in
Arizona, with an average population of 56 people each. The Census data for the San Carlos
Apache Region presented in this report were calculated by identifying each block in the region,
and aggregating the data over all of those blocks. (Note that the Census 2010 data in the
current report may vary to a small degree from census data reported in previous Needs &
Assets reports. The reason is that in the previous reports, the Census 2010 data were
aggregated by zip code; the current report uses aggregation by census blocks.)
The American Community Survey 2 is a survey conducted by the U.S. Census Bureau each month
by mail, telephone, and face-to-face interviews. It covers many different topics, including
income, language, education, employment, and housing. The ACS data are available by census
tract. Arizona is divided into about 1,500 census tracts, with an average of about 4,200 people
in each. The ACS data for the San Carlos Apache Region were calculated by aggregating over
the census tracts which are wholly or partially contained in the region. The data from partial
census tracts were apportioned according to the percentage of the 2010 Census population in
that tract living inside the San Carlos Apache Region. The most recent and most reliable ACS
data are averaged over the past five years; those are the data included in this report. They are
based on surveys conducted from 2009 to 2013. In general, the reliability of ACS estimates is
greater for more populated areas. Statewide estimates, for example, are more reliable than
county-level estimates.
To protect the confidentiality of program participants, the First Things First Data Dissemination
and Suppression Guidelines preclude our reporting social service and early education
programming data if the count is less than ten, and preclude our reporting data related to
health or developmental delay if the count is less than twenty-five. In addition, some data
1 U.S. Census Bureau. (May, 2000). Factfinder for the Nation. Retrieved from http://www.census.gov/history/pdf/cff4.pdf
2 U.S. Census Bureau (April, 2013). American Community Survey Information Guide. Retrieved from
http://www.census.gov/content/dam/Census/programs-surveys/acs/about/ACS_Information_Guide.pdf
152016 Needs & Assets Report San Carlos Apache Tribe Regional Partnership Council
received from state agencies may be suppressed according to their own guidelines. The
Arizona Department of Health Services, for example, does not report counts less than six.
Throughout this report, information which is not available because of suppression guidelines
will be indicated by entries of “N/A” in the data tables.
A note on the Census and American Community Survey data included in this report
In this report we use two main sources of data to describe the demographic and socio-
economic characteristics of families and children in the region: the U.S. Census 2010 and the
American Community Survey. These data sources are important for the unique information
they are able to provide about children and families across the United States, but both of them
have acknowledged limitations for their use on tribal lands. Although the Census Bureau
asserted that the 2010 Census count was quite accurate in general, they estimate that
“American Indians and Alaska Natives living on reservations were undercounted by 4.9
percent.” 3 In the past, the decennial census was the only accessible source of wide-area
demographic information. Starting in 2005, the Census Bureau replaced the “long form”
questionnaire that was used to gather socio-economic data with the American Community
Survey (ACS). As noted above, the ACS is an ongoing survey that is conducted by distributing
questionnaires to a sample of households every month of every year. Annual results from the
ACS are available but they are aggregated over five years for smaller communities, to try to
correct for the increased chance of sampling errors due to the smaller samples used.
According to the State of Indian Country Arizona Report 4 this has brought up new challenges
when using and interpreting ACS data from tribal communities and American Indians in general.
There is no major outreach effort to familiarize the population with the survey (as it is the case
with the decennial census), and the small sample size of the ACS makes it more likely that the
survey may not accurately represent the characteristics of the population on a reservation. The
State of Indian Country Arizona Report indicates that at the National level, in 2010 the ACS
3U.S. Census Bureau (May, 2012). Estimates of Undercount and Overcount in the 2010 Census.
www.census.gov/newsroom/releases/archives/2010_census/cb12-95.html
4 Inter Tribal Council of Arizona, Inc., ASU Office of the President on American Indian Initiatives, ASU Office of Public Affairs
(2013). The State of Indian Country Arizona. Volume 1. Retrieved from
http://outreach.asu.edu/sites/default/files/SICAZ_report_20130828.pdf
162016 Needs & Assets Report San Carlos Apache Tribe Regional Partnership Council
failed to account for 14% of the American Indian/Alaska Native (alone, not in combination with
other races) population that was actually counted in the 2010 decennial census. In Arizona the
undercount was smaller (4%), but according to the State of Indian Country Arizona Report, ACS
may be particularly unreliable for the smaller reservations in the state.
While recognizing that estimates provided by ACS data may not be fully reliable, we have
elected to include them in this report because they still are the most comprehensive publically-
available data that can help begin to describe the families that First Things First serve.
Considering the important planning, funding and policy decisions that are made in tribal
communities based on these data, however, the State of Indian Country report recommend a
concerted tribal-federal government effort to develop the tribes’ capacity to gather relevant
information on their populations. This information could be based on the numerous records
that tribes currently keep on the services provided to their members (records that various
systems must report to the federal agencies providing funding but that are not currently
organized in a systematic way) and on data kept by tribal enrollment offices.
A current initiative that aims at addressing some of these challenges has been started by the
American Indian Policy Institute, the Center for Population Dynamics and the American Indian
Studies Department at Arizona State University. The Tribal Indicators Project 5 began at the
request of tribal leaders interested in the development of tools that can help them gather and
utilize meaningful and accurate data for governmental decision-making. An important part of
this effort is the analysis of Census and ACS data in collaboration with tribal stakeholders. We
hope that in the future these more reliable and tribally-relevant data will become available for
use in these community assessments.
5 http://aipi.clas.asu.edu/Tribal_Indicators
172016 Needs & Assets Report San Carlos Apache Tribe Regional Partnership Council
Population Characteristics
Why it Matters
The characteristics of families living within a region can influence the availability of resources
and supports for those families. 6 Population characteristics and trends in family composition
are often considered by policymakers when making decisions about the type and location of
services to be provided within a region such as schools, health care facilities and services, and
social services and programs. As a result of these decisions, families with young children may
have very different experiences within and across regions regarding access to employment,
food resources, schools, health care facilities and providers, and social services. It is important,
therefore, that decision-makers understand who their constituents are so that they can
prioritize policies that address the needs of diverse families with young children. Accurate and
up-to-date information about population characteristics such as the number of children and
families in a geographic region, their ethnic composition, living arrangements and languages
spoken can support the development or continuation of resources that are linguistically,
culturally, and geographically most appropriate for a given locale.
In addition to being affected by community resources, the likelihood of a child reaching his or
her optimal development can also be affected by the supports and resources available within
the family. 7,8 The availability of family resources can be influenced by the characteristics of the
family structure, such as who resides in a household and who is responsible for a child’s care.
6U.S. Department of Health and Human Services. Health Resources and Services Administration, Maternal and Child Health
Bureau. (2014). Child Health USA 2014. Population Characteristics. Retrieved from: http://mchb.hrsa.gov/chusa14/population-
characteristics.html
7Center for American Progress. (2015). Valuing All Our Families. Progressive Policies that Strengthen Family Commitments and
Reduce Family Disparities. Retrieved from: https://cdn.americanprogress.org/wp-content/uploads/2015/01/FamilyStructure-
report.pdf
8 Kidsdata.org. (n.d.). Summary: Family Structure. Retrieved from: http://www.kidsdata.org/topic/8/family-structure/summary
182016 Needs & Assets Report San Carlos Apache Tribe Regional Partnership Council
Children living with and being cared for by relatives or caregivers other than parents, is
increasingly common. 9 Extended, multigenerational families and kinship care are more typical
in Native communities. 10,11 The strengths associated with this open family structure -mutual
help and respect- can provide members of these families with a network of support which can
be very valuable when dealing with socio-economic hardships. 12 Grandparents are often
central to these mutigenerational households. However, when caring for children not because
of choice, but because parents become unable to provide care due to the parent’s death,
physical or mental illness, substance abuse, incarceration, unemployment or underemployment
or because of domestic violence or child neglect in the family, grandparents may be in need of
specialized assistance and resources to support their grandchildren. 13
Understanding language use in the region can also contribute to being better able to serve the
needs of families with young children. Language preservation and revitalization have been
recognized by the U.S. Department of Health & Human Services as keys to strengthening
culture in Native communities and to encouraging communities to move toward social unity
and self-sufficiency. 14 Special consideration should be given to respecting and supporting the
numerous Native languages spoken by families, particularly in tribal communities.
9U.S. Department of Health and Human Services. (2012). ASPE Report. Children in Nonparental Care: A Review of the Literature
and Analysis of Data Gaps. Retrieved from http://aspe.hhs.gov/basic-report/children-nonparental-care-review-literature-and-
analysis-data-gaps
10 Harrison, A. O., Wilson, M. N., Pine, C. J., Chan, S. Q., & Buriel, R. (1990). Family ecologies of ethnic minority children. Child
Development, 61(2), 347-362.
11 Red Horse, J. (1997). Traditional American Indian family systems. Families, Systems, & Health, 15(3), 243.
12Hoffman, F. (Ed.). (1981). The American Indian Family: Strengths and Stresses. Isleta, NM: American Indian Social Research
and Development Associates.
13Population Reference Bureau. (2012). More U.S. Children Raised by Grandparents. Retrieved from
http://www.prb.org/Publications/Articles/2012/US-children-grandparents.aspx
14U.S. Department of Health & Human Services, Administration for Native Americans. (n.d.). Native Languages.
http://www.acf.hhs.gov/programs/ana/programs/native-language-preservation-maintenance
19You can also read