Towards User-Centered Active Learning Algorithms
←
→
Page content transcription
If your browser does not render page correctly, please read the page content below
Eurographics Conference on Visualization (EuroVis) 2018                                                                             Volume 37 (2018), Number 3
J. Heer, H. Leitte, and T. Ropinski
(Guest Editors)

                     Towards User-Centered Active Learning Algorithms

                         Jürgen Bernard1,2 , Matthias Zeppelzauer3 , Markus Lehmann1 , Martin Müller1 , and Michael Sedlmair4
                                                                           1 TU   Darmstadt, Germany
                                                                          2 Fraunhofer  IGD, Germany
                                                         3 St. Pölten University of Applied Sciences, St. Pölten, Austria
                                                                      4 Jacobs University Bremen, Germany

        Abstract
        The labeling of data sets is a time-consuming task, which is, however, an important prerequisite for machine learning and visual
        analytics. Visual-interactive labeling (VIAL) provides users an active role in the process of labeling, with the goal to combine
        the potentials of humans and machines to make labeling more efficient. Recent experiments showed that users apply different
        strategies when selecting instances for labeling with visual-interactive interfaces. In this paper, we contribute a systematic
        quantitative analysis of such user strategies. We identify computational building blocks of user strategies, formalize them, and
        investigate their potentials for different machine learning tasks in systematic experiments. The core insights of our experiments
        are as follows. First, we identified that particular user strategies can be used to considerably mitigate the bootstrap (cold
        start) problem in early labeling phases. Second, we observed that they have the potential to outperform existing active learning
        strategies in later phases. Third, we analyzed the identified core building blocks, which can serve as the basis for novel selection
        strategies. Overall, we observed that data-based user strategies (clusters, dense areas) work considerably well in early phases,
        while model-based user strategies (e.g., class separation) perform better during later phases. The insights gained from this
        work can be applied to develop novel active learning approaches as well as to better guide users in visual interactive labeling.
        Categories and Subject Descriptors (according to ACM CCS): I.3.3 [Computer Graphics]: Picture/Image Generation—Line and
        curve generation

1. Introduction                                                                            The success of AL thus heavily relies on the quality and suitability
                                                                                           of the applied selection strategy.
Labeling data objects is a fundamental process in machine learning
                                                                                              Labeling is also frequently required in VA where user feedback
(ML), data mining, and visual analytics (VA). Labeling refers to the
                                                                                           from labeling is exploited to learn and support the user’s informa-
task of attaching a certain attribute to an instance in a data set, such
                                                                                           tion need. In contrast to AL, in VA the selection and labeling of
as a class label, a relevance score, or a similarity judgment with re-
                                                                                           candidates is primarily user-driven, which makes it a user-centered
gard to another instance. The major goals of (interactive) labeling
                                                                                           approach and thus complementary to AL. To bridge the gap be-
are to acquire knowledge from the user to guide the learning pro-
                                                                                           tween AL and VA, previous work has introduced the idea of Visual
cess, to generate “ground-truth” data, and to model the user’s inter-
                                                                                           Interactive Labeling (VIAL) [BZSA17]. VIAL allows for both the
ests and intentions. The labeling of large amounts of data, however,
                                                                                           user and the model to propose candidates for labeling and thereby
is a time-consuming and tedious task. Especially in the presence
                                                                                           combines the strengths of both labeling perspectives into one uni-
of large data sets efficient labeling strategies are required to reduce
                                                                                           fied process.
labeling effort and accelerate learning.
                                                                                              This paper aims at narrowing the gap between AL and VA by
   Active learning (AL) is an ML approach that tries to minimize                           comprehensively studying user-based selection strategies. To this
the amount of human interaction for labeling. To this end, AL em-                          end, we perform an in-depth analysis of ten previously identified
ploys candidate selection strategies that query the user only for                          user-based labeling strategies [BHZ∗ 17]. These strategies comprise
labels of those samples that the ML model will benefit most from.                          different ways of how users go about selecting data points to be
AL is typically a model-centered approach that selects instances                           labeled from a 2D projection (scatterplot) of the data, and were
with respect to the model that should be learned. A limitation of                          found through iterative user experiments. Users for instance se-
AL is that users are not involved in the selection but only in the                         lected points in dense regions or outliers in the scatterplot (data-
labeling of candidate instances. Thereby the potential of exploit-                         based user strategies). Other users took information from the visu-
ing user knowledge (domain knowledge) and the user’s intuition                             alized ML model into account, for instance by selecting instances
in identifying patterns, clusters, and outliers remains underutilized.                     for labeling which are close to intersecting border regions of two

 c 2018 The Author(s)
Computer Graphics Forum c 2018 The Eurographics Association and John
Wiley & Sons Ltd. Published by John Wiley & Sons Ltd.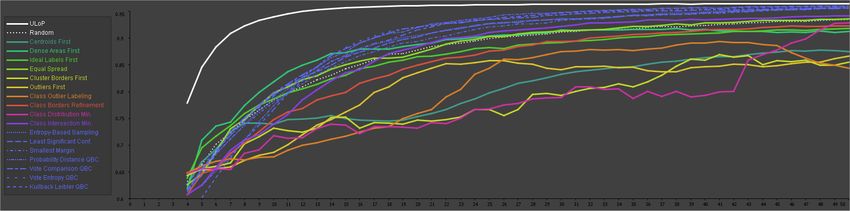
J. Bernard & M. Zeppelzauer & M. Lehmann & M. Müller & M. Sedlmair / Towards User-Centered Active Learning Algorithms

classes (model-based user strategies). While these strategies have         2.1. AL-Centered Labeling Strategies
been identified by observation [BHZ∗ 17], their systematic investi-
gation and formalization has not been performed so far. However,           Active Learning (AL) strategies have been introduced to support
this is important to understand how users actually select candidate        the incorporation of user knowledge into the learning process. In
instances, how such strategies perform, and how knowledge about            AL, an algorithmic model pro-actively asks an oracle (the user)
these methods will support effective labeling. Based on this knowl-        for feedback (labels) to improve the learning model [Set09]. Since
edge novel methods for automated candidate selection in AL may             user interactions are time-consuming, AL aims at minimizing the
be developed as well as advanced user-inspired methods for visual          amount of required user interaction by querying only that infor-
guidance in VA labeling approaches.                                        mation that will most likely best improve the accuracy of the
                                                                           given model. Different classes of AL strategies have been intro-
   We analytically formalize the ten previously observed user              duced [Set09, Ols09, TVC∗ 11, WH11], which we partition into five
strategies for the selection of instances, identify their building         groups: (i) uncertainty sampling, (ii) query by committee, (iii) error
blocks, implement them, and integrate them into an automatic               reduction schemes, (iv) relevance-based selection, and (v) purely
evaluation toolkit. We run simulated labeling experiments with all         data-centered strategies.
strategies on different data sets, analyze their performance, and             Uncertainty sampling aims at finding instances the learner is
compare them with AL strategies. Additionally, we use two base-            most uncertain about. Widely used strategies search for instances
lines to put the performances of all AL and user-based strategies          near the decision boundary of margin-based classifiers [WKBD06,
into context: (i) a random baseline to measure the lower perfor-           TVC∗ 11,SDW01], or measure the entropy of instances’ class prob-
mance limit and (ii) a quasi-optimal selection strategy which al-          abilities [JPP09]. Query by Committee (QBC) [SOS92] strategies
ways selects the best candidate in a greedy fashion (in a supervised       measure the uncertainty of an ensemble of classifiers including the
manner based on ground-truth labels) to provide an upper limit of          assessment of the committees’ disagreement [Mam98, MM04]. Er-
performance (ULoP).                                                        ror reduction schemes focus on the selection of those instances
                                                                           which may change the underlying classification or optimization
   In particular, our experiments seek to answer the following ques-
                                                                           model most. Techniques focus either on the impact on the train-
tions: (i) can we formalize and thereby automate user-based selec-
                                                                           ing error (expected model change) [SCR08] or on the reduction
tion strategies? (ii) can formalized user-based strategies compete
                                                                           of the generalization error (risk reduction [QHR∗ 09], energy re-
with or even outperform existing AL strategies? And beyond this,
                                                                           duction [VBF12], and variance reduction [HJL06]). Relevance-
can we observe patterns and trends that hold across different data
                                                                           based [VPS∗ 02] strategies select those instances which have the
sets and ML tasks and are thus generalizable? (iii) which building
                                                                           highest probability to be relevant for a certain class, e.g., based
blocks are common to the strategies and can they be carved out for
                                                                           on positive examples for a class [WH11]. Finally, there are purely
future use? (iv) can we improve existing labeling algorithms with a
                                                                           data-driven strategies which are independent of the learning model,
better understanding of human labeling behavior, represented with
                                                                           such as density- and diversity-based instance selection [WKBD06,
formalized user strategies and building blocks?
                                                                           BSB∗ 15, BDV∗ 17, DRH06]. Density-based selection of candidates
   This work represents a first step towards user-centered AL algo-        is a promising strategy for initiating an AL process in the case
rithms which may in the future facilitate labeling processes in ML,        when no labels are available at all (cold start problem or bootstrap
VA, and VIAL. In summary, the major contributions are:                     problem) [AP11]. Recently, approaches towards learning candidate
                                                                           selection strategies have been introduced [KSF17]. This requires,
• We propose a formalization and implementation of 10 user                 however, the availability of a series of previous active learning ex-
  strategies to enable a systematic evaluation of user-based visual        periments to draw useful conclusions from it.
  labeling in comparison with AL.
• We break down these 10 user strategies and propose 11 low-level
  algorithmic building blocks that in combination completely for-          2.2. User-Centered Labeling Strategies
  malize the 10 high-level user strategies.
                                                                           User-centered labeling is implicitly used in many interactive visu-
• We present the results of a performance analysis of the 10
                                                                           alization and VA approaches to assign users an active role in the
  user strategies and 9 alternative strategies (AL, upper and lower
                                                                           learning process. For this purpose, visual interfaces are usually pro-
  bound), on four data sets. We investigate the quality of each strat-
                                                                           vided that show the data (or feature space) and the state of the learn-
  egy in selecting useful labels as well as in its capabilities in solv-
                                                                           ing process (ML model), e.g., by applying dimensionality reduction
  ing the bootstrap problem.
                                                                           in combination with scatter plots [BKSS14, SA15, HMdCM17] or
                                                                           by visualizing instances as glyphs arranged by similarity in a 2D
                                                                           spatial layout [BLBC12, BSR∗ 14, BRS∗ 17]. Mamani et al. use an
                                                                           interactive labeling interface to adapt feature spaces, leading to op-
2. Related Work                                                            timized embeddings of image data calculated with dimensionality
                                                                           reduction [MFNP13]. Once the data or feature space is visualized
Related work comes from the different research areas that focus on         adequately, the user is asked to select individual instances and pro-
techniques in the interactive labeling processes: i.e. active learning,    vides the respective labels [BZSA17]. Labels in this context can be
interactive visualization, and the combination of the latter in the        of different type, such as categorical labels [HNH∗ 12], numerical
VIAL workflow. In the following, we briefly review the most im-            labels [BSB∗ 15], relevance scores [SSJK16], as well as labels that
portant approaches and labeling strategies employed in these areas.        represent a relation between two instances (e.g. for learning simi-

                                                                                                                                               c 2018 The Author(s)
                                                                              Computer Graphics Forum c 2018 The Eurographics Association and John Wiley & Sons Ltd.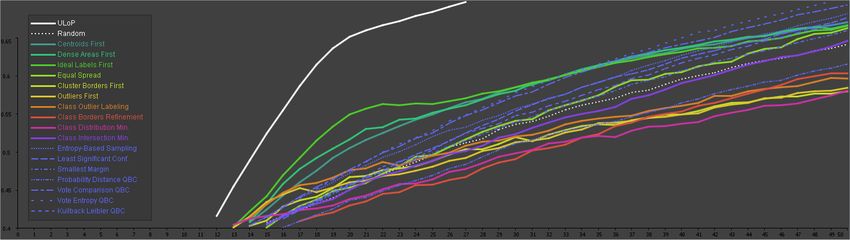
J. Bernard & M. Zeppelzauer & M. Lehmann & M. Müller & M. Sedlmair / Towards User-Centered Active Learning Algorithms

larity and distance measures) [BRS∗ 17]. The type of the data to be                      in interactive labeling experiments where users were presented a
labeled differs among recent studies.                                                    2D projection of the original feature space [BHZ∗ 17]. Unlabeled
                                                                                         items were represented as data points (crosses) while for labeled
   Bernard et al. propose an approach where users play an active
                                                                                         items the class label was shown. To visualize class information and
role in selecting data instances and assigning numerical well-being
                                                                                         the state of the iteratively learned classifier, different visualization
scores for medical data to calculate regression models [BSB∗ 15].
                                                                                         techniques were used, such as convex hulls and butterfly plots.
Höferlin et al. [HNH∗ 12] propose a system that facilitates inter-
active classification of surveillance videos with user input based                          The identified user strategies form two groups: data-based
on relevance feedback for video subsequences. A visual-interactive                       strategies, where the user focused mostly on the data itself and its
and user-driven search system for text documents is presented by                         distribution as well as model-based strategies where the user rather
Heimerl et al. [HKBE12], allowing users to label relevant and non-                       focused on class characteristics such as predicted boundaries, e.g.,
relevant documents to improve the quality of a retrieval compo-                          depicted as convex hulls. Different visualizations inspired different
nent. In a system for interactively labeling human motion capture                        strategies. As convex hulls of different classes may overlap, strate-
data, users can select and label human gestures to build a classi-                       gies trying to reduce this overlap were observed (e.g. “Class Inter-
fier [BDV∗ 17], visually guided by data- and model-centered ML                           section Minimization” and “Class Borders Refinement”). Finally,
support. A more general approach for the labeling of time series                         “Ideal Labels First” is driven by the content of individual instances
data has been introduced by Sarkar et al. [SSBJ16], including clus-                      while the remaining strategies primarily focus on structural infor-
tering techniques for pattern detection and user guidance. Finally,                      mation of the data and the class predictions. Note further that “Ideal
the user-centered selection and labeling of instances was applied                        Labels First” in contrast to all other strategies requires as input one
to learn similarity models for mixed data [BSR∗ 14]. In addition,                        representative instance for each class and is thus not completely
the authors reflect on a series of pitfalls for the design of labeling                   unsupervised.
approaches.
   Although the latter approaches enable the user to select instances                    3.2. Building Blocks
and learn models from the provided labels, they do not investigate
strategies that motivate users to select certain instances in a pro-                     We systematically investigated the individual user-based strategies
vided visualization. To the best of our knowledge, this area has                         and identified basic recurring units (building blocks) that are shared
gained very little attention so far. Seifert and Granitzer [SG10] were                   between strategies. In total, we identified 11 building blocks that
the first that sought to simulate and formalize user-picking strate-                     form a minimal and complete set of blocks necessary to implement
gies such as selection. In a small-scale, initial study, they used a                     the 10 user strategies. In the following, we describe and specify
star coordinate interface to illustrate the potentially large impact                     formally the individual blocks.
of combining active and user-based learning strategies. Bernard et                          To define the building blocks, we use the following notation. Let
al. [BHZ∗ 17] built on this initial study and investigated user-based                    Vc be the set of all (unlabeled) candidate feature vectors and Vt the
and AL strategies in more details in an experimental user study.                         set of all already labeled training feature vectors. The entire data
In an experiment, the authors identified 10 different user strategies                    set is then V = Vc ∪Vt . To measure distances between instances of
for the selection of candidate instances, observed during three user                     V we define a distance function as d : V ×V → R. Furthermore, we
tasks followed by interviews. Users were asked to label instances in                     define a subset T with T ⊆ Vc which represents an arbitrary subsets
a scatterplot visualization based on dimensionality reduction. Dif-                      of Vc † . Variable x ∈ Vc refers to a candidate instance from Vc in our
ferent coloring and convex hull techniques were used to depict data                      notation and is represented by a feature vector of potentially high
and classifier characteristics and thus support users in the selection                   dimension in the feature space of V . Predicted labels of individual
of candidates. In this paper, we formalize, implement, and system-                       instances are referred to as y0 and stem from the set of possible class
atically evaluate these strategies.                                                      labels yi ∈ Y with n = |Y | is the number of classes. The identified
                                                                                         building blocks are defined the following.
3. Formalization of User Strategies
                                                                                         Nearest Spatial Neighbors (NSN) retrieves instances in the
We build upon the 10 strategies of Bernard et al. [BHZ∗ 17]. After                       neighborhood of a candidate instance, allowing the assessment
briefly reiterating on them (Section 3.1), we present how we broke                       of local data characteristics around it. It can be implemented in
down these strategies into recurring fundametal building blocks                          a straight-forward manner based on k-nearest neighbor (kNN)
(Section 3.2). We then use these building blocks to formalize the                        search. Let v1 , ..., vn be an ordering of instances v ∈ S ⊆ V with x ∈/
10 user strategies algorithmically so that they can be implemented                       S, such that d(x, v1 ) ≤ ... ≤ d(x, vn ). Then the k-nearest neigbors of
for computational uses (Section 3.3). The intuition behind this ap-                      instance x are represented by function: kNN(x, S, k) = {v1 , ..., vk }.
proach is to integrate the users’ abilities to identify patterns directly                Note that alternatively, the neighborhood around instance x can be
into automatable labeling algorithms. This allows to simulate how                        specified by defining a radius (orbit epsilon) around x.
humans go about labeling data and to compare the user strategies
to alternative strategies such as those from AL (see Section 4).                         Spatial Balancing (SPB) tries to locate instances in so far undis-
                                                                                         covered areas of the feature space and thereby tries to uniformly
3.1. Background
Table 1 (left side) summarizes the 10 user strategies which repre-                       † Note that the definition of building blocks on a subset makes their defini-
sent the basis for our further analysis. The strategies were observed                    tion more general which is beneficial for reuse and flexible combination.

 c 2018 The Author(s)
Computer Graphics Forum c 2018 The Eurographics Association and John Wiley & Sons Ltd.
J. Bernard & M. Zeppelzauer & M. Lehmann & M. Müller & M. Sedlmair / Towards User-Centered Active Learning Algorithms
Strategy Illustration Description Formalization
Name Details about the strategies In terms of building blocks from Section 3.2.
Equal Spread Users prefer to label instances in unlabeled areas, The implementation builds upon Spatial Bal-
data-based i.e., far away from other labeled instances, to dis- ancing (SPB) which identifies instances with
tribute labels uniformly across the data. maximum distances to the already labeled in-
stances.
Dense Areas Users prefer to label instances located in dense re- This strategy combines a spatial Density Es-
First gions in the feature space. In contrast to centroid- timator (DEN) with Spatial Balancing (SPB),
data-based based strategies instances do not have to be at the we weight both building blocks equally
center of a dense region. (50%:50%).
Centroids Similar to “Dense Areas First” but users prefer to This strategy combines a Clustering (CLU)
First label instances located at cluster centers uniformly algorithm with Spatial Balancing (SPB),
data-based across the feature space. we weight both building blocks equally
(50%:50%).
Cluster Bor- Users prefer to label instances located in the bor- Applies a Clustering (CLU) algorithm first.
ders First der regions of clusters. These areas may potentially Then, for every cluster, an Outlier Detection
data-based represent class boundaries and thus may contain (OUT) algorithm is combined with Spatial
relevant instances for labeling. Additionally, candi- Balancing (SPB), we weight both building
dates should be spread across the feature space. blocks equally (50%:50%).
Outliers First Users prefer to label instances located in sparsely This strategy combines an Outlier Detec-
data-based populated regions, i.e. outliers in different areas tion (OUT) algorithm with Spatial Balancing
across the feature space. This strategy is used to la- (SPB), we weight both building blocks equally
bel potentially untypical instances of a class. (50%:50%).
Ideal Labels The user selects instances for labeling she believes This strategy combines the Ideal Instance
First are most characteristic for a class, by comparing in- Identification (III) building block with Spatial
data-based stances to an a priori given example instance, which Balancing (SPB), we suggest to weight both
is typical for the class. We refer such typical in- building blocks equally (50%/50%).
stances to as “ideal instances”.
Class Bor- Users try to refine the spread of class boundaries in This strategy uses the results of a classifier (CL
ders Refine- regions with overlapping class borders (in the low- and CP) and then applies Local Class Diver-
ment dimensional representation of the data). sity (LCD) assessment to emphasize border re-
model-based gions.
Class Outlier Users select instances for labeling that are far away This strategy applies classification (CL and
Labeling from the class center. Referring to convex hull visu- CP) first. The individual predicted class distri-
model-based alizations of class borders such outliers are salient butions are assessed with an Outlier Detection
spikes of the hull polygon. (OUT) algorithm.
Class Distri- Users try to minimize the area covered by an indi- This strategy applies classification (CL and
bution Mini- vidual class distribution. This can, e.g., be achieved CP) first. Compactness Estimation (CE) assess
mization with instances that probably help to reduce the size the compactness of each class; distances to
model-based of the convex hull or another visualization of class the class centroid allow weighting of instances
boundaries. within each class.
Class In- Users try to minimize areas where classes intersect This strategy applies classification (CL and
tersection (e.g. represented by convex hulls in scatterplots). CP) first. Then Local Class Separation (LCS)
Minimization Counting the number of overlapping convex hulls retrieves the Nearest Spatial Neighbors (NSN)
model-based is one means to assess class intersection. per class and assesses the degree of class sep-
aration.
Table 1: Ten user strategies from a previous experiment [BHZ∗ 17]. The strategies can be partitioned into data-based and model-based
strategies. The data in the original study was represented with dimensionality reduction in a 2D scatterplot. Class boundaries in model-
based strategies were visualized among others by convex hulls of the labels predicted by the underlying classifier.
c 2018 The Author(s)
Computer Graphics Forum c 2018 The Eurographics Association and John Wiley & Sons Ltd.J. Bernard & M. Zeppelzauer & M. Lehmann & M. Müller & M. Sedlmair / Towards User-Centered Active Learning Algorithms
distribute the labeling candidates across the space. For each sam- In a second step, this building block estimates the rele-
ple x ∈ Vc first the minimum distance B to the labeled samples vance of any instance x ∈ Vc with respect to the set of rep-
t ∈ Vt is determined: B(x) = mint∈Vt d(x,t). Second, the sample x resentative instances. The score for an instance x is the mini-
with maximum distance to a labeled sample is selected: SPB(Vc ) = mal distance to one of the “ideally” labeled instances: III(x) =
argmaxx∈Vc (B(x)). minu∈{v∈V :U(v)=1} d(x, u).
Clustering (CLU) partitions a set of instances into disjoint groups Class Likelihood (CL) represents the likelihoods l provided by
or clusters C1 , ..,Cn of similar instances. Clustering provides a a given (pre-trained) classifier for an unlabeled instance x as:
meta-structure on the original data and is a common building CL(x) = l, with l ∈ R|Y | is a vector of probabilities for each of
block for several selection strategies where it facilitates the selec- the classes in Y .
tion of candidates at e.g. cluster centroids, cluster border areas,
or at spatially close clusters. Clustering can be implemented in Class Prediction (CP) estimates the most likely class y0 for set of
many different ways [Jai10]. To stay general we define a generic class predictions l: y0 = CP(x) = argmax(CL(x)).
clustering function CLU on the set of unlabeled instances Vc as:
CLU(Vc ) = min( fcost ({C1 , ...,Cn })) such that all instances are as- Local Class Diversity (LCD) assesses the diversity of class pre-
signed to exactly one cluster, i.e., ∀x ∈ T : ∃Ck : x ∈ Ck and dictions in the neighborhood of an instance x. Thus, each in-
∀x ∈ T : (x ∈ Ck ∧ x ∈ Cl ) =⇒ k = l. Function fcost represents the stance needs to have a most likely class y0 assigned by a classi-
cost function to be minimized during clustering. fier. Given an instance x and a class label yi ∈ Y , we can compute
the portion pi of neighbors with the class prediction y0 = yi as:
|{v∈kNN(x,Vc ,k):CP(v)=yi }|
Density Estimation (DEN) identifies maximally dense areas in pi (x, yi ) = k . The local class diversity can
the feature space. It can be used to select instances that seem typi- then be estimated by a diversity measure div as follows: LCD(x) =
cal for the data set and that have many similar neighbors. Density div(p), where p is the vector of all portions pi for the n classes:
estimation is defined by a scoring function DEN(x) = scoreDEN (x) p = (p1 , .., pn ). The entropy of p is one possible realization of func-
which is applied to all instances x ∈ Vc to find candidates in tion div.
maximally dense areas. Density can be estimated by different ap-
proaches, such as averaging the distances to the k-nearest neighbors Local Class Separation (LCS) is similar to Local Class Diver-
d(x,v)2 sity but estimates how well the predicted classes around a given
of x: scoreDEN (x) = − ∑v∈kNN(x,V,k) k
instance are separated from each other. It can be used to iden-
tify regions with high class uncertainties. We define this build-
Outlier Detection (OUT) In contrast to density estimation
ing block based on subsets Ci , i = 1, .., n, which are the k-nearest
(above), outlier detection tries to find instances in sparsely popu-
neighbors of instance x found for each of the n classes: Ci =
lated regions. It can be used to select instances with untypical char-
kNN(x, {v ∈ V : CP(v) = yi }, k). Local Class Separation LCS is
acteristics and helps to better sample the variability that exists in the
then defined as a separation function fsep over all subsets Ci :
data and its classes, respectively. Outliers can be identified by using
LCS(x) = fsep (C1 , ..,Cn ). Such a scoring function could be based
different outlier scoring functions: OUT (T ) = {scoreOUT (v, T ) ≥
on Dunn-like indices [Dun74], the Davies-Bouldin Index [DB79],
t : v ∈ T }, where t ∈ R is a decision threshold. Outlier detection
or Silhouettes [Rou87].
methods can be partitioned into classification-based, clustering-
based, nearest neighbor, and density-based [KN98] approaches. A
straight-forward implementation would be to use the negative den- 3.3. Formalized User Strategies
sity scoreOUT (v, T ) = −DEN(v).
Having identified the building blocks from Section 3.2, we can
now formalize the user strategies from Section 3.1. To implement
Compactness Estimation (CE) determines the compactness of
the user strategies, we first implemented the underlying building
groups of instances. Groups may be clusters obtained from cluster-
blocks. For implementation details, we refer the interested reader
ing or sets of instances with the same predicted class. This mea-
to the supplemental material. In a next step, we constructed the
sure can be used to favor instances for labeling in either com-
original user strategies from the building blocks according to the
pact or spatially distributed groups. A compactness function has
formalizations in Table 1 (column “Formalization”). To better un-
the following general signature: CE(T ) = scoreCE (T ). A typi-
derstand how the implementation was performed, consider the ex-
cal realization of CE is the variance of the instances in a group:
ample of “Centroids First” strategy. “Centroids First” focuses on
CE(T ) = |T1 | ∑ (d(x, mi ))2 , where mi is the average of the group.
x∈T cluster centers on the one hand and thus requires building block
“Clustering”. On the other hand, users at the same time tried to
Ideal Instance Identification (III) requires a set of representative select and label centroids spatially distributed, i.e. from previously
instances as input which a user considers “ideal” for certain classes. unlabeled clusters before re-visiting already labeled clusters, which
This makes it structurally different from the other building blocks. refers to “Spatial Balancing”. The scores of both building blocks
It requires the user first to specify which instances are considered can be combined by taking their average. The result is a strategy
ideal. This can be formalized as follows. The function U specifies that selects cluster centers which are distributed across the entire
which samples are considered ideal (by the user in the loop): space. In all cases where several building blocks are used to vote
( for instances, we use equal weights to keep the number of free pa-
1, if x is considered ideal by the user rameters in the evaluation limited. Other weightings will be subject
U(x) =
0, otherwise to future work.
c 2018 The Author(s)
Computer Graphics Forum c 2018 The Eurographics Association and John Wiley & Sons Ltd.J. Bernard & M. Zeppelzauer & M. Lehmann & M. Müller & M. Sedlmair / Towards User-Centered Active Learning Algorithms
4.1. Candidate Selection Strategies
DEN
OUT
NSN
CLU
LCD
LCS
SPB
CE
CL
CP
III
Building Blocks → Overall, we conduct performance analysis for 19 strategies, with
User Strategy ↓ an emphasis on comparing 10 user strategies with each other and
Equal Spread x to compare them to 7 AL strategies and two baselines (upper and
Dense Areas First x x x lower limit of performance).
Centroids First x x
10 User Strategies. We implemented the 10 user strategies ac-
Cluster Borders First x x
cording to the formalization described above (in Java on a stan-
Outliers First x x
dard desktop computer). We use kMeans for the CLU building
Ideal Labels First x x x x
block (k = label cardinality), the number of instances to be re-
Class Borders Refinement x x x
trieved with nearest neighbor operations (NSN, DEN, LCD, LCS)
Class Outlier Labeling x x x
is min(max(5;Vc × 0.05); 50). CLS adopts the Silhouettes Index
Class Distribution Min. x x x
[Rou87] for cluster/class separation, Entropy [Sha48] is used to
Class Intersection Min. x x x x x
measure diversity (LCD). To simulate our experiments, we ap-
Table 2: Mapping between user strategies and building blocks. ply the user strategies in the original feature space (instead of in
Most user strategies build upon two or more building blocks. From the projected low-dimensional space). This allows the formalized
a building blocks’ perspective Spatial Balancing is included in strategies to fully exploit the potential of high-dimensional data
six user strategies, Nearest Spatial Neighbor, Density Estimation, structures, and allows for a fair comparison to AL and baseline
Class Likelihood and Class Prediction in four. strategies that operate in the same space.
7 Active Learning (AL) Strategies. We integrate 7 AL strate-
gies into the experiments aiming for robustness, generalizabil-
ity, and variability. Techniques include Smallest Margin [SDW01,
Table 2 shows the exact mapping between building blocks and WKBD06], Entropy-Based Sampling [SC08], Least Significant
strategies and shows which blocks contribute to which strategies Confidence [CM05] representing simple, fast, and frequently ap-
and beyond this, which blocks appear how often and are thus of par- plied uncertainty sampling strategies [Set12]. In addition, Aver-
ticular importance. “Spatial Balancing” for example appears most age Kullback Leibler Divergence [MN98], Probability Distance
often. Nine of ten user strategies build upon combinations of build- (distance of classifiers’ likelihoods), Vote Comparison (diversity
ing blocks. Only the “Equal Spread” consists of a single block of predicted labels), and Vote Entropy [Sha48, DE95] build the
(“Spatial Balancing”). Furthermore, the table reveals which user set of Query-By-Committee (QBC) [Mam98] strategies. AL tech-
strategies share similar blocks and are thus similar, e.g. “Cluster niques based on error/variance reduction are computationally ex-
Borders First” and “Class Borders Refinement” or “Class Distri- pensive [Set12] as classifiers need to be trained for every instance
bution Minimization” and “Class Intersection Minimization”. The and iteration. Hence, we do not include these AL techniques since
representation in Table 2 further shows which combinations of they do not allow interactive execution [MPG∗ 14].
building blocks are used by previously identified strategies. Finally, 2 Baseline Strategies. We also include a lower and upper-bound
we note that, the set of possible building blocks may be much larger baseline. As the lower bound, we use a series of trials conducted
than the 11 building blocks needed to formalize the investigated with randomly selected instances (Random Baseline). As an upper
user strategies. This set opens up a design space for novel strate- bound, we pre-compute the quasi optimum performance that can
gies not yet observed. be achieved by always selecting the instance with a maximum per-
formance gain. A simple algorithm that fulfills this criterion is a
Greedy search using the ground truth data (Upper Limit of Perfor-
4. Experiments & Results mance ULoP). In every iteration, the algorithm trains and tests the
model for every single candidate instance, and finally chooses the
After having formalized the user strategies, we now can algorithmi- winning instance. Note that Random Baseline and ULoP are ad-
cally compare different labeling strategies. Our overall goal was to ditional strategies allowing the comparison and assessment of per-
investigate the different performances of the 10 user strategies for formance [Caw11]. Neither Random Baseline nor ULoP are user
different classification tasks, compared to AL algorithms as well as strategies and thus, do not consist of the building blocks described
to lower and upper bound baselines. In addition, we investigate the in Section 3.2.
performance of the individual building blocks based on the perfor-
mance of the user strategies. We broke down the analysis into the
following three research questions: 4.2. Data Sets
The concrete results of the experiment depend on the data set of
• RQ1 How well do the 10 formalized user strategies perform in choice. We thus compare the strategies with different data sets, se-
the very early bootstrap phase of the labeling process; compared lected according to the following considerations:
to lower and upper baselines, as well as AL strategies?
• RQ2 How well do these strategies perform after the bootstrap- • Numerical attributes/features
ping phase when at least one instance per class was labeled? • A size of at least several thousand instances
• RQ3 How do the low-level building blocks contribute to the per- • Public availability
formance of the user strategies under different conditions? • Intuitiveness, wide distribution in research community
c 2018 The Author(s)
Computer Graphics Forum c 2018 The Eurographics Association and John Wiley & Sons Ltd.J. Bernard & M. Zeppelzauer & M. Lehmann & M. Müller & M. Sedlmair / Towards User-Centered Active Learning Algorithms
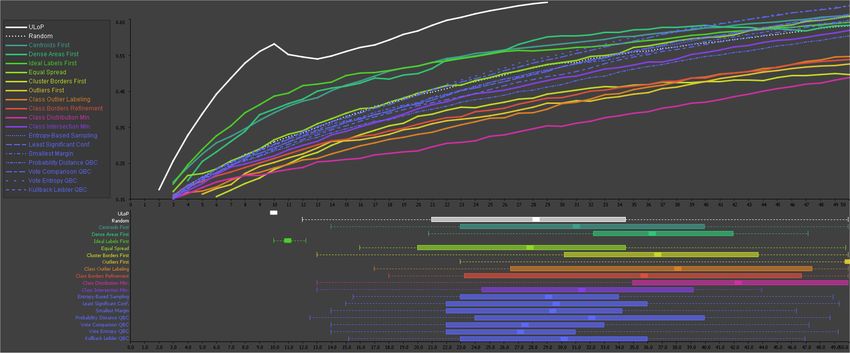
Figure 1: Average performance of strategies in the first 50 iterations of the labeling process (MNIST data set). Most data-based user strategies
perform particularly well in the very first iterations (Ideal Labels First, Centroids First, Dense Areas First). Most model-based user strategies
perform below Random. Focusing on the distinction between density-based and outlier-based strategies, the density-based strategies perform
particularly well, while outlier-based strategies perform poorly. The performance of AL strategies is rather low at start, but increases with
more iterations. Boxplots at the bottom show the distribution of the iteration numbers when strategies produced at least one label for each
class. The Ideal Labels First strategy visits all class labels remarkably early (all 10 labels in 11 iterations on average), thus, it uses the set
of a-priori given ideal representatives as expected. Model-based strategies require more iterations to see each label at least one time. As a
general rule, strategies with good accuracies also visited every class label earlier. We conclude that data-based strategies are better suited to
tackle the bootstrap problem than the other strategies. At the beginning of the labeling process the class boundaries generated in model-based
strategies seem to be less expressive (i.e. they may jump around chaotically) and thus it is more robust to go for data and structure.
Finally, we aimed at covering a broad range of data-based charac- tains transactions of credit cards recorded in Europe in two days in
teristics, such as (1) binary classification versus multi-class classi- September 2013. Overall, 492 frauds are included in the 284,807
fication, (2) equally-balanced label distribution versus unbalanced transactions (0.172%), we use the data set to assess a highly un-
distribution, (3) proof-of-concept versus real-world complexity, as balanced classification problem. The data consists of 28 numerical
well as (4) few versus many outliers. These considerations led features; many instances have a tendency to be outliers.
us to four data sets. The supplemental material contains a de-
tailed overview of the data sets including visualizations of low-
dimensional projections. 4.3. Data Analysis
Handwritten Digits The MNIST data set [LBBH98] perfectly We use classification accuracy as the main dependent measure
meets all requirements to the data. It consists of thousands of raw for our performance comparisons of balanced data sets (percent-
images showing handwritten digits, each represented by a 28x28 age of correctly predicted instances compared to ground truth data
image (784 dimensional vector). For faster classification, we use a [FHOM09]). For unbalanced data sets we compute the class-wise
descriptor that extracts slices in horizontal, vertical, and diagonal f 1 measure from recall and precision [SWY75] and average the
direction, yielding feature vectors with 42 numerical dimensions. f 1 scores over all classes (in a macro averaging fashion). We mea-
sure performances each time a new instance has been selected by a
IRIS The IRIS data set [Lic13] does not fulfill the criterion of certain strategy for labeling, and in doing so, observe how perfor-
thousands of instances, rather it consists of three classes with 50 mance changes over the labeling process. For our experiments, we
instances each. However, we consider IRIS as a low-dimensional use 50 labeling iterations. The labels are set automatically accord-
and easy to interpret proof-of-concept dataset. ing to the ground truth that we have for all our data sets. We average
Gender Voices The Gender Recognition by Voice data the results of an ensemble of classifiers to achieve robust predic-
set [Bec16] contains acoustic properties of voices to identify the tions, including Naive Bayes [DHS∗ 73], Random Forest [Bre01]
gender of speakers. This data set consists of 3,168 instances which (RF), Multilayer Perceptron [HSW89] (MP), and Support Vector
are pre-processed by acoustic analysis with an analyzed frequency Machine [CV95] (SVM).
range of 0-280 Hz. The outcome is a 21 dimensional vector of
We examine the performance of iterative labeling with 19 strate-
acoustic properties; many instances have a tendency to be outliers.
gies (cf. Section 4.1) with all four data sets (cf. Section 4.2).
Fraud Detection The Credit Card Fraud data set [PCJB15] con- All strategies are executed in an automated batch process. To
c 2018 The Author(s)
Computer Graphics Forum c 2018 The Eurographics Association and John Wiley & Sons Ltd.J. Bernard & M. Zeppelzauer & M. Lehmann & M. Müller & M. Sedlmair / Towards User-Centered Active Learning Algorithms
Building Block MNIST IRIS GEND. FRAUD Building Block MNIST IRIS GEND. FRAUD
Nearest Spatial Neighb. ++ ++ ++ + Nearest Spatial Neighb. ++ + + ++
Spatial Balancing ++ ++ ++ ++ Spatial Balancing ++ + ++ –
Clustering ++ ++ ø ++ Clustering ++ + –– ––
Density Estimation ++ ++ ++ ø Density Estimation ++ + ++ ++
Outliers Detection –– –– – + Outliers Detection – ø –– –
Compactness Estim. –– ø –– – Compactness Estim. –– + –– ––
Ideal Instance Ident. ++ ++ + – Ideal Instance Ident. ++ + + –
Class Likelihood – ø ø + Class Likelihood ø ++ – ++
Class Prediction – ø ø + Class Prediction ø ++ – ++
Local Class Diversity – –– – + Local Class Diversity –– – – –
Local Class Separation ø ø ø + Local Class Separation – + – ++
Table 3: Analysis of the bootstrap phase at the granularity of build- Table 4: Analysis of building blocks after the bootstrap. The perfor-
ing blocks. The performance of building blocks (implemented in mances of building blocks differ from Table 3, e.g, blocks capturing
user strategies) is depicted with discrete ordinal scores from very model characteristics show a stronger potential for the later phases
bad to very good ( – – , – , ø , + , ++ ). Blocks employing of the labeling process (Class Prediction, Class Separation). Data
data characteristics help to tackle the bootstrap problem. characteristics are still beneficial for the labeling performance.
achieve robust results the calculation of each strategy is repeated
50 times [KCH∗ 17]. The order of candidate instances is random- data sets. First, data-based strategies (Centroids First, Dense Ar-
ized in each trial with a constantly incrementing seed, in order to eas First, Ideal Labels First) show particularly good performances
have distinct and reproducible repetitions. in the very early phase of the process. Furthermore, Ideal Labels
To analyze these results, we use superimposed line-charts that First manages to visit every available class label considerably ear-
depict the strategies’ performance progressions over the labeling lier than Random and AL. We infer that data-based strategies are a
process. The large number of trials allows for robust average per- valuable means to tackle the bootstrap problem. However, in the un-
formance curves for the strategies. To keep the number of colors balanced FRAUD dataset these strategies failed; we assume that the
manageable, we use dashed lines to distinguish ULoP and Random strategies predominantly selected instances of the dominating class
Baseline, and the AL strategies. The ULoP and Random baseline while neglecting the smaller class leading to a weak performance.
are white; AL strategies are blue; and user strategies have categor- Second, most model-based strategies approximately perform at the
ical colors from green to purple (data-based to model-based). pace of AL and Random in early iterations. Model-based strategies
seem to be less appropriate to address the bootstrap problem. Third,
Finally, we assess the performance of individual building blocks. labeling outliers or border regions (Outliers First, Cluster Borders
To that end, we use the mapping of building blocks to formalized First, Class Outliers) cannot compete with Random and AL in most
user strategies depicted in Table 2 as a basis. To assess the perfor- cases and seem to be unsuitable for very early labeling passes.
mance of a building block, we are interested in the maximum per-
formance a building block can provide. Thus, we assess the max- The result is also reflected in Figure 1 (MNIST). For data-based
imum performance within a set of user strategies which all imple- strategies, we observe a steep increase from the start, which flattens
ment a particular building block. We use a discrete ordinal scale to out after about 20 iterations. AL strategies start to outperform data-
depict the performance of building blocks ( – – , – , ø , + , based strategies beginning with the 35th iteration. Surprisingly, be-
++ ), ranging from very bad to very good. fore this point Centroids First, Dense Areas First, and Ideal Labels
First strongly outperform AL strategies. Interestingly, Ideal Labels
First is the best strategy to visit each class as soon as possible (see,
4.4. Results e.g., the boxplot in Figure 1). This raises the question how future
VIAL approaches may provide good overviews of the candidates
4.4.1. RQ1 : Analysis of the Bootstrap Problem
data to allow labeling ideal labels at first. In this connection, the
The first part focused on the bootstrap (cold start) problem which is notion of “ideal” may also be subject to semantical meanings or
well-known in machine learning field. The challenge here is to start subjective judgment.
the learning in the very first phase without any labels at all [MN98].
Implications of Building Blocks We reflect on the results of the
We are interested in strategies that are able to cope well with the
user strategies and bring the analysis to the granularity of building
bootstrap problem, i.e. that sample at least one item of each class
blocks (RQ3 ). A compact overview of the building-blocks’ perfor-
as early as possible in the labeling process. This is essential for the
mances is presented in Table 3. The analysis of the bootstrap per-
performance of further learning progression.
formance reveals the following insights. First, data-based building
User Strategies Figure 1 shows the result of the MNIST data set. blocks perform particularly well. Second, cluster and density-based
Figures with results for the remaining three data sets are provided support is more valuable than outlier detection. Third, model-based
in the supplemental material. We start the result analysis with three building blocks can compete with data-based building blocks in the
generalizable patterns, each occurred in at least three of the four outlier-prone FRAUD data set.
c 2018 The Author(s)
Computer Graphics Forum c 2018 The Eurographics Association and John Wiley & Sons Ltd.J. Bernard & M. Zeppelzauer & M. Lehmann & M. Müller & M. Sedlmair / Towards User-Centered Active Learning Algorithms
Figure 2: Average performance of strategies after the initialization with one labeled instance per class (MNIST data set). The ULoP still
outperforms remaining strategies significantly. Three data-based user strategies (Centroid First, Dense Areas First, Ideal Labels First)
perform considerably good at start. AL strategies start at a moderate level, but achieve particularly good performances in later phases.
Using the aforementioned data-based user strategies and the AL strategies, we assess a break-even point in the performance at the 35th
iteration. Class Intersection is at random level, remaining model-based strategies perform below Random. In general, data-based strategies
with a focus on dense areas perform particularly well.
4.4.2. RQ2 : Performance Comparison after Bootstrap formance. We hypothesize that these strategies may have their
strengths in very late phases of the labeling process when robust
We investigate the performance of all strategies in the phase of
class boundaries have been found which just have to be further re-
the labeling process after bootstrapping is solved. For this purpose
fined. We further observe that outliers in the GENDER voice data
the bootstrap problem is resolved in advance with an initial set of
set strongly degrade the performance of Centroids First. Another
instances including one training label per class. Thus, all strate-
problem observed for data-based strategies is caused by unbalanced
gies start with the same representatives. One core question is how
label distributions. The comparatively weak performance may orig-
model-based strategies that intrinsically suffer from the bootstrap
inate from clustering, i.e., both clusters (in case of a binary classifi-
problem will perform in this later phase, compared to the remain-
cation problem) may be located in regions of the same, dominating
ing strategies. Again, we evaluate all strategies on all data sets.
class (observed for the FRAUD data set, depicted in the supple-
User Strategies Figure 2 shows the result of the MNIST data mental material).
set, Figure 3 provides insight about the GENDER voice data set.
Implications of Building Blocks Again we analyze the indi-
Figures of the results for the two remaining data sets are provided
vidual building blocks (RQ3 ) and observe interesting patterns in
in the supplemental material.
the results, see Table 4. First, algorithms focusing on data char-
We identify three generalizable aspects. First, some data-based acteristics (Nearest Spatial Neighbors, Spatial Balancing, Cluster-
strategies still tend to outperform the performance of model-based ing, Density Estimation) are in particular valuable for this particular
and AL strategies at the beginning. However, the performance of phase of the labeling process. Second, the analysis of outliers seems
data-based strategies heavily depends on the characteristics of the less relevant in this phase. Third, model-based building blocks in-
data and the labeling task. AL strategies are more robust than data- dicate their potentials and may be more tightly coupled with build-
based strategies and start to surpass the performance of the latter ing blocks used in AL. From a data set perspective, we identify
in the course of the labeling process (MNIST: 35th iteration, IRIS problems for GENDER voice and FRAUD. Clustering in particular
5th iteration, GENDER voice: 14th iteration). The in-depth inves- suffered from outliers and class imbalance.
tigation of identifying sweet spots where labeling should automati-
cally switch to AL strategies may be an interesting subject to future
5. Discussion and Future Work
research. Second, the performance of Class Intersection Minimiza-
tion is the best-performing model-based strategy in all four data Our experiments provide an in-depth analysis of different user-
sets. Still, Class Intersection Minimization does not outperform based candidate selection strategies. The long-term goal of our
most AL strategies. Third, we observe that model-based strategies work is twofold. First, the development of better AL algorithms
are more robust to outliers. that also include user-centered aspects. Second, the use of these
algorithms for better guidance of users in future visual-interactive
We make a specific finding when observing the very small IRIS
labeling systems. During our experiments, we identified a number
data set: the performance of Centroids First and Dense Areas First
of issues relevant to the realization of our goal and which we dis-
decreases considerably after 20 iterations. We assume that small
cuss in the following.
data sets do not require labeling many centroid-like instances. It
is even possible that there are no centroid-like instances left in From User Strategies to Parameterizable Building Blocks.
the candidate set. Figure 2 confirms another insight: instances be- The implementation of the identified building blocks requires the
ing outliers or located in border regions contribute less to the per- specification of a number of parameters and choices to be made,
c 2018 The Author(s)
Computer Graphics Forum c 2018 The Eurographics Association and John Wiley & Sons Ltd.J. Bernard & M. Zeppelzauer & M. Lehmann & M. Müller & M. Sedlmair / Towards User-Centered Active Learning Algorithms
Figure 3: Average performance of strategies after the initialization with one labeled instance per class (GENDER VOICE). ULoP shows the
best performance by far. Dense Areas First, Ideal Labels First, and Equal Spread start strong, but get outperformed by AL strategies between
the 10th and 20th iteration. Class Intersection Minimization is the best model-based strategy that almost competes with AL. The remaining
model-based strategies perform below Random. Centroid First shows particularly weak performance, potentially suffering from outliers.
such as the selection of k in K-NN or the selection of a suitable to support AL strategies suffering from the bootstrap problem.
clustering algorithm. In addition, we also want to note that, be- The experiments also showed that AL strategies become increas-
yond the 11 building blocks, other building blocks might exist to ingly strong in the course of the labeling process. This raises ques-
formalize other strategies. While the formalization of user strate- tions about the sweet spot between these two classes of algorithms,
gies may reduce the amount of interaction needed from the user, it which poses an interesting subject to future work. Figure 2 demon-
opens up large design space for the implementation of the strategies strates such a sweet spot visually, at iteration 35 when AL strate-
and thereby shifts the users’ responsibility from selecting instances gies start to outperform the user strategies. We confirm the supe-
rather to selecting parameters for strategy automation. The auto- rior performance of AL to model-based user strategies in average.
matic selection of appropriate parameters is an interesting direc- Given the potentials provided with the underlying building blocks
tion of future research. In terms of the VA principle our proposed (cf. Tables 3 and 4), the improvement of model-based strategies in
formalization opens up new possibilities. A better understanding combination with AL strategies poses another interesting future di-
of user strategies allows for the development of better visual guid- rection. Leverage points that may foster the performance are using
ance methods. Furthermore, it may become possible to automate the Class Likelihood building block to incorporate label uncertainty
the candidate selection process as a whole. and Equal Spread to better respond to data characteristics.
Dependency on Characteristics of Data Sets. We used four
Complexity of User Actions. With the variety of the four
different data sets for the assessment of strategies, varying in car-
data sets, we observed that many formalized user strategies have
dinality, size, class balance, and outlier rate. The performance dif-
strengths, but also weaknesses. Considering that the performance
ferences between the user strategies depend on these factors. Data-
of users in a recent experiment [BZSA17] was as good as AL or
based user strategies (Centroid First, Dense Areas First, and Ideal
better, we conclude that users often applied more than one particu-
Labels) performed well for MNIST which is large, pattern-rich
lar strategy during the labeling process. More formally, we assume
(10 classes), and cleansed. The potential of these strategies de-
that no single formalized user strategy can replace real users in the
creased quickly for the small IRIS data set. Additionally, data-
VIAL process. This implies several aspects for future investigation.
based strategies (especially Centroids First) had problems in the
First, research in the observation of users may reveal other strate-
presence of outliers (GENDER voice and FRAUD detection). In
gies that can be formalized. Second, the observation of changes in
contrast, model-based strategies with their potentials in later phases
user strategies in the course of the labeling process may yield new
of the labeling process seemed to be more robust against outliers.
insights and potentials. Finally, the combination of existing user
However, model-based strategies had problems with data sets with
strategies may improve the performance and come closer towards
many classes, which requires further research. In general, taking
the ULoP.
local data characteristics into account (particularly density estima-
tion, as well as class prediction) can help to support the labeling
process. A challenge that remains for all strategies are very large Relations between Strategies. A similar aspect is the analysis of
datasets, which are difficult to tackle by VIAL approaches. For such relations and complementing strengths between strategies as well
datasets, on the one hand classifiers are required with a large ca- as between building blocks. Tighter coupling of AL strategies with
pacity to enable the modeling of the large-scale data. On the other user strategies may lead to novel powerful selection strategies. An-
hand, user strategies may be useful in this context to accelerate the other dimension in the analysis is the temporal domain of the label-
labeling process by finding better candidate instances for labeling ing process itself. Which strategy is best suited at a given phase in
in less time making the overall labeling task more efficient. the labeling process? Further insights are necessary to select, com-
bine or detach strategies for different points in time in the labeling
Comparison with AL Strategies. Data-based user strategies process. The analysis of the very early phase (bootstrap phase) and
demonstrated their potential in early phases of the process, e.g., the later phase brings a first evidence that the series of user strate-
c 2018 The Author(s)
Computer Graphics Forum c 2018 The Eurographics Association and John Wiley & Sons Ltd.You can also read