UK Home Broadband Performance - The performance of fixed-line broadband delivered to UK residential customers - Ofcom
←
→
Page content transcription
If your browser does not render page correctly, please read the page content below
UK Home Broadband Performance
The performance of fixed-line broadband delivered to
UK residential customers

TECHNICAL REPORT:
Publication date: 13 May 2020
Contents
Section
1. Overview                                                                     2
2. Dashboard                                                                    5
3. Background                                                                   6
4. The effect of the Covid-19 lockdown on broadband performance in March 2020   8
5. November 2019: download speeds                                               19
6. November 2019: upload speeds                                                 30
7. November 2019: Netflix streaming and disconnections                          31
8. Wi-Fi performance                                                            34

A1. Technical Annex                                                             39
A2. Statistical Annex                                                           45
A3. Sources                                                                     54
A4. Glossary of terms                                                           57

                                                                                 1
1. Overview
Reliable, good-quality broadband connectivity is an essential part of life for
most people in the UK
Growing use of data-hungry activities such as video streaming, and increased levels of home
working and learning during the Covid-19 lockdown, mean the need for fast and reliable
broadband has never been greater.
Ofcom’s Communications Market Report 2019 shows that 80% of UK households have a home
broadband connection. To understand how well these services perform, Ofcom commissioned
technical partner SamKnows to set up a panel of people who connected a hardware monitoring unit
to their broadband router. This enables us to measure the performance delivered by different
services and assess how they vary by factors including technology, provider, package, where people
live and when they use their service.

Covid-19 lockdown measurements
In addition to the analysis of home broadband performance during November 2019, this report
includes measurements taken in March 2020 to assess the effect of shifting broadband use following
the Covid-19 lockdown on the performance of home broadband connections. With more
homeworking, children using online learning resources and greater use of streaming services, there
has been a significant increase in demand on broadband networks during this period.
Broadband providers have prioritised keeping people connected during the Covid-19 lockdown,
while also managing reduced staff levels, and our analysis shows that broadband performance has
largely withstood the increase in demand.
Our Stay Connected campaign provides advice to help broadband and mobile users get the most
from their connections as millions of families work and learn at home.

Wi-Fi performance
We have also carried out testing of router Wi-Fi performance, and the high-level findings from this
testing, along with information regarding how Wi-Fi performance can be improved, can be found
later in this report.

                                                                                                      2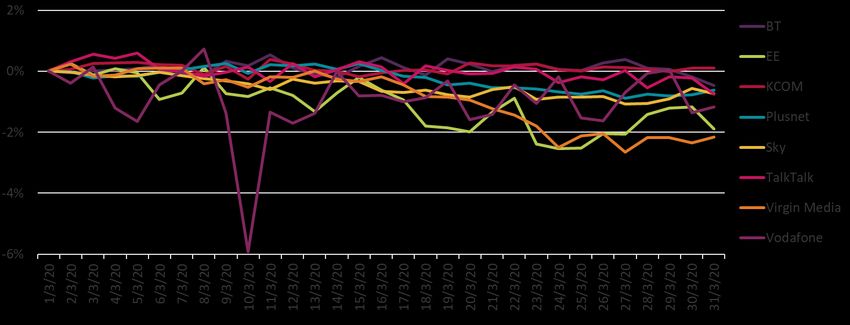
What we have found – in brief
The performance delivered by broadband providers is holding up well during the Covid-19
lockdown period. Comparing performance during the first and last weeks of March 2020 (pre-and
post-lockdown) we find that average download and upload speeds fell by 2% and 1% respectively,
while delay (latency) was 2% higher (worse). We did observe differences in performance across
providers, with some networks suffering the effects of increased use more than others.
Connectivity to Facebook, Facebook Messenger, WhatsApp and Twitter’s servers was also
affected. Delay to these services’ retrieval and upload servers increased between the first and last
weeks in March 2020, although none of the measured differences was greater than 3%.
Average home broadband download speeds continued to increase in 2019. The average speed of
UK home broadband connections increased by 18% to 64.0 Mbit/s in 2019. This was largely due to
the growing availability and take-up of superfast and ultrafast full-fibre and cable services.
Take-up of faster broadband packages continues to increase. Around 75% of home broadband
connections are now superfast packages with advertised download speeds of 30 Mbit/s or higher,
while 2% of UK lines are ultrafast packages with advertised download speeds of 300 Mbit/s or more.
Upload speeds have increased significantly due to people migrating onto superfast and ultrafast
services. Average (mean) upload speeds increased by 90% to 14.0 Mbit/s in 2019, while median
speeds saw a more moderate (55%) increase. The rapid increase in upload speeds is due to growing
take-up of higher-tier fibre-to-the-cabinet (FTTC) lines, upgrades to cable upload speeds and growth
in take-up of full-fibre services offering very high upload speeds.
Increasing rural superfast take-up has contributed to a narrowing in the gap between urban and
rural broadband performance. But although the proportion of rural lines receiving an 8-10pm peak-
time speed of less than 10Mbit/s (22%) is falling, and the proportion receiving an 8-10pm speed of
30Mbit/s or higher (56%) is increasing, the average urban peak-time speed (74.6Mbit/s) was still
almost double the rural average (38.5Mbit/s) in 2019.
Cable and full-fibre services recorded the highest average upload and download speeds of the
services under test. Virgin Media’s 362 Mbit/s cable service and BT’s 300 Mbit/s full-fibre service
provided the fastest average 8-10pm peak time period download speeds (344.0 Mbit/s and 298.7
Mbit/s respectively) and upload speeds (35.7 Mbit/s and 49.5 Mbit/s) of the packages included in
the report.
Performance varies by service and technology, but few differences exist between services that use
the same wholesale input. Our research finds that people can often receive better performance by
switching to a different technology or a service with a higher advertised speed. However, many
broadband providers, including BT, EE, Plusnet, Sky and TalkTalk, use the same Openreach wholesale
inputs, and we find few differences between services provided using the same underlying service.
Many customers may be able to increase their Wi-Fi performance by upgrading to a new router.
Our limited Wi-Fi testing shows that current routers tend to outperform older ones, so customers
may be able to improve their Wi-Fi experience by upgrading to their broadband provider’s latest
model which, in some cases, they will be able to do free of charge.

                                                                                                       3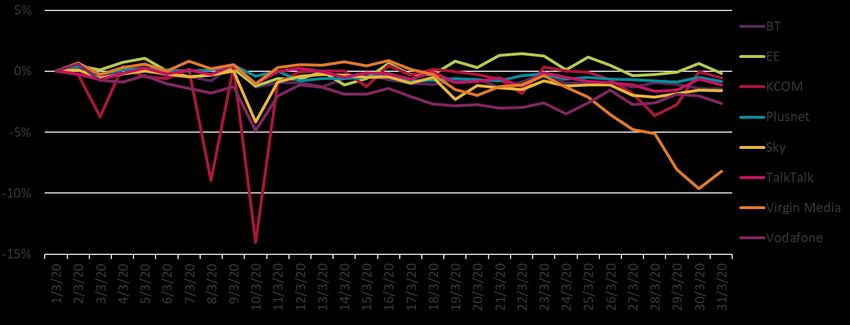
We measure the performance delivered to the customer’s router. The performance delivered to
connected devices varies as it is affected by several factors including Wi-Fi performance, in-house
wiring, in-house contention (i.e. when more than one device is using the broadband connection),
device limitations and the performance of servers delivering content over the connection.
The availability of higher-speed home broadband services continues to improve. In our Connected
Nations update: Spring 2020 where we look at the availability and use of broadband services, we
reported that superfast broadband services offering predicted download speeds of at least 30
Mbit/s were available to 95% of UK homes and offices by January 2020, while full-fibre services were
available to 12% of premises. Analysis of the results of our testing during the November 2019
measurement period, including broadband provider package comparisons, can also be found in the
interactive dashboard that accompanies this report.

                                                                                                      4
2. Dashboard
53. Background
Introduction
Ofcom’s principal duty under the Communications Act 2003 (the Act) is to further the interests of UK
citizens and consumers, where appropriate by promoting competition. In doing so, we are required
to secure several things, including the availability of a wide range of electronic communications
services, including fixed broadband services.
We must also have regard to the availability and use of high-speed data services throughout the UK,
the interests of consumers in respect of choice, price, quality of service and value for money and the
desirability of encouraging investment and innovation in relevant markets.
The Act also requires us to make arrangements to find out about consumers’ experience in their use
of, and access to, electronic communications services, which we do by carrying out research. Subject
to certain exceptions, we have a duty to publish the results of our research and to take account of it
in carrying out our functions.
To understand the performance of UK fixed-line residential broadband connections, we commission
research to measure and report on consumers’ experience of using these services. Ofcom has
undertaken this research since 2008, using data collected by our research partner SamKnows
Limited (SamKnows) from a volunteer panel of UK residential broadband users. We believe that our
methodology (see Annex 1), combined with the scale of data collection and the sophistication of the
statistical analysis (see Annex 2), ensures that the research presents a robust presentation of UK
fixed-line broadband performance.
However, there are other ways in which broadband performance can be measured. For example, our
Connected Nations reports include analysis of broadband speeds based on information on the ‘sync
speed’ or ‘configured speed’ of each active line, which is provided to Ofcom by broadband providers.
This approach gives a measure of the maximum connection speed achieved between the broadband
provider’s access network and the customer’s premises, which is not affected by contention and is
usually slightly higher than the ‘end-to-end’ line speed measurements we present here.
Embedded panel tests
One of the limitations of our hardware-based measurement methodology is that we can only include
packages in the research when we can recruit enough volunteer panellists for them, and this can
make it difficult to include packages that do not have widespread take-up.
BT and Virgin Media have SamKnows test firmware embedded into some of their customers’ routers
and have agreed to allow Ofcom access to some of these test results (on an anonymised basis). We
have used test results relating to BT’s 67 Mbit/s, 145 Mbit/s and 300 Mbit/s fibre-to-the-premises
(FTTP) service, and its 36Mbit/s FTTC package in this report, but have not used any of Virgin Media’s
data.
The embedded tests run on the BT routers are identical to those run on the main Ofcom panel’s
measurement units, with the exception of the video streaming and web page loading tests.
6SamKnows has confirmed that if the tests are run on a broadband provider’s router rather than on
one of its ‘whitebox’ measurement units, this would have no discernible effect on the measured
results. In addition, where the broadband providers have provided embedded test result data, we
used only a subset of the data provided, in order to minimise the risk of any systematic biases arising
from oversampling in certain geographic areas.
74. The effect of the Covid-19 lockdown on
broadband performance in March 2020
The effect of remote working during the Covid-19 pandemic on broadband
network and online service performance
On 16 March 2020, the Prime Minister delivered a statement asking UK residents to stop all
unnecessary travel and start working from home where they possibly could to help slow the spread
of Covid-19. This was followed by a nationwide lockdown which started on Monday 23 March 2020
and introduced stringent social distancing measures, including the closure of schools.
With the shift to home working there was a significant increase in data traffic as people turned to
online voice and video calling, and the closure of schools led to growth in content streaming, online
gaming, etc, as children learn and are entertained at home. These have resulted in increasing data
use, particularly during the daytime. The Covid-19 lockdown made the resilience of the UK’s internet
infrastructure even more critical.
While most of this report looks at home broadband performance during November 2019, this
section focuses on broadband performance and connectivity to a number of popular online services
in March 2020, to see the effect of rapidly-changing patterns of use. By comparing measurements
taken at the beginning and the end of March, we can see the effect of increased use on broadband
networks, with any change in the latter half of the month likely to be due to the effects of the
lockdown.
While our analysis does not include any information on average data use, this is unlikely to have
constrained many people’s home broadband use as a majority of services include ‘unlimited’ data,
and a number of broadband providers with customers on capped services removed their caps
temporarily in response to the Covid-19 lockdown.
Our Stay Connected campaign provides advice to help broadband and mobile users get the most
from their connections as millions of families work and learn at home.
Analysis methodology
The data in this section of the report are taken from the SamKnows UK broadband measurement
panel in March 2020.
The analysis includes data for eight of the UK’s largest broadband providers. The results are at a
provider level (and do not take speed tier into account) and each broadband provider’s performance
is only compared to itself.
All of the analysis uses a consistent set of ‘whiteboxes’ across the entire time range in the chart: if a
‘whitebox’ is included in the analysis, it generated results for every day in the time range and has
been included throughout. Our analysis excludes panellists who had a change of 50% or more in
either their upload or download speed between 1 March and 31 March (to avoid any distortions in
8the results caused by people who changed their broadband package as a result of the Covid-19
lockdown) and those who switched broadband provider during the month.
Summary of results
As the Covid-19 lockdown started, there were early concerns about the ability of the UK’s
broadband infrastructure to cope with changes in network load, as usage increased. Our analysis
shows that while there was some degradation in broadband performance in the second half of
March 2020, the observed differences tended to be limited.
We consider this is likely to be because broadband providers scale their networks so that they can
handle capacity requirements at peak times, and while the Covid-19 lockdown resulted in significant
growth in daytime data consumption, this usage was still below the level of pre-lockdown evening
peak demand. For example, on 20 March 2020 BT issued a news release which said that while there
had been a 35-60% increase in weekday broadband traffic on its network since the Prime Minister’s
16 March 2020 statement (up from 5 Tbit/s to a peak of 7.5 Tbit/s), daytime traffic volumes were
still much lower than the highest ever recorded volume on its network (17.5 Tbit/s).
The impact of network congestion on the performance of cable services is greater than the impact
on other superfast broadband technologies, as is reflected elsewhere in this report. This is due to
cable network topologies, which mean that network congestion occurs closer to the customer,
making it more difficult to add the additional capacity required to alleviate the effects of congestion.
As such, Virgin Media’s (predominantly cable) network generally suffered a greater decline in
performance during the second half of the month than other broadband providers’ networks.
However, the peak-time download speeds provided by most of Virgin Media’s cable services are still
higher than those offered over FTTC, which is used by most UK home broadband connections.
As well as the Covid-19 lockdown, there were two other notable events which affected broadband
data consumption in March 2020. The first was the release of a 50GB+ update to the videogame Call
of Duty: Modern Warfare on 10 March 2020, and the second was Netflix reducing the bitrates of its
video streaming service across Europe from 23 March 2020 in order to reduce the pressure on
broadband networks during a near Europe-wide lockdown.
Our findings are summarised below.
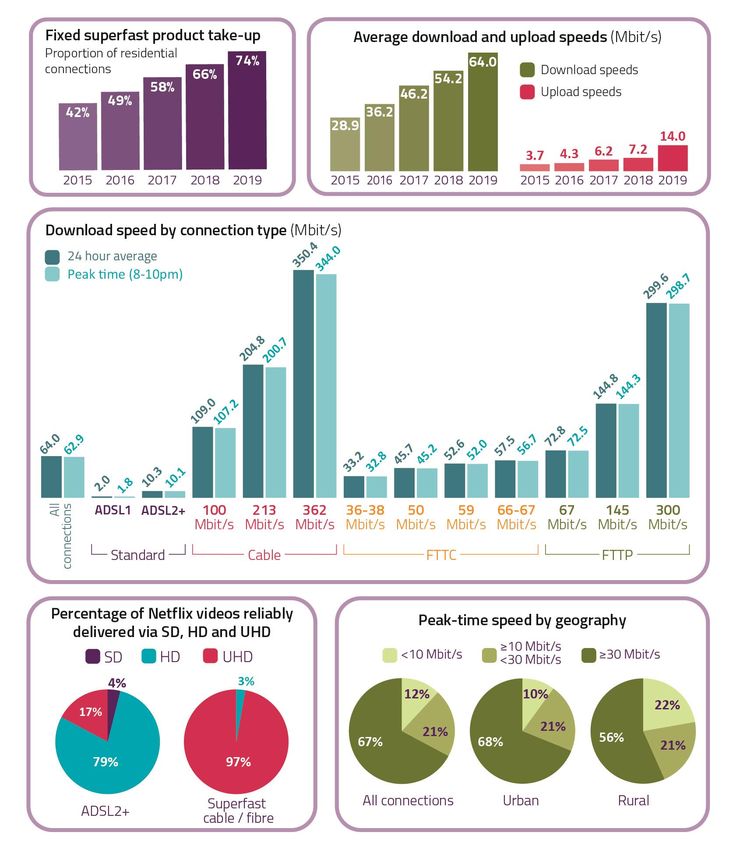
Average download speeds fell in the latter half of March as the UK entered
lockdown
4.1 The average download speed across the broadband providers included in the analysis
declined during March 2020. We consider this is likely to be the result of contention due to
increased network use as the UK entered lockdown.
4.2 On average, download speeds during the last week of the month (23 to 29 March 2020)
were 2% lower than those in the first week (2 to 8 March 2020).
4.3 There were marked differences in the effect of lockdown on network performance across
broadband providers, with Virgin Media’s average download speeds dropping by almost
10% compared to 1 March 2020 at one point during the month (although the higher
9speeds delivered by its services make it unlikely that many customers’ user-experience
would be impacted).
4.4 Conversely, BT-owned EE’s average download speeds showing some increases compared
to 1 March 2020 as the month progressed.
4.5 KCOM experienced issues with network slowdown on several days in the first half of the
month, the largest of which (a 14% fall) coincided with the release of the Call of Duty:
Modern Warfare update on 10 March 2020. Sky and TalkTalk also suffered from a notable
slowing of average download speeds on this date.
4.6 Almost all broadband providers saw a fall in the rate at which download speeds were
declining on 23 March 2020, when Netflix started to reduce the streaming quality of its
video content, a move that was aimed at reducing the pressure on broadband networks.
Figure 1: Change in broadband providers' average download speeds in March 2020 (higher is
better)
Source: Ofcom, using data provided by SamKnows
Notes: Graph shows the percentage change since 1 March 2020; higher values are better; results are derived
from tests to SamKnows' off-net London servers using 3 parallel TCP sessions for 10 seconds; results cover all
hours of the day (and not just peak times).
10Figure 2: Change in broadband providers' average hourly download speeds in March 2020 (higher
is better)
Source: Ofcom, using data provided by SamKnows
Notes: Graph shows the percentage change between w/c 2 March 2020 and w/c 23 March 2020; higher values
are better; results are derived from tests to SamKnows' off-net London servers using 3 parallel TCP sessions for
10 seconds.
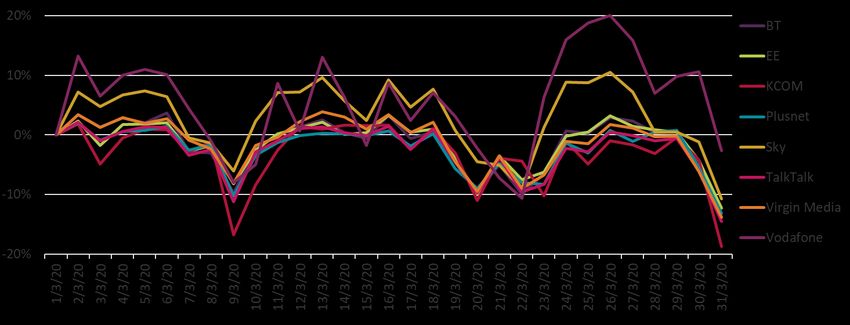
Average upload speeds fell in the latter half of March
4.7 Similar to download speeds, average upload speeds across the broadband providers
included in the analysis fell slightly over the course of March 2020, although the decline
was less noticeable. On average, upload speeds during the last week of March 2020 were
1% lower than those in the first week of the month.
4.8 Differences in performance between providers were also less marked than for download
speeds, with only EE and Virgin Media's average upload speeds falling by more than 2%
compared to 1 March 2020 at any point during the second half of the month. Vodafone
experienced a fall in upload speeds on 10 March 2020, the date of the Call of Duty update.
4.9 Given the latency levels shown elsewhere in the report, the observed increases are unlikely
to have been noticeable to most home broadband users.
11Figure 3: Change in broadband providers' average upload speeds in March 2020 (higher is better)
Source: Ofcom, using data provided by SamKnows
Notes: Graph shows the percentage change since 1 March 2020; higher values are better; results are derived
from tests to SamKnows' off-net London servers using 3 parallel TCP sessions for 10 seconds; results cover all
hours of the day (and not just peak times).
Figure 4: Change in broadband providers' average hourly upload speeds in March 2020 (higher is
better)
Source: Ofcom, using data provided by SamKnows
Notes: Graph shows the percentage change between w/c 2 March 2020 and w/c 23 March 2020; higher values
are better; results are derived from tests to SamKnows' off-net London servers using 3 parallel TCP sessions for
10 seconds.
Most broadband providers saw an increase (degradation) in network latency
during March 2020
4.10 A connection with low latency will feel more responsive for simple tasks like web browsing,
and certain applications perform far better with lower latency.
4.11 Average latency across the broadband providers included in the analysis increased by 2%
between the first and last weeks of March 2020, indicating a decline in performance. All
12but two broadband providers (Vodafone and EE) saw their latency increase during this
period, with these increases ranging from less than 0.1% for EE to 3.8% for Virgin Media.
4.12 This is in line with what we would expect to see, given the greater pressure that broadband
providers’ networks were under following the introduction of lockdown measures in the
latter half of the month.
Figure 5: Change in broadband providers' average latency in March 2020 (lower is better)
Source: Ofcom, using data provided by SamKnows
Notes: Graph shows the percentage change since 1 March 2020; lower values are better; results are derived
from tests to SamKnows' off-net London servers using the hourly UDP latency test; results cover all hours of the
day (and not just peak times).
Figure 6: Change in broadband providers' average hourly latency in March 2020 (lower is better)
Source: Ofcom, using data provided by SamKnows
Notes: Graph shows the percentage change between w/c 2 March 2020 and w/c 23 March 2020; lower values
are better; results are derived from tests to SamKnows' off-net London servers using the hourly UDP latency
test.
13Netflix download speeds decreased for most of the broadband providers
included in our analysis during March
4.13 On average, Netflix download speeds were 3% lower in the last week of March 2020 than
in the first week; however, while Netflix download speeds were an average of 4% lower
between midnight and 6pm in week 4 than in week 1, average speeds between 6pm and
12am were 1% higher.
4.14 This can be explained by two factors: Netflix reducing video streaming bitrates in Europe
from 23 March 2020 to help cope with increased network demand; and the closure of
schools.
4.15 The Netflix streaming bitrate reduction had the effect of reducing the volume of data used
by Netflix streaming. During the evening (typically the peak time for Netflix use) download
speeds improved because any increase in use due to the Covid-19 lockdown only partially
offset the impact of the bitrate reduction.
4.16 The schools closure meant that the increase in use between week 1 and week 4 was much
greater during the daytime than the evening, and daytime performance declined because
the impact of the bitrate reduction on download speeds was not sufficient to offset the
effect of this increase during this period.
Figure 7: Change in broadband providers' average Netflix download speeds in March 2020 (higher
is better)
Source: Ofcom, using data provided by SamKnows
Notes: Graph shows the percentage change since 1 March 2020; higher values are better; results are derived
from the Netflix video streaming tests; results cover all hours of the day (and not just peak times).
14Figure 8: Change in broadband providers' average hourly Netflix download speeds in March 2020
(higher is better)
Source: Ofcom, using data provided by SamKnows
Notes: Graph shows the percentage change since 1 March 2020; higher values are better; results are derived
from the Netflix video streaming tests.
Latency to Facebook’s servers
4.17 The quality of service delivered to broadband users is affected by both the performance of
the broadband provider providing the internet connection to the home and the
performance of the data centres and content delivery networks linked to the content
provider.
4.18 To investigate this, we have analysed the latency of Facebook and Twitter content served
to three broadband providers’ panellists across the month of March 2020. Lower latency
represents better performance.
4.19 A spike in latency to Facebook's datacentres was observed on 22 March 2020; this affected
connectivity to Facebook, Facebook Messenger and WhatsApp. On average, latency to
Facebook’s content retrieval servers was 1% higher in the last week of March than the first
week, while latency to its content upload servers was 2% higher.
15Figure 9: Change in broadband providers' average latency to Facebook in March 2020 (lower is
better)
Change vs 1 March 2020
6%
4%
2% Download
0%
Upload
-2%
-4%
10/3/20
11/3/20
12/3/20
13/3/20
14/3/20
15/3/20
16/3/20
17/3/20
18/3/20
19/3/20
20/3/20
21/3/20
22/3/20
23/3/20
24/3/20
25/3/20
26/3/20
27/3/20
28/3/20
29/3/20
30/3/20
31/3/20
1/3/20
2/3/20
3/3/20
4/3/20
5/3/20
6/3/20
7/3/20
8/3/20
9/3/20
Source: Ofcom, using data provided by SamKnows
Notes: Latency to Facebook’s servers; graph shows the percentage change since 1 March 2020; lower values
are better; results cover all hours of the day (and not just peak times).
Latency to Facebook Messenger’s servers
4.20 There was a spike in latency to Facebook's datacentres on 22 March 2020 which affected
connectivity to Facebook, Facebook Messenger and WhatsApp.
4.21 Latency to Facebook Messenger’s content retrieval servers was, on average, 2% higher in
the last week of March 2020 than in the first week, while latency to its content upload
servers was 3% higher.
Figure 10: Change in broadband providers' average latency to Facebook Messenger in March 2020
(lower is better)
Change vs 1 March 2020
10%
8%
6%
Download
4%
2% Upload
0%
-2%
10/3/20
11/3/20
12/3/20
13/3/20
14/3/20
15/3/20
16/3/20
17/3/20
18/3/20
19/3/20
20/3/20
21/3/20
22/3/20
23/3/20
24/3/20
25/3/20
26/3/20
27/3/20
28/3/20
29/3/20
30/3/20
31/3/20
1/3/20
2/3/20
3/3/20
4/3/20
5/3/20
6/3/20
7/3/20
8/3/20
9/3/20
Source: Ofcom, using data provided by SamKnows
Notes: Latency to Facebook Messenger’s servers; graph shows the percentage change since 1 March 2020;
lower values are better; results cover all hours of the day (not just peak times).
16Latency to WhatsApp’s servers
4.22 A spike in latency to Facebook's datacentres on 22 March 2020 affected all broadband
providers’ connectivity to Facebook, Facebook Messenger and WhatsApp.
4.23 Latency to both WhatsApp’s content retrieval and upload servers were, on average, 2%
higher in the last week of March 2020 than in the first week.
Figure 11: Change in broadband providers' average latency to WhatsApp in March 2020 (lower is
better)
Change vs 1 March 2020
8%
6%
4% Download
2%
Upload
0%
-2%
10/3/20
11/3/20
12/3/20
13/3/20
14/3/20
15/3/20
16/3/20
17/3/20
18/3/20
19/3/20
20/3/20
21/3/20
22/3/20
23/3/20
24/3/20
25/3/20
26/3/20
27/3/20
28/3/20
29/3/20
30/3/20
31/3/20
1/3/20
2/3/20
3/3/20
4/3/20
5/3/20
6/3/20
7/3/20
8/3/20
9/3/20
Source: Ofcom, using data provided by SamKnows
Notes: Latency to WhatsApp’s servers; graph shows the percentage change since 1 March 2020; lower values
are better; results cover all hours of the day (and not just peak times).
Latency to Twitter’s servers
4.24 On average, latency to both Twitter’s content retrieval and upload servers were 1% higher
in the last week of March 2020 than in the first week.
17Figure 12: Change in broadband providers' average latency to Twitter in March 2020 (lower is
better)
Change vs 1 March 2020
2%
1%
Download
0%
Upload
-1%
-2%
10/3/20
11/3/20
12/3/20
13/3/20
14/3/20
15/3/20
16/3/20
17/3/20
18/3/20
19/3/20
20/3/20
21/3/20
22/3/20
23/3/20
24/3/20
25/3/20
26/3/20
27/3/20
28/3/20
29/3/20
30/3/20
31/3/20
1/3/20
2/3/20
3/3/20
4/3/20
5/3/20
6/3/20
7/3/20
8/3/20
9/3/20
Source: Ofcom, using data provided by SamKnows
Notes: Latency to Twitter’s servers; graph shows the percentage change since 1 March 2020; lower values are
better; results cover all hours of the day (not just peak times).
185. November 2019: download speeds
Around three-quarters of home broadband connections were
superfast products in November 2019
5.1 Broadband provider data shows that just under three-quarters (74%) of UK home
broadband connections were superfast products with an advertised speed of 30 Mbit/s or
higher in November 2019.
5.2 Two per cent were ultrafast products with advertised speeds of 300 Mbit/s or higher, up
from 1% a year earlier.
Figure 13: UK residential broadband lines, by advertised speed: 2014 to 2019
5% 2%
9% 11% 14% 16% 16% 300 Mbit/s and higher
27%
33%
39% 100 Mbit/s or higher and
44% less than 300 Mbit/s
48%
55% 30 Mbit/s or higher and
less than 100 Mbit/s
59%
52% Over 10 Mbit/s and less
46% than 30 Mbit/s
39%
33% 10 Mbit/s or less
25%
9% 7% 5% 3% 2% 1%
2014 2015 2016 2017 2018 2019
Source: Ofcom / operators; see note [1] in the Sources section.
Note: The proportion of lines with an advertised speed of 300Mbit/s or higher in 2019 shown here (2.3%) is
slightly lower than the proportion receiving average 24-hour speeds of 300Mbit/s in Figure 15 (2.6%) due to the
composition of our panel, and this difference is not material.
Average home broadband download speeds were over 60 Mbit/s in 2019
5.3 The average actual speed of UK residential fixed broadband services recorded over the 24-
hour period increased by 9.8 Mbit/s to 64.0 Mbit/s in 2019.
5.4 This was higher than the 8.1 Mbit/s (18%) increase recorded in 2018, although the rate of
increase was unchanged at 18%.
5.5 The average download speed of connections with an advertised speed of less than
10Mbit/s fell by 2.1 Mbit/s to 1.9 Mbit/s. The proportion of lines that had an advertised
speed of less than 10Mbit/s fell to 1% during the year, and we consider it is likely that the
deterioration in performance recorded is due to people with better connections upgrading
to higher speed packages.
5.6 The rate at which average download speeds for superfast products (those with an
advertised speed of 30Mbit/s or higher) is increasing has slowed, which we consider is
19probably because of limitations in the performance of fibre-to-the-cabinet (FTTC), which
makes up most of these connections.
Figure 14: Average actual broadband speeds: 2014 to 2019 (Mbit/s)
Source: Ofcom, using data provided by SamKnows; see note [2] in the Sources section.
Around 70% of residential broadband lines had an average
download speed of 30 Mbit/s or higher
5.7 We define broadband connections as superfast if download speeds are 30Mbit/s or higher.
Our research suggests that 69% of residential broadband lines had a 24-hour average
download speed of 30 Mbit/s or higher in 2019, up from 58% in 2018.
5.8 The proportion of lines receiving an average download speed of 10 Mbit/s or less fell by
three percentage points to 13% in 2019
5.9 The proportion of lines receiving an average download speed of 100Mbit/s was slightly
higher in 2019 at 17%, a one percent increase since 2018.
5.10 We define broadband connections as ultrafast if download speeds are 300Mbit/s or higher.
Three per cent of lines had an average 24-hour download speed of 300 Mbit/s or higher,
up from 2% a year earlier.
20Figure 15: Distribution of average 24-hour download speeds: 2014 to 2019 (Mbit/s)
Source: Ofcom, using data provided by SamKnows; see note [2] in the Sources section.
Note: The proportion of lines with an advertised speed of 300Mbit/s or higher in 2019 shown in Figure 13
(2.3%) is slightly lower than the proportion receiving average 24-hour speeds of 300Mbit/s shown here (2.6%)
due to the composition of our panel, and this difference is not material.
Full fibre and cable connections continue to have the fastest
average speeds
5.11 Our analysis indicates a slight increase in the average download speed of cable connections
in 2019, up by 10.1 Mbit/s (7%) to 148.4 Mbit/s.
5.12 There was also a small increase in the average download speed delivered by FTTC
connections, up by 1.7Mbit/s (4%) to 47.1 Mbit/s. This is largely due to a migration to
higher speed packages in 2019.
5.13 Download speeds for standard broadband connections delivered over asymmetric digital
subscriber line (ADSL) decreased from 10.4Mbit/s to 9.8Mbit/s. We consider this is likely to
be related to people with better quality lines upgrading to superfast services.
21Figure 16: Average download speeds for fixed broadband connections, all connections including 2
Mbit/s and lower, by technology (Mbit/s)
148.4
138.3
115.6
94.1
64.0
54.2 54.4
46.2 42.9 41.6 44.9 46.0 45.4 47.1 40.2
36.2
22.8
17.8
6.7 7.3 9.4 9.8 10.4 9.8
All connections ADSL FTTC Cable
2013 2014 2016 2017 2018 2019
Source: Ofcom, using data provided by SamKnows; see note [3] in the Sources section.
Longer line lengths in rural areas result in lower average speeds for
both ADSL and FTTC connections
5.14 A characteristic of the copper technologies used to deliver ADSL and FTTC broadband is
that speeds slow down due to attenuation over the length of the copper over which data
travels.
5.15 With ADSL, data travels over copper all the way from the local exchange to the end-user’s
premises, whereas with FTTC copper is only used from the street cabinet to the end-user.
5.16 As ADSL and FTTC copper lines tend to be shorter in urban areas than in rural ones (where
population density is lower), urban lines tend to perform better than those in rural areas.
5.17 For second-generation ADSL (ADSL2+) connections, this resulted in the average 24-hour
download speed in urban areas (11.7 Mbit/s) being 36% higher than the average in rural
areas (8.1 Mbit/s).
5.18 There is less variation in the length of copper line from the street cabinet to the user’s
premises and therefore less variance in performance. We found a smaller (3%) difference
in FTTC download speeds in rural areas (45.5 Mbit/s) compared to those in urban areas
(46.9 Mbit/s).
5.19 Average FTTC download speeds were over five times faster than ADSL average download
speeds in rural areas in 2019, and most rural ADSL customers who upgrade to FTTC will
experience a significant increase in performance.
22Figure 17: Average ADSL and FTTC download speeds, by rurality: 2019 (Mbit/s)
Source: Ofcom, using data provided by SamKnows; see note [4] in the Sources section.
Notes: The chart bars show that there is a 95% probability that the actual average speed for all customers (i.e.
not just the customer panellists within our sample) falls within the ranges shown; it is not possible to make
direct comparisons between this data and figures published in previous reports due to panel composition
differences and a change in the weighting methodology used for this analysis.
The gap between urban and rural broadband performance is
narrowing
5.20 Ofcom’s Connected Nations update: Spring 2020 shows that superfast broadband services
were available to 98% of urban premises in January 2020, compared to 80% in rural areas.
5.21 As the availability and take-up of superfast services are increasing in rural areas, the gap
between average urban and rural home broadband performance is narrowing.
5.22 Our research shows that there was an 11 percentage point (pp) difference between the
proportion of urban (11%) and rural (22%) broadband lines with an average 8-10pm peak-
time actual download speed of less than 10 Mbit/s in 2019, down from 20pp in 2018.
5.23 Similarly the 12pp difference between the proportion of urban (68%) and rural (56%) lines
with an average evening peak-time speed of 30Mbit/s or higher was lower than the 16pp
figure for 2018.
5.24 However, while our research shows that the difference between average urban and rural
peak-time download speeds is getting smaller, average peak-time download speeds in
urban areas (74.6 Mbit/s) were almost double those in rural areas (38.5Mbit/s) in 2019.
23Figure 18: Distribution of average peak-time, 8-10pm, fixed broadband download speeds, by
rurality: 2019 (proportion of lines)
Source: Ofcom, using data provided by SamKnows; see note [5] in the Sources section.
Around one-fifth of rural broadband lines receive download speeds
of 10 Mbit/s or less
5.25 We consider the actual download speed that is necessary for a decent broadband service
(i.e. one which enables full participation in a digital society) to be 10 Mbit/s.
5.26 Our research shows that in November 2019 over one-fifth (22%) of panellists in rural areas
of the UK received an average 24-hour download speed of less than this.
5.27 This proportion was higher than for the UK as a whole (12%) and the proportion in urban
areas (10%).
5.28 However, many rural and urban customers may be able to achieve higher speeds by
switching to fibre or cable services.
24Figure 19: Distribution of average peak-time, 8-10pm, fixed broadband download speeds, by
rurality: 2019 (proportion of lines)
Source: Ofcom, using data provided by SamKnows; see note [5] in the Sources section.
Note: It is not possible to make direct comparisons between this data and figures published in previous reports
due to panel composition differences and a change in the weighting methodology used for this analysis.
Download speeds vary slightly throughout the day
5.29 The performance of broadband services varies by time of day, with speeds slowing down
during busy periods when network traffic volumes are highest.
5.30 Across all connections the average daily minimum speed (58.8 Mbit/s) was 90% of the
average maximum speed (65.7 Mbit/s).
5.31 The average download speed recorded during the 8-10pm peak time period was 62.9
Mbit/s, 96% of the average maximum speed.
Figure 20: Average UK broadband speeds, by time of day: 2019 (Mbit/s)
Source: Ofcom, using data provided by SamKnows; see note [2] in the Sources section.
25Broadband speeds are likely to be lowest at 7-10pm
5.32 Our research shows that all technologies recorded their lowest average speeds between
7pm and 9.59pm.
5.33 FTTP packages had the least slowdown at busy times; the average download speed
between 8pm and 8.59pm was 98.3% of the highest speed recorded between 12am and
5.59am.
Figure 21: Proportion of maximum speed delivered through the day: 2019 (%)
Source: Ofcom, using data provided by SamKnows; see note [6] in the Sources section.
Note: FTTP figures are weighted averages based on figures for BT’s 67Mbit/s, 145Mbit/s and 300Mbit/s FTTP
services and KCOM’s 75Mbit/s service.
FTTP connections have the least variation in performance
5.34 Our research shows that 24-hour, peak-time and minimum download speeds were lower
than average maximum speeds for all connection types in 2019.
5.35 There are two main reasons why home broadband connections do not always provide their
headline (advertised) speed throughout the day:
- For copper-based technologies such as ADSL and FTTC, the maximum speed that a
line can support is dependent on the length and quality of the line from the end-
user’s home to the local exchange (for ADSL) or street cabinet (for FTTC) – lines to
some premises will never support the service’s advertised speed (although under
the Voluntary Code of Practice for broadband speeds, broadband providers must
provide an estimate of the speed that the line can support, before purchase).
- The actual speeds of all connection types tend to fall when broadband providers’
networks are busy. The variation in speeds at peak times tends to be higher for
cable connections, due to network congestion occurring nearer to the customer,
26making it harder to add the additional capacity required to reduce the effects of
congestion.
Figure 22: Variations in download speeds, by time of day: November 2019 (Mbit/s)
370.2
350.4
344.0
301.8
299.6
299.2
298.7
290.8
210.7
204.8
200.7
189.4
146.0
144.8
144.3
140.6
110.5
109.0
107.2
102.5
73.1
72.8
72.5
71.5
65.7
64.0
62.9
58.8
58.5
57.5
56.7
53.6
53.2
52.6
52.0
48.0
46.4
45.7
45.2
42.7
33.8
33.2
32.8
30.7
10.6
10.3
10.1
9.0
2.2
2.0
1.8
1.5
All lines ADSL1 ADSL2+ 108 Mbit/s 213 Mbit/s 362 Mbit/s 36-38 50 Mbit/s 59 Mbit/s 66-67 67 Mbit/s 145 Mbit/s 300 Mbit/s
cable cable cable Mbit/s FTTC FTTC Mbit/s FTTP FTTP FTTP
FTTC FTTC
Maximum speed 24 hour average 8pm-10pm Minimum speed
Source: Ofcom, using data provided by SamKnows; see note [7] in the Sources section.
Contention varies by network technology
5.36 We measure network slowdown during busy periods (contention) by comparing
broadband provider packages’ average minimum and maximum speeds, our assumption
being that the primary reason for any differences between the two is network congestion.
5.37 For 54 Mbit/s, 108 Mbit/s 213 Mbit/s and 362 Mbit/s cable services, minimum download
speeds were between 87% and 97% of maximum speeds.
5.38 For 36 Mbit/s, 50 Mbit/s, 59 Mbit/s and 66-67Mbit/s FTTC services, average minimum
download speeds were between 88% and 92% of their average maximum download
speeds.
5.39 Among the FTTP packages included in the research, minimum speeds were between 96%
and 98% of the maximum speeds.
5.40 For ADSL2+ services, minimum download speeds were 87% of maximum speeds, while for
ADSL1 the figure was 75%.
27Figure 23: Minimum speed as proportion of maximum speed: 2019 (%)
100
80
60
40
20
0
ADSL1 ADSL2+ 108 Mbit/s 213 Mbit/s 362 Mbit/s 36-38 50 Mbit/s 59 Mbit/s 66-67 67 Mbit/s 145Mbit/s 300Mbit/s
cable cable cable Mbit/s FTTC FTTC FTTC Mbit/s FTTC FTTP FTTP FTTP
Source: Ofcom, using data provided by SamKnows; see note [8] in the Sources section.
Note: The chart bars show that there is a 95% probability that the actual average speed for all customers (i.e.
not just the customer panellists in our sample) falls within the ranges shown.
There is a greater variation in the speeds delivered to ADSL
standard broadband connections than superfast ones
5.41 To better understand the variations in performance among different services, we
calculated the coefficient of variation for the 24-hour download speeds for each package
type.
5.42 Coefficient of variation is a measure that is used to quantify the amount of variation or
dispersion of a set of data values, relative to the mean of those values. The smaller the
coefficient of variation, the more concentrated the data points are around the mean, and
the larger the coefficient of variation, the wider the spread of download speeds recorded
for a package.
5.43 Our analysis shows that connections provided using ADSL tended to have a higher
coefficient of variation (and exhibit more variation in performance) than those provided
over full fibre, cable and FTTC.
28Figure 24: Coefficient of variation for average 24-hour download speeds
0.66
0.50
0.33
0.27
0.19
0.16
0.16
0.08
0.07
0.05
0.04
0.03
FTTC 50
FTTC 59
Cable 108
Cable 362
Cable 213
FTTP 300
FTTP 67
FTTP 145
FTTC 36-38
FTTC 66-67
ADSL2
ADSL1
Source: Ofcom, using data provided by SamKnows; see note [9] in the Sources section.
296. November 2019: upload speeds
Average UK upload speeds increased significantly in 2019
6.1 Upload speeds are important to users who use real-time video communication services,
play video games online or who upload or share files.
6.2 Our research suggests that there was a significant increase in the mean average upload
speed of UK residential fixed broadband services compared to 2018, up by 90%, from 7.2
Mbit/s in 2019 to 14.0 Mbit/s in 2019.
6.3 The median average speed saw a more modest, but still significant, increase of 3.3 Mbit/s
(55%) from 6.0 Mbit/s to 9.3 Mbit/s.
6.4 The main drivers of this increase were the growing take-up of higher-tier FTTC services
(which typically offer advertised upload speeds of around 19 Mbit/s), upgrades to upload
speeds for over 3.5 million cable customers and growing take-up of full fibre packages with
ultra-high upload speeds, some of which provide actual upload speeds as high as
900Mbit/s.
Figure 25: Average UK fixed broadband upload speeds (Mbit/s): 2014 to 2019
Source: Ofcom, using data provided by SamKnows; see note [10] in the Sources section.
307. November 2019: Netflix streaming and
disconnections
7.1 The streaming of video content is one of the most capacity-hungry activities required of
broadband connections. To understand how well various fixed broadband connections
handle the streaming of video content, we measured the streaming performance of
broadband connections when accessing content from Netflix.
7.2 The charts below show the proportion of Netflix video streams that were delivered in the
most commonly available resolutions: standard definition (SD), high definition (HD) and
ultra-high definition (UHD) for each connection type.
7.3 These results represent the case where only one user is streaming on a broadband
connection; the streaming quality that can be reliably achieved may drop when multiple
users are simultaneously using the same connection. HD and UHD resolutions are only
available to those taking higher-tier Netflix plans.
Cable and FTTC products can stream Netflix at UHD resolution
7.4 The majority of Netflix streams delivered over FTTC and cable lines were delivered at UHD
resolution during the 8pm-10pm peak-time period.
7.5 For ADSL2+ services, over three-quarters of Netflix videos were streamed at HD resolution,
while 17% and 15% of streams were delivered in UHD during the 24-hour and 8-10pm
peak-time periods respectively (ADSL1 is not capable of supporting the speeds required for
UHD).
7.6 For people who are satisfied with HD rather than UHD quality, ADSL2+ may therefore
currently be enough to meet the current broadband requirements of some smaller
households, as video streaming is one of the most data-hungry uses of a home broadband
connection.
31Figure 26: Proportion of Netflix videos reliably delivered at the given video quality, over 24 hours
and at peak times, by technology
20% 20% 17% 15%
100% 100% 99% 99% 100% 100% 93% 88% 100% 99%
94% 94% 98% 95%
79% 80%
79% 79%
4% 5% 6% 11% 6% 6% 5%
1% 2%
0% 0%
24-hour
8-10pm
24-hour
8-10pm
24-hour
8-10pm
24-hour
8-10pm
24-hour
8-10pm
24-hour
8-10pm
24-hour
8-10pm
24-hour
8-10pm
24-hour
8-10pm
ADSL1 ADSL2+ Cable Cable Cable FTTC FTTC FTTC FTTC
(108 Mbit/s) (213 Mbit/s) (362 Mbit/s) (36-38 Mbit/s) (50 Mbit/s) (59 Mbit/s) (66-67 Mbit/s)
SD HD UHD
Source: Ofcom, using data provided by SamKnows; see note [11] in the Sources section.
Fibre and cable connections recorded the fewest average
disconnections
7.7 The average daily disconnections metric measures the frequency of broadband service
disconnections lasting longer than 30 seconds.
7.8 Users cannot undertake any online activities when their service loses internet connectivity,
and interruptions to the fixed broadband service can be inconvenient and frustrating.
7.9 It should be noted that not all disconnections are due to network performance: for
example, a panellist rebooting their router would be classified as a disconnection event by
our test.
7.10 ADSL2+ was statistically worse than all other packages. There was little statistical variation
between other broadband technologies.
32Figure 27: Average daily disconnections of 30 seconds or longer (lower values indicate better
performance): 2019 (actuals)
Source: Ofcom, using data provided by SamKnows; see note [12] in the Sources section.
Note: The chart bars show that there is a 95% probability that the actual average speed for all customers (i.e.
not just the customer panellists in our sample) falls within the ranges shown; in some cases testing may record
scheduled maintenance as being a disconnection event.
338. Wi-Fi performance
Benchmarking router Wi-Fi performance
Our Home Broadband Performance research covers broadband performance to the router, as this is
where the broadband provider has the greatest influence.
However, most homes connect to their home broadband service wirelessly using Wi-Fi. As
broadband connection speeds increase, Wi-Fi can become a performance bottleneck and the router
a determining factor of the user experience.
In order to better understand Wi-Fi performance, Ofcom ran a programme of Wi-Fi performance
testing based on Broadband Forum’s TR-398: Wi-Fi In-Premises Performance Testing standard. The
performance of a number of current and legacy broadband provider routers, along with two third-
party routers, were tested under lab-based conditions in a semi-anechoic chamber.1
Our Stay Connected campaign provides advice to help broadband and mobile users get the most
from their connections, including improving their Wi-Fi signal, as millions of families work and learn
at home.
Summary of results
8.1 Our limited testing shows that the maximum download speeds recorded over Wi-Fi were
greater than those of the home broadband services with which they were provided for all
but one of the routers under test.
8.2 Details of the methodology used, its limitations and anonymised results by router can be
found in the accompanying Wi-Fi performance testing of home broadband routers
technical report.
8.3 Figures 28 and 29 below show the anonymised results of our ‘range versus rate’ download
speed testing. The range versus rate test measures the upload and download throughput
rates for varying distances between the client device and router.
8.4 As the distance between the router and device is increased, the signal strength of the Wi-Fi
signal is reduced and the recorded throughput speeds declines. Distance was simulated by
the addition of the attenuation (measured in dB) between the router and client device.
8.5 We found that differences in Wi-Fi performance tended to be most pronounced between
current and older routers than across current models, with newer routers generally
offering better performance than older ones.
8.6 This suggests that many people may be able to improve their Wi-Fi experience by updating
their router to the latest model offered by their broadband provider. In some cases, they
1A semi-anechoic chamber is a radio frequency (RF) shielded enclosure where the walls are lined with a material that
absorbs radio waves. This isolates the chamber from outside RF signals, creating a ‘clean’ RF environment.
34may be able to do this free-of-charge. We also found that Wi-Fi performance tended to be
better over the 5GHz band than the 2.4GHz band.
Figure 28: Wi-Fi testing: 2.4 GHz range vs rate download speed results
Throughput (Mbit/s)
500
Current 1
Current 2
400 Current 3
Current 4
Current 5
300 Current 6
Current 7
200 Current 8
Current 9
Legacy 1
100 Legacy 2
Legacy 3
0 Legacy 4
0 6 11 12 13 14 15 16 18 21 22 23 24 25 26 27 28 29 30 31 32 33 34 35 Legacy 5
Legacy 6
Attenuation (dB)
Source: Ofcom
Figure 29: Wi-Fi testing: 5 GHz range vs rate download speed results
Throughput (Mbit/s)
500
Current 1
Current 2
400 Current 3
Current 4
Current 5
300
Current 6
Current 7
200 Current 8
Current 9
Legacy 1
100
Legacy 2
Legacy 3
0 Legacy 4
0 12 18 19 20 21 23 24 27 28 29 30 31 32 33 34 35 36 37 38 40 Legacy 5
Attenuation (dB)
Source: Ofcom
Note: one legacy router did not support the 5GHz band and was excluded from the results for that test.
8.7 The table below can be used to convert the attenuation values shown in Figures 28 and 29
into distances under ideal conditions.
35Figure 30: Conversion of attenuation to distance under ideal conditions
Equivalent
Attenuation (dB)
distance (m)
0 1
10 3.16
20 10
30 31.6
40 100
Source: Ofcom
8.8 In a real home, the Wi-Fi signal is also reduced by obstacles such as doors and walls. The
following table gives some examples of how different construction materials attenuate the
signal, which has the effect of reducing range within the home.
Figure 31: Attenuation values of construction materials
Attenuation (dB)
Material
2.4GHz 5GHz
Interior drywall 3-4 3-5
Wooden door (hollow – solid) 3-4 6-7
Brick / concrete wall 6-18 10-30
Glass / window 2-3 6-8
Double-pane coated glass 13 20
Source: Ofcom
Ways of improving Wi-Fi performance
8.9 There are several ways to improve Wi-Fi performance within the home. Below we outline
how Wi-Fi signal strength and coverage can be improved to get the best possible home
broadband experience.
Router network selection
8.10 Most Wi-Fi routers broadcast their signal on one of two separate frequencies: 2.4GHz and
5GHz.2 This is why ‘2G’ or ‘5G’ is sometimes included in the Wi-Fi network’s name (SSID).
Both frequencies have their advantages and drawbacks. As shown above, Wi-Fi broadcast
on the 2.4GHz frequency offers slower data speeds but can travel further and cover a
larger area than 5GHz Wi-Fi signals. Conversely, the 5GHz frequency offers faster internet
speeds at the cost of signal range.
8.11 The frequency a router broadcasts on (or which devices use) can be changed if either an
increase in the coverage of home Wi-Fi signal or an increased speed of wireless connection
2 Some newer (Wi-Fi 6) routers also use the 5.8GHz band.
36is preferred. Otherwise, most modern routers will intelligently connect using whichever
frequency is likely to provide the best connectivity. The device in use will determine the
Wi-Fi user-experience, and an older device with a basic Wi-Fi chipset will not be able to
take advantage of the improved performance offered by newer Wi-Fi connection types,
even if the router supports this functionality.
Router placement
8.12 The location of the Wi-Fi router within the home can greatly affect Wi-Fi performance. As
Wi-Fi passes through different materials the signal degrades, with some materials reducing
the signal more than others.
8.13 For example, it is likely to be more difficult to get a strong Wi-Fi signal throughout an old
house with internal brick walls than a newer one with stud walls, although the foil-backed
insulation used in modern homes can also make it difficult to receive a strong Wi-Fi signal.
This is because metal has a high attenuation, meaning that it blocks more of the Wi-Fi
signal. Water also has a high attenuation, so it is better to place a router away from objects
like radiators and fish tanks.
8.14 Some electrical devices can interfere with the router’s signal, such as microwave ovens
which operate on the same 2.4GHz band as some routers. Other electrical devices known
to impact Wi-Fi signals include baby monitors, cordless telephones, lamps and even
Christmas tree fairy lights, so it is best to place the router as far from any other electrical
equipment as possible.
8.15 The placement of the router can also impact on the quality of the Wi-Fi signal. Routers are
designed to broadcast signals in all directions, including vertically, so placing the router on
a raised surface off the ground (such as a shelf) can help improve coverage. Another way to
maximise Wi-Fi coverage is to position the router so that it does not send signals outside
the home. Placing the router in a central location in the home, as opposed to next to
external walls, will avoid wasted signal coverage. If the router has more than one antenna,
the signal can be directed by positioning the antennae at 90 degrees to one another, e.g.
positioning one horizontally and the other vertically instead of pointing them in the same
direction.
Additional ways to boost Wi-Fi performance
There are a number of products on the market that are designed to work with existing routers to
improve Wi-Fi signal strength and coverage.
8.16 Wi-Fi boosters/extenders/repeaters. These tend to work by picking up the signal
broadcast by the existing home Wi-Fi router and then amplifying and rebroadcasting it,
although some create a new Wi-Fi network. Positioning these products in a part of the
home where the existing router’s signal is weak can extend home Wi-Fi coverage, though
users may find that connection speeds are slowed down and network response time
(latency) is increased as a result.
378.17 Wi-Fi mesh networks. Wi-Fi mesh networks create their own Wi-Fi network by way of a
main router which connects to individual “nodes” that can be placed around the home.
These nodes then communicate with one another to improve signal strength and coverage
and can be easily moved from room to room to allow for a more flexible and integrated
home Wi-Fi network. A benefit of mesh networks is that when connected correctly the
performance of the connection is not impaired.
8.18 Third-party routers. Another option is to purchase a third-party router (i.e. one that is not
provided by the broadband provider). There may be benefits to using a third-party router,
for example, it might provide better Wi-Fi performance than a router provided by the
broadband provider and give the user greater freedom to configure its settings, although
set-up is likely to require a degree of technical knowledge. A drawback of using a third-
party router is that the broadband provider will probably not be able to offer technical
support if a problem occurs.
Wired broadband connectivity solutions
Wired solutions offer an alternative to Wi-Fi.
8.19 Ethernet cable. Wired Ethernet connections offer a more consistent internet connection
(including faster internet speeds and lower latency) than Wi-Fi and are not affected by
interference and signal loss to the same extent. Those using a device with an Ethernet port,
such as a games console or TV set-top box, are likely to find that connecting the device via
Ethernet will improve the quality of the connection. It is important to use Ethernet cabling
that can provide the data transmission speeds of your broadband connection, otherwise
the performance may be limited.
8.20 Powerline. Powerline extenders work by using the electrical wiring of your home to
transmit data around the house. The set-up involves two adapters which are plugged into
electrical sockets, one of which is connected to the router via an Ethernet cable and the
other to the device/s being used (using Ethernet, or sometimes Wi-Fi). Powerline is
relatively inexpensive but will only work in homes where there is one electrical ring
(circuit). The performance of a Powerline connection is also dependent on the Powerline
devices being used and the quality of the electrical wiring in the home.
38You can also read