Comparative Genomics of Mycobacterium avium Subspecies Paratuberculosis Sheep Strains - Frontiers
←
→
Page content transcription
If your browser does not render page correctly, please read the page content below
ORIGINAL RESEARCH
                                                                                                                                           published: 15 February 2021
                                                                                                                                       doi: 10.3389/fvets.2021.637637

                                             Comparative Genomics of
                                             Mycobacterium avium Subspecies
                                             Paratuberculosis Sheep Strains
                                             Rachel Mizzi 1*, Verlaine J. Timms 2 , Marian L. Price-Carter 3 , Milan Gautam 4 ,
                                             Richard Whittington 1 , Cord Heuer 4 , Patrick J. Biggs 4,5 and Karren M. Plain 1
                                             1
                                              Farm Animal Health Group, Sydney School of Veterinary Science, Faculty of Science, The University of Sydney, Camden,
                                             NSW, Australia, 2 Centre for Infectious Diseases and Microbiology, Public Health, Westmead Hospital, Westmead, NSW,
                                             Australia, 3 AgResearch, Hopkirk Research Institute, Palmerston North, New Zealand, 4 School of Veterinary Science, Massey
                                             University, Palmerston North, New Zealand, 5 School of Fundamental Sciences, Massey University, Palmerston North, New
                                             Zealand

                                             Mycobacterium avium subspecies paratuberculosis (MAP) is the aetiological agent of
                                             Johne’s disease (JD), a chronic enteritis that causes major losses to the global livestock
                                             industry. Further, it has been associated with human Crohn’s disease. Several strains of
                                             MAP have been identified, the two major groups being sheep strain MAP, which includes
                                             the Type I and Type III sub-lineages, and the cattle strain or Type II MAP lineage, of
                             Edited by:      which bison strains are a sub-grouping. Major genotypic, phenotypic and pathogenic
                       Miguel Salgado,       variations have been identified in prior comparisons, but the research has predominately
       Austral University of Chile, Chile
                                             focused on cattle strains of MAP. In countries where the sheep industries are more
                      Reviewed by:
           Kumaragurubaran Karthik,
                                             prevalent, however, such as Australia and New Zealand, ovine JD is a substantial burden.
    Tamil Nadu Veterinary and Animal         An information gap exists regarding the genomic differences between sheep strain
            Sciences University, India
                                             sub-lineages and the relevance of Type I and Type III MAP in terms of epidemiology
                    Hazem Ramadan,
 US National Poultry Research Centre         and/or pathogenicity. We therefore investigated sheep MAP isolates from Australia and
          (USDA-ARS), United States          New Zealand using whole genome sequencing. For additional context, sheep MAP
                  *Correspondence:           genome datasets were downloaded from the Sequence Read Archive and GenBank.
                          Rachel Mizzi
           rachel.mizzi@sydney.edu.au
                                             The final dataset contained 18 Type III and 16 Type I isolates and the K10 cattle strain
                                             MAP reference genome. Using a pan-genome approach, an updated global phylogeny
                    Specialty section:       for sheep MAP from de novo assemblies was produced. When rooted with the K10
         This article was submitted to
                                             cattle reference strain, two distinct clades representing the lineages were apparent.
        Veterinary Infectious Diseases,
                a section of the journal     The Australian and New Zealand isolates formed a distinct sub-clade within the type
        Frontiers in Veterinary Science      I lineage, while the European type I isolates formed another less closely related group.
       Received: 04 December 2020            Within the type III lineage, isolates appeared more genetically diverse and were from
        Accepted: 25 January 2021
       Published: 15 February 2021
                                             a greater number of continents. Querying of the pan-genome and verification using
                               Citation:
                                             BLAST analysis revealed lineage-specific variations (n = 13) including genes responsible
  Mizzi R, Timms VJ, Price-Carter ML,        for metabolism and stress responses. The genetic differences identified may represent
  Gautam M, Whittington R, Heuer C,
                                             important epidemiological and virulence traits specific to sheep MAP. This knowledge
        Biggs PJ and Plain KM (2021)
             Comparative Genomics of         will potentially contribute to improved vaccine development and control measures for
   Mycobacterium avium Subspecies            these strains.
      Paratuberculosis Sheep Strains.
             Front. Vet. Sci. 8:637637.      Keywords: Johne’s disease, Mycobacterium avium subspecies paratuberculosis, pan-genome, sheep strain,
     doi: 10.3389/fvets.2021.637637          whole genome sequencing, type I, type III

Frontiers in Veterinary Science | www.frontiersin.org                              1                                         February 2021 | Volume 8 | Article 637637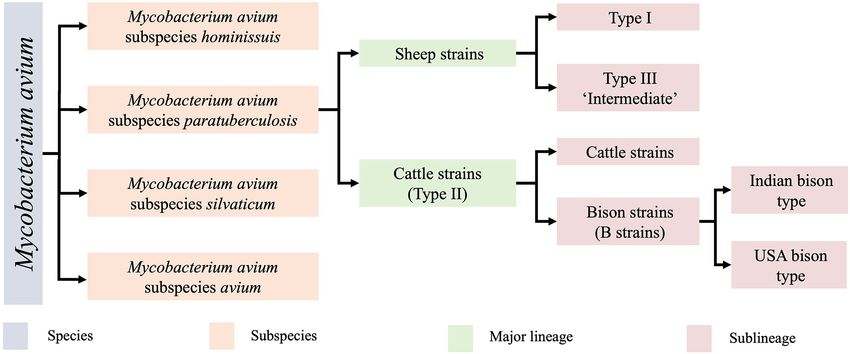
Mizzi et al. Comparative Genomics of Sheep MAP
INTRODUCTION tandem repeats (VNTR) and short sequence repeat (SSR) loci
(13, 14). Typing methods have helped to determine that MAP
Johne’s Disease (JD) is a chronic gastroenteritis of ruminant strains are cross transmissible between ruminant species (14–16),
species worldwide (1). Additionally, the causative agent, leading to some researchers preferring to designate S strains as
Mycobacterium avium subspecies paratuberculosis (MAP), has Type I and C strain as Type II to avoid confusion. Within the
been implicated in the pathobiology of Crohn’s disease in two major groups, several sub-lineages of MAP strains exist. The
humans. Despite a strong association, causality has not been C strain/Type II lineage contains a subcategory of bison strains,
proven (2, 3). A major complication of JD is the extended which were originally thought to be their own lineage (17, 18)
subclinical phase. During this stage, low levels of intermittent but were recently demonstrated to be a sub-lineage of Type II
bacterial shedding occurs in the faeces. Low levels of shedding by whole genome sequencing (WGS) (9) with regional lineages
may be difficult to detect with current diagnostic tests and may present in India and America (18). Within the S group there are
lead to false negative results. This insufficient sensitivity may two sub-lineages, Type I and Type III. The Type III strains were
allow for ongoing spread of the pathogen (4). Overall, losses initially thought to be an intermediate of sheep and cattle strains
due to clinical disease tend to be highest in dairy cattle since (11, 19) but were later proven to be a sub-lineage of S strains by
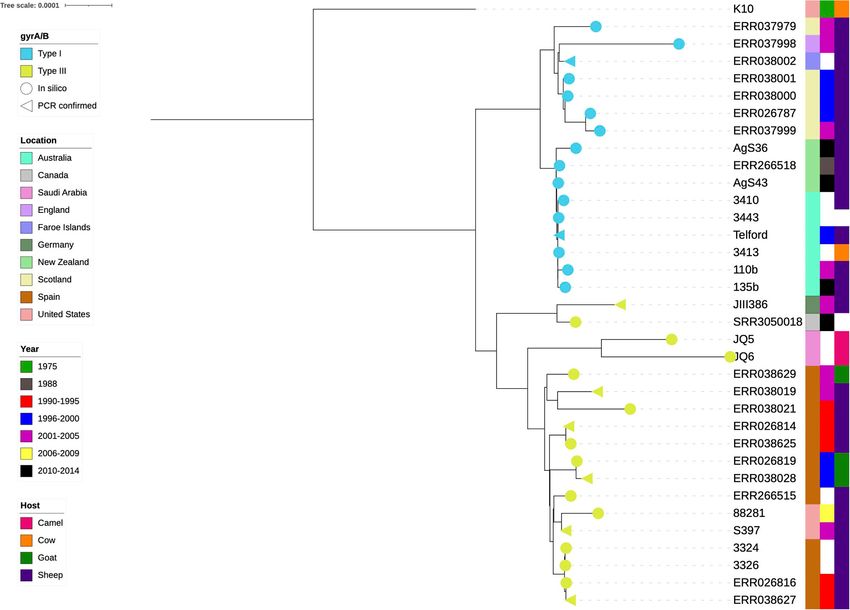
animals are retained in herds to older ages and hence have WGS (9) (Figure 1).
more time to develop disease. An Australian study estimated an Accurate strain identification of MAP is vital for
average cost of $2,491AUD per cow with clinical JD (5). A similar source attribution and mapping transmission pathways in
value of $2,386AUD per clinical case was estimated by a French epidemiological investigations. Furthermore, it improves the
study (6). In sheep, the main losses are attributed to mortalities knowledge of bacterial population structure. This betters our
which have been estimated at 1–10% in Australian flocks (1, 7). understanding of the genetic diversity that exists in a population
Stud operations may become unviable if JD is prevalent due to and potentially links a genotype with a disease outcome,
restrictions imposed on sales and a reduced customer base (8). transmission risk factors or origin of infection in the case of a
Thus, control of MAP and the ability to trace the spread of disease new outbreak if the transmission chain is unknown. Specific
is critical. Further studies are required to inform producers of the control strategies may be warranted in the case of a new outbreak
economic losses and the cost-benefit for JD control measures in if the transmission chain is known. This is particularly important
sheep enterprises. for a pathogen such as MAP which has multiple host species, and
MAP is one of four closely related subspecies within the therefore different potential agro-industrial or wildlife sources
species Mycobacterium avium (Figure 1). Within this subspecies, and may be zoonotic. Historically, strain typing required culture
two major groups are recognised, the sheep strains (S strains) of MAP, a process that is very time-consuming and may result in
and cattle strains (C strains), which were named after the host false negative results (20) if an inappropriate culture medium is
from which they were originally isolated (11). S and C strains used. This is particularly important for sheep strains, which are
of MAP can be distinguished by a variety of molecular methods notoriously difficult to culture; typing was originally undertaken
including variation in the IS1311 sequence (12), variable number after physically extracting bacterial cells from intestinal mucosa
FIGURE 1 | The Mycobacterium avium species and lineages of MAP and their associated nomenclature. Originally identified by low resolution techniques, clarification
of these lineages has now been demarcated by whole genome sequencing (9, 10). The Type I and Type III sheep sublineages are the focus of the present study.
Frontiers in Veterinary Science | www.frontiersin.org 2 February 2021 | Volume 8 | Article 637637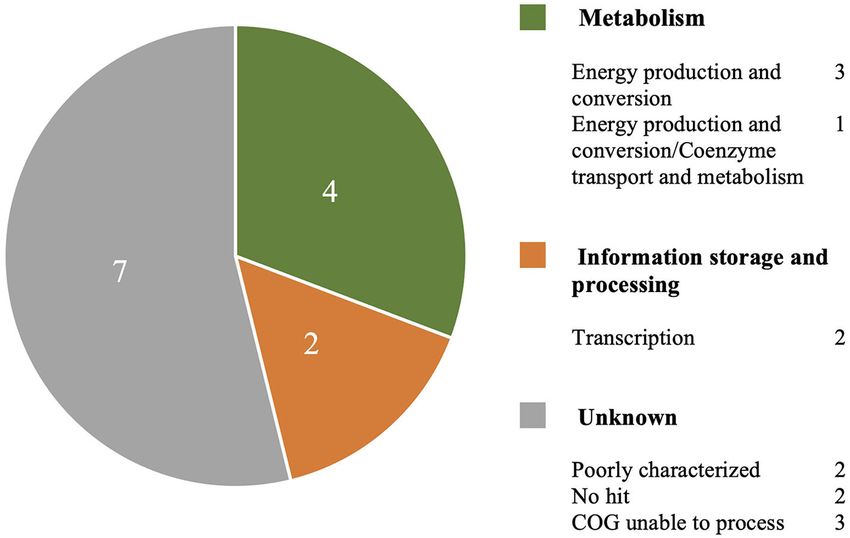
Mizzi et al.                                                                                                   Comparative Genomics of Sheep MAP

(21). Phenotypic differences between S and C strains have been             from genomic data agrees with pan-genome microarray data
described that relate to culture requirements and virulence                (42, 43). Moreover, analysis of microarray suggests that there
(22), with S strains appearing less virulent in vivo in terms              is significant variability between the sub-lineages of MAP S
of the ability to infect multiple species and also in vitro in             strains (43).
models when human or bovine macrophages are used (23).                        Understanding genetic diversity within a population of
Notably, when ovine derived cells were used in an in vitro model,          bacterial pathogens may provide insights into virulence,
virulence was restored in S strains (24). Thus far, these functional       antibiotic susceptibility and other phenotypic traits important
investigations of MAP have included a limited number of                    for the treatment and control of infectious diseases. Better
isolates, predominantly focused on differences between a few S             characterisation of existing MAP strains will likely provides
and C strains (25–27). This is problematic, since S strains have           insights into mechanisms of host preference in S strains (25)
been reported to be more heterogenic than C strains (13, 28).              and inform diagnostic test and vaccine development. Detected
    Currently employed typing tools distinguish MAP isolates to            differences between the type I and type III sheep subtypes may
varying degrees and numerous methods have been employed                    reveal important evolutionary, epidemiological and virulence
(29). IS1311 restriction fragment length polymorphism (RFLP) is            traits specific to each sub-lineage. In the present study, we
widely used for distinguishing between C and S strains of MAP              compare type I and type III sheep MAP genomes from several
(30). However, this technique is insufficient for distinguishing           global locations and host species using a pan-genome approach.
between the sheep MAP Type I and III sub-lineages. Strain
typing of sheep MAP sub-lineages has been reported using                   MATERIALS AND METHODS
the gyrA and gyrB genes. While these genes have a very low
mutation rate and have previously been reported for typing of              Isolate Collation
closely related mycobacteria (31), this test is not widely used for        MAP genomes used in this study were from a variety of sources.
typing MAP or other mycobacteriaI species. Furthermore, few                Publicly available genomes were downloaded from the National
studies distinguish between sheep MAP types, thus presenting an            Centre for Biotechnology Information (NCBI) GenBank and
information gap. Later studies investigating the genetic diversity         Sequence Read Archive (SRA) databases for Mycobacterium
of MAP utilised genotyping methods such as Mycobacterial                   avium subspecies paratuberculosis on the 3rd of March 2020.
Interspersed Repetitive Unit-Variable Number Tandem Repeat                 Search philtres for genome, Illumina and DNA were used
(MIRU-VNTR) and short sequence repeat typing (SSR) and other               in the SRA. For isolates JQ5, JQ6, 88281, S397, JIII386 and
PCR assays (13, 14, 32, 33), which use multiple loci and are               Telford, raw reads were not available therefore assemblies were
more useful for determining population structures. In one study,           downloaded from GenBank. Additional New Zealand isolates
MIRU-VNTR typing was unable to distinguish between Type I                  AgS43 and AgS36 were originally sourced from sheep tissue or
and Type III sheep strains (13). However, tests such as MIRU-              faecal samples from New Zealand Veterinary Pathology Limited
VNTR, SSR and PCR-based assays are able to distinguish MAP                 (Palmerston North, New Zealand) and were regrown from the
strains with higher efficiency when combined with each other               AgResearch Ltd. strain archive. Isolates 3410, 3443, 3413, 110b,
or other techniques such as IS900 RFLP (34–37). Despite these              135b, 3324 and 3326 were sourced from the University of
techniques being more advanced they still provide limited insight          Sydney archive collection that were used in previous studies
into the functional consequences of genetic diversity and have             (22, 46). These isolates included four Australian isolates (3443,
been shown at times to both underestimate and overestimate the             135b, 110b, 3413 and 3410) and two Spanish isolates (3324
diversity of MAP in some scenarios. In contrast, WGS enables               and 3326). Detailed information on isolates is available in
high resolution genetic data to be obtained from bacterial isolates        Supplementary Material 1. Culture and extraction of isolates
and enables more data to be obtained for each isolate than any             from the University of Sydney was done as described below.
other genotype test, leading to the resolution of relationships
between lineages that has enabled a more complete overview of              MAP Culture and DNA Extraction
the population structure of MAP (9).                                       Isolates were cultured as previously described (47) and pellets
    Studies on lineage-specific variants of MAP to date have               were washed and placed in 300 µL of Tris-EDTA (TE) (10 mM
focused on holistic differences between the S and C strains. Early         Tris, 1 mM EDTA, Ambion) buffer and stored at −80◦ C
literature utilised laborious subtractive hybridisation methods            until further processing. MAP suspensions were thawed at
available at the time (38–41). This was followed by microarray             room temperature prior to addition of 550 µL of TE buffer.
hybridisation studies (42, 43). Today, WGS offers unique insights          Declumping was achieved by drawing the suspension through
on comparative genomics. The first complete MAP whole                      a 25-gauge needle seven times followed by vigorous vortexing.
genome sequence was on K10, a C strain isolate (44) and this is            Suspensions were heat inactivated at 85◦ C for 30 min, then
an invaluable resource for further comparative genomics work. In           mechanically lysed in a 2 ml conical base screw capped tube
2012, the draught sequence of S397, a Type III S strain, revealed          containing 0.3 g of Zirconia/Silica beads (BioSpec Products Inc,
differences between S and C strains at the whole genome level              Daintree Scientific) using a Tissue lyser II (Qiagen) at a frequency
(45). Comparison of the K10 (type II) and S397 (type III) genome           of 30 for 1 min 40 s, twice followed by centrifugation at 16,000 x
sequences revealed 10 large sequence polymorphisms in the type             g for 3 min and the supernatant was transferred to a new 1.5 ml
III isolate that contained >4 open reading frames, compared to             tube. DNA extraction was performed based on the method of
the type II sequence (45). The presence of these polymorphisms             Choy et al. (21).

Frontiers in Veterinary Science | www.frontiersin.org                  3                                    February 2021 | Volume 8 | Article 637637
Mizzi et al. Comparative Genomics of Sheep MAP
To disrupt the cell wall, 60 µL of 200 mg/mL Lysozyme testing options. To improve the assemblies, the Bayes-Hammer
(Sigma-Aldrich) was added and the samples were incubated for read correction, and careful option for post-assembly Burrows
2 h at 37◦ C with gentle mixing. To remove contaminating RNA, Wheeler Aligner mismatch correction (50) were also used.
20 µl 20 mg/ml RNAse (Sigma-Aldrich) was added and incubated Seven isolates retrieved from GenBank were only available as
for a further 3 h. To complete cell wall breakdown, 200 units assemblies (fasta files). Quality assessment of the assemblies
of Mutanolysin (Sigma-Aldrich) was added and lysates were was done with Quast (version 5.0.2, RRID:SCR_001228) (51).
incubated for 12–16 h at 37◦ C with gentle mixing. Following Assemblies which had a GC% of 500
this, 35 µL of Proteinase K solution (10 mg/mL) (Sigma- or a total length outside of 4.5–5.3 Mb were removed from the
Aldrich) and 60 µL of 10% sodium dodecyl sulphate were final analysis.
added and the suspensions were incubated for 24 h at 37◦ C
with gentle mixing. The Proteinase K was inactivated by heating Pan-genome Analysis
at 70◦ C for 10 min and then 97.5 µL 5M NaCl and 82.5 µL Genome annotation was undertaken with Prokka (version 1.13.3,
CTAB/ NaCl (Bioline) pre-warmed to 65◦ C were added and RRID:SCR_014732) (52) with the minimum contig length set to
the lysates incubated at 65◦ C with gentle mixing for 10 min. 500 base pairs. GFF files from Prokka were used as an input
On completion, 700 µL of 25:24:1 phenol/ chloroform/ isoamyl for the Roary (version 3.12.0, RRID:SCR_018172) (53) pan-
alcohol (Sigma-Aldrich) was added and mixed vigorously for genome pipeline. Within this pipeline MAFFT (version 7.402)
30 s by pipetting. The upper aqueous phase was collected after (54) was used to produce a nucleotide multifasta alignment of all
centrifuging at 12,000 × g for 10 min. To remove excess phenol, core genes.
an approximately equal volume of chloroform:isoamyl alcohol
(24:1) (Sigma-Aldrich) was added and centrifuged at 12,000 x
g for 10 min. The upper aqueous layer was collected and mixed Phylogenetic Analyses and Pruning
well via inversion for 1 min with 1,000 µL of 2-Propanol (Sigma- IQ-Tree (version 1.6.7, RRID:SCR_017254) (55) was used
Aldrich). DNA was pelleted by centrifuging for 15 min at 12,000 to generate trees from the core gene alignment output
× g. The pellet was washed twice using 70% molecular-grade from Roary. Within IQ-Tree, ModelFinder (56) was used to
ethanol (Sigma-Aldrich) in nuclease-free water, cooled to −20◦ C, identify the best-fitting model, which turned out to be the
then centrifuged for 15 min at 12,000 × g. The supernatant was general time reversible model (GTR+F+R4) (57). Trees were
removed and the pellet was resuspended in 30 µL of 10 mM visualised and annotated in iTOL (RRID:SCR_018174) (58). Any
Tris buffer, pH 8.0 (Astral Scientific). Resolublization of DNA isolates that clustered with the S397 (accession AFIF01000001)
occurred at room temperature overnight with gentle mixing. On or Telford (accession CP033688.1) reference genomes were
completion, samples were stored at −80◦ C. DNA quality was retained and used in the downstream comparative analysis.
assessed using a NanoDropTM 2000 spectrophotometer (Thermo Those which were phylogenetically distant to known sheep
Fisher Scientific). Samples with A260/280 below 1.7 or A230/280 < MAP genomes Telford (accession CP033688.1) (59) and S397
1.2 were discarded and re-isolated. A Quant-iTTM PicoGreenTM (accession AFIF01000001) or clustered with the K10 reference
dsDNA Assay Kit (Thermo Fisher Scientific) was used to measure were discarded.
DNA concentration. The K10 reference and any sequences that did not meet quality
New Zealand isolates AgS43 and AgS36 were re-cultured, criteria outlined in the Quality control and assembly section were
extracted and sequenced as described by Gautam et al. removed and Treemmer (60) was used to reduce redundancies
(in preparation). within the type I dataset and bias of downstream analyses. Some
manual selection of isolates was undertaken to maximise the
Library Preparation and Whole Genome geographical diversity of isolates within the dataset. The final
dataset of 34 isolates contained 16 type I and 18 type III isolates.
Sequencing
This enabled 95% of the original diversity to be retained. The
WGS of isolates 3410, 3443, 3413, 110b, 135b 3324 and 3326
K10 reference was retained in the final dataset as a root for the
was carried out at the NSW Mycobacterium Tuberculosis
phylogenetic tree.
Reference Laboratory at the Centre of Infectious Diseases and
Microbiology, Westmead Hospital on the Illumina sequencing
platform. A Nextera XT library preparation kit (Illumina, Analysis of the gyrA/B Genes
Scoresby, Victoria, Australia) was used to generate paired The gyrA and gyrB genes from the Telford (accession
indexed libraries of 150 base pairs in length as per the CP033688.1) type I reference (59) and S397 (accession
manufacturer’s instruction. Sequencing was done using the AFIF01000001) type III reference (45) genomes were used
Illumina NextSeq platform. as a basis for in silico genotyping. BLAST analysis of the two
versions of these two genes was used to confirm that the two
Quality Control and Assembly major branches in the phylogeny were indeed Type I or Type III
Fastq files were trimmed using Trimmomatic (version 0.36, in the other analysed isolates. The online BLAST global align tool
RRID:SCR_011848) (48) with options set to -phred33, (available at https://blast.ncbi.nlm.nih.gov/Blast.cgi) from the
LEADING:3 TRAILING:3 SLIDINGWINDOW:4:20 National Centre for Biotechnology Information (NCBI) was used
MINLEN:36. Reads were assembled with SPAdes (version to compare the nucleotide and protein sequences of the genes
3.12.0, RRID:SCR_000131) (49) using the default k-mer size between lineages.
Frontiers in Veterinary Science | www.frontiersin.org 4 February 2021 | Volume 8 | Article 637637Mizzi et al. Comparative Genomics of Sheep MAP FIGURE 2 | Phylogenetic tree of the final dataset of 34 sheep MAP isolates. The cattle K10 reference genome used in the tree as a root was excluded from all further analyses. Test confirmed types (n = 8) are annotated with a triangle, in silico results are represented by a circle, yellow is type III and blue is the type I. The colour strips from left to right are location, year of isolation and host species, respectively. White blocks indicate missing data. Querying the Pan-genome there were no contig boundaries interfering with the genes The pan-genome analysis was repeated on the final dataset of interest. (Figure 2) to reduce the likelihood of noise due to misassembles or mis-annotations and prevent bias towards large clusters of highly similar genomes. Genes of interest were those that Blast were present in one lineage and absent from the other or To obtain additional annotation data for hypothetical proteins had consistent lineage-specific variations. To minimise the potentially missed by automated annotation, a BLASTx of the likelihood of a lineage-specific gene being an assembly or nucleotide sequences of each gene of interest was undertaken annotation artefact, candidate genes of interest had to be using the NCBI online BLASTx tool (RRID:SCR_001653). The identified by Prokka annotation in all isolates from one lineage hit with the smallest e-value, a minimum of 99% identity and a and completely absent from the other. The gene presence/absence minimum length of at least 99% of the query length was used. output from Roary was used as an input for Scoary (61). This The nucleotide sequence of lineage-specific genes was obtained tool was used to identify genes of interest and demonstrate from the Roary pan-genome reference fasta output file. This file a gene’s association with a respective lineage. A fasta file contains a representative nucleotide sequence for each protein containing all lineage specific coding sequences (CDS) was annotated in the analysis. A nucleotide BLAST of each lineage- uploaded to the EggNOG web-tool (available http://eggnog- specific gene identified by Scoary to all sheep genomes in the mapper.embl.de/) (RRID:SCR_002456) to obtain functional study confirmed if the gene was present in the other lineage but categories for each gene. Contigs of draught genomes were had undergone mutations that led to an annotation failure by reordered and aligned to the Telford reference genome (accession Prokka. The NCBI BLAST global align tool was used to compare CP033688.1) with mauve (RRID:SCR_012852) (version 2.4.0) lineage variants of protein sequences (available at https://blast. (62, 63) to view contig boundaries within isolates and confirm ncbi.nlm.nih.gov/Blast.cgi). Frontiers in Veterinary Science | www.frontiersin.org 5 February 2021 | Volume 8 | Article 637637
Mizzi et al.                                                                                                                            Comparative Genomics of Sheep MAP

RESULTS                                                                                        Most of the type I isolates had a gyrA and gyrB nucleotide
                                                                                           sequence that was identical to the type I reference genome. The
Whole Genome Sequencing and Assembly                                                       one exception was the New Zealand isolate AgS36 which had a
Approximately 400 MAP genomes were available from the                                      single, synonymous SNP in both the gyrA and gyrB gene. All Type
SRA and an additional 50 were available from GenBank.                                      I gyrA and gyrB protein sequences were identical.
These genomes were screened and assemblies that did not                                        Type III isolates contained two (n = 16 isolates) or three (n =
reach quality thresholds described in the methods quality                                  2 isolates) SNP differences compared to the type I gyrA gene. The
assessment section and those that clustered more closely                                   type III nucleotide sequence of the gyrA gene was consistently
with K10 than S Type references were removed. Treemmer                                     different by two SNPs with all type I isolates. Within the Type
culled an additional 40 S strain isolates that represented                                 III isolates, the S397 gyrA gene was 100% identical to 16 isolates
redundancies in the dataset. The final dataset included                                    and had a single SNP difference compared to two of the type III
16 Type I and 18 Type III isolates from 10 different                                       isolates. The two type III isolates which contained an additional
geographical sources and five different hosts. The average                                 SNP in the gyrA gene were JIII386 and SRR3050018.
GC% content across both lineages was 69.23% (Table 1).                                         Protein sequence BLASTs revealed a single mismatch between
The average genome length was 4,819,192 bp and 4,794,996                                   the Type I gyrA reference sequence and 16 Type III isolates.
bp for Type I and Type III isolates, respectively (Table 1).                               Type III isolates JIII386 and SRR3050018 had two mismatches
Overall, the average quality of the draught assemblies was                                 compared to the type I gyrA which also had a mismatch to the
similar with the number of contigs and N50 for Type I                                      type III gyrA protein sequence indicating a non-synonymous
at 268.9 and 45,862 bp and 247.9 and 113,636.8 bp for                                      mutation. Protein sequences from these two isolates were
Type III. Detailed information on isolate-specific assembly                                identical. Alignment of the S397 gyrA protein to that of isolate
statistics from QUAST and strain metadata can be found in                                  JIII386 demonstrated a single mismatch of an arginine to a
Supplementary Material 1. A phylogenetic tree including public                             glycine at amino acid number 558. A schematic comparison of
sequences culled by Treemmer to optimise diversity and those                               the Type I and III reference gyrA proteins to that of JIII386 is
that did not meet assembly quality thresholds is available                                 available in Supplementary Material 3.
in Supplementary Material 2.                                                                   The nucleotide sequence of the gyrB gene from the Type I
                                                                                           reference genome differed by 2 or 3 SNPs compared to all Type III
Analysis of gyrA/B Genes                                                                   isolates. The nucleotide sequence of the type III gyrB gene from
Eight isolates had previously undergone lineage typing using the
                                                                                           the Type III reference genome was two SNPs different to all type
gyrA/B genes using PCR and sequencing (9, 45, 59, 64, 65). The
                                                                                           I isolates, 100% identical to 16 of the type III isolates and differed
gyrA/B BLAST results of the present study were in agreement
                                                                                           by one SNP in isolates JQ5 and JQ6. The protein sequence of all
with these results. Only one gyrA/B type was present per
                                                                                           Type III isolates was identical, indicating that the SNP in isolate
lineage within the phylogeny (yellow and blue branch symbols,
                                                                                           JQ5 and JQ6 was synonymous.
Figure 2).
                                                                                               Isolates JIII386, SRR3050018, JQ5 and JQ6 were within
   A BLASTp global alignment between the gyrA translated
                                                                                           the Type III cluster (Figure 2), their gyr genes more closely
proteins from the Type I (Telford, CP033688.1) and Type III
                                                                                           resembled the Type III lineage and previous typing of JIII386
(from S397, AFIF01000001) reference genomes revealed a single
                                                                                           (65), JQ5 and JQ6 (64) indicated they were Type III, thus in this
mismatch where the Type I reference contained a glutamic
                                                                                           investigation they were considered Type III.
acid instead of a lysine at position 290. Alignment of the gyrB
protein sequences revealed a glutamic acid instead of a lysine at
position 594 in the Type I reference. This confirms one of the                             Phylogeny
SNPs found in each nucleotide sequence is non-synonymous. No                               A clear distinction between the Type I and Type III isolates
differences in gene or protein length were seen between the Type                           became obvious when the K10 reference was used as a tree root
I and Type III.                                                                            (Figure 2). The type I isolates were of Australian, New Zealand

TABLE 1 | Average basic assembly metrics and statistics for the isolates in this study and comparison of the sub-lineages.

                                                  K10*                               All sheep                                 Type I                                 Type III

No. genomes                                         1                                      34                                    16                                      18
GC%                                               69.3                                  69.23                                  69.24                                   69.22
Genome length (bp)                             4,829,781                             4,807,094                             4,819,192.25                              4,794,996
No. Contigs                                         1                                  258.38                                  268.87                                 247.89
N50**                                          4,829,781                             79,749.39                                 45,862                                 113,636

Metrics were calculated on the final dataset after pruning with Treemmer and removal of assemblies which did not meet the quality standards of GC% > 69%, number of contigs
Mizzi et al. Comparative Genomics of Sheep MAP
FIGURE 3 | Relative tree length plot of the dataset prior to trimming with Treemmer. Number of leaves is equal to the number of genomes present in a phylogenic tree.
Note the steep curve indicating that a small number of genomes represents a large amount of the diversity in this dataset. Additional genomes in this study would not
have increased the genetic diversity within the dataset, thus redundant genomes were removed. K10 was not included in this process since it is an outlier in the tree.
and European origin, with a distinct and very closely related TABLE 2 | Number of genes present in each category of genes in the
Australia and New Zealand clade present. The type III isolates pan-genome categorised by Roary.
appeared more diverse, both genetically as indicated by their Category All*
branch lengths in the phylogenetic tree, and geographically.
Core (99–100%) 3,239
Pan-genome Analysis Soft core (95–99%) 423
The increase in pan-genome size with the addition of new isolates Accessory (15–95%) 1,408
or strains can be used to predict the discovery rate of new genes Cloud (Mizzi et al. Comparative Genomics of Sheep MAP
TABLE 3 | Lineage-specific genes and variation of type I and type III isolates.
Gene Type Annotation Variations*
Group 4585 I Putative nuclear transport factor 2 family protein 5 variable mismatches in the Type III protein
Group 4593 I MMPL family transporter No significant protein hit in Type III isolates
cinA1 I 1,8-cineole 2-endo-monooxygenase Type III protein has 8–17 mismatches, length is
identical between lineages
mhpA2 I 3-(3-hydroxy-phenyl)propionate/3- Type I isolate protein sequences are 62 amino acids
hydroxycinnamic acid longer and Type III isolates have a single mismatch
hydroxylase
Group 4493 I Hemolysin III family protein Type III protein is 54 amino acids longer and
contains 9 mismatches to the Type I version
Group 4363 III
Group 4592 I MMPL family protein No significant protein hit in Type III isolates
Group 1815 I Hypothetical protein 1-2 mismatches in Type III protein and Type III is 22
amino acids shorter
Group 4617 I TetR/AcrR family transcriptional regulator 11 amino acid mismatches and the Type I protein is
three amino acids shorter
Group 4778 III
Group 4500 I Nitroreducatase family protein Type I protein is 185 amino acids long and Type III is
171. Contains 11 mismatches
Group 4772 III
Group 4781 III Hypothetical protein Type I isolates 37–164 amino acids long with
24–105 mismatches. Type III are all 299 amino acids
long with a single mismatch present in four isolates
Where Prokka annotated the gene as a hypothetical protein but BLASTx was able to provide a putative annotation, the BLASTx annotation was used. Variations are from BLASTp results.
*bp = base pairs.
annotations (Table 3). BLASTx results are available in proteins are 82% identical, differ by 11 amino acid mismatches
Supplementary Material 4. Six genes were identified that and the Type III protein is 14 amino acids shorter. Two type
are involved in metabolism, information processing and storage. I hypothetical proteins, group 4593 and group 4592 had no
Seven of the genes were uncharacterised and COG categories are significant protein hit in type III isolates. The haemolysin III
unavailable (Figure 4). family protein found in both lineages was also discovered in a
Most genes called in the Type I lineage were present in previous study (MAP2704) (43). BLASTx of MAP2704 produced
type III, but due to inconsistent differences within the type III similar results to that of the Type III variant (group4363).
isolates, they were not recognised as lineage specific for type A summary of lineage-specific variants that match previously
III (Table 3). This was found in the putative nuclear transport identified variable loci and a copy of Table 3 that summaries the
factor 2 family protein (group 4585), hypothetical protein 1815 differences between Type I and Type III genes of interest that also
and cinA1. Differences in the mhpA2 protein were consistently includes differences found in the K10 reference strain is available
different between Type I and III isolates. However, the very in Supplementary Material 5.
large difference in length between Type I and Type III BLAST
result indicates this may be an inconsequential alignment in the DISCUSSION
Type III lineage. Type III specific hypothetical protein 4781 had
no significant hits in 10 Type I isolates and hits with 82–105 Most studies on Johne’s disease and MAP epidemiology do not
mismatches in the remaining isolates. Some SNPs were present distinguish between S sub-types and thus the relative abundance
in group 4781 (hypothetical protein) within the Type III lineage, and virulence of each is not widely known. In this investigation,
resulting in a single mismatch that did not affect the overall length we address the epidemiology of each of these sub-types with
of the protein (Table 3). the view that conserved differences detected between lineages
Some genes had similar BLASTx results and appeared to be could be used for future studies into comparative virulence
variants of the same gene in each lineage. The Type I lineage- and larger epidemiological investigations. We also attempted to
specific haemolysin family protein (group 4493) is 203 amino reveal genomic differences using a pan-genome approach.
acids in length and 79% identical to the Type III haemolysin. The The current test used to distinguish between Type I and
Type III haemolysin family protein (group 4636) is 257 amino Type III lineages of sheep MAP uses a PCR-based assay on
acids in length and contains 9 mismatches compared to the the gyrA/B genes. Previously, these genes were demonstrated to
Type I version. The TetR/AcrR family transcriptional regulator have a low mutation rate and be ideal for the typing of slow
is 80% identical between lineages and differs by 11 mismatches growing mycobacteria (31). The presence of variable SNPs in
and three amino acids in length. The nitroreducatase family these genes, which were identified in our study, indicate that
Frontiers in Veterinary Science | www.frontiersin.org 8 February 2021 | Volume 8 | Article 637637Mizzi et al. Comparative Genomics of Sheep MAP
FIGURE 4 | A breakdown of COG annotations for genes of interest from Type I and Type III S strain lineages.
they are less conserved than suggested by Kasai and colleagues. III lineage had a larger number of genes in the pan-genome,
This variability may cause problems if SNPs occur in the primer displayed longer branches on the tree, and only four lineage-
binding sites of the existing assay (67). Thus, additional markers specific genes were identified. In contrast, Type I isolates were
identified by the present study may be useful. less diverse and had a larger number of genes characterised
Several attempts to understand the genetic diversity of MAP as being in the core genome. These findings are supported
have been undertaken (9, 14, 33, 36, 68). Of those using WGS as by previous work, which found Type I isolates to be more
a tool (9, 68), most isolates have been C strains (Type II lineages). homogenous (71). Similarly, the finding that Type III isolates
These investigations have incorporated several human isolates, are more heterogeneous than Type I isolates is also in agreement
which have all clustered with the C strains of MAP (9, 69). One with earlier findings which utilised PFGE and IS900-RFLP typing
possible reason for this is that C strains have a broader host techniques on a panel of isolates from a variety of countries
preference, while S strains of MAP are generally more host- (13, 28).
specific, though still capable of cross-species transmission given There appears to be association of lineage Type with different
the appropriate host-pathogen interactions and level of infection regions of Europe, with all Spanish and German isolates
pressure (14, 20). Due to the relatively small number of S strains belonging to the type III lineage and all European type I isolates
included in the published studies to date, minimal conclusions from Scotland, England and the Faroe Islands. One finding
could be drawn for S strains of MAP. A major limitation of that was not supported by literature was that Type III is the
earlier studies is the use of culture media that did not support predominant Type throughout the United States of America.
the growth of S strains of MAP (47). This may have led to a bias Previous work using SSR and PFGE identified Type I isolates
for inclusion of mainly C strains of MAP in the early studies and to be the predominant type throughout the United States (71).
in contemporary studies which have used inappropriate culture This discrepancy is potentially due to only two sheep MAP whole
media. Routine inclusion of S strain isolates in typing studies genome sequences being available from this location. Overall,
and improved ability to recognise the two sub-lineages may assist these epidemiological findings must be interpreted with caution
with tracing an S strain isolate in epidemiological investigations due to the small number of isolates used in the present study.
including human infections. Furthermore, historical (20) and Other biases include a lack of culturability of certain types of
contemporary reports of cross-species transmission of S strains MAP, and both the sampling effort in particular countries and
in co-grazing properties (14) leading to economic losses and enthusiasm of people who have gathered and curated culture
between wildlife reservoirs (16, 70) means that these strains have collections to facilitate such studies. These factors may introduce
genuine relevance. sampling bias to the apparent epidemiology of sheep MAP Types
Overall, the Type III lineage isolates analysed here appeared illustrated here.
to be more genetically heterogeneous than the Type I lineage Within Oceania, this study found low diversity in sheep MAP.
but were derived from a broader array of geographical sources. This may reflect a small sample size of the present study or the
Isolates of the Type III sub-lineage represent multiple continents slow rate that MAP accumulates genetic variation (9). A similar
including America, Europe and Asia in their locations. The Type conclusion for sheep MAP isolates was found in an earlier study
Frontiers in Veterinary Science | www.frontiersin.org 9 February 2021 | Volume 8 | Article 637637Mizzi et al. Comparative Genomics of Sheep MAP
that utilised IS900 RFLP and IS1311 polymorphism analyses of lipid components in mycobacteria (72). Prior investigations
an Australia-wide panel of isolates. Only a single RFLP type discovered variation in these genes in S strains of MAP (38).
(S1) was found in sheep strains (12). A recent epidemiological Both MMPL proteins from the Type I isolates had no significant
study of S strains of MAP in New Zealand using VNTR/SSR hits in the Type III isolates and no hits to any MAP genomes
(14) and WGS (Gautam et al., in preparation) demonstrated in the NCBI BLASTp database. The role of these proteins
low sequence diversity across the country. Akin to the present in lipid export would require further investigation in both
study, New Zealand isolates were solely of the Type I lineage lineages. The mphA genes have not been extensively studied
and Australian and New Zealand isolates appeared to be closely in mycobacteria but are involved in redox reactions (73).
related. Of relevance is that our methods differed from those of Similarly, the monooxygenase is a member of a superfamily of
the New Zealand group, which mapped all isolates to the Telford haemoprotein enzymes responsible for oxidative metabolism of
reference genome, whereas the present study utilised de novo fatty acids and acyl homoserine lactones (74). These enzymes are
assembly. The similar grouping of sheep isolates from Australia thought to give bacteria a competitive advantage since they can
and New Zealand in comparison to those from other countries block signalling of other bacteria (75). Differences in these genes
helps validate both approaches when exploring MAP diversity. between lineages may offer a regional selective advantage against
The tight clustering of Australian and New Zealand sheep isolates conditions encountered by each lineage. Alternatively, the higher
may indicate recent transmission between these countries and similarity of Type I isolate may indicate clonal expansion of a
reflect geographical isolation from the rest of the world. more virulent isolate that diverged from the common ancestor
Thirteen genes were annotated as lineage-specific in this of Type I and Type III isolates in the past.
investigation, using the program Scoary. BLAST results Both lineages had consistent variations in genes involved in
demonstrated that each of these are not fully lineage-specific metabolism and transcription including a haemolysin III family
genes, but that each gene contained a lineage-specific mutation. protein, a nitroreducatase family protein and a TetR/AcrR family
Discrepancies between Roary and BLAST are potentially due to transcriptional regulator. These genes have all been previously
small variants within genes, such as insertions or deletions. These linked with virulence. Haemolysin III family proteins are surface
mutations may have moved the reading frame of the nucleotides, associated and may be involved in the acquisition of nutrients and
leading to alternate predicated protein sequences such that drug resistance in M. tuberculosis (76). Nitroreductase enzymes
annotation software no longer recognised these proteins as being convert nitro-containing compounds to their corresponding
derived from the same gene. Eleven of the 13 genes of interest amine and are associated with the stress response in mycobacteria
were annotated as hypothetical proteins, and in these cases, (77). The TetR/AcrR family transcriptional regulator is a gene
BLASTx was used to determine if they had functions previously involved with a paired mechanism responsible for chemical
identified in other, related species. BLASTx also served to find signalling and bacterial homeostasis (78). Further in vitro work
overlaps between lineage-specific genes from each group, where would be required to investigate if these differences have a
annotations from Prokka were ambiguous. Previous microarray functional impact on MAP lineages.
data demonstrated several variable loci between Type I and Type An unexpected finding in the present study was the variability
III isolates (43). Many of these findings were supported by the of the gyrA and gyrB genes within sub-lineages. These genes
present study including one locus (MAP2704) that encodes a have been described to have type-specific mutations between
haemolysin III family protein that was found in both studies lineages (67). Non-synonymous SNPs were found within the
(group4363 in Type III and group4493 in Type I). BLASTx of the type III isolates in the gyrA gene and synonymous SNPs found
MAP2704 nucleotide sequence retrieved an identical result as the in the gyrB gene. These mutations may represent regional
Type III specific gene group4363 (Supplementary Material 5). variants. Sequencing of PCR amplicons may have diagnostic
MAP2325 was thought to be absent from Type I isolates (42) value, but further work is needed to characterise the extent of
but was later found in Type I isolates from countries other than these mutations in various regions. A lineage-specific gyr variant
Australia (43). This gene was absent from all Australian Type I was not found by the pan-genome analysis, since the resulting
isolates tested but present in all other isolates with a single SNP proteins were of the same length between the lineages and thus
present in some Type III isolates. annotation software successfully identified the proteins as the
Type I isolates contained more conserved unique variants same. These genes have been the subject of multiple studies
than Type III isolates, potentially due to their lower diversity. in M. tuberculosis, in which SNPs have been found to confer
Proteins derived from most of these genes were found in the Type antimicrobial resistance (79, 80). Antimicrobial resistance is not
III isolates, but in the other lineage the sequences contained SNPs typically a concern in MAP since the use of antibiotics to treat
and polymorphisms which were inconsistent between isolates, Johne’s disease in ruminants is uncommon. However, keeping
whereas all the Type I sequences were identical. Genes in Type track of potential resistance markers may have human clinical
I isolates that were variable in Type III included a lineage-specific relevance. The presence of within-lineage SNPs in these genes
putative nuclear transport factor 2 family protein, mycobacterial indicates that their use as lineage-specific markers may not
membrane protein large (MMPL) family transporter, MMPL be ideal and a new diagnostic test may be required for rapid
family protein, hydroxycinnamic acid hydroxylase (mhpA2) and lineage identification.
a monooxygenase (cinA1). The MMPL genes are a subgroup Initially, de novo assembly was chosen over mapping to
of resistance-nodulation-division transporters involved in trans- a reference genome, since a wider variety of isolates were
envelop and trans-membrane export of immunomodulatory being used and a single reference genome was unlikely to
Frontiers in Veterinary Science | www.frontiersin.org 10 February 2021 | Volume 8 | Article 637637Mizzi et al. Comparative Genomics of Sheep MAP
be appropriate for all isolates. At the time of this study, functional differences of these genes and reveal how lineage
only a single reference genome was complete, the Australian differences relate to virulence and host adaptation.
Telford Type I (CP033688.1), all other available sheep strains
were only available as draught assemblies. Using a reference DATA AVAILABILITY STATEMENT
genome on isolates that are diverse could have led to
unmapped regions being missed by the analysis. To reduce The datasets generated for this study can be found in online
the possibility that our genes of interest were assembly or repositories. The names of the repository/repositories and
annotation artefacts, genes annotated by Prokka had to be accession number(s) can be found below: NCBI Sequence Read
identified by Scoary as lineage-specific. These candidate genes Archive, SRR13214442 - SRR13214448.
of interest were further investigated by BLAST to confirm
that within a lineage they were identical and that between
lineages, there were consistent differences specific to their AUTHOR CONTRIBUTIONS
respective lineages.
RM was responsible for the data collection, bioinformatics
Due to the possibility of assembly errors, poor and/or
analysis and writing of the manuscript. VT and KP assisted
incomplete coverage, more lineage specific genes and variations
with the study design and editing of the manuscript. VT also
may be present but were not identified by the present study.
assisted with the bioinformatics analyses. RW assisted in the
Repetitive regions such as the PPE/PE genes are difficult to
collection, curation and description of some of the study isolates
assemble since the assembly software cannot be certain where
and editing of the manuscript. MP-C, MG, PB, and CH assisted
raw sequencing reads belong if two regions are highly similar
with obtaining isolates and metadata from New Zealand and
or repetitive. These genes have been the subject of numerous
editing of the manuscript. All authors contributed to the article
studies and can represent important virulence traits and genomic
and approved the submitted version.
variation (81–86). Assembly errors in regions such as these can
result in a loss of important information on isolate diversity.
Efforts were made to include only high-quality genomic data FUNDING
in the study. Nevertheless, more lineage variations may have
This study was a piece of the first author’s P.hD. project funded
been missed due to their presence on a contig boundary or
by Meat and Livestock Australia (MLA) through project grant
poor genome coverage in particular regions such as the PPE/PE
P.PSH.0813. The funding body (MLA) provided support in the
genes of some isolates. This was partly seen in several genes
form of some authors’ salaries and research materials but did not
that were identified using Scoary as lineage-specific in type I
have any role in the study design, data collection and analysis or
isolates but not type III, due to slight differences within the
preparation of the manuscript.
Type III group. Future investigations may require long read
sequencing such as Nanopore long read sequencing so that
reads span regions that are difficult to assemble, such that ACKNOWLEDGMENTS
repetitive regions can be accurately assembled (87). This would
The authors would like to acknowledge the Sydney Informatics
enable the construction of complete sheep genomes so that more
Hub for enabling the use of the Artemis computer and
detailed comparisons can be made, a method which was recently
for training received by the first author. Assistance from
employed to compare genomes across all of M. avium (88).
Keenan Pey and Winkie Fong with the bioinformatics in
Having a number of complete or closed sheep MAP genomes
this study was greatly appreciated. Laboratory assistance
has the potential to reveal important differences in that we were
from Anna Waldron and Ann-Michele Whittington is
unable to be identify.
also acknowledged.
CONCLUSION
SUPPLEMENTARY MATERIAL
Within sub-lineages of S strain MAP, there appear to be distinct
The Supplementary Material for this article can be found
regional clusters, such as the Australian-New Zealand group
online at: https://www.frontiersin.org/articles/10.3389/fvets.
within the Type I lineage. The Type I lineage exhibits low genetic
2021.637637/full#supplementary-material
diversity compared to the Type III lineage. Within lineages, there
is evidence for lineage-specific variants of genes associated with Supplementary Material 1 | Isolate metadata list and QUAST results
Excel spreadsheet.
virulence in mycobacteria. By revealing lineage-specific markers
for S strains of MAP, there is potential for improving diagnostics Supplementary Material 2 | Phylogenetic tree including public sequences culled
by Treemmer and those that did not meet assembly quality thresholds.
so that rapid identification of Type I and III strains can occur.
These in silico findings require further testing in vitro prior to the Supplementary Material 3 | Type I and III reference and JIII386 gyrA protein
development of a lineage-specific diagnostic test. This knowledge alignment schematic.
could reveal insights into the epidemiology and spread of these Supplementary Material 4 | BLASTx results of lineage-specific genes.
lineages without the need for full genome sequencing in future Supplementary Material 5 | Previously identified variable loci from Castellanos
studies. Further in vitro work may assist in identifying the et al. (43) in sheep MAP strains.
Frontiers in Veterinary Science | www.frontiersin.org 11 February 2021 | Volume 8 | Article 637637Mizzi et al. Comparative Genomics of Sheep MAP
REFERENCES North India. Comp Immunol Microbiol Infect Dis. (2007) 31:373–87.
doi: 10.1016/j.cimid.2007.06.007
1. Whittington R, Donat K, Weber M, Kelton D, Nielsen S, Eisenberg S, et al. 19. de Juan L, Mateos A, Domínguez L, Sharp JM, Stevenson K. Genetic diversity
Control of paratuberculosis: who, why and how. A review of 48 countries. of Mycobacterium avium subspecies paratuberculosis isolates from goats
BMC Vet Res. (2019) 15:198. doi: 10.1186/s12917-019-1943-4 detected by pulsed-field gel electrophoresis. Vet Microbiol. (2005) 106:249–57.
2. Waddell LA, Rajić A, Stärk KDC, McEwen SA. The zoonotic potential doi: 10.1016/j.vetmic.2004.12.013
of Mycobacterium avium ssp. paratuberculosis: a systematic review 20. Whittington RJ, Taragel CA, Ottaway S, Marsh I, Seaman J, Fridriksdottir V.
and meta-analyses of the evidence. Epidemiol Infect. (2015) 143:3135. Molecular epidemiological confirmation and circumstances of occurrence of
doi: 10.1017/S095026881500076X sheep (S) strains of Mycobacterium avium subsp. paratuberculosis in cases of
3. Timms VJ, Daskalopoulos G, Mitchell HM, Neilan BA. The association paratuberculosis in cattle in Australia and sheep and cattle in Iceland. Vet
of Mycobacterium avium subsp. paratuberculosis with inflammatory bowel Microbiol. (2001) 79:311–22. doi: 10.1016/S0378-1135(00)00364-3
disease. PLoS ONE. (2016) 11:e0148731. doi: 10.1371/journal.pone.0148731 21. Choy E, Whittington RJ, Marsh I, Marshall J, Campbell MT. A method
4. Britton LE, Cassidy JP, O’Donovan J, Gordon SV, Markey B. Potential for purification and characterisation of Mycobacterium avium subsp.
application of emerging diagnostic techniques to the diagnosis of paratuberculosis from the intestinal mucosa of sheep with Johne’s disease. Vet
bovine Johne’s disease (paratuberculosis). Vet J. (2016) 209:32–9. Microbiol. (1998) 64:51–60. doi: 10.1016/S0378-1135(98)00252-1
doi: 10.1016/j.tvjl.2015.10.033 22. Whittington RJ, Marsh IB, Saunders V, Grant IR, Juste R, Sevilla IA, et al.
5. Shephard RW, Williams SH, Beckett SD. Farm economic impacts of bovine Culture phenotypes of genomically and geographically diverse Mycobacterium
Johne’s disease in endemically infected Australian dairy herds. Aust Vet J. avium subsp. paratuberculosis isolates from different hosts. J Clin Microbiol.
(2016) 94:232–9. doi: 10.1111/avj.12455 (2011) 49:1822. doi: 10.1128/JCM.00210-11
6. Garcia AB, Shalloo L. Invited review: the economic impact and 23. Kabara E, Kloss CC, Wilson M, Tempelman RJ, Sreevatsan S, Janagama H,
control of paratuberculosis in cattle. J Dairy Sci. (2015) 98:5019–39. et al. A large-scale study of differential gene expression in monocyte-
doi: 10.3168/jds.2014-9241 derived macrophages infected with several strains of M. avium
7. Eppleston J, Simpson G, O’Neill S, Thornberry K, Lugton I, Taylor P, et subspecies paratuberculosis. Brief Funct Genomics. (2010) 9:220–37.
al. Reported levels of sheep mortalities in flocks infected with ovine Johne’s doi: 10.1093/bfgp/elq009
disease in New South Wales. Asian-Australas J Anim Sci. (2000) 13:247–247. 24. Abendaño N, Tyukalova L, Barandika J, Balseiro A, Sevilla I, Garrido J,
8. Webb Ware JK, Larsen JWA, Kluver P. Financial effect of bovine Johne’s et al. Mycobacterium avium subsp. paratuberculosis isolates induce in vitro
disease in beef cattle herds in Australia. Aust Vet J. (2012) 90:116–21. granuloma formation and show successful survival phenotype, common
doi: 10.1111/j.1751-0813.2012.00896.x anti-inflammatory and antiapoptotic responses within ovine macrophages
9. Bryant JM, Thibault VC, Smith DGE, McLuckie J, Heron I, Sevilla IA, regardless of genotype or host of origin. PLoS ONE. (2014) 9:e104238.
et al. Phylogenomic exploration of the relationships between strains of doi: 10.1371/journal.pone.0104238
Mycobacterium avium subspecies paratuberculosis. BMC Genomics. (2016) 25. Motiwala AS, Janagama HK, Paustian ML, Zhu X, Bannantine JP, Kapur
17:79. doi: 10.1186/s12864-015-2234-5 V, et al. Comparative transcriptional analysis of human macrophages
10. Stevenson K. Genetic diversity of Mycobacterium avium subspecies exposed to animal and human isolates of Mycobacterium avium subspecies
paratuberculosis and the influence of strain type on infection and paratuberculosis with diverse genotypes. Infect Immun. (2006) 74:6046.
pathogenesis: a review. Vet Res. (2015) 46:64. doi: 10.1186/s13567-015-0203-2 doi: 10.1128/IAI.00326-06
11. Collins DM, Gabric DM, de Lisle GW. Identification of two groups 26. Thibault VC, Grayon M, Boschiroli ML, Hubbans C, Overduin P, Stevenson K,
of Mycobacterium paratuberculosis strains by restriction endonuclease et al. New variable-number tandem-repeat markers for typing Mycobacterium
analysis and DNA hybridization. J Clin Microbiol. (1990) 28:1591. avium subsp. paratuberculosis and M. avium strains: comparison with IS900
doi: 10.1128/JCM.28.7.1591-1596.1990 and IS1245 restriction fragment length polymorphism typing. J Clin Microbiol.
12. Whittington RJ, Hope AF, Marshall DJ, Taragel CA, Marsh I. Molecular (2007) 45:2404. doi: 10.1128/JCM.00476-07
epidemiology of Mycobacterium avium subsp. paratuberculosis: IS900 27. Abendaño N, Sevilla IA, Prieto JM, Garrido JM, Juste RA, Alonso-Hearn M.
restriction fragment length polymorphism and IS1311 polymorphism Mycobacterium avium subspecies paratuberculosis isolates from sheep and
analyses of isolates from animals and a human in Australia. J Clin Microbiol. goats show reduced persistence in bovine macrophages than cattle, bison,
(2000) 38:3240. doi: 10.1128/JCM.38.9.3240-3248.2000 deer and wild boar strains regardless of genotype. Vet Microbiol. (2013)
13. Biet F, Sevilla Iker A, Cochard T, Lefrançois Louise H, Garrido Joseba M, 163:325–34. doi: 10.1016/j.vetmic.2012.12.042
Heron I, et al. Inter- and Intra-subtype genotypic differences that differentiate 28. Sevilla I, Garrido JM, Geijo M, Juste RA. Pulsed-field gel electrophoresis
Mycobacterium avium subspecies paratuberculosis strains. BMC Microbiol. profile homogeneity of Mycobacterium avium subsp. paratuberculosis isolates
(2012) 12:264. doi: 10.1186/1471-2180-12-264 from cattle and heterogeneity of those from sheep and goats. BMC Microbiol.
14. Verdugo C, Pleydell E, Price-Carter M, Prattley D, Collins D, de Lisle G, et (2007) 7:18. doi: 10.1186/1471-2180-7-18
al. Molecular epidemiology of Mycobacterium avium subsp. paratuberculosis 29. Fawzy A, Zschöck M, Ewers C, Eisenberg T. Genotyping methods and
isolated from sheep, cattle and deer on New Zealand pastoral farms. Prev Vet molecular epidemiology of Mycobacterium avium subsp. paratuberculosis. Int
Med. (2014) 117:436–46. doi: 10.1016/j.prevetmed.2014.09.009 J Vet Sci Med. (2018) 6:258–64. doi: 10.1016/j.ijvsm.2018.08.001
15. Moloney B, Whittington R. Cross species transmission of ovine Johne’s disease 30. Whittington R, Marsh I, Choy E, Cousins D. Polymorphisms in IS1311, an
from sheep to cattle: an estimate of prevalence in exposed susceptible cattle. insertion sequence common to Mycobacterium avium and M. avium subsp
Aust Vet J. (2008) 86:117–23. doi: 10.1111/j.1751-0813.2008.00272.x paratuberculosis, can be used to distinguish between and within these species.
16. Stevenson K, Alvarez J, Bakker D, Biet F, de Juan L, Denham S, et Mol Cell Probes. (1998) 12:349–58. doi: 10.1006/mcpr.1998.0194
al. Occurrence of Mycobacterium avium subspecies paratuberculosis across 31. Kasai H, Ezaki T, Harayama S. Differentiation of phylogenetically related
host species and European countries with evidence for transmission slowly growing mycobacteria by their gyrB sequences. J Clin Microbiol. 38:301.
between wildlife and domestic ruminants. BMC Microbiol. (2009) 9:212–212. doi: 10.1128/JCM.38.1.301-308.2000
doi: 10.1186/1471-2180-9-212 32. Collins DM, De Zoete M, Cavaignac SM. Mycobacterium avium subsp.
17. Whittington RJ, Marsh IB, Whitlock RH. Typing of IS 1311 polymorphisms paratuberculosis strains from cattle and sheep can be distinguished by a PCR
confirms that bison (Bison bison) with paratuberculosis in Montana are test based on a novel DNA sequence difference. J Clin Microbiol. (2002)
infected with a strain of Mycobacterium avium subsp. paratuberculosis distinct 40:4760. doi: 10.1128/JCM.40.12.4760-4762.2002
from that occurring in cattle and other domesticated livestock. Mol Cell 33. Ahlstrom C, Barkema HW, Stevenson K, Zadoks RN, Biek R, Kao R,
Probes. (2001) 15:139–45. doi: 10.1006/mcpr.2001.0346 et al. Limitations of variable number of tandem repeat typing identified
18. Yadav D, Singh SV, Singh AV, Sevilla I, Juste RA, Singh PK, et al. through whole genome sequencing of Mycobacterium avium subsp.
Pathogenic “Bison-type” Mycobacterium avium subspecies paratuberculosis paratuberculosis on a national and herd level. BMC Genomics. (2015) 16:161.
genotype characterized from riverine buffalo (Bubalus bubalis) in doi: 10.1186/s12864-015-1387-6
Frontiers in Veterinary Science | www.frontiersin.org 12 February 2021 | Volume 8 | Article 637637You can also read