In vitro characterization of the human segmentation clock - bioRxiv
←
→
Page content transcription
If your browser does not render page correctly, please read the page content below
bioRxiv preprint first posted online Nov. 4, 2018; doi: http://dx.doi.org/10.1101/461822. The copyright holder for this preprint (which
       was not peer-reviewed) is the author/funder, who has granted bioRxiv a license to display the preprint in perpetuity.
                                     It is made available under a CC-BY 4.0 International license.

      In vitro characterization of the human segmentation clock

      Authors: Margarete Diaz-Cuadros1,7, Daniel E Wagner2,7, Christoph Budjan1, Alexis Hubaud1,
      Jonathan Touboul3, Arthur Michaut1, Ziad Al Tanoury1, Kumiko Yoshioka-Kobayashi4, Yusuke
      Niino5, Ryoichiro Kageyama4, Atsushi Miyawaki5 and Olivier Pourquié1,6*

                `
      Affiliations:
      1
        Department of Genetics, Harvard Medical School and Department of Pathology, Brigham and
      Women’s Hospital, Boston, MA, USA
      2
        Department of Systems Biology, Harvard Medical School, Boston, MA, USA
      3
        Department of Mathematics, Brandeis University, MA, USA
      4
        Institute for Frontier Life and Medical Sciences, Kyoto University, Kyoto, Japan
      5
        Laboratory for Cell Function and Dynamics, Brain Science Institute Riken, Saitama, Japan
      6
        Harvard Stem Cell Institute, Harvard University, Cambridge, MA USA
      7
        These authors contributed equally to this work

      *Correspondence to: O.Pourquié (pourquie@genetics.med.harvard.edu)

      The vertebral column is characterized by the periodic arrangement of vertebrae along the
      anterior-posterior (AP) axis. This segmental or metameric organization is established early
      in embryogenesis when pairs of embryonic segments called somites are rhythmically
      produced by the presomitic mesoderm (PSM). The tempo of somite formation is controlled
      by a molecular oscillator known as the segmentation clock 1,2 . While this oscillator has
      been well characterized in model organisms 1,2, whether a similar oscillator exists in
      humans remains unknown. We have previously shown that human embryonic stem (ES)
      cells or induced pluripotent stem (iPS) cells can differentiate in vitro into PSM upon
      activation of the Wnt signaling pathway combined with BMP inhibition3. Here, we show
      that these human PSM cells exhibit Notch and YAP-dependent oscillations4 of the cyclic
      gene HES7 with a 5-hour period. Single cell RNA-sequencing comparison of the
      differentiating iPS cells with mouse PSM reveals that human PSM cells follow a similar
      differentiation path and exhibit a remarkably coordinated differentiation sequence. We
      also demonstrate that FGF signaling controls the phase and period of the oscillator. This
      contrasts with classical segmentation models such as the “Clock and Wavefront” 1,2,5,
      where FGF merely implements a signaling threshold specifying where oscillations stop.
      Overall, our work identifying the human segmentation clock represents an important
      breakthrough for human developmental biology.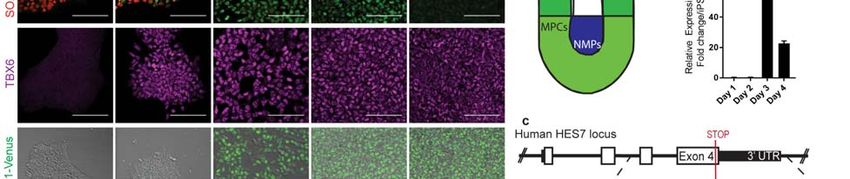
bioRxiv preprint first posted online Nov. 4, 2018; doi: http://dx.doi.org/10.1101/461822. The copyright holder for this preprint (which
       was not peer-reviewed) is the author/funder, who has granted bioRxiv a license to display the preprint in perpetuity.
                                     It is made available under a CC-BY 4.0 International license.

      Twenty years ago, the segmental organization of the vertebral column in the chicken embryo was
      shown to be controlled by a molecular oscillator called “Segmentation clock” 6. This oscillator
      was subsequently identified in mouse, frog and zebrafish suggesting that it represents a
      conserved feature of vertebrate segmentation1,2. The clock controls the periodic activation of the
      Notch, Wnt and FGF signaling pathways which drive the rhythmic production of embryonic
      somites from the PSM1,2. Analyses of consanguineous families with probands exhibiting severe
      spine segmentation defects (congenital scoliosis) have implicated several human orthologs of
      cyclic genes associated with the mouse segmentation clock, such as HES77 or LUNATIC
      FRINGE8, suggesting that this oscillator might be conserved in humans. A total of 38-39 somites
      form between 20 and 30 days post-fertilization in humans9, resulting in the production of the 33
      vertebrae of adults. However, the somitogenesis stages of human embryos are very difficult to
      access and the impossibility to culture post-implantation embryos means that virtually nothing is
      known about human segmentation beyond histological descriptions9.
      We have previously shown that the early stages of human paraxial mesoderm development can
      be recapitulated in vitro by treating iPS cells with Wnt activators such as the GSK3β inhibitor
      CHIRON99021 (Chir) in combination with the BMP inhibitor LDN193189 (LDN) (CL
      medium)3,10 (Fig. 1a). Following one day of CL treatment, iPS cells first transition from
      pluripotency to a state resembling neuro-mesodermal progenitors (NMPs)11,12/anterior primitive
      streak as suggested by the expression of both T/BRACHYURY, SOX2 and POU5F1 (OCT4)(Fig
      1a-b, Extended data Fig. 1a). By day 2 of differentiation, these cells activate the paraxial
      mesoderm markers TBX6 and MSGN1 (Fig. 1a). At the same time, an epithelium-to-mesenchyme
      transition (EMT) marked by a switch from CDH1 to CDH2 takes place and is accompanied by
      active migration of cells away from epithelial colonies as MSGN1 begins to be expressed
      (Extended Data Fig. 1a; Movie S1). This process strikingly parallels cell ingression in the
      primitive streak of amniote embryos. Paraxial mesoderm induction under CL conditions is highly
      efficient, as differentiation of an iPS line harboring a MSGN1-Venus knock-in reporter
      construct13 in CL medium shows that the reporter is activated in more than 95% of the cells from
      day 2 to 4 (Extended Data Fig. 1b).
      Expression of segmentation clock genes such as HES7 and LFNG has been described in
      differentiating human iPS cultures during this time window, but their expression dynamics has
      not been investigated 3,13,14(Extended data Fig. 1c). In mouse, oscillations of a Hes7-Luciferase
      reporter in ES cells differentiated in vitro to a PSM fate have been recently reported 15. To
      visualize oscillations of the human segmentation clock, we used CRISPR-Cas9 technology to
      knock-in a destabilized version of the rapidly folding YFP variant Achilles into the 3’ end of
      HES7 in a human iPSC line 16(Fig. 1c). A 2A peptide linker was used to ensure cleavage of the
      fluorescent protein from the endogenous HES7 protein during translation. When the HES7-
      Achilles iPS line was differentiated in CL medium and imaged using time-lapse confocal
      microscopy, the majority of cells underwent a series of up to five oscillations between day 2 and
      day 3 (Fig. 1d-e, Movie S2). In these conditions, we did not observe traveling waves as described
      in mouse explants or in differentiated ES cells4,15,17,20. The period of oscillations was close to 5
      hours and their frequency was constant over time (Fig. 1f-g). Interestingly, this period is similar
      to that reported for HES1 oscillations in human cells derived from umbilical cord blood exposed
      to a serum shock18. No oscillations could be observed when LDN was omitted from the culture
      medium (Fig. 1h), supporting the notion that BMP inhibition is required to maintain PSM
      identity 13. In vivo, PSM cells stop oscillating and respond to the clock signal when they reach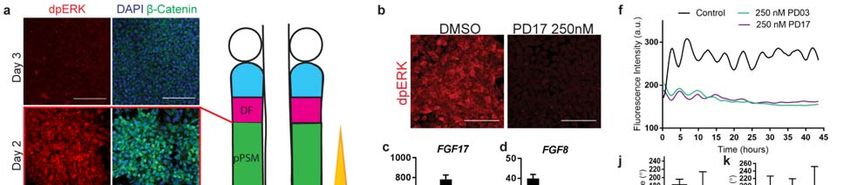
bioRxiv preprint first posted online Nov. 4, 2018; doi: http://dx.doi.org/10.1101/461822. The copyright holder for this preprint (which
       was not peer-reviewed) is the author/funder, who has granted bioRxiv a license to display the preprint in perpetuity.
                                     It is made available under a CC-BY 4.0 International license.

      the determination front, a level defined by thresholds of FGF and Wnt signaling that form
      posterior to anterior gradients along the PSM1. In response to the clock signal, competent cells
      activate the expression of genes such as Mesp2, which defines the anterior and posterior
      boundaries of the future segment19. We observed that the arrest of HES7-Achilles oscillations
      coincided with the onset of expression of MESP2 and RIPPLY2 at day 3 as observed in mouse in
      vivo (Fig. 1i-j). Together, these data demonstrate that human iPS cells differentiated to a
      posterior PSM fate recapitulate oscillations of the segmentation clock followed by segmental
      patterning.
      To further characterize the identity of the human PSM cells generated in vitro, we compared
      their transcriptomes to those of the in vivo mouse PSM cells. Using the inDrops single cell RNA-
      sequencing (scRNA-seq) platform20, we analyzed 5,646 cells dissociated from the entire
      posterior region including the two PSMs and the last three somites, the tail bud and the neural
      tube of two E9.5 mouse embryos. Clustering analysis revealed 19 distinct cell states
      corresponding to expected derivatives of posterior mesoderm including the PSM, and the
      endoderm and ectoderm-derived tissues (Fig. 2a, Extended Data Fig. 2a-d and Table S1). We
      next performed a detailed analysis of cells from the PSM and the neural tube clusters (Fig. 2b),
      which share a common developmental origin 11,21. When isolated and represented as a k-nearest
      neighbor (kNN) graph, these cells organized into a continuum of states recapitulating spatio-
      temporal features of the developing vertebrate tailbud. Identification of differentially expressed
      genes along a pseudo-temporal trajectory (Fig. 2c and Table S2) and between subclusters of cells
      (Fig 2d, f) revealed distinct phases of paraxial mesoderm differentiation, arranged sequentially
      on the knn graph. One cluster, characterized by expression of Sox2 and T/Brachyury (the NMP
      expression signature) was positioned at an intermediate location in the overall continuum and
      was flanked by clusters for posterior neural tube and paraxial mesoderm, respectively. This
      ordering of states is consistent with the known bipotentiality of NMPs for these lineages 11.
      Several additional clusters describe successive stages of PM differentiation from NMPs
      (Extended Data Fig. 3a-c and Table S3). Two clusters define progressively the most immature
      PSM cells, which retain T expression and are called mesodermal precursor cells (MPCs)22, and
      more mature posterior PSM (pPSM) (Fig. 1b). These two clusters define the oscillatory domain
      in vivo. The determination front, highlighted by Mesp2 expression, marks the boundary of the
      next cluster, the anterior PSM (aPSM), which is characterized by the onset of Pax3 expression.
      Two additional clusters correspond to the ventral (sclerotome) and dorsal (dermomyotome)
      regions of the newly formed somites. This inferred organization of cell states was reproducible
      by an independent clustering approach (Extended Data Fig. 3a-b).
      We next compared the progression of these in vivo mouse cell states to those of 14,750 human
      iPS-derived cells analyzed by scRNA-seq over the first 4 days of in vitro PSM differentiation.
      Similar to above, a knn-graph-based clustering analysis revealed an ordered progression of cell
      states (Fig. 2e). The vast majority of single-cell transcriptomes from these iPS-derived cultures
      (>93%) comprised 5 major clusters expressing markers of increasingly differentiated cells (Fig.
      2g, Extended Data Fig. 3d-f and 4, Table S4). Strikingly, this unsupervised analysis organized
      collection timepoints sequentially along the knn graph, each of which was dominated by a single
      cluster (Fig. 2e, Extended Data Fig. 3d-f). Differential gene expression analysis revealed shared
      molecular characteristics between the human clusters and the in vivo mouse paraxial mesoderm
      lineage (Fig. 2h-i, Extended Data Fig. 3c, f). For example, cells collected after day 1 of
      differentiation exhibited characteristics of NMPs/anterior primitive streak with expression of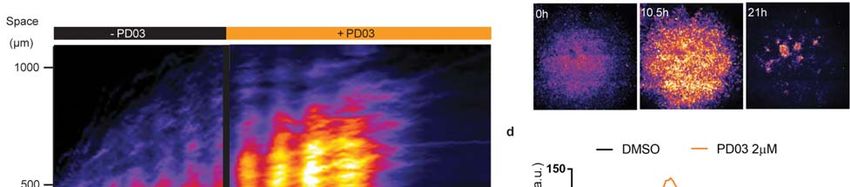
bioRxiv preprint first posted online Nov. 4, 2018; doi: http://dx.doi.org/10.1101/461822. The copyright holder for this preprint (which
       was not peer-reviewed) is the author/funder, who has granted bioRxiv a license to display the preprint in perpetuity.
                                     It is made available under a CC-BY 4.0 International license.

      genes such as NODAL, T, MIXL1 and SOX2 (Fig. 2h-i, Extended data Fig 4a). Day 2 human
      cells resembled the mouse MPC and posterior PSM clusters with expression of genes such as T,
      MSGN1, TBX6, DLL3, WNT3A and FGF17, as well as the Notch-associated cyclic genes LFNG
      and HES7 (Fig. 2h-i, Extended data Fig 4a). Day 3 and Day 4 cells show expression of markers
      of more anterior PSM such as RSPO3, MEST and FOXC1 (Fig. 2h-I, Extended data Fig 4a).
      Remarkably, we could also detect the collinear activation of HOX genes (Fig. 2j). Paralogs from
      all four HOX clusters were progressively expressed in a 3’ to 5’ order starting with HOXA1 and
      HOXA3 as early as day 1 while expression of HOXB9 and C8 peaked at day 4 (Extended data Fig
      4b). Genes of the paralog groups 10 to 13 were not detected arguing that the paraxial mesoderm
      cells produced exhibit a thoracic identity. Together, these analyses demonstrate that
      differentiating human iPS cells to a PSM fate in vitro in CL medium recapitulates a
      developmental sequence similar to that of the mouse embryo leading to the production of trunk
      paraxial mesoderm cells. Moreover, these data show that differentiation proceeds in a
      remarkably synchronized fashion resulting in strikingly homogenous populations in these
      cultures.
      We recently demonstrated that the total number of oscillations can be increased in mouse tailbud
      explants by culturing in CL medium supplemented with Fgf4, the RA inhibitor BMS493 and the
      Rho kinase inhibitor (ROCKi) Y-27362 (CLFBR medium) 4 (Fig. 3a). When human HES7-
      Achilles reporter cells were cultured in such conditions from day 2 onwards, no dampening of the
      oscillations was observed and up to ten oscillations of the reporter were detected during day 2
      and 3 (Fig. 3b, Movie S3). These oscillations retained the same 5 hour-period and their
      frequency was stable (Extended Data Fig. 5a-c). The treatment did not affect the percentage of
      MSGN1-Venus positive cells between day 2 and 4 (Extended Fig. 5d). Extension of the
      oscillatory window was accompanied by a delay in the onset of expression of determination front
      genes (MESP2 and RIPPLY2) as well as anterior PSM markers (FOXC2) from day 3 to day 4
      (Extended Data Fig. 5e). These new conditions provided us with an optimal system to investigate
      the regulation and the dynamical properties of the human segmentation clock oscillator.
      We first set out to characterize the role of Notch signaling in the regulation of HES7-Achilles
      oscillations. In mouse and zebrafish, Notch has been implicated in both the onset of oscillations
      and their local synchronization 4,23-25. Treatment of HES7-Achilles cells with the Notch inhibitor
      DAPT in CLFBR medium on day 2 led to a rapid dampening of oscillations resulting in a
      decrease of target genes and reporter expression (Fig. 3c-d; Extended data Fig. 6a, Movie S4).
      This indicates that HES7 oscillations require active Notch signaling as recently reported for both
      Lfng and Hes7 oscillations in mouse tailbud explants and mESC-derived PSM cells7,12. To test
      whether Notch also mediates the synchronization of individual oscillators, we attempted to track
      oscillations in single cells. Oscillating cells are however extremely motile as expected for
      posterior PSM cells 26, making the tracking of single cells difficult in these cultures. In fact, the
      average diffusivity of individual cells tracked in vitro (1.6±0.7 µm2/min; Fig. Extended Data Fig.
      6b) is comparable to the diffusivity of PSM cells in the chicken embryo, which ranges from 0.5-8
      µm2/min in vivo 19. To quantitatively analyze the synchronization between individual cells in
      oscillating cultures, we diluted the cells carrying the HES7-Achilles reporter with their parental
      line (no reporter) in a ratio of 1:100 (Fig. 3e). As a result, Achilles-positive cells were sparse
      within the culture allowing individual cells to be tracked (Movie S5). DAPT-treated cells could
      not be tracked for longer than 10 hours on account of severe dampening. At the population level,
      cells are generally well synchronized in the control condition (Fig. 3f; Extended Data Fig. 6c),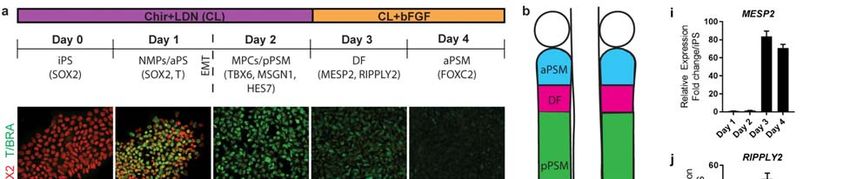
bioRxiv preprint first posted online Nov. 4, 2018; doi: http://dx.doi.org/10.1101/461822. The copyright holder for this preprint (which
       was not peer-reviewed) is the author/funder, who has granted bioRxiv a license to display the preprint in perpetuity.
                                     It is made available under a CC-BY 4.0 International license.

      with an average phase shift of 36º (sem± 5.63º; n=29). We estimated an instantaneous phase shift
      through local cross-correlation, and compared the phase distribution with the classical Kuramoto
      model 27. The data was found consistent with the synchronized regime (coupling 13% larger than
      critical threshold, see Fig. 3g) in control conditions, but consistent with a Kuramoto model
      within the disordered region (with coupling parameter 20% smaller than critical coupling, see
      Fig. 3h) in the case of DAPT treatment. Furthermore, synchronization between control cells was
      stronger locally, and progressively became looser (typical distance of 200µm, see Extended Data
      Fig. 6e and Fig. 3i-j, linear fit R2=0.21, F-statistics vs constant model p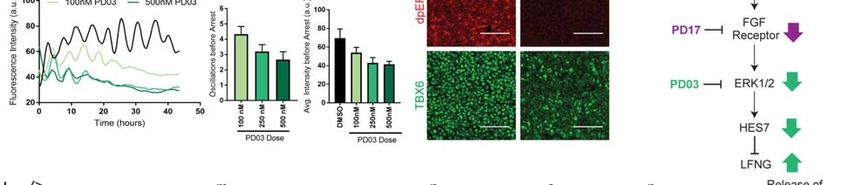
bioRxiv preprint first posted online Nov. 4, 2018; doi: http://dx.doi.org/10.1101/461822. The copyright holder for this preprint (which
       was not peer-reviewed) is the author/funder, who has granted bioRxiv a license to display the preprint in perpetuity.
                                     It is made available under a CC-BY 4.0 International license.

      as observed in vivo1. Indeed, treatment with the MEK1/2 inhibitor PD0325901 (PD03) for 24
      hours caused most cells to decrease TBX6 expression and prematurely express MESP2 (Fig. 4e
      and Extended Data Fig. 7a), indicating that FGF controls PSM maturation.
      In classical segmentation models such as the Clock-and-Wavefront, a maturation wave
      implemented by the FGF signaling gradient acts independently of the Clock to establish a
      specific threshold called Wavefront or determination front 1,5. At this level, FGF concentration
      becomes too low to sustain oscillations leading to their arrest thus defining the future segment
      1,2,5
            . To directly test this hypothesis, we analyzed the effect of inhibiting FGF signaling on
      oscillations by treating HES7-Achilles reporter cells on day 2 with PD03 or PD17 in CLFBR
      medium. Unexpectedly, this did not result in an immediate arrest of oscillations but in their
      strong dampening followed by delayed arrest (Fig. 4f, Movie S7). This effect was dose-
      dependent with higher doses resulting in faster dampening and fewer oscillations before arrest
      (Fig. 4g-i). In addition, oscillations in treated cells exhibited a 180⁰ phase-shift relative to control
      cells resulting in treated cells and control cells to oscillate in antiphase, an effect which was not
      dose-dependent (Fig. 4j-k). To test whether this role of FGF is conserved in mouse, we used an
      ex-vivo system of PSM explants of the mouse reporter line LuVeLu that comprises a fluorescent
      construct reporting the oscillations of the cyclic gene Lunatic fringe4. Treating explants with 2
      μM PD03 led to a transient increase in reporter intensity and delayed arrest of oscillations
      leading to the complete loss of LuVeLu signal (~ 4 oscillations were still observed after
      treatment; Extended Data Fig. 7b-d). To bypass the spatial effects inherent to this explant
      system, we used micropatterned cultures, where explant cells are dissociated and seeded on
      fibronectin disks (Fig. 4l). As with the human reporter cells, treating mouse cultures with FGF
      inhibitors led to a dose dependent effect on the number and intensity of oscillations (Fig. 4m-p).
      The period and average intensity of reporter oscillations progressively increased with inhibitor
      dose, a behavior reminiscent of Lfng oscillations during PSM maturation in vivo 29(Fig. 4m-p). In
      mouse, Hes7 has been shown to repress Lfng27, thus providing a plausible explanation for the
      opposite response to FGF inhibition in terms of reporter intensity for the HES7 and Lfng
      reporters (Fig. 4q). Thus, FGF signaling does not simply control the arrest of clock oscillations at
      the wavefront level as proposed in classical clock and wavefront models1,5. Overall, our data
      support the idea that FGF activity regulates the dynamics (period, phase and amplitude) of cyclic
      genes oscillations and the establishment of phase-gradients responsible for the traveling waves of
      the PSM in mammalian embryos.
      Thus our work provides evidence for the existence of a human segmentation clock demonstrating
      the conservation of this oscillator from fish to human. We identify the human clock period as 5
      hours indicating that the human segmentation clock operates roughly 2.5 times slower than its
      mouse counterpart29. This is consistent with the known difference in developmental timing
      between mouse and human embryos 30. Our culture conditions allow the production of an
      unlimited supply of cells displaying synchronized oscillations of the human segmentation clock
      and recapitulation of all major paraxial mesoderm stages. This therefore represents an ideal
      system to dissect the dynamical properties of the oscillator and its dysregulation in pathological
      segmentation defects such as congenital scoliosis.

      REFERENCES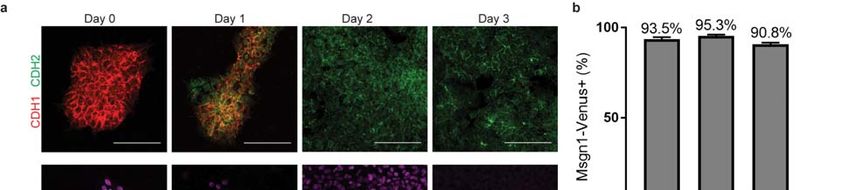
bioRxiv preprint first posted online Nov. 4, 2018; doi: http://dx.doi.org/10.1101/461822. The copyright holder for this preprint (which
       was not peer-reviewed) is the author/funder, who has granted bioRxiv a license to display the preprint in perpetuity.
                                     It is made available under a CC-BY 4.0 International license.

      1         Hubaud, A. & Pourquie, O. Signalling dynamics in vertebrate segmentation. Nat Rev Mol
                Cell Biol 15, 709-721, doi:10.1038/nrm3891 (2014).
      2         Oates, A. C., Morelli, L. G. & Ares, S. Patterning embryos with oscillations: structure,
                function and dynamics of the vertebrate segmentation clock. Development 139, 625-639,
                doi:10.1242/dev.063735 (2012).
      3         Chal, J. et al. Differentiation of pluripotent stem cells to muscle fiber to model Duchenne
                muscular dystrophy. Nat Biotechnol 33, 962-969, doi:10.1038/nbt.3297 (2015).
      4         Hubaud, A., Regev, I., Mahadevan, L. & Pourquie, O. Excitable Dynamics and Yap-
                Dependent Mechanical Cues Drive the Segmentation Clock. Cell 171, 668-682 e611,
                doi:10.1016/j.cell.2017.08.043 (2017).
      5         Cooke, J. & Zeeman, E. C. A clock and wavefront model for control of the number of
                repeated structures during animal morphogenesis. J Theor Biol 58, 455-476 (1976).
      6         Palmeirim, I., Henrique, D., Ish-Horowicz, D. & Pourquié, O. Avian hairy gene
                expression identifies a molecular clock linked to vertebrate segmentation and
                somitogenesis. Cell 91, 639-648 (1997).
      7         Sparrow, D. B., Guillen-Navarro, E., Fatkin, D. & Dunwoodie, S. L. Mutation of
                HAIRY-AND-ENHANCER-OF-SPLIT-7 in Humans Causes Spondylocostal Dysostosis.
                Hum Mol Genet (2008).
      8         Sparrow, D. B. et al. Mutation of the LUNATIC FRINGE gene in humans causes
                spondylocostal dysostosis with a severe vertebral phenotype. Am J Hum Genet 78, 28-37
                (2006).
      9         O'Rahilly, R. & Muller, F. Somites, spinal Ganglia, and centra. Enumeration and
                interrelationships in staged human embryos, and implications for neural tube defects.
                Cells Tissues Organs 173, 75-92 (2003).
      10        Chal, J. et al. Generation of human muscle fibers and satellite-like cells from human
                pluripotent stem cells in vitro. Nature protocols 11, 1833-1850,
                doi:10.1038/nprot.2016.110 (2016).
      11        Henrique, D., Abranches, E., Verrier, L. & Storey, K. G. Neuromesodermal progenitors
                and the making of the spinal cord. Development 142, 2864-2875,
                doi:10.1242/dev.119768 (2015).
      12        Gouti, M. et al. A Gene Regulatory Network Balances Neural and Mesoderm
                Specification during Vertebrate Trunk Development. Dev Cell 41, 243-261 e247,
                doi:10.1016/j.devcel.2017.04.002 (2017).
      13        Chal, J. et al. Recapitulating early development of mouse musculoskeletal precursors of
                the paraxial mesoderm in vitro. Development 145, doi:10.1242/dev.157339 (2018).
      14        Loh, K. M. et al. Mapping the Pairwise Choices Leading from Pluripotency to Human
                Bone, Heart, and Other Mesoderm Cell Types. Cell 166, 451-467,
                doi:10.1016/j.cell.2016.06.011 (2016).
      15        Matsumiya, M., Tomita, T., Yoshioka-Kobayashi, K., Isomura, A. & Kageyama, R. ES
                cell-derived presomitic mesoderm-like tissues for analysis of synchronized oscillations in
                the segmentation clock. Development 145, doi:10.1242/dev.156836 (2018).
      16        Yoshioka-Kobayashi, K. et al. Dynamic coupling-delay control for synchronized
                oscillations in the segmentation clock. submitted (2018).
      17        Lauschke, V. M., Tsiairis, C. D., Francois, P. & Aulehla, A. Scaling of embryonic
                patterning based on phase-gradient encoding. Nature 493, 101-105,
                doi:10.1038/nature11804 (2013).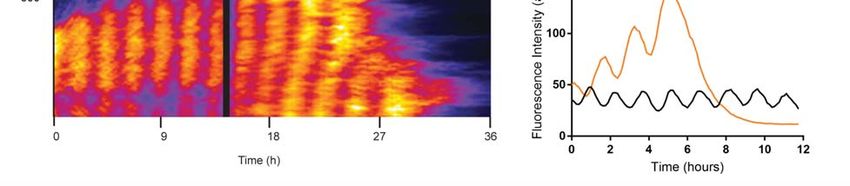
bioRxiv preprint first posted online Nov. 4, 2018; doi: http://dx.doi.org/10.1101/461822. The copyright holder for this preprint (which
       was not peer-reviewed) is the author/funder, who has granted bioRxiv a license to display the preprint in perpetuity.
                                     It is made available under a CC-BY 4.0 International license.

      18        William, D. A. et al. Identification of oscillatory genes in somitogenesis from functional
                genomic analysis of a human mesenchymal stem cell model. Dev Biol 305, 172-186
                (2007).
      19        Morimoto, M., Takahashi, Y., Endo, M. & Saga, Y. The Mesp2 transcription factor
                establishes segmental borders by suppressing Notch activity. Nature 435, 354-359
                (2005).
      20        Klein, A. M. et al. Droplet barcoding for single-cell transcriptomics applied to embryonic
                stem cells. Cell 161, 1187-1201, doi:10.1016/j.cell.2015.04.044 (2015).
      21        Tzouanacou, E., Wegener, A., Wymeersch, F. J., Wilson, V. & Nicolas, J. F. Redefining
                the progression of lineage segregations during mammalian embryogenesis by clonal
                analysis. Dev Cell 17, 365-376, doi:10.1016/j.devcel.2009.08.002 (2009).
      22        Chalamalasetty, R. B. et al. Mesogenin 1 is a master regulator of paraxial presomitic
                mesoderm differentiation. Development 141, 4285-4297, doi:10.1242/dev.110908 (2014).
      23        Tsiairis, C. D. & Aulehla, A. Self-Organization of Embryonic Genetic Oscillators into
                Spatiotemporal Wave Patterns. Cell 164, 656-667, doi:10.1016/j.cell.2016.01.028 (2016).
      24        Jiang, Y. J. et al. Notch signalling and the synchronization of the somite segmentation
                clock. Nature 408, 475-479 (2000).
      25        Riedel-Kruse, I. H., Muller, C. & Oates, A. C. Synchrony dynamics during initiation,
                failure, and rescue of the segmentation clock. Science 317, 1911-1915 (2007).
      26        Benazeraf, B. et al. A random cell motility gradient downstream of FGF controls
                elongation of an amniote embryo. Nature 466, 248-252, doi:10.1038/nature09151 (2010).
      27        Acebron, J. A., Bonilla, L. L., Perez Vicente, C. J., Ritort, F. & Spigler, R. The Kuramoto
                model: A simple paradigme for synchronization phenomena. Reviews of modern physics
                77, 137-185 (2005).
      28        Zhao, B. et al. Cell detachment activates the Hippo pathway via cytoskeleton
                reorganization to induce anoikis. Genes Dev 26, 54-68, doi:10.1101/gad.173435.111
                (2012).
      29        Aulehla, A. et al. A beta-catenin gradient links the clock and wavefront systems in mouse
                embryo segmentation. Nat Cell Biol 10, 186-193 (2008).
      30        Hauschka, S. D. Clonal analysis of vertebrate myogenesis. II. Environmental influences
                upon human muscle differentiation. Dev Biol 37, 329-344 (1974).

      SUPPLEMENTARY INFORMATION is available in the online version of the paper.
      ACKNOWLEDGMENTS We thank members of the Pourquié lab, D. Ish-Horowicz, A. Klein
      and M. Heiman for critical reading of the manuscript and discussions. We thank Y. Saga for
      sharing reagents. Research in the Pourquié lab was funded by a grant from the National Institute
      of Health (5R01HD085121). D.E.W. is supported by 1K99GM121852.
      AUTHOR CONTRIBUTIONS M.D.C. designed, performed and analyzed the biological
      experiments with O.P.; D.E.W. analyzed the single cell RNAseq data. C.B. optimized the
      dissociation protocol for single RNAseq and contributed to experiments with M.D.C. A.H.
      performed the mouse experiments. J. T. performed the mathematical analysis of synchronization.
      A.M. helped with quantifications. Z.A.T. generated the MSGN1-YFP line and helped M.D.C.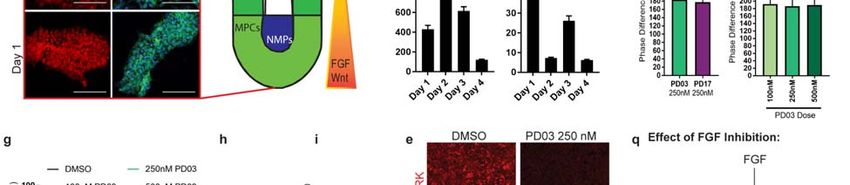
bioRxiv preprint first posted online Nov. 4, 2018; doi: http://dx.doi.org/10.1101/461822. The copyright holder for this preprint (which
       was not peer-reviewed) is the author/funder, who has granted bioRxiv a license to display the preprint in perpetuity.
                                     It is made available under a CC-BY 4.0 International license.

      with generation of the HES7-Achilles line. K.Y.K. and R.K. generated the destabilized Achilles
      construct. Y.N. and A.M. generated the Achilles fluorescent protein. M.D.C., D.E.W., A.H., C.B.
      and O.P. wrote the manuscript; O.P. supervised the project. All authors discussed and agreed on
      the results and commented on the manuscript.
      AUTHOR INFORMATION Correspondence and requests for materials should be addressed to
      O.P. (pourquie@genetics.med.harvard.edu).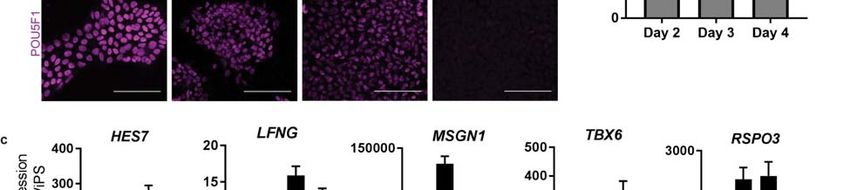
bioRxiv preprint first posted online Nov. 4, 2018; doi: http://dx.doi.org/10.1101/461822. The copyright holder for this preprint (which
was not peer-reviewed) is the author/funder, who has granted bioRxiv a license to display the preprint in perpetuity.
It is made available under a CC-BY 4.0 International license.
FIGURES AND FIGURE LEGENDS
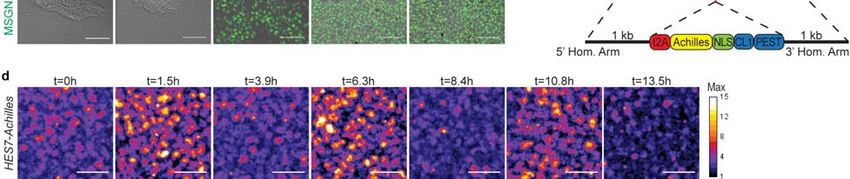
Figure 1. A HES7-Achilles fluorescent reporter oscillates with a 5-hour period in human
PSM-like cells differentiated in vitro. a, Differentiation timeline outlining major changes in cell
fate and medium conditions. iPS, induced pluripotent stem cells; aPS, anterior primitive streak;
NMPs, neuromesodermal progenitors; MPCs, mesodermal precursor cells; pPSM, posterior
presomitic mesoderm; aPSM, anterior presomitic mesoderm; DF, determination front. Top:
Immunofluorescence staining for T/BRACHYURY and SOX2 on days 0-4 of differentiation.
Middle: Immunofluorescence staining for TBX6 on days 0-4 of differentiation. Bottom:
Brightfield and fluorescence merged images of the MSGN1-Venus reporter line on days 0-4 of
differentiation. Scale bar = 100µm b, Scheme illustrating the maturation stages of paraxial
mesoderm. aPSM, anterior PSM; DF, determination front; MPCs, mesodermal precursor cells;
pPSM, posterior PSM; NMPs, neuromesodermal progenitors. c, Diagram outlining the targeting
strategy used to generate a HES7-Achilles knock-in reporter line in human iPS cells. d,
Snapshots of HES7-Achilles fluorescence showing peaks and troughs over the course of 13.5bioRxiv preprint first posted online Nov. 4, 2018; doi: http://dx.doi.org/10.1101/461822. The copyright holder for this preprint (which
was not peer-reviewed) is the author/funder, who has granted bioRxiv a license to display the preprint in perpetuity.
It is made available under a CC-BY 4.0 International license.
hours. Scale bar = 100µm e, Quantification of HES7-Achilles fluorescence intensity from day 2
to day 3 of differentiation. f, Fourier transform of HES7-Achilles oscillations indicating the
predominant period. g, Instantaneous frequency in Hertz (calculated by Hilbert transformation)
of HES7-Achilles oscillations over time h, Quantification of HES7-Achilles fluorescence over the
course of 20 hours in cells differentiated without the BMP inhibitor LDN93189 (CHIR99021
only medium). i, qRT-PCR for the determination front marker MESP2 on days 1-4 of
differentiation. Relative expression expressed as fold change relative to iPS (day 0). Mean ±SD
j, qRT-PCR for the determination front marker RIPPLY2 on days 1-4 of differentiation. Relative
expression expressed as fold change relative to iPS (day 0). Mean ±SDbioRxiv preprint first posted online Nov. 4, 2018; doi: http://dx.doi.org/10.1101/461822. The copyright holder for this preprint (which
was not peer-reviewed) is the author/funder, who has granted bioRxiv a license to display the preprint in perpetuity.
It is made available under a CC-BY 4.0 International license.
Figure 2. Single cell RNA-sequencing analysis of differentiating mouse and human PSM. a,
tSNE embedding of E9.5 cells, colored by density cluster ID (see also Extended data Fig.2c-d
and Table S1). b, Clusters corresponding to neural tube, presomitic, and somites were isolated
(left, red dots), and used to construct a k-nearest-neighbor (kNN) graph (right, 2,202 cells, k =
20, 12 PC dimensions). c, Pseudotemporal ordering of non-neural cells and identification of
dynamically expressed genes. Heatmap illustrates genes with significant dynamic expression,
ordered by peak expression. Select genes marking progressive stages of paraxial mesoderm
differentiation are labeled. d, E9.5 kNN graph with cell nodes colored by Louvain cluster ID (see
Fig S2a-c and Table S3). e, kNN graph of human iPS cultured cells (14,750 cells, k = 30, 17 PC
dimensions), colored by Louvain cluster ID (see also extended data Figure 3d-f and Table S4). f-
g, Mouse E9.5 and human iPS kNN graph nodes colored by expression levels of orthologous
genes. h-i, Dot plots illustrating single-cell expression characteristics for select genes for each
human iPS collection timepoint (h) or mouse E9.5 cluster (i). Colors indicate expression level,
dot sizes indicate fraction of positive cells in each human timepoint or E9.5 cluster, respectively.
j, Heatmap of expression levels for human HOX genes (>5 transcripts per million, TPM). Rows
(individual cells) are ordered by timepoint, columns (HOX genes) are ordered by position.bioRxiv preprint first posted online Nov. 4, 2018; doi: http://dx.doi.org/10.1101/461822. The copyright holder for this preprint (which
was not peer-reviewed) is the author/funder, who has granted bioRxiv a license to display the preprint in perpetuity.
It is made available under a CC-BY 4.0 International license.
Figure 3. Notch and YAP signaling control oscillations of the HES7-Achilles reporter. a,
Timeline outlining modified differentiation protocol for extension of the posterior PSM fate and
increase in the HES7-Achilles oscillatory window. Major changes in cell fate and medium
conditions used are indicated. iPS, induced pluripotent stem cells; aPS, anterior primitive streak;
NMPs, neuromesodermal progenitors; MPCs, mesodermal precursor cells; pPSM, posterior
presomitic mesoderm; DF, determination front. b, HES7-Achilles fluorescence intensity
(regularized to oscillate about the origin by removing the moving average over 10 timepoints)
over the course of 48 hours (Days 2-4 of differentiation) in CLFBR conditions. c, HES7-Achilles
fluorescence intensity over a period of 45 hours in cells treated with DMSO (vehicle control) or
the γ-secretase inhibitor DAPT (25µM) in CLFBR medium. d, Images of HES7-Achilles
fluorescence following treatment with DMSO or DAPT (25µM). Scale bar = 100µme, Outline of
the experimental strategy for the tracking of HES7-Achilles oscillations in individual cells. ScalebioRxiv preprint first posted online Nov. 4, 2018; doi: http://dx.doi.org/10.1101/461822. The copyright holder for this preprint (which
was not peer-reviewed) is the author/funder, who has granted bioRxiv a license to display the preprint in perpetuity.
It is made available under a CC-BY 4.0 International license.
bar = 100µm f, HES7-Achilles fluorescence intensity in individual cells tracked over a period of
24 hours. Each line represents a different cell. All cells shown were initially locatedbioRxiv preprint first posted online Nov. 4, 2018; doi: http://dx.doi.org/10.1101/461822. The copyright holder for this preprint (which
was not peer-reviewed) is the author/funder, who has granted bioRxiv a license to display the preprint in perpetuity.
It is made available under a CC-BY 4.0 International license.
Figure 4. FGF signaling regulates the period and the phase of the segmentation clock. a,
Left: Immunofluorescence staining for doubly phosphorylated ERK on days 1-3 of
differentiation. Right: Immunofluorescence staining for β-catenin and nuclear staining on days 1-
3 of differentiation. Nuclear localization of β-catenin is suggestive of active Wnt signaling. b,
Immunofluorescence staining for doubly phosphorylated ERK on Day 2 of differentiation
following 3 hours of treatment with either DMSO (vehicle control) or the FGFR inhibitor
PD173074 (250 nM). c, qRT-PCR for the FGF ligand (FGF17) on days 1-4 of differentiation.
Relative expression expressed as fold change relative to iPS (day 0). d, qRT-PCR for the FGF
ligand (FGF8) on days 1-4 of differentiation. Relative expression expressed as fold change
relative to iPS (day 0). e, Top: Immunofluorescence staining for doubly phosphorylated ERK on
day 3 of differentiation (CLFBR medium) in cells treated with either DMSO or PD03 (250 nM).
Bottom: Immunofluorescence staining for TBX6 on day 3 of differentiation (CLFBR medium) in
cells treated with either DMSO or PD03 (250 nM). f, HES7-Achilles fluorescence intensity over
the course of 45 hours in cells treated with DMSO (vehicle control), the MAPK inhibitorbioRxiv preprint first posted online Nov. 4, 2018; doi: http://dx.doi.org/10.1101/461822. The copyright holder for this preprint (which
was not peer-reviewed) is the author/funder, who has granted bioRxiv a license to display the preprint in perpetuity.
It is made available under a CC-BY 4.0 International license.
PD0325901 (250nM), or the FGFR inhibitor PD173074 (250nM) in CLFBR medium. g, HES7-
Achilles fluorescence intensity profiles in cells treated with increasing doses of PD03 (100nM,
250 nM, 500nM) or vehicle control (DMSO). h, Average number of HES7-Achilles oscillations
before arrest in cells treated with increasing doses of PD03 (100nM, 250 nM, 500nM). i,
Average HES7-Achilles fluorescence intensity over the course of the oscillatory regime (i.e. prior
to the arrest of oscillations) in cells treated with either vehicle control (DMSO) or increasing
doses of PD03 (100nM, 250 nM, 500nM). j, Quantification of the average phase difference
(degrees) for HES7-Achilles oscillations in PD03- or PD17-treated cells relative to control
(DMSO) cells. k, Average phase difference (degrees) for HES7-Achilles oscillations in cells
treated with increasing doses of PD03 (100nM, 250 nM, 500nM) relative to control (DMSO-
treated) cells. l, Outline of the experimental strategy used to assess the effect of FGF inhibition in
primary mouse PSM cells carrying the LuVeLu reporter. The tailbud is dissected from E9.5
transgenic embryos and cells are dissociated for seeding on fibronectin micropatterns.
Oscillations of the LuVeLu reporter are examined in each micropattern. m, LuVeLu fluorescence
intensity profiles in mouse tailbud explant cells cultured on CYTOO micropatterns in CLFBR
medium containing DMSO (vehicle control) or increasing doses of PD03 (0.4µM, 0.65µM,
10µM). n, Average period of LuVeLu oscillations in mouse tailbud explant cells cultured on
CYTOO micropatterns treated with DMSO (vehicle control) or increasing doses of PD03
(0.4µM, 0.65µM, 10µM).o, Average number of LuveLu oscillations before arrest in mouse
tailbud explant cells cultured on CYTOO micropatterns treated with DMSO (vehicle control) or
increasing doses of PD03 (0.4µM, 0.65µM, 10µM). p, Average LuVeLu fluorescence intensity
over the course of the oscillatory regime (i.e. prior to the arrest of oscillations) in mouse tailbud
explant cells cultured on CYTOO micropatterns treated with DMSO (vehicle control) or
increasing doses of PD03 (0.4µM, 0.65µM, 10µM). q, Pathway illustrating the effect of FGF
inhibition on the levels of FGFR and ERK activity, as well as overall levels of HES7 and LFNG.
Note that FGF inhibition by PD17 or PD03 leads to a decrease in HES7 levels but an increase in
LFNG levels due to release of inhibition.
Mean ±SD; Scale bar = 100µmbioRxiv preprint first posted online Nov. 4, 2018; doi: http://dx.doi.org/10.1101/461822. The copyright holder for this preprint (which
was not peer-reviewed) is the author/funder, who has granted bioRxiv a license to display the preprint in perpetuity.
It is made available under a CC-BY 4.0 International license.
METHODS
Generation of HES7-Achilles iPS reporter lines The CRISPR/Cas9 system for genome editing
was used to target the HES7 locus in NCRM1 iPS cells31 . A single guide RNA (Sense: 5’
ACCTGCTCGCCCGGACGCCCGGG 3’; protospacer adjacent motif (PAM) site highlighted in
bold) targeting the 3’ end of HES7 was designed using the MIT Crispr Design Tool
(www.crispr.mit.edu) and cloned into the pSpCas9(BB)GFP vector (Addgene)31. This guide
RNA was validated to efficiently cleave the target site with the T7 endonuclease 1 assay (T7E1;
NEB cat. no. M0302S). T7E1 digestion of an 871 bp amplicon surrounding the target site (Fwd
Primer 5’ GCTGCTACTTGTCCGGTTTCC 3’; Rev Primer 5’
TCGATCTCAGTTCCCGCTCTG 3’) revealed cleaved products roughly half the size of the
intact fragment when genomic DNA was taken from NCRM1 iPS cells transiently expressing the
pSpCas9(BB)GFP vector carrying the sgRNA. We also generated a repair vector consisting of
1kb 3’ and 5’ homology arms flanking a self-cleaving T2A peptide sequence, followed by the
fast-folding YFP variant Achilles16, two destabilization domains (CL1 and PEST), and a nuclear
localization signal (T2A-Achilles-NLS-CL1-PEST) in a pUC19 vector backbone by means of
Gibson assembly (NEB). All primers used for Gibson assembly are listed in Extended Data
Table 1. The assembled repair vector was then mutated by site directed mutagenesis to eliminate
the PAM site (GGG>GGT) in the 3’ homology arm using the In-Fusion cloning kit (Takara).
Both the pSpCas9(BB)GFP and targeting vector were delivered to iPS cells by nucleofection
using a NEPA 21 electroporator. 24 hours after nucleofection, cells were sorted by GFP
expression using an S3 cell sorter (Biorad) and seeded at low density in Matrigel-coated plates
(Corning, cat. no. 35277) in mTeSR1 (Stemcell Technologies cat. no. 05851) + 10µM Y-
27362 dihydrochloride (Tocris Bioscience, cat. no. 1254). Single cells were allowed to expand
clonally and individual colonies were screened by PCR for targeted homozygous insertion of
2A-Achilles-CL1-PEST-NLS immediately before the stop codon of HES7. The following
primers anneal outside the repair vector homology arms and were used for genotyping: Fwd
5’ ATCTCCTCCTCACGCGTTGG 3’; Rev 5’ AGAGTGCCAAATTGATTCGTCTCC 3’.
Positive clones were sequenced to ensure no undesired mutations in the HES7 locus had been
introduced by the genome editing process. Three homozygous clones were further validated
by RT-qPCR and immunofluorescence.
iPS cell culture and 2D differentiation NCRM1 iPS cells (RUCDR, Rutgers University) and
lines carrying the MSGN1-Venus13 or HES7-Achilles reporters were maintained in Matrigel-
coated plates (Corning, cat. no. 35277) in mTeSR1 medium (Stemcell Technologies cat. no.
05851) as previously described10. Paraxial mesoderm differentiation was carried out as
described10. Briefly, mature iPS cell cultures were dissociated in Accutase (Corning cat. no.
25058CI) and seeded at a density of 3 × 10⁴ cells per cm2 on Matrigel-coated plates in
mTeSR1 and 10µM Y-27362 dihydrochloride (Rocki; Tocris Bioscience, cat. no. 1254). Cells
were cultured for 24-48 hours until small, compact colonies were formed. Differentiation was
initiated by switching to CL medium consisting of DMEM/F12 GlutaMAX (Gibco cat. no.
10565042) supplemented with 1% Insulin-Transferrin-Selenium (Gibco cat. no. 41400045), 3
µM Chir 99021 (Tocris cat. no. 4423) and 0.5 µM LDN193189 (Stemgent cat. no. 04-0074).
On day 3 of differentiation, cells were changed to CLF medium consisting of CL medium
with 20ng/ml murine bFGF (PeproTech cat. no. 450-33). Media was changed daily.bioRxiv preprint first posted online Nov. 4, 2018; doi: http://dx.doi.org/10.1101/461822. The copyright holder for this preprint (which
was not peer-reviewed) is the author/funder, who has granted bioRxiv a license to display the preprint in perpetuity.
It is made available under a CC-BY 4.0 International license.
For live imaging experiments, differentiation was performed as described above, except cells
were seeded on 35 mm matrigel-coated glass-bottom dishes (MatTek cat. no. P35G-1.5-20-C)
or 24 well glass-bottom plates (In Vitro Scientific cat. no. P24-1.5H-N). DMEM/F12 without
phenol red was used to reduce background fluorescence (Gibco cat. no. 21041025 ).
To extend the oscillatory window of differentiated PSM cells, we cultured HES7-Achilles cells in
CLFBR medium consisting of DMEM/F12 GlutaMAX, 1% ITS, 3 µM Chir 99021, 0.5 µM
LDN193189, 50 ng/ml mFgf4 (R&D Systems cat. no. 5846-F4-025), 1 µg/ml Heparin (Sigma
Aldrich cat. no. H3393-100KU), 2.5 µM BMS493 (Sigma Aldrich cat. no. B6688-5MG) and 10
µM Y-27362 dihydrochloride starting on day 2 of differentiation. Media was refreshed daily.
To track oscillations in individual cells within the culture, we mixed HES7-Achilles cells with
NCRM1 cells with a ratio of 1:100 at the time of seeding for pre-differentiation. Cells were then
differentiated normally under CLFBR conditions.
To examine oscillations in isolated cells, we differentiated HES7-Achilles cells normally (CL
medium) for the first two days on 35mm plastic dishes and dissociated them with Accutase
(Corning cat. no. 25058CI) on day 2 of the differentiation protocol. Cells were reseeded on
fibronectin-coated (BD Biosciences cat. no. 356008) or bovine serum albumin (BSA)-coated
(Gibco cat. no. 15260-037) 24 well glass-bottom plates at high (500,000 cells per well) or low
density (25,000-50,000 cells per well) in CLFBR media. Using our regular DMEM/F12 base
media resulted in poor survival of low density cultures. We found that using RHB Basal
media (Takara/Clontech cat. no. Y40000), supplemented with 5% knockout serum replacement
(KSR; Thermo Fisher cat. no. 10828-028) improved survival significantly.
Explant culture Explant culture was performed as previously described4. LuVeLu E9.5 mice
were sacrificed according to local regulations in agreement with national and international
guidelines. Study protocol was approved by Brigham and Women's Hospital IACUC/CCM/
Ectoderm was removed using Accutase (Life Technologies) and tailbud was dissected with a
tungsten needle. Explants were then cultured on fibronectin-coated plate (LabTek chamber). The
medium consists of DMEM, 4.5g/L Glucose, 2mM L-Glutamine, non-essential amino acids 1x
(Life Technologies), Penicillin 100U/mL, Streptomycin 100μg/mL, 15% fetal bovine serum
(FBS), Chir-99021 3μM, LDN193189 200nM, BMS-493 2.5 μM, mFgf4 50ng/mL, heparin
1μg/mL, HEPES 10mM and Y-27632 10μM. Explants were incubated at 37°C, 7.5% CO2. Live
imaging was performed on a confocal microscope Zeiss LSM 780, using a 20X objective (note
that the tiling could create lines between the different images). For micropattern culture, explants
were cultured overnight in standard condition, then dissociated using Trypsin-EDTA, and plated
on fibronectin-coated CYTOOchips Arena in a CYTOOchamber 4 wells.
Small Molecule Inhibitor Treatments To inhibit Notch signaling, 25 µM DAPT (Sigma
Aldrich cat. no. D5942-5MG) was added to CLFBR media on day 2 of differentiation. To inhibit
FGF signaling, PD0325901 (Stemgent 04-006) or PD173074 (Cayman Chemical cat. no.
219580-11-7) were added to CL or CLFBR media at the indicated concentrations. Latrunculin A
(Cayman Chemical ca. no. 10010630), which inhibits actin polymerization and YAP signaling,
was used at 350 nM in RHB basal media supplemented with CLFBR and 5% KSR. Mouse
explants and micropatterned cultures were treated with PD0325901 (Sigma- concentration as
described in the text) and PD173074 (Sigma - 250nM).bioRxiv preprint first posted online Nov. 4, 2018; doi: http://dx.doi.org/10.1101/461822. The copyright holder for this preprint (which
was not peer-reviewed) is the author/funder, who has granted bioRxiv a license to display the preprint in perpetuity.
It is made available under a CC-BY 4.0 International license.
Time-lapse Microscopy Time lapse-imaging of MSGN1-Venus or HES7-Achilles PSM cells was
performed on a Zeiss LSM 780 point-scanning confocal inverted microscope fitted with a large
temperature incubation chamber and a CO2 module. An Argon laser at 514 nm and 7.5% power
was used to excite the samples through a 20X Plan Apo (N.A. 0.8) objective. Images were
acquired with an interval of 18 minutes for a total of 24-48 hours. A 3x3 tile of 800x800 pixels
per tile with a single z-slice of 18 µm thickness was acquired per position. Multiple positions,
with at least two positions per sample, were imaged simultaneously using a motorized stage.
Explant imaging was performed on a Zeiss LSM780 microscope using a 20X/0.8 objective. For
mouse cells imaging, single section (~19.6μm wide) with tiling (3x3) of a 512x512 pixels field
was acquired every 7.5 minutes (in most experiments) at 8-bit resolution.
Immunostaining For immunostaining of 2D cultures, cells were grown on Matrigel-coated
glass-bottom plates or 12mm glass coverslips placed inside plastic dishes. Cells were rinsed in
Dulbecco's phosphate buffered saline (DPBS) and fixed in a 4% paraformaldehyde solution
(Electron Microscopy Sciences cat. no. 15710) for 20 minutes at room temperature, then washed
3 times with phosphate buffered saline (PBS). Typically, samples were permeabilized by
washing three times for three minutes each in Tris buffered saline (TBS) with 0.1% Tween
(known as TBST) and blocked for one hour at room temperature in TBS-0.1% Triton-3% FBS.
Primary antibodies were diluted in blocking solution and incubated overnight at 4⁰C with gentle
rocking. Primary antibodies and dilution factors are listed in Ext. Data Table 2. Following three
TBST washes and a short 10-minute block, cells were incubated with Alexa-Fluor conjugated
secondary antibodies (1:500) and Hoechst33342 (1:1000) overnight at 4⁰C with gentle rocking.
Three final TBST washes and a PBS rinse were performed, and cells were mounted in
Fluoromount G (Southern Biotech cat. no. 0100-01). Images were acquired using either a Zeiss
LSM880 or LSM780 point scanning confocal microscope with a 20X objective.
For visualizing phospho-ERK1/2 in 2D monolayer differentiated cells, cells were transferred
onto ice and quickly rinsed in ice-cold PBS containing 1 mM sodium vanadate (NaVO4). Next,
cells were fixed in 4% paraformaldehyde for 15 min at room temperature, rinsed three times in
PBS and dehydrated in cold methanol at -20⁰C for 10 minutes. Following three PBS rinses, cells
were blocked in PBS containing 0.1% Triton X-100 and 5% goat serum and incubated in
pERK1/2 antibody diluted in antibody buffer (0.1% Triton X-100 and 1% BSA in PBS)
overnight at 4⁰C. Cells were washed in PBS, and incubated in blocking solution for 10 minutes
and with secondary antibody and Hoechst33342 in antibody buffer overnight at 4⁰C. Cells were
rinsed three times in PBS before mounting and imaging as described above.
RNA extraction, reverse transcription and qPCR Cells were harvested in Trizol (Life
Technologies cat. no. 15596-018), followed by precipitation with Chloroform and Ethanol and
transfer onto Purelink RNA Micro Kit columns (Thermo Fisher cat. no. 12183016) according to
manufacturer’s protocol, including on-column DNase treatment. A volume of 22 µl RNase-free
water was used for elution and RNA concentration and quality were assessed with a Nanodrop.
Typically, between 0.2-1 µg of RNA was reverse transcribed using Superscript III First Strand
Synthesis kit (Life Technologies cat. no. 18080-051) and oligo-dT primers to generate cDNA
libraries.
For real time quantitative PCR, cDNA was diluted 1:30-1:50 in water and qPCR was performed
using the iTaq Universal SYBR Green kit (Bio-Rad cat. no. 1725124). Each gene-specific primerbioRxiv preprint first posted online Nov. 4, 2018; doi: http://dx.doi.org/10.1101/461822. The copyright holder for this preprint (which
was not peer-reviewed) is the author/funder, who has granted bioRxiv a license to display the preprint in perpetuity.
It is made available under a CC-BY 4.0 International license.
and sample mix was run in triple replicates. Each 10 µl reaction contained 5 µl 2X SYBR Green
Master Mix, 0.4 µl of 10 µM primer stock (1:1 mix of forward and reverse primers), and 4.6 µl
of diluted cDNA. qPCR plates were run on a Bio-Rad CFX384 thermocycler with the following
cycling parameters: initial denaturation step (95°C for 1 minute), 40 cycles of amplification and
SYBR green signal detection (denaturation at 95°C for 5 seconds, annealing/extension and plate
read at 60°C for 40 seconds), followed by final rounds of gradient annealing from 65ºC to 95ºC
to generate dissociation curves. Primer sequences are listed in Extended Data Table 3. All
unpublished primers were validated by checking for specificity (single peak in melting curve)
and linearity of amplification (serially diluted cDNA samples). For relative gene expression
analysis, the ΔΔCt method was implemented with the CFX Manager software. PP1A was used as
the housekeeping gene in all cases. Target gene expression is expressed as fold change relative to
undifferentiated iPS cells.
Flow Cytometry Analysis To determine the fraction of PSM cells expressing MSGN1-Venus,
cultures were dissociated in Accutase and analyzed by flow cytometry using an S3 cell sorter
(Biorad). Undifferentiated MSGN1-Venus iPS cells, which do not express the fluorescent protein,
were used as a negative control for gating purposes. Samples were analyzed in biological
triplicates. Results are presented as the percentage of Venus positive cells in the sorted fraction.
Image Analysis Time lapse movies of HES7-Achilles were first stitched and separated into
subsets by position in Zen. Then, background subtraction and Gaussian blur filtering were
performed in ImageJ to enhance image quality. A small region of interest (ROI) was drawn and
the mean fluorescence intensity over time was calculated. Intensity is presented in arbitrary units,
which are sometimes regularized to oscillate around zero by subtracting the moving average with
a window size of 10 timepoints. For smoothening, we applied the Sgolay filtering algorithm in
MATLAB. Following moving average subtraction, we performed Fourier transformation of
HES7-Achilles intensity profiles to determine the predominant period of oscillations. The Hilbert
transformation was used to calculate the instantaneous frequency and phase of HES7-Achilles
oscillations. To compare the phase between DMSO and PD17 or PD03 treated cells, we used the
Hilbert transformation to calculate the instantaneous phase of each curve separately, then
subtracted the phase of treated cells from untreated cells at each timepoint. Phase difference is
expressed as the average of instantaneous phase differences before the arrest of oscillations in
treated cells. To track oscillations in isolated or sparse HES7-Achilles cells in a NCRM1
background, we manually tracked cells by drawing a circle around the nucleus of an individual
cell at each time point and measuring fluorescence intensity inside the ROI.
For mouse explants, kymographs were done in Fiji by drawing a rectangle from the starting
center of the traveling waves to the edge of the explant perpendicular to the direction of the
wave. The intensity along the long axis was measured and the image was smoothened (this filter
replaces each pixel with the average of its 3 × 3 neighborhood).
Fluorescence intensity profiles were done by selecting a circular region of interest in FiJi and by
measuring the total intensity over time for this region; LuVeLu intensity is given in arbitrary
units (normalized by the initial value) and a smoothing function (average over three points) was
applied. Fluorescence intensity shows the mean fluorescence smoothed by applying a moving
average over five points (with equal weight). For the quantification of micropattern experiments,
a region of interest encompassing the entire surface of one circle was drawn and the LuVeLu
intensity was measured using the Time Series Analyzer V3 plugin on Fiji. The period wasbioRxiv preprint first posted online Nov. 4, 2018; doi: http://dx.doi.org/10.1101/461822. The copyright holder for this preprint (which
was not peer-reviewed) is the author/funder, who has granted bioRxiv a license to display the preprint in perpetuity.
It is made available under a CC-BY 4.0 International license.
measured by measuring the time between two peaks or two troughs. The average intensity was
measured by averaging the intensity over 3 hours to avoid instantaneous variations dues to the
oscillations.
Phase and phase shifts Synchronization was evaluated from the fluorescence intensity data. The
data show clear oscillations with relatively heterogeneous profiles and background fluorescence
intensity (see Movie S5). To evaluate precisely an instantaneous phase, we used classical
methods and developed custom algorithms adapted to the signals observed. All algorithms
provided consistent results.
Method 1: we developed a local cross-correlation algorithm that computes the phase shift
between two signals at a given time as the optimal timeshift of a local part of the signal within a
time-window of 6 hours, slightly larger than the period of the average signal (the average
distance between two peaks of the mean of all fluorescence trajectories yields a period of 5.02
hours). This algorithm was developed in Matlab. We used this cross-correlation algorithm to
compute phase differences between individual signals and the global oscillatory pattern, either
computing the phase shift between each pair of cells, or between one cell and the mean signal.
Method 2: Alternatively, we defined intrinsic phases for each signal as the relative time between
two peaks. Peaks were detected using the findpeaks function of Matlab. When peak times are
detected, say at times t , t , … , t , the phase of the signal at a given time t t , t was
defined as . The code was developed in Matlab.
శభ
Method 3: We compared these two new methods, well adapted to the type of signal obtained, to
the classical Hilbert transform method. This efficient method presents a few well-known
artifacts, particularly due to changes in the shape of the signal, classically corrected using a
detrending algorithm. To improve the evaluation of the phase using the Hilbert transform, we
used a local detrending consisting in removing a moving average computed over a time window
of 6h, allowing correcting for local trends, and evaluated the phase using the hilbert function of
Matlab.
Synchronization and the Kuramoto model To quantify the level of synchrony of a given set of
signals, we compared the distribution of phase shifts with the classical Kuramoto model27. This
model describes the dynamics of heterogeneous coupled oscillators, and depends on three
parameters: the number of interacting oscillators n, the disorder of intrinsic oscillation frequency
ω and the coupling parameter K. Denoting θ the phase of oscillator i 1 n and ω its
frequency, the Kuramoto model describes the phases as:
dθ K
ω sinθ θ
dt n
You can also read