Review Article Election Prediction on Twitter: A Systematic Mapping Study - Hindawi.com
←
→
Page content transcription
If your browser does not render page correctly, please read the page content below
Hindawi
Complexity
Volume 2021, Article ID 5565434, 27 pages
https://doi.org/10.1155/2021/5565434

Review Article
Election Prediction on Twitter: A Systematic Mapping Study

 Asif Khan ,1 Huaping Zhang ,1 Nada Boudjellal ,1 Arshad Ahmad ,2 Jianyun Shang,1
 Lin Dai,1 and Bashir Hayat 3
 1
 School of Computer Science and Technology, Beijing Institute of Technology, Beijing 100081, China
 2
 Department of IT and Computer Science, Pak-Austria Fachhochschule: Institute of Applied Sciences and Technology,
 Mang Khanpur Road, Haripur 22620, Pakistan
 3
 Institute of Management Sciences, Peshawar 25000, Pakistan

 Correspondence should be addressed to Huaping Zhang; kevinzhang@bit.edu.cn

 Received 10 February 2021; Revised 18 March 2021; Accepted 25 March 2021; Published 8 April 2021

 Academic Editor: M. Irfan Uddin

 Copyright © 2021 Asif Khan et al. This is an open access article distributed under the Creative Commons Attribution License,
 which permits unrestricted use, distribution, and reproduction in any medium, provided the original work is properly cited.
 Context. Social media platforms such as Facebook and Twitter carry a big load of people’s opinions about politics and leaders,
 which makes them a good source of information for researchers to exploit different tasks that include election predictions.
 Objective. Identify, categorize, and present a comprehensive overview of the approaches, techniques, and tools used in election
 predictions on Twitter. Method. Conducted a systematic mapping study (SMS) on election predictions on Twitter and provided
 empirical evidence for the work published between January 2010 and January 2021. Results. This research identified 787 studies
 related to election predictions on Twitter. 98 primary studies were selected after defining and implementing several inclusion/
 exclusion criteria. The results show that most of the studies implemented sentiment analysis (SA) followed by volume-based and
 social network analysis (SNA) approaches. The majority of the studies employed supervised learning techniques, subsequently,
 lexicon-based approach SA, volume-based, and unsupervised learning. Besides this, 18 types of dictionaries were identified.
 Elections of 28 countries were analyzed, mainly USA (28%) and Indian (25%) elections. Furthermore, the results revealed that 50%
 of the primary studies used English tweets. The demographic data showed that academic organizations and conference venues are
 the most active. Conclusion. The evolution of the work published in the past 11 years shows that most of the studies employed SA.
 The implementation of SNA techniques is lower as compared to SA. Appropriate political labelled datasets are not available,
 especially in languages other than English. Deep learning needs to be employed in this domain to get better predictions.

1. Introduction interact and use it as a tool in their campaigns [4]. Of-
 fering an API that allows extracting public tweets and
The relation between social media platforms, being the new user’s public information and interconnections, it is
way of linking the parts of the world, and politics is no secret. considered a treasure for researchers aiming for election
This relation attracted researchers seeking to exploit this predictions.
era’s new abundant useful information to perform different Many researchers have analyzed and predicted different
tasks such as information extraction and sentiment analysis, countries’ elections on different social media platforms such
among others. One of the most widely used platforms by as Facebook and Twitter [4–8]. Few studies surveyed this
researchers is Twitter. Apart from the dictionary approach topic [9–11]. To the best of our knowledge, no study ever has
and statistical approaches, machine learning has been ef- reported a systematic mapping study (SMS) or systematic
fectively applied in several other domains for different literature review (SLR) about election predictions on
purposes, for instance, [1–3]. Machine learning improved Twitter. This research systematically identifies, gathers, and
the prediction job in terms of accuracy and precision. provides the available empirical evidence in this area.
 As of October 2020, Twitter had over 300 million users This research study assists in providing a comprehensive
worldwide; 91% of them are over the age of 18. This overview and getting more in-depth knowledge about
platform attracts many politicians and enables them to election prediction on Twitter, thus helping to
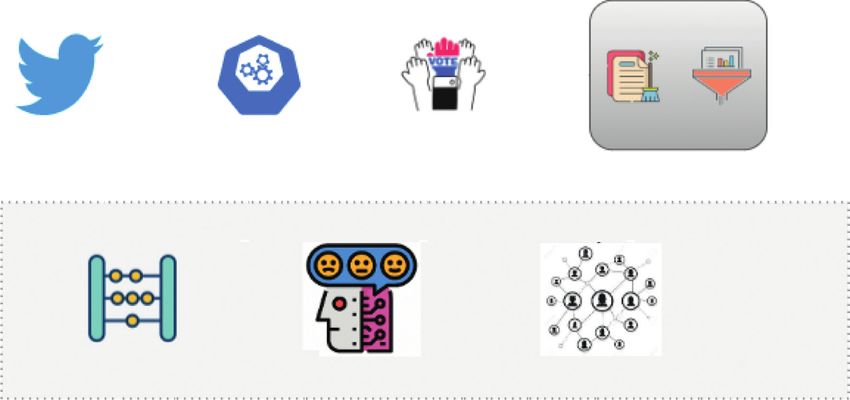
2 Complexity

 (i) identify research gaps (research opportunities) literature surveys, and none of them followed a detailed
 (ii) aid researchers (decision-making) when selecting systematic protocol. This study is the first systematic
 approaches or tools. mapping study that mainly focused on election prediction
 on Twitter and thoroughly overviewed and analyzed the
 The main contribution of this research work is as follows: selected 98 primary studies.
 (1) Identify and classify the main approaches (RQ1)
 used to predict election: its techniques (RQ1a) and 3. Methodology
 the tools (RQ1(b) (c))
 A systematic mapping study (SMS) is an effective way of
 (2) Identify the research works that have reported getting knowledge about the state-of-the-art of a research
 manual/automatic data labelling (political data) field. This study conducts an SMS of election prediction on
 (RQ2) Twitter. Figure 1 shows the detailed flow of this SMS.
 (3) Identify and enlist the countries whose elections are
 analyzed (RQ3)
 3.1. Approaches for Predicting Election on Twitter.
 (4) Identify and list the tweet languages used for pre- Various approaches possibly could be employed to predict
 dicting election on Twitter (RQ4) elections on Twitter. Researchers and practitioners mainly
 (5) Identify main topics used in the studies using ma- use three approaches: sentiment analysis (SA); volume-
 chine learning techniques (RQ5) based (Vol.); and social network analysis (SNA). Figure 2
 (6) Identify some demographic data in the field of shows a generalized framework of election prediction on
 election prediction on Twitter, such as the most Twitter. A Twitter API is used to collect tweets about the
 frequent publication venues, active countries, or- election (candidates, election, political party, and trends). It
 ganizations, and researchers (DQs) is then preprocessed (cleaned and filtered) according to the
 needs, such as removing unnecessary characters, white-
 (7) Providing a centralized source for the researchers spaces, stemming, and so on, for sentiment analysis. Af-
 and practitioners by gathering disperse shreds of terwards, an approach or technique is employed to perform
 evidence (studies) the election prediction job or task effectively.
 The remainder of this paper’s organization is as follows:
Section 2 provides an overview of the most related work, and 3.2. Aim and Research Questions. This study aims to identify
Section 3 presents a detailed methodology, following by and categorize the methods used for predicting elections on
Results and Discussion in Section 4. Furthermore, Section 5 the Twitter platform. This aim can be divided into a set of
deals with Validity and Threats, followed by the Conclusion research questions (RQs) for its broadness. The set of re-
and Future Work discussed in Section 6. search questions (RQs) is as follows:
 RQ1: what are the approaches used in predicting
2. Related Work elections on Twitter?

This section presents the most related work to SMS on RQ1(a): what are the techniques used for election
election predictions on Twitter. prediction on Twitter?
 Chauhan et al. [9] in 2020 surveyed election prediction RQ1(b): which tools are utilized for election
on online platforms such as Twitter and Facebook. Their predictions?
study presents an in-depth analysis of the evaluation of SA RQ1(c): which techniques/tools are employed for
techniques used in election prediction. They overviewed tweet collection?
nearly 48 studies, including 10 studies that tried to infer RQ2: which studies reported manually/automatically
users’ political stance. annotated data?
 In May 2019, Bilal et al. [10] presented a short overview of
 RQ3: which countries are reported for election pre-
election prediction on Facebook and Twitter. They gave an
 diction on Twitter?
overview of 13 studies. Their study mainly categorized the
studies into two approaches: sentiment analysis and others. RQ4: what are the languages of tweets used for pre-
Additionally, they categorized those studies into two cate- dicting elections on Twitter?
gories: “can predict elections” and “cannot predict elections.” RQ5: what are the most frequent topics discussed?
 Singh and Sawhney [11] conducted a review of 16 papers
 We also gathered and investigated some exciting in-
in December 2017 related to forecasting elections on Twitter.
 formation by defining and answering some demographic
They listed the countries whose elections were analyzed and
 questions (DQs): most active countries, organizations, and
provided tweet statistics used in the selected studies. Fur-
 authors. This information helps the practitioners, re-
thermore, they listed and presented the methods used for
 searchers, and organizations in a certain way [12–15]. The set
prediction and classified the studies into successfully and
 of DQs is as follows:
unsuccessfully, predicted elections.
 All these studies presented short reviews except for [9]. DQ1: who are the most active researchers in the field of
Besides, all the aforementioned studies performed Adhoc analyzing election prediction on Twitter?
Complexity 3

 Process Definition of Keywording using Data extraction and
 Conduct search Screening of papers
 steps research questions abstracts mapping process

 Classification
 Outcomes Review scope All papers Relevant papers Systematic map
 scheme

 Figure 1: SMS process flow.

 Data preprocessing

 api
 Cleaning Filtering
 Twitter Election (tweets)

 Election prediction
 approaches

 Volumetric Sentiment analysis Social network analysis

 Community detection, strong
 Number of users, tweets, mentions, Number positive/negative tweets about
 community. Node importance using
 likes/favorited party, candidate
 graph analysis

 Lexicon approach Hybrid approach Machine learning

 Dictionary approach Corpus-based approach Supervised learning Unsupervised learning Deep learning

 VADER, SentiWordNet, K-means clustering, K- Recurrent neural
 LSD, WordNet, etc. Statistical Semantic medoids, fuzzy C- network, recursive
 means, agglomerative neural network,
 algorithms CNN, LSTM

 Probabilistic classifiers Decision trees Linear classifiers Rule-based classifiers

 NB, Bayesian network, SVM, neural network,
 max entropy K-NN

 Figure 2: Overview of election prediction approaches and techniques.

 DQ2: which are the most active organizations? 3.3. Search Strategy. It is mandatory to complete two es-
 sential operations before executing the search in different
 DQ3: which are the most active publication venues?
 digital libraries: (a) specify search keywords and (b) specify
 Table 1 gives a short description of research questions digital libraries. Search keywords compose the search strings
(RQs) and demographic questions (DQs). in digital libraries. Search keywords are identified in the
4 Complexity

 Table 1: Description of research and demographic questions (RQs and DQs).
Questions Description
RQ1 Approaches (sentiment analysis, volumetric, social network analysis, or hybrid) used in the selected papers.
 Identify the learning techniques of the approaches used in the selected papers: Machine Learning (supervised,
RQ1(a)
 unsupervised, hybrid, deep learning), lexicon-based approach, and no machine learning (volumetric, online tool).
RQ1(b) Identify tools, libraries, and dictionaries along with the primary studies.
RQ1(c) List the techniques used for collecting tweets.
 Identify and list the studies that manually/automatically labelled the data to assist their experiments (training, testing
RQ2
 data).
RQ3 List of the countries whose elections are analyzed on Twitter in the selected papers.
RQ4 List of tweet languages analyzed in the selected papers.
RQ5 Identify the most frequent topics automatically using LDA in the selected papers.
DQ1, DQ2,
 Based on the number of publications, the minimum contribution level is two papers.
DQ3

former operation after analyzing the research field to which The following inclusion criteria were applied to the
this study applies, “Election Prediction on Twitter.” Table 2 abstract of each paper:
shows the whole set of selected keywords for this study. In IC1: the study, related to election prediction (or
the latter operation, we selected a list of digital libraries to forecasting) on Twitter
execute the search strings. Five digital libraries were selected IC2: research published in the field of “Computer
to carry out this research: IEEE Xplore, Web of Science Science”
(WoS), Scopus, ACM, and ScienceDirect. The keywords
were used to create final queries using IC3: research published online between January 2010
 and January 2021
 Q � V1x�1 Ax ∧ V2y�1 By ∧ V1z�1 Cz . (1) IC4: the reading of the study abstract must fit the topic
 We executed search queries on the level of title, abstract, and The following criteria were applied to exclude the papers:
keywords of the articles. Some digital libraries do not provide EC1: research papers, written in languages other than
search on the level of title, abstract, and keywords. In such a English
case, the search is performed on the entire text. Table 3 shows
the list of digital libraries and the search queries that were EC2: papers that are not accessible in full-text
executed to obtain potential primary papers. We performed the EC3: research published in non-peer review venues
search in three different periods (phases), which are as follows: EC4: grey literature and books
 I. E1: searching and selection of papers from January 1, EC5: exclude short papers (less than four pages)
 2010, to January 14, 2020 EC6: exclude duplicate papers (selected only the most
 II. E2: searching and selection of papers from January recent and detailed one)
 15, 2020, to January 7, 2021 EC7: studies that present summaries of editorials/
 III. E3: searching and selection of papers from January conferences
 1, 2010, to January 7, 2021
 A top-down approach was followed to fulfill the criteria
 The logic behind the three extraction phases is that we for the quality of the selection of relevant papers. Initially,
started this research before the second phase. Due to Covid- the papers were excluded after taking the metadata such as
19, the work has been delayed. It can be noticed that E2 is not title, abstract, and keywords of the papers into consideration.
performed on Scopus. It is because, in mid-2020, Scopus has Furthermore, studies were excluded after reading the entire
discontinued the search in its library. We used the Scien- paper, if it is not in the scope of the current topic “Election
ceDirect library as an alternate to Scopus. Prediction on Twitter” or having low quality, such as the
 Almost every digital library allows users to export the paper’s methodology did not satisfy the reader (author).
search results in some formats, that includes the title of the All the papers were equally distributed among all the
paper, metadata (venue, year of publication, authors names, authors to select the relevant paper by applying the inclusion
authors affiliation, and much more), abstract (some digital and exclusion criteria. The authors held a meeting to ensure
libraries do not provide that), and keywords. After executing that a relevant paper is not excluded and an irrelevant paper
the first search, we obtained 787 potential papers. is not included. The authors applied the criteria defined in
 [16, 17], to deal with disagreements. The details are given in
 Table 4. A paper is excluded if it falls in the category “F”
3.4. Selection of Study and Quality Assessment. Mainly two (Exclude) or category “E” (consider as doubtful).
tasks are included in the process of selecting a relevant paper: Figure 3 shows a full flow of the search in the five digital
(1) defining the criteria for including/excluding the paper libraries and the selection process using inclusion/exclusion
and (2) applying the defined criteria to choose the relevant criteria. Table 5 shows the list of 98 primary selected papers
papers [16–18]. for this SMS study with their bibliographic references.
Complexity 5

 Table 2: Definition of keywords.
A B C
A1: Election B1: Predict ∗ (Predict, Prediction, Predicted, Predicting) C1: Twitter
 B2: Forecast ∗ (Forecast, Forecasting, Forecasted)

 Table 3: Example of queries in Digital Libraries.
Digital library Query
Web of Science TS � (ELECTION) AND TS � (PREDICT∗ OR FORECAST∗ ) AND TS � (TWITTER)
IEEE (((“All Metadata”:election) AND “All Metadata”:”predict∗ ” OR “forecast∗ ”) AND “All Metadata”:twitter
 (Title:(election) OR Abstract:(election)) AND (Title:(“prediction” “forecast∗ ”) OR Abstract:(“prediction” “forecast∗ ”))
ACM
 AND (Title:(twitter) OR Abstract:(twitter))
 (TITLE-ABS-KEY ( election) AND (TITLE-ABS-KEY ( predict∗ ) OR TITLE-ABS-KEY (forecast∗ ) ) AND TITLE-ABS-
Scopus
 KEY (twitter) )
ScienceDirect Title, abstract, keywords: ((“election”) AND (“predict∗ ” OR “forecast∗ ”) AND “twitter”))

 Table 4: Decision rules.
 Reviewer 1
 Include Uncertain Exclude
 Include A B D
Reviewer 2 Uncertain B C E
 Exclude D E F

 WoS IEEE ACM Scopus ScienceDirect

 187(E1) + 20(E2) = 207 194(E1) + 18(E2) = 212 73(E1) + 2(E2) = 75 280(E1) = 280 13(E3) = 13

 140 198 45 205 4

 592
 After selecting CS papers
 in English only

 –224

 368 349 160
 –19 –189
 After removal of duplicates After removal of short papers After reading title and abstract

 –62

 98
 After reading entire paper (quality).
 selected primary papers

 Figure 3: Search and selection flow.

 Table 5: Selected studies.
Primary # of citation
 References
Study (till Jan 2021)
 R. C. Prati and E. Said-Hung, “Predicting the ideological orientation during the Spanish 24M
S-01 3 elections in Twitter using machine learning,” AI Soc., vol. 34, no. 3, pp. 589–598, 2019, doi: 10.1007/
 s00146-017-0761-0.
6 Complexity

 Table 5: Continued.
Primary # of citation
 References
Study (till Jan 2021)
 P. Mazumder, N. A. Chowdhury, M. Anwar-Ul-Azim Bhuiya, S. H. Akash, and R. M. Rahman, “A
S-02 0 Fuzzy Logic Approach to Predict the Popularity of a Presidential Candidate,” in Studies in
 Computational Intelligence, 2018, vol. 769, pp. 63–74, doi: 10.1007/978-3-319-76081-0_6.
 D. Beleveslis, C. Tjortjis, D. Psaradelis, and D. Nikoglou, “A hybrid method for sentiment analysis of
S-03 2
 election related tweets,” 2019, doi: 10.1109/SEEDA-CECNSM.2019.8908289.
 E. Sanders and A. van den Bosch, “A Longitudinal Study on Twitter-Based Forecasting of Five Dutch
 National Elections,” in Lecture Notes in Computer Science (including subseries Lecture Notes in
S-04 3
 Artificial Intelligence and Lecture Notes in Bioinformatics), 2019, vol. 11864 LNCS, pp. 128–142, doi:
 10.1007/978-3-030-34971-4_9.
 L. Oikonomou and C. Tjortjis, “A Method for Predicting the Winner of the USA Presidential
S-05 15
 Elections using Data extracted from Twitter,” 2018, doi: 10.23919/SEEDA-CECNSM.2018.8544919.
 M. Anjaria and R. M. R. Guddeti, “A novel sentiment analysis of social networks using supervised
S-06 46
 learning,” Soc. Netw. Anal. Min., vol. 4, no. 1, pp. 1–15, 2014, doi: 10.1007/s13278-014-0181-9.
 A. J. Wicaksono, Suyoto, and Pranowo, “A proposed method for predicting US presidential election
 by analyzing sentiment in social media,” in Proceeding - 2016 2nd International Conference on
S-07 12
 Science in Information Technology, ICSITech 2016: Information Science for Green Society and
 Environment, 2017, pp. 276–280, doi: 10.1109/ICSITech.2016.7852647.
 J. A. Cerón-Guzmán and E. León-Guzmán, “A sentiment analysis system of Spanish tweets and its
 application in Colombia 2014 presidential election,” in Proceedings - 2016 IEEE International
S-08 16 Conferences on Big Data and Cloud Computing, BDCloud 2016, Social Computing and Networking,
 SocialCom 2016 and Sustainable Computing and Communications, SustainCom 2016, 2016, pp.
 250–257, doi: 10.1109/BDCloud-SocialCom-SustainCom.2016.47.
 S. Bhatia, B. Mellers, and L. Walasek, “Affective responses to uncertain real-world outcomes:
S-09 6
 Sentiment change on Twitter,” PLoS One, vol. 14, no. 2, 2019, doi: 10.1371/journal.pone.0212489.
 M. Plummer, M. A. Palomino, and G. L. Masala, “Analysing the Sentiment Expressed by Political
 Audiences on Twitter: The Case of the 2017 UK General Election,” in Proceedings - 2017
S-10 2
 International Conference on Computational Science and Computational Intelligence, CSCI 2017,
 2018, pp. 1449–1454, doi: 10.1109/CSCI.2017.253.
 R. Srivastava, M. P. S. Bhatia, H. Kumar, and S. Jain, “Analysing Delhi Assembly Election 2015 using
S-11 20 textual content of social network,” in ACM International Conference Proceeding Series, 2015, vol. 25-
 27-Sept, pp. 78–85, doi: 10.1145/2818567.2818582.
 R. Bose, R. K. Dey, S. Roy, and D. Sarddar, “Analysing political sentiment using Twitter data,” Smart
S-12 18
 Innov. Syst. Technol., vol. 107, pp. 427–436, 2019, doi: 10.1007/978-981-13-1747-7_41.
 E. Tunggawan and Y. E. Soelistio, “And the winner is...: Bayesian Twitter-based prediction on 2016
 US presidential election,” in Proceeding - 2016 International Conference on Computer, Control,
S-13 21
 Informatics and its Applications: Recent Progress in Computer, Control, and Informatics for Data
 Science, IC3INA 2016, 2017, pp. 33–37, doi: 10.1109/IC3INA.2016.7863019.
 M. Ramzan, S. Mehta, and E. Annapoorna, “Are tweets the real estimators of election results?,” in
S-14 6 2017 10th International Conference on Contemporary Computing, IC3 2017, 2018, vol. 2018-Janua,
 no. August, pp. 1–4, doi: 10.1109/IC3.2017.8284309.
 L. Chen, W. Wang, and A. P. Sheth, “Are twitter users equal in predicting elections? A study of user
 groups in predicting 2012 US republican presidential primaries,” in Lecture Notes in Computer
S-15 35
 Science (including subseries Lecture Notes in Artificial Intelligence and Lecture Notes in
 Bioinformatics), 2012, vol. 7710, no. May 2014, pp. 379–392, doi: 10.1007/978-3-642-35386-4_28.
 R. Castro, L. Kuffó, and C. Vaca, “Back to #6D: Predicting Venezuelan states political election results
S-16 16 through Twitter,” in 2017 4th International Conference on e-democracy and eGovernment, ICEDEG
 2017, 2017, pp. 148–153, doi: 10.1109/ICEDEG.2017.7962525.
 Z. Xie, G. Liu, J. Wu, and Y. Tan, “Big data would not lie: prediction of the 2016 Taiwan election via
S-17 8 online heterogeneous information,” EPJ Data Sci., vol. 7, no. 1, 2018, doi: 10.1140/epjds/s13688-018-
 0163-7.
 M. Ibrahim, O. Abdillah, A. F. Wicaksono, and M. Adriani, “Buzzer Detection and Sentiment
 Analysis for Predicting Presidential Election Results in a Twitter Nation,” in Proceedings - 15th IEEE
S-18 0
 International Conference on Data Mining Workshop, ICDMW 2015, 2016, pp. 1348–1353, doi:
 10.1109/ICDMW.2015.113.
 A. A. Khatua, A. A. Khatua, K. Ghosh, and N. Chaki, “Can #Twitter-Trends predict election results?
S-19 44 Evidence from 2014 Indian general election,” in Proceedings of the Annual Hawaii International
 Conference on System Sciences, 2015, vol. 2015-March, pp. 1676–1685, doi: 10.1109/HICSS.2015.202.
 P. Singh, Y. K. Dwivedi, K. S. Kahlon, A. Pathania, and R. S. Sawhney, “Can twitter analytics predict
S-20 3 election outcome? An insight from 2017 Punjab assembly elections,” Gov. Inf. Q., vol. 37, no. 2, p.
 101444, 2020, doi: 10.1016/j.giq.2019.101444.
Complexity 7

 Table 5: Continued.
Primary # of citation
 References
Study (till Jan 2021)
 P. Juneja and U. Ojha, “Casting online votes: To predict offline results using sentiment analysis by
S-21 10 machine learning classifiers,” 8th Int. Conf. Comput. Commun. Netw. Technol. ICCCNT 2017, 2017,
 doi: 10.1109/ICCCNT.2017.8203996.
 D. A. Kristiyanti, A. H. Umam, M. Wahyudi, R. Amin, and L. Marlinda, “Comparison of SVM Naı̈ve
 Bayes Algorithm for Sentiment Analysis Toward West Java Governor Candidate Period 2018-2023
S-22 18
 Based on Public Opinion on Twitter,” 2018 6th Int. Conf. Cyber IT Serv. Manag. CITSM 2018, no.
 Citsm, pp. 1–6, 2019, doi: 10.1109/CITSM.2018.8674352.
 R. Jose and V. S. Chooralil, “Prediction of election result by enhanced sentiment analysis on twitter
S-23 34 data using classifier ensemble Approach,” Proc. 2016 Int. Conf. Data Min. Adv. Comput. SAPIENCE
 2016, no. November, pp. 64–67, 2016, doi: 10.1109/SAPIENCE.2016.7684133.
 S. Sharma and N. P. Shetty, Determining the popularity of political parties using twitter sentiment
S-24 5
 analysis, vol. 701. Springer Singapore, 2018.
 F. Pimenta, D. Obradović, and A. Dengel, “A comparative study of social media prediction potential
 in the 2012 US Republican presidential preelections,” Proc. - 2013 IEEE 3rd Int. Conf. Cloud Green
S-25 8
 Comput. CGC 2013 2013 IEEE 3rd Int. Conf. Soc. Comput. Its Appl. SCA 2013, pp. 226–232, 2013, doi:
 10.1109/CGC.2013.43.
 B. Charalampakis, D. Spathis, E. Kouslis, and K. Kermanidis, “A comparison between semi-
S-26 40 supervised and supervised text mining techniques on detecting irony in Greek political tweets,” Eng.
 Appl. Artif. Intell., vol. 51, no. C, pp. 50–57, May 2016, doi: 10.1016/j.engappai.2016.01.007.
 J. Ramteke, S. Shah, D. Godhia, and A. Shaikh, “Election result prediction using Twitter sentiment
S-27 76 analysis,” in Proceedings of the International Conference on Inventive Computation Technologies,
 ICICT 2016, 2016, vol. 1, doi: 10.1109/INVENTIVE.2016.7823280.
 P. Kassraie, A. Modirshanechi, and H. K. Aghajan, “Election vote share prediction using a
 sentiment-based fusion of Twitter data with Google trends and online polls,” in DATA 2017 -
S-28 7
 Proceedings of the 6th International Conference on Data Science, Technology and Applications, 2017,
 no. March, pp. 363–370, doi: 10.5220/0006484303630370.
 P. Mehndiratta, S. Sachdeva, P. Sachdeva, and Y. Sehgal, “Elections Again, Twitter May Help!!! A
S-29 8 Large Scale Study for Predicting Election Results Using Twitter,” 2014, pp. 133–144, doi: 10.1007/
 978-3-319-13820-6_11.
 M. Coletto, C. Lucchese, S. Orlando, and R. Perego, “Electoral predictions with Twitter: A machine-
S-30 20
 learning approach,” CEUR Workshop Proc., vol. 1404, 2015.
 S. Salari, N. Sedighpour, V. Vaezinia, and S. Momtazi, “Estimation of 2017 Iran’s Presidential
S-31 2 Election Using Sentiment Analysis on Social Media,” Proc. - 2018 4th Iran. Conf. Signal Process.
 Intell. Syst. ICSPIS 2018, pp. 77–82, 2018, doi: 10.1109/ICSPIS.2018.8700529.
 X. Hu, L. Li, T. Wu, X. Ai, J. Gu, and S. Wen, “Every word is valuable: Studied influence of negative
S-32 2 words that spread during election period in social media,” Concurr. Comput., vol. 31, no. 21, pp.
 1–11, 2019, doi: 10.1002/cpe.4525.
 B. Heredia, J. D. Prusa, T. M. Khoshgoftaar, and B. Raton, “Exploring the Effectiveness of Twitter at
 Polling the United States 2016 Presidential Election,” in Proceedings - 2017 IEEE 3rd International
S-33 14
 Conference on Collaboration and Internet Computing, CIC 2017, 2017, vol. 2017-Janua, pp. 283–290,
 doi: 10.1109/CIC.2017.00045.
 P. Singh, R. S. Sawhney, and K. S. Kahlon, “Forecasting the 2016 US presidential elections using
 sentiment analysis,” in Lecture Notes in Computer Science (including subseries Lecture Notes in
S-34 14
 Artificial Intelligence and Lecture Notes in Bioinformatics), 2017, vol. 10595 LNCS, pp. 412–423, doi:
 10.1007/978-3-319-68557-1_36.
 S. Rodrı́guez et al., “Forecasting the Chilean electoral year: Using twitter to predict the presidential
 elections of 2017,” in Lecture Notes in Computer Science (including subseries Lecture Notes in
S-35 5
 Artificial Intelligence and Lecture Notes in Bioinformatics), 2018, vol. 10914 LNCS, pp. 298–314, doi:
 10.1007/978-3-319-91485-5_23.
 A. Attarwala, S. Dimitrov, and A. Obeidi, “How efficient is Twitter: Predicting 2012 US presidential
 elections using Support Vector Machine via Twitter and comparing against Iowa Electronic
S-36 10
 Markets,” 2017 Intell. Syst. Conf. IntelliSys 2017, vol. 2018-Janua, no. September, pp. 646–652, 2018,
 doi: 10.1109/IntelliSys.2017.8324363.
 R. Rezapour, L. Wang, O. Abdar, and J. Diesner, “Identifying the Overlap between Election Result
 and Candidates’ Ranking Based on Hashtag-Enhanced, Lexicon-Based Sentiment Analysis,” in
S-37 23
 Proceedings - IEEE 11th International Conference on Semantic Computing, ICSC 2017, 2017, pp.
 93–96, doi: 10.1109/ICSC.2017.92.
 J. N. Franco-Riquelme, A. Bello-Garcia, and J. B. Ordieres-Meré, “Indicator Proposal for Measuring
 Regional Political Support for the Electoral Process on Twitter: The Case of Spain’s 2015 and 2016
S-38 2
 General Elections,” IEEE Access, vol. 7, pp. 62545–62560, May 2019, doi: 10.1109/
 ACCESS.2019.2917398.
8 Complexity

 Table 5: Continued.
Primary # of citation
 References
Study (till Jan 2021)
 M. Anjaria and R. M. R. Guddeti, “Influence factor based opinion mining of Twitter data using
S-39 0
 supervised learning,” 2014, doi: 10.1109/COMSNETS.2014.6734907.
 F. Tavazoee, C. Conversano, and F. Mola, “Investigating the relationship between tweeting style and
S-40 4 popularity: The case of US presidential election 2016,” Commun. Comput. Inf. Sci., vol. 786, no.
 December, pp. 112–123, 2017, doi: 10.1007/978-3-319-69548-8_9.
 M. Awais, S. Ul, H. Ali, S. U. Hassan, and A. Ahmed, “Leveraging big data for politics: predicting
S-41 5 general election of Pakistan using a novel rigged model,” J. Ambient Intell. Humaniz. Comput., no.
 0123456789, 2019, doi: 10.1007/s12652-019-01378-z.
 M. Gaurav, A. Kumar, A. Srivastava, and S. Miller, “Leveraging candidate popularity on Twitter to
S-42 55 predict election outcome,” Proc. 7th work. Soc. Netw. Min. Anal. SNA-KDD 2013, 2013, doi: 10.1145/
 2501025.2501038.
 T. M. Fagbola and S. C. Thakur, “Lexicon-based bot-aware public emotion mining and sentiment
S-43 0 analysis of the Nigerian 2019 presidential election on Twitter,” Int. J. Adv. Comput. Sci. Appl., vol. 10,
 no. 10, pp. 329–336, 2019, doi: 10.14569/ijacsa.2019.0101047.
 B. Bansal and S. Srivastava, “Lexicon-based Twitter sentiment analysis for vote share prediction
S-44 3 using emoji and N-gram features,” Int. J. Web Based Communities, vol. 15, no. 1, pp. 85–99, 2019,
 doi: 10.1504/IJWBC.2019.098693.
 B. Heredia, J. D. Prusa, and T. M. Khoshgoftaar, “Location-based twitter sentiment analysis for
S-45 5 predicting the US 2016 presidential election,” in Proceedings of the 31st International Florida
 Artificial Intelligence Research Society Conference, FLAIRS 2018, 2018, vol. 2009, pp. 265–270.
 T. Mahmood, T. Iqbal, F. Amin, W. Lohanna, and A. Mustafa, “Mining Twitter big data to predict
S-46 42 2013 Pakistan election winner,” in 2013 16th International Multi Topic Conference, INMIC 2013,
 2013, pp. 49–54, doi: 10.1109/INMIC.2013.6731323.
 K. Singhal, B. Agrawal, and N. Mittal, “Modeling indian general elections: Sentiment analysis of
S-47 28 political twitter data,” in Advances in Intelligent Systems and Computing, 2015, vol. 339, pp. 469–477,
 doi: 10.1007/978-81-322-2250-7_46.
 J. Smailović, J. Kranjc, M. Grčar, M. Žnidaršič, and I. Mozetič, “Monitoring the Twitter sentiment
S-48 53 during the Bulgarian elections,” Proc. 2015 IEEE Int. Conf. Data Sci. Adv. Anal. DSAA 2015, 2015,
 doi: 10.1109/DSAA.2015.7344886.
 M. E. Huberty, “Multi-cycle forecasting of congressional elections with social media,” PLEAD 2013 -
S-49 30 Proc. Work. Polit. Elections Data, Co-located with CIKM 2013, pp. 23–29, 2013, doi: 10.1145/
 2508436.2508439.
 R. Castro and C. Vaca, “National leaders’ twitter speech to infer political leaning and election results
S-50 3 in 2015 Venezuelan parliamentary elections,” in IEEE International Conference on Data Mining
 Workshops, ICDMW, 2017, vol. 2017-Novem, pp. 866–871, doi: 10.1109/ICDMW.2017.118.
 E. Kalampokis, A. Karamanou, E. Tambouris, and K. Tarabanis, “On predicting election results
S-51 12 using twitter and linked open data: The case of the UK 2010 election,” J. Univers. Comput. Sci., vol.
 23, no. 3, pp. 280–303, 2017, doi: 10.3217/jucs-023-03-0280.
 B. Bansal and S. Srivastava, “On predicting elections with hybrid topic based sentiment analysis of
S-52 14
 tweets,” Procedia Comput. Sci., vol. 135, pp. 346–353, 2018, doi: 10.1016/j.procs.2018.08.183.
 D. Murthy, “Twitter and elections: are tweets, predictive, reactive, or a form of buzz?,” Inf. Commun.
S-53 91
 Soc., vol. 18, no. 7, pp. 816–831, 2015, doi: 10.1080/1369118X.2015.1006659.
 S. Khan, S. A. Moqurrab, R. Sehar, and U. Ayub, Opinion and Emotion Mining for Pakistan General
S-54 0
 Election 2018 on Twitter Data, vol. 932, no. September. Springer Singapore, 2019.
 A. Jungherr, “Tweets and votes, a special relationship: The 2009 federal election in Germany,” in
S-55 58 PLEAD 2013 - Proceedings of the Workshop on Politics, Elections and Data, Co-located with CIKM
 2013, 2013, pp. 5–13, doi: 10.1145/2508436.2508437.
 A. Kulshrestha, D. Lu, A. Shah, and D. Lu, “Politically predictive potential of social networks:
S-56 4 Twitter and the Indian general election 2014,” in ACM International Conference Proceeding Series,
 2017, vol. Part F1296, doi: 10.1145/3092090.3092137.
 K. K. Kameswari, J. Raghaveni, R. S. Shankar, and C. S. Rao, “Predicting election results using
S-57 0 NLTK,” Int. J. Innov. Technol. Explor. Eng., vol. 9, no. 1, pp. 4519–4529, 2019, doi: 10.35940/
 ijitee.A4399.119119.
 S. Unankard, X. Li, M. Sharaf, J. Zhong, and X. Li, “Predicting elections from social networks based
 on sub-event detection and sentiment analysis,” in Lecture Notes in Computer Science (including
S-58 38
 subseries Lecture Notes in Artificial Intelligence and Lecture Notes in Bioinformatics), 2014, vol. 8787,
 pp. 1–16, doi: 10.1007/978-3-319-11746-1_1.
Complexity 9

 Table 5: Continued.
Primary # of citation
 References
Study (till Jan 2021)
 N. Dokoohaki, F. Zikou, D. Gillblad, and M. Matskin, “Predicting Swedish elections with Twitter: A
S-59 29 case for stochastic link structure analysis,” Proc. 2015 IEEE/ACM Int. Conf. Adv. Soc. Networks Anal.
 Mining, ASONAM 2015, pp. 1269–1276, 2015, doi: 10.1145/2808797.2808915.
 E. Sang and J. Bos, “Predicting the 2011 dutch senate election results with twitter,” in Proceedings of
S-60 336 the Workshop on Semantic Analysis in . . ., 2012, no. 53, pp. 53–60, [Online]. Available: http://
 dl.acm.org/citation.cfm?id�2389969.2389976%5Cnhttp://dl.acm.org/citation.cfm?id�2389976.
 A. Tumasjan, T. O. Sprenger, P. G. Sandner, and I. M. Welpe, “Predicting elections with Twitter:
S-61 3169 What 140 characters reveal about political sentiment,” ICWSM 2010 - Proc. 4th Int. AAAI Conf.
 Weblogs Soc. Media, pp. 178–185, 2010.
 P. Singh, R. S. Sawhney, and K. S. Kahlon, “Predicting the outcome of spanish general elections 2016
S-62 8 using twitter as a tool,” Commun. Comput. Inf. Sci., vol. 712, pp. 73–83, 2017, doi: 10.1007/978-981-
 10-5780-9_7.
 L. Mohan and S. Elayidom, “Predicting the winner of Delhi assembly election, 2015 from sentiment
S-63 0 analysis on twitter data-A bigdata perspective,” Int. Arab J. Inf. Technol., vol. 16, no. 5, pp. 833–842,
 2019.
 W. Budiharto and M. Meiliana, “Prediction and analysis of Indonesia Presidential election from
S-64 51 Twitter using sentiment analysis,” J. Big Data, vol. 5, no. 1, pp. 1–10, 2018, doi: 10.1186/s40537-018-
 0164-1.
 M. A. Razzaq, A. M. Qamar, and H. S. M. Bilal, “Prediction and analysis of Pakistan election 2013
 based on sentiment analysis,” in ASONAM 2014 - Proceedings of the 2014 IEEE/ACM International
S-65 37
 Conference on Advances in Social Networks Analysis and Mining, 2014, no. Asonam, pp. 700–703,
 doi: 10.1109/ASONAM.2014.6921662.
 B. R. Naiknaware and S. S. Kawathekar, “Prediction of 2019 Indian Election using sentiment
S-66 3 analysis,” Proc. Int. Conf. I-SMAC (IoT Soc. Mobile, Anal. Cloud), I-SMAC 2018, pp. 660–665, 2019,
 doi: 10.1109/I-SMAC.2018.8653602.
 R. Jose and V. S. Chooralil, “Prediction of election result by enhanced sentiment analysis on Twitter
 data using Word Sense Disambiguation,” in 2015 International Conference on Control,
S-67 37
 Communication and Computing India, ICCC 2015, 2016, pp. 638–641, doi: 10.1109/
 ICCC.2015.7432974.
 P. Sharma and T. S. Moh, “Prediction of Indian election using sentiment analysis on Hindi Twitter,”
S-68 55 in Proceedings - 2016 IEEE International Conference on Big Data, Big Data 2016, 2016, pp.
 1966–1971, doi: 10.1109/BigData.2016.7840818.
 L. Wang and J. Q. Gan, “Prediction of the 2017 French election based on Twitter data analysis,” 2017
S-69 26 9th Comput. Sci. Electron. Eng. Conf. CEEC 2017 - Proc., pp. 89–93, 2017, doi: 10.1109/
 CEEC.2017.8101605.
 L. Wang and J. Q. Gan, “Prediction of the 2017 French Election Based on Twitter Data Analysis
S-70 4 Using Term Weighting,” 2018 10th Comput. Sci. Electron. Eng. Conf. CEEC 2018 - Proc., pp. 231–235,
 2019, doi: 10.1109/CEEC.2018.8674188.
 Y. Gupta and P. Kumar, “Real-Time Sentiment Analysis of Tweets: A Case Study of Punjab
S-71 0 Elections,” Proc. 2019 3rd IEEE Int. Conf. Electr. Comput. Commun. Technol. ICECCT 2019, pp.
 1–12, 2019, doi: 10.1109/ICECCT.2019.8869203.
 F. Tavazoee, C. Conversano, and F. Mola, “Recurrent random forest for the assessment of popularity
S-72 3 in social media: 2016 US election as a case study,” Knowl. Inf. Syst., vol. 62, no. 5, pp. 1847–1879,
 2020, doi: 10.1007/s10115-019-01410-w.
 E. Sanders and A. Van Den Bosch, “Relating political party mentions on twitter with polls and
S-73 25
 election results,” in CEUR Workshop Proceedings, 2013, vol. 986, pp. 68–71.
 J. Arroba Rimassa, F. Llopis, and R. Munoz Guillena, “Relevance as an enhancer of votes on Twitter,”
S-74 0
 pp. 1–8, 2018, doi: 10.4995/carma2018.2018.8311.
 G. Hu, S. Kodali, and A. Padamati, “Sentiment analysis of tweets on 2016 US presidential election
S-75 1
 candidates,” 29th Int. Conf. Comput. Appl. Ind. Eng. CAINE 2016, pp. 219–226, 2016.
 B. J. Chellia, K. Srivastava, J. Panja, and R. Paul, “Sentiment analysis of twitter for election
S-76 0 prediction,” Int. J. Eng. Adv. Technol., vol. 9, no. 1, pp. 6187–6192, 2019, doi: 10.35940/
 ijeat.A1767.109119.
 F. Nausheen and S. H. Begum, “Sentiment Analysis to Predict Election Results Using Python,” 2018
S-77 14
 2nd Int. Conf. Inven. Syst. Control, no. Icisc, pp. 1259–1262, 2018.
 B. S. Bello, I. Inuwa-Dutse, and R. Heckel, “Social Media Campaign Strategies: Analysis of the 2019
S-78 2 Nigerian Elections,” 2019 6th Int. Conf. Soc. Networks Anal. Manag. Secur. SNAMS 2019, no.
 October, pp. 142–149, 2019, doi: 10.1109/SNAMS.2019.8931869.
10 Complexity

 Table 5: Continued.
Primary # of citation
 References
Study (till Jan 2021)
 B. Heredia, J. D. Prusa, and T. M. Khoshgoftaar, “Social media for polling and predicting United
S-79 16 States election outcome,” Soc. Netw. Anal. Min., vol. 8, no. 1, p. 0, 2018, doi: 10.1007/s13278-018-
 0525-y.
 B. Justino Garcia Praciano, J. P. Carvalho Lustosa Da Costa, J. P. Abreu Maranhao, F. L. Lopes De
 Mendonca, R. T. De Sousa Junior, and J. Barbosa Prettz, “Spatio-Temporal Trend Analysis of the
S-80 5
 Brazilian Elections based on Twitter Data,” in IEEE International Conference on Data Mining
 Workshops, ICDMW, 2019, vol. 2018-Novem, pp. 1355–1360, doi: 10.1109/ICDMW.2018.00192.
 V. K. Jain and S. Kumar, “Towards prediction of election outcomes using social media,” Int. J. Intell.
S-81 10
 Syst. Appl., vol. 9, no. 12, pp. 20–28, 2017, doi: 10.5815/ijisa.2017.12.03.
 M. Skoric, N. Poor, P. Achananuparp, E. P. Lim, and J. Jiang, “Tweets and votes: A study of the 2011
S-82 177 Singapore General Election,” Proc. Annu. Hawaii Int. Conf. Syst. Sci., pp. 2583–2591, 2012, doi:
 10.1109/HICSS.2012.607.
 J. M. Soler, F. Cuartero, and M. Roblizo, “Twitter as a tool for predicting elections results,” Proc. 2012
S-83 56 IEEE/ACM Int. Conf. Adv. Soc. Networks Anal. Mining, ASONAM 2012, pp. 1194–1200, 2012, doi:
 10.1109/ASONAM.2012.206.
 F. J. J. Joseph, “Twitter Based Outcome Predictions of 2019 Indian General Elections Using Decision
S-84 3 Tree,” Proc. 2019 4th Int. Conf. Inf. Technol. Encompassing Intell. Technol. Innov. Towar. New Era
 Hum. Life, InCIT 2019, pp. 50–53, 2019, doi: 10.1109/INCIT.2019.8911975.
 R. M. Filho, J. M. Almeida, and G. L. Pappa, “Twitter population sample bias and its impact on
S-85 27 predictive outcomes: A case study on elections,” Proc. 2015 IEEE/ACM Int. Conf. Adv. Soc. Networks
 Anal. Mining, ASONAM 2015, pp. 1254–1261, 2015, doi: 10.1145/2808797.2809328.
 D. F. Budiono, A. S. Nugroho, and A. Doewes, “Twitter sentiment analysis of DKI Jakarta’s
 gubernatorial election 2017 with predictive and descriptive approaches,” Proc. - 2017 Int. Conf.
S-86 7
 Comput. Control. Informatics its Appl. Emerg. Trends Comput. Sci. Eng. IC3INA 2017, vol. 2018-
 Janua, pp. 89–94, 2017, doi: 10.1109/IC3INA.2017.8251746.
 N. D. Prasetyo and C. Hauff, “Twitter-based election prediction in the developing world,” in HT
S-87 45 2015 - Proceedings of the 26th ACM Conference on Hypertext and Social Media, 2015, pp. 149–158,
 doi: 10.1145/2700171.2791033.
 S. O’Banion and L. Birnbaum, “Using explicit linguistic expressions of preference in social media to
 predict voting behaviour,” in Proceedings of the 2013 IEEE/ACM International Conference on
S-88 16
 Advances in Social Networks Analysis and Mining, ASONAM 2013, 2013, pp. 207–214, doi: 10.1145/
 2492517.2492538.
 A. Jhawar, V. Munjal, S. Ranjan, and P. Karmakar, “Social Network based Sentiment and Network
S-89 0 Analysis to Predict Elections,” Proc. CONECCT 2020 - 6th IEEE Int. Conf. Electron. Comput.
 Commun. Technol., pp. 0–5, 2020, doi: 10.1109/CONECCT50063.2020.9198574.
 R. Casarin, J. C. Correa, J. E. Camargo, S. Dakduk, E. ter Horst, and G. Molina, “What makes a tweet
S-90 2 be retweeted? A Bayesian trigram analysis of tweet propagation during the 2015 Colombian political
 campaign,” J. Inf. Sci., pp. 1–9, 2019, doi: 10.1177/0165551519886056.
 Z. Xie, G. Liu, J. Wu, L. Wang, and C. Liu, “Wisdom of fusion: Prediction of 2016 Taiwan election
S-91 16
 with heterogeneous big data,” 2016, doi: 10.1109/ICSSSM.2016.7538625.
 A. Khan et al., “Predicting Politician’s Supporters’ Network on Twitter Using Social Network
S-92 0
 Analysis and Semantic Analysis,” Sci. Program., vol. 2020, 2020, doi: 10.1155/2020/9353120.
 Z. Gong, T. Cai, J. C. Thill, S. Hale, and M. Graham, “Measuring relative opinion from location-
S-93 0 based social media: A case study of the 2016 US Presidential election,” PLoS One, vol. 15, no. 5, pp.
 1–27, 2020, doi: 10.1371/journal.pone.0233660.
 P. C. López-López, P. Oñate, and Á. Rocha, “Social media mining, debate and feelings: digital public
S-94 3 opinion’s reaction in five presidential elections in Latin America,” Cluster Comput., vol. 23, no. 3, pp.
 1875–1886, 2020, doi: 10.1007/s10586-020-03072-8.
 M. Z. Ansari, M. B. Aziz, M. O. Siddiqui, H. Mehra, and K. P. Singh, “Analysis of Political Sentiment
S-95 6 Orientations on Twitter,” Procedia Comput. Sci., vol. 167, pp. 1821–1828, 2020, doi: 10.1016/
 j.procs.2020.03.201.
 G. R. Gustisa Wisnu, Ahmadi, A. R. Muttaqi, A. B. Santoso, P. K. Putra, and I. Budi, “Sentiment
S-96 0 Analysis and Topic Modelling of 2018 Central Java Gubernatorial Election using Twitter Data,” pp.
 35–40, 2020, doi: 10.1109/iwbis50925.2020.9255583.
 L. P. Manik et al., “Aspect-Based Sentiment Analysis on Candidate Character Traits in Indonesian
S-97 0
 Presidential Election,” pp. 224–228, 2020, doi: 10.1109/icramet51080.2020.9298595.
 E. Soylu and S. Baday, “Predicting the June 2019 Istanbul Mayoral Election with Twitter,” no. June
S-98 0
 2019, pp. 1–6, 2020, doi: 10.1109/asyu50717.2020.9259800.
Complexity 11

3.5. Data Extraction. Data extraction is the process of modelling and categorized those topics into positive and
extracting relevant information from the primarily selected negative.
papers according to the defined research and demographic It is worth noting that most of the studies applied an SA
questions. Initially, we agreed upon Data Extraction Form approach (SAi + SAj), which makes 89%, followed by a
(DEF) after going through a thorough review. Next, we volume-based approach, concluding, 26% of the studies
started proper extraction from the papers. “Data Extraction (Voli + Volj). Very few studies employed a social network
Form” provides a reliable and precise approach to extract analysis approach. Opinion mining depicts better under-
data in systematic mapping studies [16, 19]. We inspected standings about a political user’s behaviour. A user’s ex-
and thoroughly read the full-text of nearly all papers. pressions in words are more understandable than the
 communication connections; an example is 100 citizens who
 comment negatively on a political leader’s post. It can
4. Results and Discussion positively impact the results of a prediction using a volu-
 metric or SNA approach, but it is certainly against the leader
In this section, we briefly discuss the results of this SMS. A (opposing in context). Thus, many researchers tend to use
summary of the most notable results in each research and the the SA approach.
demographic question is discussed separately. Figure 4(a)
shows the number of studies published in different venues
(Conference or Journal). Figure 4(b) shows the distribution 4.1.1. RQ1(a): What Are the Techniques Used for Election
of studies across the years. It is noteworthy that the topic of Prediction on Twitter? Approaches (RQ1) are further ana-
“Election Prediction on Twitter” is attracting researchers’ lyzed in-depth by answering RQ1(a),(b),(c), such as a su-
attention since the last decade. pervised technique (SVM and NB) is applied in the SA
 approach for classifying tweets into positive, negative, or
 neutral. In this SMS, the techniques are classified into su-
4.1. RQ1: What Are the Approaches Used in Predicting Elec- pervised (S); unsupervised (US); deep learning (DL); lexi-
tions on Twitter? Figure 5 shows the number of studies that con-based approaches (LAs); count (C); library (tool such as
use different approaches for election prediction on Twitter: TextBlob); and the combination of these techniques such as S
sentiment analysis (SA), sentiment analysis (orientation), & US; S, US, & LA; US & LA; S & LA; S & DL; LA, C, & SNA;
volumetric (Vol.), social network analysis (SNA); topic S, & C; S, US, & C.
modelling using LDA (in this study, the algorithm name Figure 7 shows the number of studies reporting these
LDA is used instead of topic modelling in the approaches); techniques. Numerous studies have employed supervised (S)
and a combination of these approaches such as SA & Vol.; learning techniques, 34 studies (Si) making almost 35% of
SA, Vol., & SNA; and SA (orientation), SNA, & LDA. the selected studies. By looking in-depth, we can see that
 In this SMS, we have taken SA and SA (orientation) some studies used other techniques along with it, such as
separately to facilitate researchers’ rapid approach to the S-41, S-51, and S-92. In conclusion, 51 studies used
specific study. SA approach includes a study that used either S-learning in total (Si + Sj), which makes it the highest used
or both polarity detection (positive, negative, and neutral) technique (52%) in this SMS.
and emotion detection (tense, angry, sad, happy, relaxed, Several studies used the LA for sentiment analysis,
exhausted, calm, excited, and nervous). SA (orientation) especially for tweets other than English. 25 studies
studies the political orientation of voters by analyzing their employed LAi. Few papers reported LAj, making it
tweets that show voting behaviour explicitly, such as “I will (LAi + LAj) 39% of selected studies in this SMS. 18% of the
vote for candidate A” and “I will not vote for candidate A.” selected studies used the count (Ci + Cj) techniques. Few
 We defined the following terminologies to be used in the papers employed US techniques in total (USi + USj) 9%.
rest of the paper: Only 5% of the selected studies used deep learning
 (DLi + DLj) techniques. Some studies used another tool/
 i: an approach used alone in a paper
 library for sentiment analysis, such as S-77 used TextBlob
 j: an approach used along with other approaches in a without mentioning any algorithm. Figure 8 shows the
 paper techniques along with the study(s).
 Figure 6 presents the approaches, along with the primary
selected study(s). Figure 5 shows that 64 studies used the
sentiment analysis approach only (SAi), nearly 65% of all the 4.1.2. RQ(b): Which Tools Are Utilized? This section gives an
primary papers used in this study. Only 3 papers used SA overview of the tools, libraries, and dictionaries (TLD) used
(orientation). to assist the election prediction on Twitter. In addition to the
 It is interesting to note that only 9 papers employed the list of TLD, the list of primary studies has been given ex-
volume-based approach only, making it almost 9%. A hybrid clusively in Table 6. NLTK is used the most. Some tools
approach of the “SA and Vol.” has been used by 16% of the provide a graphical user interface (GUI), such as WEKA,
selected studies. 1 study used SNA only, and 3 papers used RapidMiner, and Gephi. Nearly, 13% used such GUI tools.
the combination of SA and SNA approach, which makes Almost 18 types of dictionaries are employed in the primary
almost 5% of the total studies. Only two studies used LDA studies. Only one study reported Hadoop. The rest of the
along with the other approaches. S-17 used LDA for topic details can be seen in Table 6.
12 Complexity

 Type of publication

 23

 75

 Conference
 Journal
 (a)
 Distribution of papers over years
 20 19
 18 17 17
 16
 14
 12 11
 10 9
 8
 8 7
 6 5
 4
 4
 2 1
 0
 2010 2012 2013 2014 2015 2016 2017 2018 2019 2020
 (b)

 Figure 4: (a) Publication venues and (b) distribution of papers over the years.

4.1.3. RQ(c): Which Techniques/Tools Are Employed for Tweet This RQ aims to identify and list the studies that used
Collection? Data can be collected from Twitter either using manual or automatic data labelling. Some studies worked in
API or by crawling. Twitter provides two types of APIs: languages other than English, such as S-48 annotated tweets
REST and Streaming. Few of the selected studies did not in the Bulgarian language. Few studies employed automatic
explicitly report any technique for collecting Twitter data, data labelling techniques such as S-79 uses deep neural
such as S-22, S-28, S31, S-35, and S-95. Some of the studies networks to label the data. Figure 10 shows the list of studies
reported “Twitter API” only. S-57 used a dataset in Data that use manual or automatic political data labelling.
World [66]. Figure 9 shows the number of studies that use
different techniques and tools for collecting tweets. In this 4.3. RQ3: Which Countries Are Reported for Election Pre-
SMS, we used techniques and tools (name) similar to those diction on Twitter? This RQ aims to identify and list the
reported in the primary studies. An example is Tweepy and countries whose elections are analyzed in the primary studies.
twitter4j are Streaming APIs and is taken separately from Figure 11 shows the list of 28 countries and the total number
Twitter Streaming API. of studies that analyzed its elections. It can be seen that 27
 studies analyzed USA elections and 24 studies studied the
 prediction of Indian elections (both country level and re-
4.2. RQ2: Which Studies Reported Manually/Automatically
 gional). Elections of Indonesia, Netherlands, and Spain are
Annotated Data? Annotated (or labelled) corpus assists in
 reported in 7 studies, respectively, followed by Pakistan in 5,
training supervised and semisupervised techniques [67].
 the UK in 4, and the rest can be observed in Figure 11.
Large and unambiguous annotated data can lead to a better
prediction by improving an algorithm’s results. Data can be
annotated either or both manually and automatically [68]. 4.4. RQ4: What Are the Languages of Tweets Used for Pre-
There are few political annotated datasets available. Lan- dicting Elections on Twitter? The objective of this RQ is to
guages other than English lack such datasets. classify and list the tweet languages used in the primary
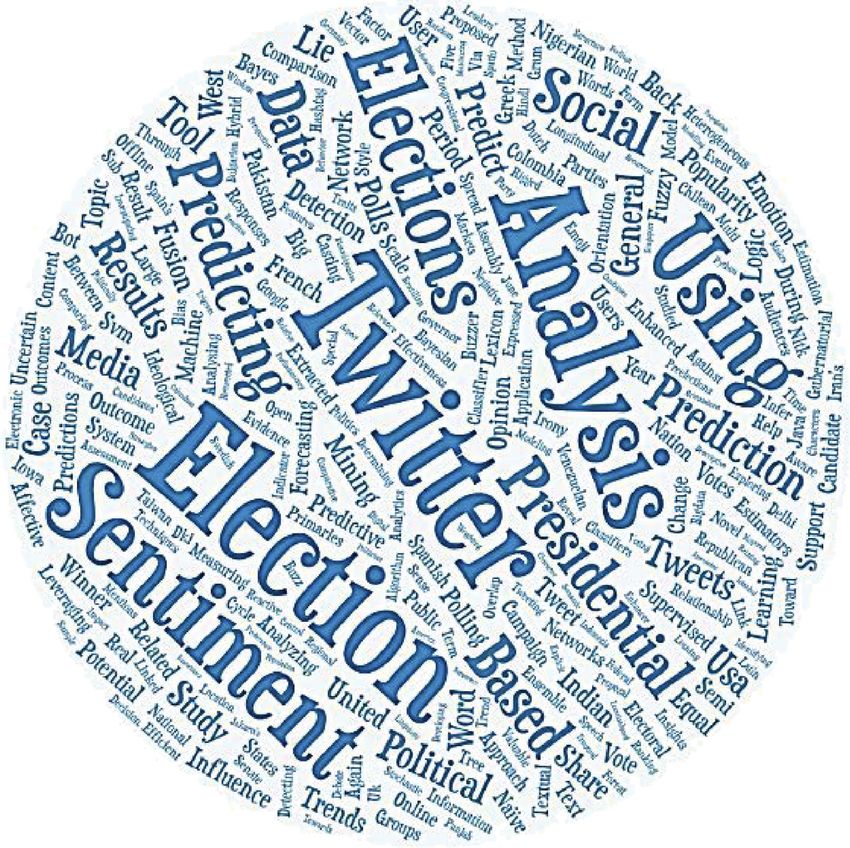
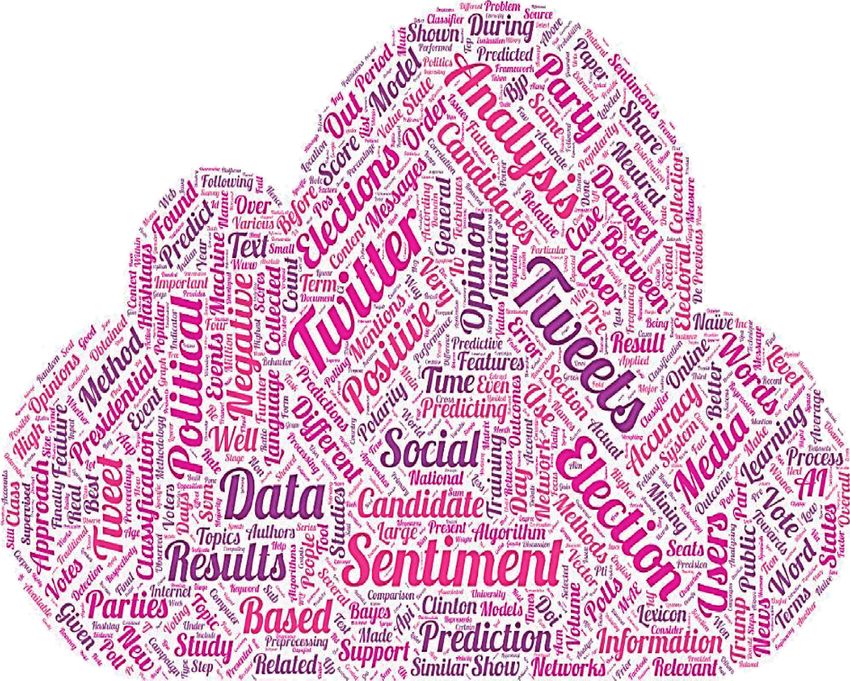
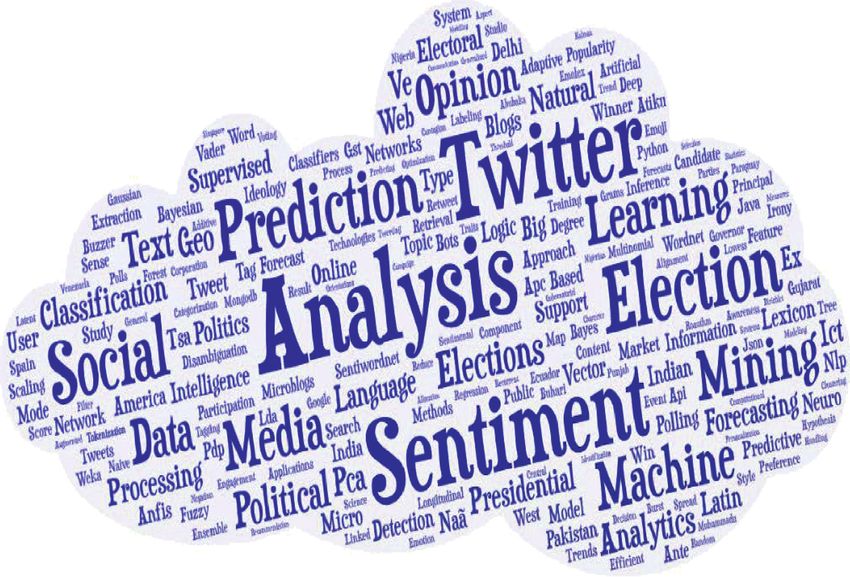
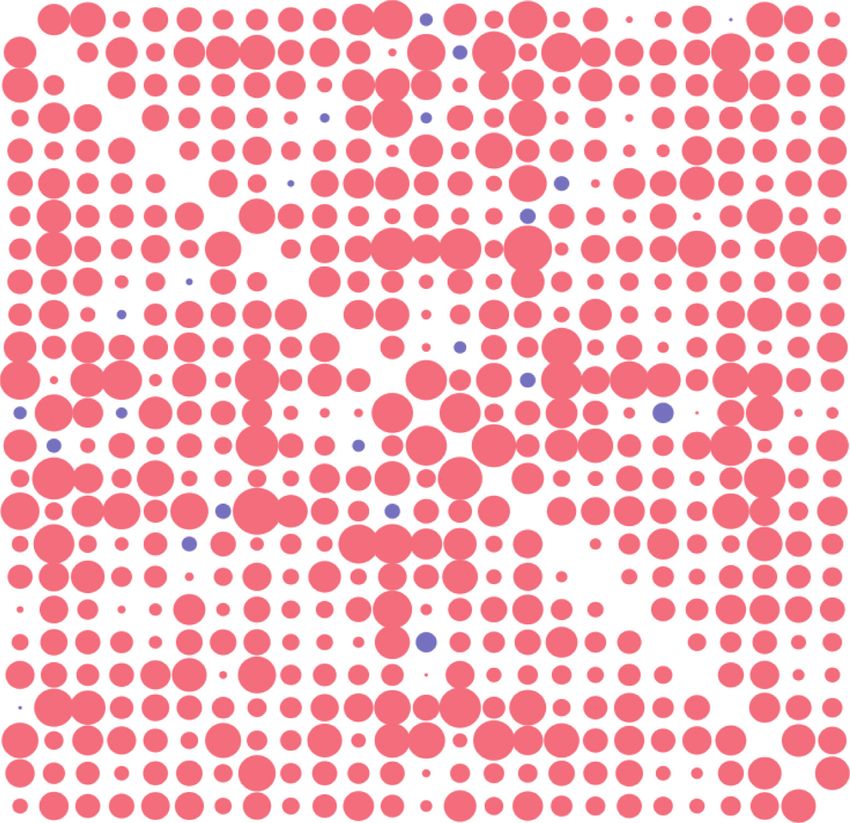
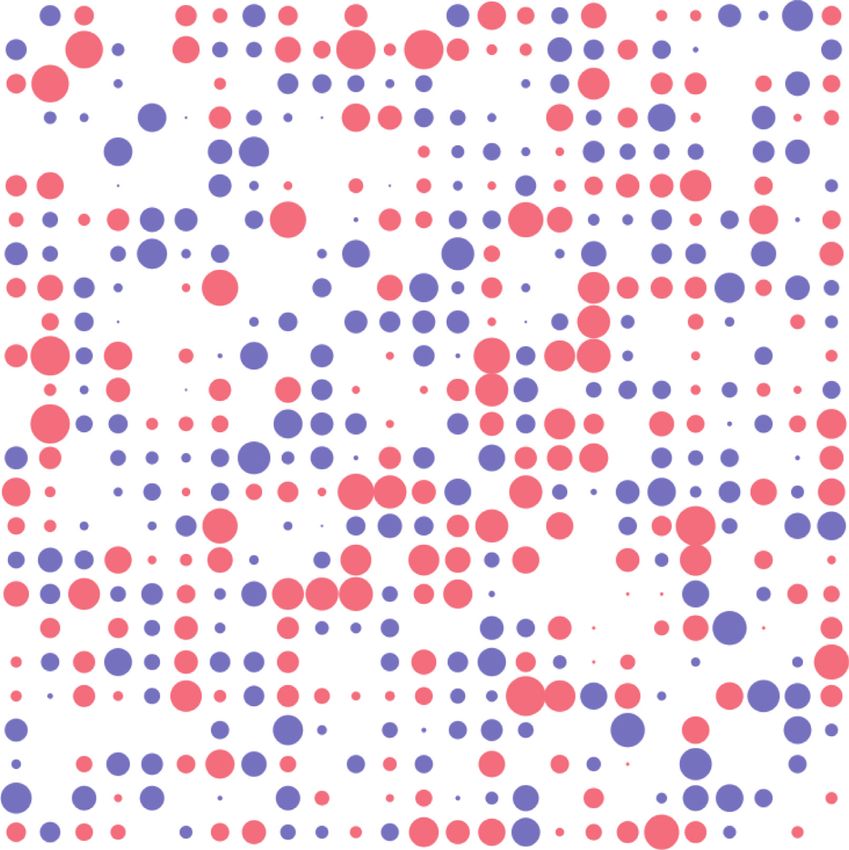
Complexity 13

 Election prediction approaches (correlation) and (2) word cloud. LDA [69] is an example of
 topic modelling. We applied the topic modelling technique
 1 9 on two levels of the primary studies:
 1 1
 1
 1. Abstract level
 3 2. Full-text level
 We further generated word clouds from the selected
 papers on the following levels:
 1. Titles
 15
 2. Author keywords
 3. Abstracts
 64
 4. Full-text
 3 We converted all the papers from PDF to Text. For topic
 modelling, the data are preprocessed to clean the extracted
 data. The steps include converting all text to lower case,
 stemming and lemmatization, and employing stop words
 (English). Furthermore, sections such as “Acknowledge-
 ment” and “References” were excluded to perform topic
 modelling at “full-text level.” For word cloud, all the text at
 SA SA, Vol, & LDA
 different levels (title, keywords, abstract, and full-text) is
 SA & SNA SA, Vol, & SNA tokenized into single words, followed by removing unnec-
 SA & Vol SNA essary words using stop words (English). Next, compute the
 SA (orientation) Vol word frequencies and generate a word cloud for each level.
 Figure 13 shows the 25 topics generated at the abstract
 SA (orientation), SNA, LDA
 level and illustrates the correlations between them. Blue
 Figure 5: Distribution of election prediction approaches. circles represent correlated topics, while the red colour
 shows the anticorrelation or inverse correlation. It shows us
 exciting findings, such as “sentiment analysis polarity” has a
studies. Tweet languages used are Bulgarian, Chinese
 high correlation with “presidential predict win.” Another
(candidates’ names) (CNN), Dutch, English, English
 topic, “social media popularity,” is highly correlated with
translated from Spanish (S2E), English translated from Urdu
 “presidential predict win,” “outcome account expects,” and
(U2E), English translated from German (G2E), English
 “election poll outcome.” The rest of the correlation and
translated from others (O2E), Greek, Hindi, Indonesian,
 inverse correlation of the topics can be explored in Figure 13.
Italian, Persian, Portuguese, Spanish, Swedish, Turkish,
 Figure 14 represents the correlation between 25 topics
Multilanguage (English and Spanish) (MLES), Assume
 generated from the primarily selected papers’ full-text. It is
Multilanguage (English and Roman Urdu) (AMLEU), As-
 interesting to note that nearly all the topics are
sumption (English) (AE), Assumption (Spanish) (AS), and
 anticorrelated.
Not Mentioned (NM).
 Roughly, 45% of the primary studies used English tweets.
Subsequently, 7% of studies analyzed tweets in Indonesian
 4.5.1. Word Cloud. Word cloud represents the words vi-
and 7% in Spanish languages used. Figure 12 presents the list
 sually. The occurrence of the most popular and frequent
of languages and the number of studies that investigated
 words appears in the word cloud. Figure 15(a) shows the
them. Some studies translated tweets from other languages
 word cloud for the titles of the selected papers. The words
to English for further investigation. The reason is that other
 “Election, Elections, Analysis, Twitter, Sentiment, and
languages lack resources (annotated data and dictionaries);
 Presidential” are prominent. It shows us that most studies
S-20, S-41, S-61, and S-76 are examples. S-17 used Chinese
 employed sentiment analysis for predicting elections. Most
candidates’ names for tweet collection and used the volu-
 of the studies analyzed presidential elections.
metric approach for predicting the election. Almost 16% of
 Figure 15(b) shows the word cloud generated from the
studies have not reported any language, volumetric ap-
 author keywords of the selected studies. The words “Election,
proach (most studies).
 Sentiment, Twitter, Prediction, Social, Mining, Media, Machine,
 and Learning” are prominent. These findings show that the
4.5. RQ5: What Are the Most Frequent Topics Discussed? majority of studies implemented sentiment analysis for pre-
The goal of this question in this study is to extract infor- dicting elections on Twitter. Furthermore, it is worth noticing
mation from the selected studies automatically. Such an that many studies employed machine learning techniques.
approach can help the researchers to have an insight into the Figure 16(a) depicts similar words in the world cloud of
topics discussed. We classified the implementation and abstracts as in Figures 15(a) and 15(b). Some high-frequency
representation into two parts: (1) topic modelling words are “Twitter, Election, Social, Media, Sentiment,
You can also read