Finer time resolution in Nordic power markets: A Cost Benefit Analysis - Energinet
←
→
Page content transcription
If your browser does not render page correctly, please read the page content below
Finer time
resolution in
Nordic power
markets: A Cost
Benefit Analysis
Energinet, Fingrid, Statnett and
Svenska kraftnät
30 October 2017

 0
Finer time resolution in Nordic power markets: A Cost Benefit Analysis

 0
Finer time resolution in Nordic power markets: A Cost
Benefit Analysis

Preface

This cost-benefit analysis is part of the Nordic Finer Time Resolution project, which aims
to evaluate the consequences of moving to finer time resolution, and prepare implementa-
tion of finer time resolution, in accordance with the European Electricity Balancing
Guideline (GL EB).

The objective of this analysis is not to assess whether or not finer time resolution should
be implemented, as this is now given by the GL EB. Instead, the objective is to analyse the
consequences of implementing finer time resolution in different ways. Important ele-
ments include what tempo the finer time resolution is implemented and how coordinated
the implementation should be between the Nordic countries.

This study has been led by Copenhagen Economics, and supported by E-Bridge primarily
with respect to cost collection and conceptual clarification of benefits from finer time
resolution. The Nordic TSOs have greatly supported the study by conducting concrete
analyses, and providing input and feedback during the project. The report has been writ-
ten by:

Martin Bo Westh Hansen, Copenhagen Economics
Bjarke Modvig Lumby, Copenhagen Economics
Helge Sigurd Næss-Schmidt, Copenhagen Economics
René Beune, E-Bridge
Dr. Baris Özalay, E-Bridge

 0
Table of contents

 Preface 0

 Executive summary 2

 1 What is finer time resolution? 7

 2 Impacts on the market and
 power system 11

 3 Costs from introducing a finer
 time resolution 38

 4 Net results of analysis 42

 5 Details of common Nordic
 concept 47

 1
Finer time resolution in Nordic power markets:
A Cost Benefit Analysis

Executive summary
When market participants in the Nordic electricity market cause imbalances in the sys-
tem, these imbalances are settled in an imbalance settlement process. This process is na-
tional but similar across the Nordic countries. An important feature of this process is the
duration of the so-called imbalance settlement period (ISP) which in all Nordic countries
is 1 hour. This implies that balance responsible parties (BRPs) are financially responsible
for their net accumulated energy imbalance over the period of 1 hour.

However, imbalances occur continuously and a significant share of the total imbalances
caused to the system are ‘netted out’ and therefore not facing any imbalance fees, even
though they cause instantaneous imbalances.1 The resulting lack of financial incentives
creates a misalignment between BRPs incentives to behave and the actual costs imposed
to the system from this behaviour. Concretely, inflexibility does not face the true cost it
imposes to the system.

Going forward, the need for flexibility in the system is likely to increase. More intermit-
tent generation sources are expected to enter the market, and traditional flexible genera-
tion sources (such as large power plants) may close down. This makes it important that
the market offers the true price for flexibility.

Moreover, the imbalance settlement periods across EU are quite different, ranging from
60 minutes in the Nordics, to 15 minutes in Germany and the Benelux. This lack of har-
monisation reduces, or directly inhibits, market participants’ ability to trade across bor-
ders in the intraday market. This is a major reason for why the EU has called for harmo-
nisation and has approved the Electricity Balancing Guideline to harmonise the imbal-
ance settlement period across the EU at 15 minutes.

Based on the approved Electricity Balancing guideline, all EU countries (as well as some
non-members, such as Norway) should implement an ISP of 15 minutes no later than Q4
2020.2 Some flexibility is allowed for in this framework, specifically allowing for both
earlier implementation and potential extension of the deadline ultimo 2024 at the latest.

An imbalance settlement period of 15 minutes will entail a number of other changes in the
market design, including the ability to trade 15-minute products in the intraday market
and the regulating-power market (market time unit of 15 minutes). Changes to the day-
ahead market is not included in this analysis, since they are not necessary for the imple-
mentation of 15 min ISP and will have to be coordinated across EU.

1
 If a BRP has a negative imbalance in the first half hour and an equally sized positive imbalance in the second half hour, he
 will technically be assessed to have zero imbalances in the hour, and therefore not face financial imbalance settlement.
2
 In the following, we will refer to implementation before 2021 instead of Q4 2020.

 2
Finer time resolution in Nordic power markets:
A Cost Benefit Analysis

Main changes with finer time resolution

Source: Copenhagen Economics

In this analysis, we take for given that the Nordic countries will have to implement 15
minute ISP as stated in the Electricity Balancing guideline. The focus of the analysis is to
investigate the pros and cons of the different implementation choices. Specifically, we
look at 1) implementing finer time resolution earlier than 2021 and 2) implementing later
(2025). Moreover, we assess the implications of the Nordic countries implement simulta-
neously or not, e.g. one or more countries moving ahead or postponing relative to the
others.

Our first main conclusion is that going to 15 minute imbalance settlement period is a step
in the right direction. This change would bring immediate benefits to the Nordic region
through better use of existing interconnectors, increased possibilities for trading flexibil-
ity with neighbouring countries, and improved frequency quality through in particular
reductions in the current large jumps in imbalances that occur around the hour shift. An
important additional benefit is that a 15 minute imbalance settlement period would lead
to a more accurate price for flexibility or lack hereof. This will affect current investment
incentives and shape the future demand and supply mix in becoming more flexible. This
is a highly valuable characteristic in the future electricity system, facing the challenge of
integrating volatile energy sources at a very large scale.

Our second main conclusion is that there seems to be indications that a very early imple-
mentation (2018) and a late implementation (2025) have the lowest net benefits, and
therefore not preferred. None of the other years of implementation seem significantly
better than others. The earlier finer time resolution is implemented the earlier additional
benefits can be reaped. Conversely, earlier implementation will also push forward invest-
ments (e.g. in industrial meter equipment) that could otherwise have been delayed. We
find that there are indeed important benefits to be reaped by going to finer time resolu-
tion, but that the costs also are sizeable. It turns out that the quantifiable benefits and the
costs are in the same ballpark for most of the implementation years, and given the signifi-
cant uncertainty related to the estimates, we do not find strong evidence for favouring a
particular year of implementation.

 3
Finer time resolution in Nordic power markets:
A Cost Benefit Analysis

We do find indications that a simultaneous Nordic implementation seems beneficial. In
particular, market participants would find a system of more than one time resolution
more administratively difficult, and some relatively minor costs would also be associated
with maintaining parallel infrastructure systems including TSO and E-sett settlement
systems. Most market participants we have interviewed state a preference for a single
Nordic system. Some participants do however see a benefit of moving to finer time resolu-
tion as soon as possible in order to reap the benefits herewith. Most market participants
indicate that they would find it very difficult to be ready for implementation already in
2018, and indicate that they would need around 2 years in order to implement the neces-
sary changes with respect to e.g. IT system.

Recognising that several of the benefits of finer time resolution are difficult or impossible
to quantify, we have made quantitative assessment of only some of the benefits (a full list
of all the benefits can be seen in the figure below). These quantifiable benefits we estimate
to be around € 20 million per year. The main socioeconomic benefit is better use of inter-
connectors (estimated to about € 2 million per year for existing interconnectors in 2021),
trade benefits from improved market coupling (about € 6 million per year for existing
interconnectors in 2021) and improved frequency quality (about €1 million per year). On
top of the benefits accrued from the existing interconnectors, additional benefits from
ramping (about € 4 million per year) and market coupling (about € 7 million per year)
will accrue when new interconnectors come online. In addition to these quantifiable bene-
fits, there are several non-quantifiable benefits such as improved access for some re-
sources types in the intraday and regulating-power market, and importantly that a more
precise price will be put on flexibility as mentioned above, which will shape the future
energy system in the right direction.

While the above estimates are uncertain, we believe that they are on the conservative side
especially for the estimates on frequency quality.3

Ensuring operational security in the power system is naturally a key objective for TSOs.
While it is relatively easy to address system imbalances that are relatively predictable and
gradually changing, it is significantly harder to address large, unexpected changed in the
system imbalance. Due to the current time resolution of 60 minutes, there are often very
large ‘jumps’ in the system imbalance around the hour shift. These jumps can be as large
as around 5.000 MW. Reducing the time resolution to 15 minutes can reduce these jumps
by around 20 per cent on average, and even as high as 30 per cent for the largest jumps.
This is likely to improve operational security significantly.

3
 The (technical) reasons are explained in Chapter 2.

 4
Finer time resolution in Nordic power markets:
A Cost Benefit Analysis

Summary of benefits

Note: * Quantifiable benefits are measured in 2021 and include benefits for existing and new interconnect-
 ors. Value of interconnectors could be underestimated due to potential future change of ramping re-
 strictions.
Source: Copenhagen Economics and E-Bridge based on TSO input.

The main costs from implementing finer time resolution are primarily related to upgrades
of IT systems capable of handling the new data management and the increase in the size
of data flow. This is the case for both stakeholders such as Balance Responsible Parties
(BRPs), Distribution System Operators (DSOs), energy suppliers and energy traders, but
also for the IT-infrastructure underpinning the different market platforms such as the
stock exchanges, the common Nordic settlement provider E-sett,4 and internal TSO sys-
tems. In addition, some existing meters would have to be either replaced or reconfigured.5
Not all meters must be changed or reconfigured to 15 minutes resolution to ensure correct
settlement. Smaller consumption units and retail customers can be profiled based on the
measured hourly values. Requiring meters with 15 minutes resolution are relevant for
producers, large consumers, country borders and network points (TSO/DSO). The num-
ber of meters to be replaced or reconfigured at household level depends on the use of
profiling, which can be used until a smart meter would be installed anyway. Requirements

4
 Not including Denmark
5
 The number of meters to be replaced or reconfigured at household level depends on the use of profiling, which can be used
 until a smart meter would be installed anyway. Requirements for meters is a national decision.

 5
Finer time resolution in Nordic power markets:
A Cost Benefit Analysis

for meters is a national decision. We estimate that bringing implementation of finer time
resolution forward by one additional year would cost about €2-6 million for a typical
Nordic country due to the need for earlier investments, and about € 15 million for the
Nordics simultaneously.

 6
Finer time resolution in Nordic power markets:
A Cost Benefit Analysis

Chapter 1
What is finer time resolution?
All across Europe, power markets are in transition. The significant increase in intermit-
tent energy sources is challenging the functioning of the market by adding more volatility
in the system, as well as crowding conventional – typically more flexible – energy sources
out of the system. One of the main challenges to European and Nordic power markets is
therefore that the system remains flexible enough to ensure that production and con-
sumption balance at all times in a situation with more and more volatile production. 6 An
important element in meeting this challenge is that the market participants are facing a
correct price for flexibility to incentivise adequate investments and decisions to make the
system more flexible.

While the day-ahead market in Europe is operating with 60-minute market-time units,
the time units on intraday markets vary from country to country usually following the
imbalance settlement period. The lack of harmonisation reduces or directly inhibits mar-
ket participants’ ability to trade across borders in the intraday market; this is one reason
why the EU has called for harmonisation and approved that countries with an ISP above
15 minutes must reduce the ISP to 15 minutes.7

6
 See e.g. Nordic TSOs (2016), Challenges and opportunities for the Nordic power system
7
 Electricity Balancing Guideline, Article 53

 7
Finer time resolution in Nordic power markets:
A Cost Benefit Analysis

Figure 1 Current imbalance settlement period in Europe

Note: Balancing Service Providers (BSPs) in Italy are required to have 15 minutes imbalance settlement
 period.
Source: ENTSO-E (2016), Cost Benefit Analysis for Imbalance Settlement Period Harmonisation

With the approval of the Guideline on Electricity Balancing, it is expected that all EU
countries, as well as some non-members, such as Norway, implement an imbalance set-
tlement period of 15 minutes no later than 2021.8 Some flexibility is however contained in
the framework, specifically allowing for both earlier and later implementation (although
no later than 2025).

What is ‘finer time resolution’
The key element in finer time resolution is the so-called imbalance settlement period
(ISP), which ensures that market players are incentivised to behave as they have commit-
ted to in the market place. The imbalance settlement period will be reduced from 60
minutes to 15 minutes. Following from that, both the intraday and the regulating-power
market trading platforms will allow for trading in 15 minutes products in addition to, or
as a supplement to, the existing 60-minute products.

Concretely, when we refer to finer time resolution in this report, we are considering the
following changes:

8
 Electricity Balancing Guidelines, Article 53

 8
Finer time resolution in Nordic power markets:
A Cost Benefit Analysis

Figure 2 Main changes with finer time resolution

Source: Copenhagen Economics

Importantly, no changes will have to take place in the day-ahead market from the change
of ISP. Shortening of the market time unit on the day ahead market may conceivably take
place later in time due to other regulatory changes.

The shortening of the imbalance settlement period is the driver of the changes in the in-
traday and regulating-power markets. If the imbalance settlement period is set at 15
minutes, balance responsible parties face a potential imbalance cost of not being in bal-
ance in any given 15 minute interval. Consequently, balance responsible parties would
either have to act more flexibly or use a market instrument to be able to address potential
imbalances.

Timing of implementation
As mentioned, the guideline on Electricity Balancing stipulates that a 15-minute ISP
should be implemented no later than 2021.9 If a country’s TSO or regulatory authority
applies for a postponement this can be granted up until no later than 2025. A country can
also implement earlier than 2021.

In the cost benefit analysis of this study, we explore the impact of the timing of the im-
plementation, including the impact of implementing simultaneously in the Nordics or
not. We have defined the following scenarios, see Figure 3. In Chapter 5, we describe the
implementation choices and design in more detail.

9
 Our interpretation is in the fourth quarter of 2020.

 9
Finer time resolution in Nordic power markets:
A Cost Benefit Analysis

Figure 3 Main scenarios

 Baseline: Common Nordic implementation by 2021

 Frontrunner scenario(s), where one or multiple countries implement before 2021

 Postponement scenarios: One or multiple countries implements in 2025

Source: Copenhagen Economics

Relation to other market developments
Finer time resolution is one among many ongoing changes to the Nordic and European
electricity markets. Many of these changes will be interrelated, and enhance the effect of
the others. Worth mentioning is in particular the European-wide efforts at harmonising
intra day markets (through the XBID market project) and regulating-power markets
(through European standard products for manual balancing reserves). Together with
finer time resolution, these initiatives will improve the possibilities to trade electricity
across borders.

In addition, there is some development in the Nordic countries towards a more accurate
price signal for BRPs based on the cost of balancing. Concretely, the cost of being in
imbalance may increase for balance responsible parties. This will work together with finer
time resolution in incentivising balance responsible parties to achieve balance, and
thereby substantiate several of the benefits identified in the subsequent chapter.

 10
Finer time resolution in Nordic power markets:
A Cost Benefit Analysis

Chapter 2
Impacts on the market and power
system
Implementing finer time resolution is likely to have several different impacts on the Nor-
dic power market and power system. The impacts will primarily be driven by changed
behaviour by balance responsible parties due to different financial incentives, but also by
technical changes in the underlying market function, which can provide new opportuni-
ties for market participants. The changed incentives are primarily related to balance re-
sponsible parties addressing more of their underlying imbalances thereby reducing the
structural system imbalances.10 The new opportunities are primarily related to better pos-
sibilities of offering flexibility to neighbouring markets and better use of interconnectors.
In this chapter, we illustrate the different drivers and effects we expect to see from going
to finer time resolution, and we assess the magnitude and significance of these.

Finer time resolution affects the system through four drivers
The change of the ISP creates four types of incentives – the so-called drivers – that moti-
vate changes in behaviour from the market participants. Each of these four drivers has
some observable effects on the system, which in turn have an impact on the important
criteria of a well-functioning energy system. Figure 4 illustrates these connections, which
we will describe in detail in the following sections.

10
 Finer time resolution is not likely to affect the so-called stochastic imbalances, which occur due to unforeseen events e.g. a
 rapid change in wind speed close to the operational hour.

 11
Finer time resolution in Nordic power markets:
A Cost Benefit Analysis

Figure 4 Impact chain

Source: Copenhagen Economics

2.1 Imbalance settlement more in line with actual imbalances
Balance responsible parties are responsible for ensuring that the transactions they have
engaged in in the wholesale power market are also delivered in the hour of operation. If
not, they will be deemed in imbalance vis-à-vis their market commitment, and the imbal-
ance will be settled by the TSO. The settlement price will either be the price on the RPM
or the Day ahead market depending on the specific circumstances. If a balance responsi-
ble party learns that it is likely to be in imbalance vis-à-vis its day ahead transaction, it
can either trade away this imbalance with other market participants in the intraday mar-
ket, or carry through the imbalance for the TSO to handle it in the regulating-power mar-
ket and face imbalance settlement.

The current imbalance settlement period of 60 minutes leads to two related and undesir-
able consequences compared to a finer imbalance settlement period.
 1. Imbalances that net out over the hour are not settled as an imbalance
 2. Large jumps in imbalances occur around hour shifts because of this

If a balance responsible party contributes with both a shortage and an equally large sur-
plus during an hour of operation, this balance responsible party will not face a cost for
any imbalances, because they are netting out over the hour, see Figure 5. This is so even
though the balance responsible party has in fact been in imbalance the entire hour.

 12
Finer time resolution in Nordic power markets:
A Cost Benefit Analysis

Figure 5 Balance responsible parties can net out their imbalanc-
es over an hour

Note: The figure is an illustration
Source: Copenhagen Economics

With finer time resolution a large share of the balance responsible party imbalances that
were netted out over the hour will now be visible and considered an imbalance and there-
fore liable to financial settlement unless traded away in the intraday market. This is illus-
trated in Figure 6 (left panel), where a large share of the total imbalance over the hour is
now also treated as an imbalance for the balance responsible party. This will incentivise
balance responsible parties to consider whether it is optimal to trade away the expected
resulting imbalances in the intraday market or face the imbalance settlement by leaving
the imbalance for the TSOs to address in the regulating-power market. In a situation
where balance responsible parties choose to trade away all their ‘newly settled’ imbalanc-
es in the intraday market,11 the system imbalance faced by the TSO will be reduced, as
illustrated in Figure 6 (right panel).

11
 By newly settled imbalances we mean the imbalances that were previously ‘netted out’ over the hour, but now will be settled
 in a quarterly system.

 13
Finer time resolution in Nordic power markets:
A Cost Benefit Analysis

Figure 6 Market players face settlement on more imbalances

Note: The figure is an illustration.
 The left figure assume that the balance responsible party is not trading away their ‘new’ market im-
 balances
 The right figure assumes that the balance responsible party have traded away their ‘new’ market im-
 balances thereby reducing system imbalances.
 DAM refers to Day-Ahead Market
Source: Copenhagen Economics and E-bridge.

Imbalances in the Nordic power system change continuously over the hour. At the hour
shift, however, the imbalance can change significantly, or “jump”, from one minute to the
next. The jumps can vary significantly during the day; see Figure 7, which illustrates the
average Nordic imbalances in 2016. In most days, the average “jump” in imbalance varies
between 200-2000 MW as shown in the columns in Figure 7. The highest change in im-
balances is shown as the dots in Figure 7, the highest reached in 2016 almost 5.000 MW.

 14
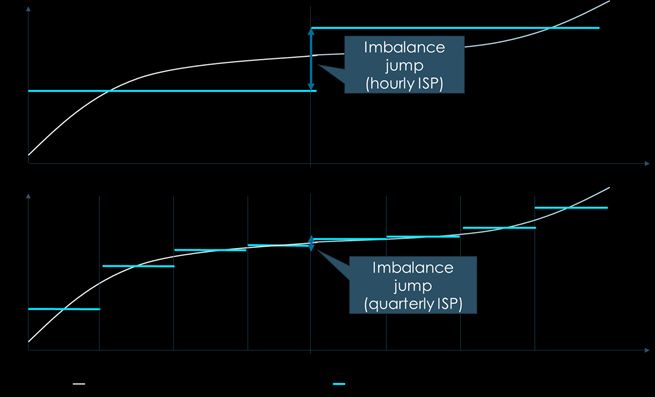
Finer time resolution in Nordic power markets:
A Cost Benefit Analysis

Figure 7 Change in imbalance during hour shifts
 MW
 6.000

 5.000

 4.000

 3.000

 2.000

 1.000

 0
 0 1 2 3 4 5 6 7 8 9 10 11 12 13 14 15 16 17 18 19 20 21 22 23
 Hour of day
 Median Max

Note: Illustration based on average imbalances in 2016 for the entire Nordic system. Max measures the
 highest change in imbalances for each hour. The Median measures the middle observation in a ranked
 set of all imbalances in 2016.
Source: Copenhagen Economics based on TSO input

The nature of the power system is such that constant or smooth imbalances are not neces-
sarily problematic, as TSOs relatively easily can address this by activating balancing re-
sources. Conversely, large and sudden changes in system imbalances are much more like-
ly to pose problems, as the needed actions by the TSOs to balance the system increases
significantly.

This behaviour can to a large extent be attributed to the hourly resolution of the market
time units in the intraday and day-ahead markets, and with finer time resolution the large
imbalance jumps around the hour shift are likely to be reduced. The balance responsible
parties responsible for the large variations over the hour shift are now incentivised to
trade away their imbalances before the hour of operation on a quarterly basis. If the bal-
ance responsible parties trade away the “newly settled” imbalances they are facing with a
15 min ISP, the scheduled production/demand of the last quarter of one hour will be clos-
er to the scheduled production/demand for the first quarter of the next hour. This will in
most cases mean the jump in imbalances between the hour shifts are reduced.

 15
Finer time resolution in Nordic power markets:
A Cost Benefit Analysis

Figure 8 Imbalance jumps will be reduced

Note: Illustrative figure.
Source: Copenhagen Economics

Concretely we estimate that the average imbalance jump around hour shifts can be re-
duced by about 20 percent in each country (see Figure 9). The reductions differ signifi-
cantly by geographical area. Finland and Norway experience the largest change in imbal-
ances around the hour shifts with reductions of 22-23 %, whereas Sweden experiences a
reduction of 18 % and Denmark 14 %.

 16
Finer time resolution in Nordic power markets:
A Cost Benefit Analysis

Figure 9 Reduction in change in imbalance during hour shift

Note: Imbalances measured as the absolute change in imbalance from the last minute of one hour to the
 first minute of the next hour.
Source: Copenhagen Economics based on TSO input.

Importantly, finer time resolution is able to reduce the size of the imbalance jumps in the
situations where the jumps are the highest. The 25 % of the hours in the Nordics with the
biggest imbalance jumps, would experience a reduction in the change in imbalance of
32%, see Figure 10. The 25% of the hours with the smallest jump in imbalance will experi-
ence a reduction in the change in imbalance of 23%. This implies that finer time resolu-
tion will reduce imbalances at the instances when they are the most critical to operational
security, namely when the jumps are the highest. This effect is not something we are able
to include in our quantifications of the benefits in the remaining analysis, and therefore a
source of underestimation of the benefits.

 17
Finer time resolution in Nordic power markets:
A Cost Benefit Analysis

Figure 10 Reduction in Nordic imbalance change between hours

Note: Figures calculated on the assumption of 50% of the new imbalances being moved to the intraday
 market.
Source: Copenhagen Economics based on TSO input.

In addition to a reduction in imbalances at the hour shifts, there will also be a reduction
in average imbalance between consecutive 15 minute time periods during an hour of op-
eration, as shown in Figure 11. While Figure 9 shows the change in imbalances from the
59th minute of the hour to the 1st minute of the next hour, Figure 11 shows the change in
average quarterly imbalance between each quarter of the hour.

 18
Finer time resolution in Nordic power markets:
A Cost Benefit Analysis

Figure 11 Average change in imbalance during all four quarters

Note: Imbalances measured as the absolute change in the average quarterly imbalance between each quar-
 ter in an hour.
Source: Copenhagen Economics based on TSO input.

Whether or not the balance responsible parties will undertake effort to address imbalanc-
es, and thereby affect the jumps around the hour shift, will depend on what will be the
cheapest for them.12 For example, trading away imbalances in the intraday market or in-
vesting in equipment to increase flexibility of a generator or demand side resources will
only happen if the balance responsible parties deem this optimal compared to carrying
through the imbalance and facing imbalance settlement.

In the four figures above, we assume that 50% of the newly settled imbalances 13 will be
handled by the balance responsible parties e.g. traded away in the intraday market. In the
analysis below, we will relax this assumption and assume instead that at least 25 per cent
of the newly settled imbalances will be handled by the market, potentially increasing to
100 per cent. The actual behaviour of BRPs and the volume they choose to trade will be
highly influenced by the cost of being in imbalance, which is likely to increase in the fu-
ture. Moreover, the percentage could be high, as finer time resolution address the so-
called structural imbalances (as opposed to stochastic imbalances), which are easier to
predict and therefore address.

In addition to lowering the imbalance jumps, finer time resolution will also reduce the
average system imbalance as explained in Figure 6. The average net system imbalances in
the Nordic will be reduced by between 2-6 per cent (see Figure 12) depending on the ex-
tent of imbalances addressed by market parties. The lower impact on the net imbalance

12
 In some countries, it is a legal obligation for BRPs to plan themselves into balances.
13
 By newly settled imbalances we mean the imbalances that were previously ‘netted out’ over the hour, but now will be settled
 in a quarterly system.

 19
Finer time resolution in Nordic power markets:
A Cost Benefit Analysis

compared to the change in imbalances is because in most hours the Nordic system (net
for all areas) has either a positive or negative imbalance in all or most minutes of the
hour. In these cases 15 minute ISP has no impact on the hourly net imbalance, but will
still make the imbalance less volatile as shown in Figure 11.

Figure 12 Reduction in average hourly net system imbalance in
the Nordic countries
 25% to ID 50% to ID 75% to ID 100% to ID

 -1,5%

 -3,1%

 -4,6%

 -6,1%

Note: Imbalances measured as hourly net imbalances. “25% to ID” is a scenario, where 25% of the new
 imbalances from introducing 15 min ISP is traded away on the intraday market. “50% to ID” is a sce-
 nario, where 50% of the new imbalances from introducing 15 min ISP is traded away on the intraday
 market and so on.
Source: Copenhagen Economics based on TSO input.

We have identified two effects, which the above drivers are likely to give rise to, which is
separately described below.
 1. Improved frequency quality
 2. More intraday trading could activate cheaper assets compared to trading in the
 regulating-power market

Improved frequency quality
Frequency quality is a measure of operational security in the power system. Typically, it is
measured as the number of minutes that the system frequency is outside the normal band
of operation, which is +/-100mHz around the required 50 Hz. Deviations from 50 Hz
reflects that demand and supply are deviating from each other.

A slight deviation away from 50 Hz is not a problem as such, but makes the system more
vulnerable to a trip in a large power plant or an interconnector. The further away from 50
Hz, the larger is the likelihood that such a trip will cause a brownout or a blackout.

In the last decade or so, frequency quality in the Nordic power system has deteriorated
significantly. Since 2002, the number of minutes outside the normal band has increased
by 200 per cent to about 14,000 minutes in a year (see Figure 13). Going forward, pres-

 20
Finer time resolution in Nordic power markets:
A Cost Benefit Analysis

sure on frequency quality is predicted to increase further due to the increased amount of
intermittent energy sources and reduced controllable capacity and inertia. 14

Figure 13 Minutes outside the normal frequency band (MoNB)
have increased significantly since early 2000
 Minutes
 16.000
 14.000
 12.000
 10.000
 8.000
 6.000
 4.000
 2.000
 0

Source: Copenhagen Economics based on TSO input.

There is a positive relation between the imbalance between market time units and the
minutes outside of normal frequency band. Figure 14 illustrates that a larger change in
the imbalance from one time period to the next increase the observed number of minutes
outside of normal frequency band. When the magnitude of the imbalance jumps increase
by say 100 MW, the amount of minutes outside the normal band increases by 0.2
minutes.

14
 See e.g. Fingrid (2016), Electricity market needs fixing – What can we do?

 21
Finer time resolution in Nordic power markets:
A Cost Benefit Analysis

Figure 14 Larger MoNB from increased change in imbalance be-
tween time periods
 MoNB (number of
 Increased change in MoNB (min)
 occurences)
 1500 imbalance of 100 MW = 1
 0,2 min additional MoNB
 1250
 0,75
 1000

 750 0,5

 500
 0,25
 250

 0 0
 0 100 200 300 400 500 600 700

 Change in average imbalance from one 15 min period to the next (MW)
 Number of observation Average MoNB Correlation

Note: MoNB per change in avg. imbalance between 15 minutes time periods. Note, that while the fitted
 relationship becomes less clear when the change in imbalances is high (the right part of the figure),
 the bulk of the data points (the left-axis) is for relatively small changes in imbalances, suggesting that
 the estimated fit of the regression line is well founded.
Source: Copenhagen Economics based on TSO input.

Based on the relationship illustrated in Figure 14, we have estimated the improvement in
minutes outside of normal frequency band when reducing imbalances due to finer time
resolution. Introducing 15 minutes imbalance settlement period will reduce the amount of
minutes outside of normal frequency band (MoNB) between 2.000-6.000 minutes annu-
ally. This is heavily dependent on the amount of imbalances moved to the intraday mar-
ket, see Figure 15.

Finer time resolution cannot fully eliminate minutes outside the normal band since it only
addresses structural imbalances and not stochastic imbalances. Structural imbalances
occur as a result of the market design and underlying system. They therefore follow a
repetitive pattern and are rather predictable. Stochastic imbalances occur due to unfore-
seen events or changes e.g. sudden change in wind speed. These imbalances are an inher-
ent part of the power system and are not expected to change as a consequence of finer
time resolution.

 22
Finer time resolution in Nordic power markets:
A Cost Benefit Analysis

Figure 15 MoNB per year from introducing 15 minutes imbal-
ance settlement period

Note: Percentages refer to the share of the market players “new” imbalances moved to the intraday market
 players’ trade.
Source: Copenhagen Economics based on TSO input.

A reduction in minutes outside of normal frequency band can be translated into a reduced
risk of a brown-out (here defined as controlled load shedding due to under-frequency).
Based on modelling work done in the ENTSO-E project on frequency quality we have
estimates on the risk of a load-shedding event given the number of minutes outside the
normal band, and a number of characteristics of the power system, such as inertia and
frequency containment reserves (FCR). Going from 10.000 MoNB per year to 5.000
MoNB with a FCR D reserve of 1250 MW will halve the risk of a brown-out from once
every 11 years to once every 22 years.15,16 Each brown-out is associated with some costs
from load shedding which can be thought of as e.g. loss of production in industries. The
socioeconomic loss in case of a brown-out event is assumed to be 21-38 million euro.17 By
assuming a linear relationship, we can then estimate the value of reducing MoNB by one
minute to be 200-380 euro.18 Given the associated reduction in minutes outside the nor-
mal band, we estimate that there will be benefits of around 0.6-1.8 million EUR per year
in the Nordics (see Figure 16).

15
 Assuming a median inertia case of 186 GWs and 1250 MW of FCR D.
16
 ENTSOE (2016), Interim report ’Frequency Quality, phase 2 project’
17
 Assuming the event last for three hours, covers 1000 MW and the cost for each kWh is 7-13 euro. Sources: ENTSOE (2016),
 Interim report ’Frequency Quality, phase 2 project’
18
 Example with socioeconomic loss in case of brown-out is 21 mill. EUR: (21 mill.€ / 11 years – 21 mill.€ / 23 years)/(10.000
 MoNB – 5.000 MoNB)

 23
Finer time resolution in Nordic power markets:
A Cost Benefit Analysis

Figure 16 Socioeconomic benefit of improved frequency quality
from introducing finer time resolution
 1,8 m. EUR
 1,5 m. EUR

 1,0 m. EUR

 0,6 m. EUR

 25% to ID 50% to ID 75% to ID 100% to ID

Note: Percentages refer to the share of the market players “new” imbalances moved to the intraday market
 players’ trade.
Source: Copenhagen Economics based on TSO input and ENTSOE (2016), Interim report ’Frequency Quality,
 phase 2 project’.

Assessing the value of avoiding a brown-out is not an easy task due to the vast uncertainty
in estimating the value of un-served energy (or lost load). In addition to the changed in-
put parameters such as size of FCR-D, the socioeconomic loss stemming from an UFLS
event is extremely uncertain, as it is very rare and varies significantly from event to event.
Changing the assumptions slightly provide bounds in the range 0.6-2.3 mill. EUR per
year with the scenario, where 50% of the new imbalances are traded away on the intraday
market, see Table 1.

Table 1 Uncertainty in benefits from avoided UFLS
 50 % to ID 100 % to ID
 0.6-2.3 mill. EUR/year 1.0-3.8 mill. EUR/year

Note: Low estimate refer to a scenario with 10.000 MoNB as baseline and 1350 FCR D. High estimate refer
 to a scenario with 15.000 MoNB as baseline and 1150 FCR D.
Source: Copenhagen Economics based on TSO input and ENTSOE (2016), Interim report ’Frequency Quality,
 phase 2 project’

The above assessment is based on estimating the value from preventing a brownout. This
assessment crucially depends on to what extent reduced imbalances reduce the risk of a
brownout, which ultimately depends on the current power-system characteristics, such as
reserve-capacity and inertia available in the system. Consequently, the value of finer time
resolution on frequency quality can also be estimated by the avoided need for reserve
capacity, see Figure 17. While the existing reserves currently are dimensioned according
to the N-1 criterion, and therefore might not be downsized due to finer time resolution,
this dimensioning may not be sufficient, as system imbalances are likely to increase fol-
lowing deployment of more volatile generation. Consequently, our estimate above – un-
certainties aside – is likely to underestimate the value from improved frequency quality in
 24
Finer time resolution in Nordic power markets:
A Cost Benefit Analysis

a situation when imbalances will increase and inertia is likely to be reduced. This is in
part because the risk of a brownout increases for each additional minute outside the nor-
mal frequency band, and in part, because improved frequency quality may help alleviate
the pressure on acquiring more reserves.

Another reason for why our estimates are likely to be on the conservative side, is that we
are assuming that avoiding one minute outside the normal frequency band has the same
value for operational security. In reality, the risk to operational security increases the
further away the frequency is from the normal band. As we depict in Figure 10, finer time
resolution will have a larger dampening effect on imbalances when the jumps around the
hour shift are the highest. This means that finer time resolution will reduce the minutes
where frequency is far from the normal band more than the minutes closer to the normal
band.

Figure 17 Reduced imbalances may reduce need for reserves

Note: The figure is an illustration. MTU abbreviation for market time unit.
Source: Copenhagen Economics

In addition to the direct losses incurred from a load-shedding event, there is also likely to
be less tangible effects such as lost reputation for the TSO and national security of supply
more broadly, which could impact the attractiveness of a country for electricity intensive
industry and may potentially lead to increased need for local back-up generation.
 25
Finer time resolution in Nordic power markets: A Cost Benefit Analysis More intraday trading may potentially activate cheaper assets compared to trading in the regulating-power market There are different reasons for why the market players may be more efficient in trading away imbalances in the intraday market than the TSOs are in the regulating-power mar- ket. Based on stakeholder interviews, we have identified the main reasons why the intra- day market might be cheaper than the regulating-power market: Due to long activation time, there may be cheaper assets available in the intraday than in the regulating-power market Uncertainty about activation of regulating-power market bids. Cheaper assets may be available in the intraday market when power plants with long ramping time are excluded from participation, or only offer limited capacity, in the regu- lating-power market because the ramping time of these assets exceeds the response time for delivery. When market players trade away more imbalances in the intraday market, volumes will increase and allow slow-ramping assets to participate. This makes it possible for lower cost assets to be activated. The magnitude of this benefit depends on the extent and efficiency of TSO-regulating actions before the regulating-power market. TSOs19 also engage in so-called smoothing and shifting regulating activities before the RPM, where activation choices can also reflect ramping time and costs. Figure 18: Time to delivery affects the available supply of power Size of supply Only quick ramping assets can bid into the market on a short notice. The total supply is smaller the closer to delivery. Time to T-24 T-5 Delivery delivery Note: The figure is an illustration. Source: Copenhagen Economics Some stakeholders indicate that they have greater uncertainty about delivery in the regu- lating-power market compared to the intraday market. In the intraday market the market players find a buyer or seller and agree about the delivery. In the regulating-power market however, the market players do not know whether their bids will be activated and for how long. This means market players face increased risk of not being able to utilise their flexi- ble supply and demand fully. This is included in their pricing as a risk premium. 19 Primarily Statnett. 26
Finer time resolution in Nordic power markets:
A Cost Benefit Analysis

Other stakeholders indicate that if they have had bids accepted in either the day-ahead
market or intraday market, they are not excluded from participating in the regulating-
power market but can still offer flexibility. Producers can offer down-regulation and con-
sumers up-regulation. This decreases the risk of trading on the intraday market compared
to the regulating-power market.

Activation of cheaper assets or with less risk is a socioeconomic benefit as the same
amount of power can be delivered at a lower cost.

2.2 Coupling to continental and UK markets
In order to establish cross-border trade, the traded products must be the same. Currently,
products in intraday markets and regulating-power markets differ from country to coun-
try. Specifically, the time unit of the trade products is 60 minutes in the Nordic countries,
while in the most important neighbouring countries it is 15 minutes intraday, as illustrat-
ed in Table 2. This implies that existing demand for flexibility in neighbouring markets at
a 15 minute level cannot be met by Nordic flexibility, and a potential for welfare improv-
ing transactions are foregone.

Table 2 Imbalance settlement period in neighbouring countries
 Current imbalance settlement
 Country Connection to Nordic countries
 period
 Germany 15 min Denmark, Sweden, Norway (2020)

 Netherlands 15 min Norway, Denmark (2019)

 Great Britain 30 min Norway (2021), Denmark (2022)

 Poland 60 min Sweden

 Estonia 60 min Finland

 Lithuania 60 min Sweden

Source: Copenhagen Economics

Enhanced integration of both intraday markets and balancing markets are likely expected
in line with the European guidelines.20 The goal is that there will be one integrated Euro-
pean intraday supply and demand curve, and one integrated European supply curve for
each European standard balancing product. Conceptually, this can be seen as an exten-
sion of the current Nordic practices to the rest of Europe.

The overall effect of this market integration will be that the demand and supply base for
flexibility will extend from the Nordic to the European level. This may attract flexibility
supply in the Nordic and European markets, which is out of merit in the isolated markets
today. Figure 19 shows that increased supply base allows for more efficient utilisation of
flexible generation assets in the coupled markets. In some hours/quarters, there will be
lower prices in the Nordic region, while in other hours/quarters prices might go up. In the
hours with lower prices, consumers will benefit, whereas in the hours with higher prices,

20
 Capacity Allocation and Congestion Management Guideline and Electricity Balancing Guideline

 27
Finer time resolution in Nordic power markets:
A Cost Benefit Analysis

producers will benefit. While the changes in prices might not be a net benefit for both
consumers and the producers in the Nordic region, in aggregate the total welfare surplus
is positive.

Figure 19 Market coupling have positive effect on welfare

Note: The figure is an illustration. ATC = Available Transmission Capacity.
Source: Copenhagen Economics and E-bridge.

In order to assess the value to the Nordics from increased coupling with neighbouring
markets, we have evaluated both the likely variation between the markets at a 15 minutes
level and the expected interconnector capacity available for the intraday markets. We do
not consider increase value from increase day-ahead trading as it will continue working
on 60 minute market time resolution.

Variation in demand and supply is different in quarterly intervals than over the full hour.
In practice, there will be hours in which there will be balance across the entire hour, but
where there can be excess demand in the first quarter but excess supply in the last quar-
ter.

In order to calculate the effects of market coupling, we have used the German quarterly
intraday prices and normalised them to the German day-ahead prices to make them com-
parable with the Nordic Day ahead prices. By using historical data on capacity available
on interconnectors, we can calculate the benefits from hourly and quarterly markets. The
difference between the two is the additional benefit from implementing a finer time reso-
lution.

For the existing interconnectors not connected to the German market, we have assumed
the same pattern of German ID prices in other neighbouring countries. This is assumed as
a good proxy for most of the markets, although some markets might experience less vola-
tile distribution of 15 minutes intraday prices than Germany. In these cases, we will over-
estimate the benefits.

Similar estimates have been made for new interconnectors. The future interconnectors
are assumed to have the same benefit per MW on import and export as the four existing

 28
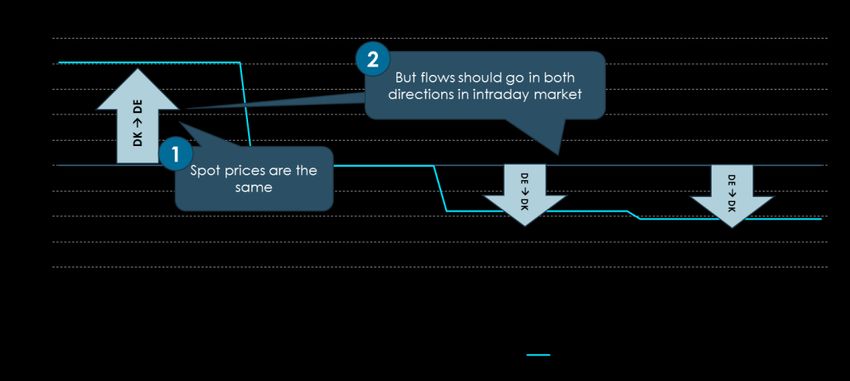
Finer time resolution in Nordic power markets:
A Cost Benefit Analysis

interconnectors to Germany. The benefit per MW is multiplied on the capacity of each
interconnector.

An overview of the existing and future interconnectors is show in Table 3.

Table 3 Existing and future interconnectors in the Nordics
 Existing interconnectors Capacity

 DK1-DK2 600 MW

 DK1-NO2 1600 MW

 DK1-SE3 700 MW

 DK1-DE 1500 MW

 DK2-DE 600 MW

 FI-EE 1000 MW

 NO2-NL 700 MW

 SE4-DE 700 MW

 SE4-LT 700 MW

 SE4-PL 600 MW

 Future interconnectors Capacity

 DK2-DE (2019) – Kriegers Flak 400 MW

 DK1-NL (2019) – COBRA 700 MW

 NO2-DE (2020) – Nord Link 1400 MW

 NO2-GB (2021) – North Sea Link 1400 MW

 DK1-GB (2022) – Viking Link 1400 MW

Note: The number after the interconnector indicated the expected year of operation
Source: Copenhagen Economics based on TSO input.

Even though we see large price variation between markets at 15 minutes time units, there
is only limited interconnector capacity available for the intraday market. Concretely, the
intraday market can only utilise the residual amount of capacity that is not already allo-
cated via the day-ahead market. In addition, the full interconnector capacity can be used
to trade in the opposite direction of the flow determined by the day-ahead market, see
Figure 20. This is a conservative approach, which is likely to underestimate the benefits.
This is due to no inclusion of interdependency between each quarter of the hour as well as
not accounting for trade in one quarter will free up more capacity in the other direction
for the rest of the hour. If the day-ahead market determines full flow from Norway to
Germany, there is no room for more flow from Norway to Germany via the intraday mar-
ket, but there will be full capacity to trade flows from Germany to Norway.

 29
Finer time resolution in Nordic power markets:
A Cost Benefit Analysis

Figure 20 Optimal flows can change during an hour

Source: Copenhagen Economics

We find that in total, market coupling benefits amounts to 6.3 million EUR per year for
the existing interconnectors in the central estimate, see Figure 21. The central estimate is
calculated as the average benefit for the years 2015 and 2016. The low and high estimates
show the lower and higher value for both years.

Figure 21 Benefits from market coupling on existing intercon-
nectors
 6,5 m. €
 6,3 m. €
 6,1 m. €

 Low

 Central

 High
 1,9 m. €
 1,7 m. € 1,5 m. €
 1,4 m. €
 1,1 m. € 1,0 m. € 1,1 m. € 1,0 m. €
 0,7 m. € 0,8 m. € 0,8 m. €
 0,2 m. €

 Total FI-EE DK1-DE SE4-DE DK2-DE SE4-LT NO2-NL

Note: Benefits measured as 50% of the aggregate benefits on each interconnector. The benefits can only be
 reaped if the neighbouring country also has 15 min market time units. Central estimate is average
 benefit calculated on data for the years 2015-2016. Low is the year with the lowest benefit, high is
 the year with the highest benefit (differ from interconnector to interconnector).
Source: Copenhagen Economics based on TSO input.

 30
Finer time resolution in Nordic power markets:
A Cost Benefit Analysis

Our estimates for the new interconnectors that will come into operation suggest that there
will be an additional benefit of about 7.1 mill. EUR per year from additional market cou-
pling benefits in the central estimate, see Figure 22.

Figure 22 Benefits from market coupling on future intercon-
nectors

 7,9 m. €
 7,1 m. €
 6,3 m. €

 Low

 Central

 High
 2,1 m. € 2,1 m. € 2,1 m. €
 1,7 m. € 1,7 m. € 1,7 m. €
 0,8 m. €1,0 m. €
 0,5 m. €0,6 m. €

 Total NO2-GB DK1-GB NO2-DE DK1-NL DK2-DE (400
 MW)

Note: Benefits measured as 50% of the aggregate benefits on each interconnector. The benefits can only be
 reaped if the neighbouring country also has 15 min market time units. Central estimate is average
 benefit calculated on data for the years 2015-2016. Low is the year with the lowest benefit, high is
 the year with the highest benefit (differ from interconnector to interconnector).
Source: Copenhagen Economics based on TSO input.

2.3 Improved utilisation of interconnectors
The interconnectors connecting the Nordic region to the Continent currently have a limit
to how much the flow of power can change during an hour of operation. The limitation
restricts the speed of the ramping and the duration of the ramping. The ramping speed
restriction is a physical restriction that relates to how much of a change the power system
can handle in a short period. This restriction is currently 30 MW/min. In practice, inter-
connectors are ramped for a maximum period of 20 min.21 Consequently, the total
amount of possible ramping in an hour of operation is currently 600 MW/h. This re-
striction applies to both the day-ahead and intraday markets.

With finer time resolution, it is envisaged that this ramping restriction can be relaxed.
The main reason is that additional trades will be performed in the quarter shift instead of
at the hour shift. If interconnectors could be ramped 7.5 minutes before and after each
quarter shift, it could effectively be ramped continuously over the full hour equalling
1800MW/h. In the following, we have used an assumption of a ramping rate of 20
MW/min, which amounts to a potential change in power of up to 1200 MW over the full

21
 Specific start and end time of ramping varies among the interconnectors.

 31
Finer time resolution in Nordic power markets:
A Cost Benefit Analysis

hour. This assumption is based on analysis from the ENTSO-E’s currently ongoing “con-
tinuous ramping project”.

By utilising the full hour for ramping on the HVDC interconnectors, there will be hours
where more capacity can be offered to the market. If there is also a price difference be-
tween the regions in these hours, the additional capacity will be utilised, thereby increas-
ing welfare through a more efficient use of assets across price areas, see Figure 23. Conse-
quently, the additional capacity and ramping capability will only be utilised if a trade is
performed. In addition to the increased ramping potential, there could also be an eco-
nomic potential through a more frequent change in direction. This is likely rather limited
though since an efficient flow requires a certain threshold of price difference caused by
HVDC losses.

Figure 23 Increased ramping ability on interconnectors

Note: The figure is an illustration.
Source: Copenhagen Economics and E-bridge

The current ramping limit of 600 MW/h is based on an overall assessment of the opera-
tional security in the Nordic synchronous area, and the potential accumulated imbalances
that rapid changes in interconnector capacity may inflict. Given, among others, the ex-
pected built-up of new interconnectors, it is very likely that the current ramping limit of
600 MW/h may actually be reduced going forward. In the following calculations, we have
assumed an increase in the ramping restriction from 600-1200 MW/h, however we have
also assessed a situation where the baseline ramping restriction is reduced to 400 MW/h.

In order to assess the benefits from reducing ramping restrictions, we evaluate 1) to what
extent reduced ramping limits would actually give rise to higher ramping and 2) if yes;
how large the benefits from this additional trade would be.

Firstly, we find that in 2016 about 7 % per cent of the hours the current ramping re-
striction actually restricted trades that would otherwise have taken place on the existing
interconnectors (a higher number when using 400 MWh/h as baseline). This means that
in these hours, the market would have wanted to trade more, but the interconnector ca-
 32
Finer time resolution in Nordic power markets:
A Cost Benefit Analysis

pacity could not be made available to the market even though it was not fully utilised. In
total in 2016, we estimate that an additional 1.2 TWh would have been traded in the ab-
sence of ramping restrictions.

Secondly, we have identified that in the particular hours where the ramping restriction
was binding, there was an average price difference between the two connected markets of
about 2.5 €/MWh. By increasing the ramping rate from the existing 600MW/h to
1200MW/h, we find that the Nordic countries could achieve benefits from increased
ramping of about 1.8 mill. EUR per year, by utilising the existing HVDC interconnectors
better.22

Figure 24 Benefits from increased ramping on existing inter-
connectors
 3,6 m. €

 1,9 m. € Low
 1,8 m. €
 Central

 High
 1,0 m. €
 0,9 m. €

 0,5 m. €
 0,4 m. €
 0,2 m. € 0,2 m. € 0,2 m. € 0,2 m. € 0,3 m. € 0,1 m. €
 0,1 m. € 0,1 m. € 0,1 m. €
 0,1 m. € 0,0 m. € 0,2 m. € 0,0 m. € 0,0 m. €

 Total DK1-NO2 SE4-LT SE4-DE DK2-DE NL-NO2 DK1-SE3 DK1-DK2 EE-FI

Note: Units are million euros. Benefits measured as 50% of the aggregate benefits on each interconnector,
 except internal Nordic interconnectors, which are measured as 100% of the benefits in each direction.
 The central case is calculated as the additional congestion rent from increasing the ramping rate from
 600 MW/h to 1200 MW/h based on the years 2012-2016. The low case is the additional congestion
 rents for the year 2015 and the high case is the additional congestion rate for the year 2013.
Source: Copenhagen Economics based on TSO input.

In addition, new interconnectors will come online in the years to come. Our estimates
suggest that there will be an additional benefit of about 3,6 mill. EUR per year by improv-
ing the ramping rate from 600 to 1200 MW/h. In order to assess the value of the future
interconnectors we have assumed a constant benefit per MW of capacity, see Appendix B
for more details on the calculations.

22
 Going to unlimited ramping from 600 MW/h would increase the benefits to between 3.0 mill. EUR in the central case and
 1.7-5.4 mill. EUR in the low and high case.

 33
You can also read