The effect of switching costs in the Peruvian mobile phone market
←
→
Page content transcription
If your browser does not render page correctly, please read the page content below
The effect of switching costs in the Peruvian mobile phone
                              market
                                          Universidad de Piura
                                          Preliminary version

                                                                    ∗
                                           Tilsa Oré Mónago

                                                 Abstract

Based on a game theoretical model I previously developed and using consumer panel data, I present
some evidence of the effect of the unlocked-handset policy (a reduction on switching costs), recently
implemented in Peru, on demand and prices. Average prices declined since mid 2014, and the switch-
ing rate rocketed since the implementation of the policy in January 2015. To retain consumers and
attract rival’s consumers, companies responded also with very low on-net prices through their “private
network" with unlimited minutes, which may have increased the network effects in the market.
From my estimation, I found a significant negative effect of switching costs on demand for voice traffic
(which suggest a positive effect of the unlocked-handset policy on demand) and positive network effects
on the demand. The policy, by reducing consumer switching costs, would have generated an increase
of 39.7% in the minutes consumed by switchers. Moreover, any change of consumer status (company
or consumption plan) is associated with 31.2% increase in minutes consumed. I also found that, with
lower significance level, the policy would have induced a reduction of per-minute prices by 9.4%.

Keywords: Switching costs, unlocked-handset policy, network effects, mobile telecommuni-
cations, number portability.
JEL Codes: L11, L12, L13, L41, L42

1       Introduction
Mobile phone users, across the world, still have to deal with high transaction costs when they
want to switch providers: phone numbers and phone sets are, in many cases, locked to certain
network and/or subject to the exclusivity of certain provider’s service. Moreover, if there is
a distinctive on-net and off-net call pricing scheme, consumers may also prefer to stay in the
larger network. Number portability became popular as recipe for enhancing market efficiency,
but at what extend such policy reduce switching costs and what else the regulatory agencies
should target to increase efficiency when implementing such policies, are some of the questions
that can be better addressed by knowing the nature of switching costs. Empirical research on
estimating the effect of switching costs in network industries is highly relevant considering the
policy implications.

    ∗
     This research paper is part of my doctoral dissertation. I would like to thank Claudia Barriga, Jose Carlos
Aguilar and Jorge Trelles from OSIPTEL, to Gonzalo Ruiz (former President of OSIPTEL), Manuel Cipriano,
and Javier Alvarez (from IPSOS Peru) for their valuable cooperation; also I thank Wilmer Cordoba and Carlos
Ireijo for their insights about the market. My deepest gratitude to the NET Institute, www.netinst.org, for
funding this research project. All the errors are my own. My e-mail address is tilsaore@gmail.com .

                                                       1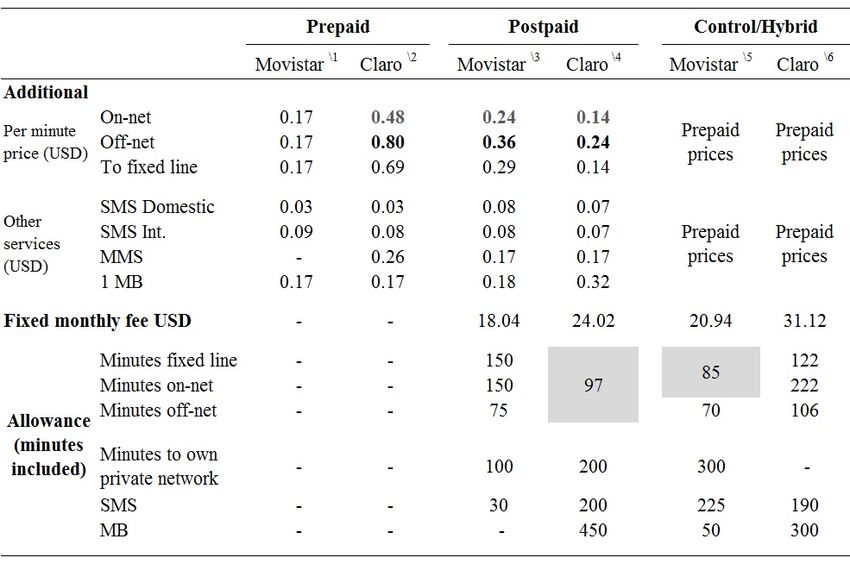
2                                                                                             Tilsa Ore

Many countries already implemented-number portability policies.1 However, there are still
places where handsets are locked to a provider and usually their purchase is tied with an
exclusive contract for certain term. If consumers want to switch to another provider, they
face costs (time or money) for "unlocking" her handset or just buy another with the new
provider. Countries such as Chile implemented, in 2012, a policy that bans the practice of
telecommunications providers to sell locked handsets and/or impose consumers to a exclusive
contract with them.

These regulatory changes aimed to reduce, exogenously, switching costs in the mobile telecom-
munications markets, and provides with a good opportunity to test theoretical predictions and
find evidence of the impact of switching costs in market outcomes and consumer welfare. In
particular, Peru implemented number portability in 2010, but contrary to expected, the ef-
fect was marginal compared to neighbor countries such as Chile the implemented such policy
around the same time. Recently, in 2015, the unlocked handset policy was implemented and
switching rate of subscription lines among providers increased rapidly.

Based on a game theoretical model I previously developed, I empirically test my model pre-
dictions using Peruvian consumer panel data. My theoretical model, briefly presented in
section 2, accounts for two types of switching costs, switching fees (also known as endoge-
nous switching costs and constitute transfers from consumers to providers) such as the early
termination fees (ETF) and individual/idiosyncratic switching costs (e.g. psychological costs,
laziness level, which are exogenous to the providers). The model predicts that first period
prices are decreasing in individual switching costs, while second period prices are increasing
in them. The presence of switching fees only intensifies the intertemporal price compensation
and leaves multiperiod payoffs unaffected. Multiperiod consumer surplus are decreasing in
exogenous switching costs.

Ale (2013) addresses a similar problem for Chilean market, but the author restricted his anal-
ysis to information given by one firm only on its customer base, so the analysis could not
cover the entire market. Weiergraber (2014) estimates both the switching costs and the net-
work effects for the US mobile industry using a structural discrete choice model. The author
identifies the network effects from the comparison of different dynamics of local markets. The
study uses firm-level data that contains mainly operational and accounting information, and
a consumer survey of cellphone users. However, unlike Weiergraber (2014), in my chosen mar-
ket I additionally have an exogenous change on switching costs, which helps to identify the
switching costs effects. The other advantage is that in my selected market, there is explicit
price discrimination on and off network, and additionally I have information on the network
used by household members, which helps to control for network effects.

At this stage of my research, I provide some evidence based on market analysis and reduced
form empirical methods. In particular, I use instrumental variables to test the effect of the
unlocked handset policy on prices and demand of mobile calls service. I analyzed the market
based on the available information and descriptive statistics, and as second step I estimate the
switching cost effects on market outcomes. My testable hypothesis is that a reduction in indi-
vidual switching costs (unlocked handsets policy) led to lower average prices and higher higher
demand for the service. Even though my objective is to estimate the effect of the reduction
of switching costs, I also take into account the network effects, because in the Peruvian case,
    1
    The UK and the Netherlands in 1999; Spain in 2001; Germany and Italy in 2002; the USA, France and
Finland in 2003; Slovakia in 2004; Mexico and Brazil in 2008; Ecuador in 2009, Argentina and Peru in 2010;
Colombia in 2011; Chile in 2012, among other countries.
Switching costs in Peruvian mobile industry                                                                     3

these seem to be stronger due to a common practice of explicit price discrimination between
off-net and on-net minutes. Section 3 and 4 present the relevant details about the industry
and the Peruvian mobile phone service market.

In general, it is observed that the proxy price variable, implicit price (‘per-minute average
revenue’), declined since the second quarter of 2014 (when a first regulation – the paperwork
reduction regulation of number portability – was implemented), and continued such trend dur-
ing 2015. 2 In particular, the switching rate rocketed with the implementation of the unlocked
handset policy in January 2015. It is important to acknowledge that the unlocked handset
policy was announced in November in 2014, but firms would know about the intended change
since the end of 2013. Likewise, lower average per-minute prices are related to lower off net and
on net prices, however to retain consumers and attract rival’s consumers, companies offered
very low on-net prices through their “private network’ with unlimited minutes, the premium
of off-net per minute price over this private-network price became larger.

For the empirical estimation, explained in sections 5 ad 6, I used longitudinal consumer survey
data (for the period 2013-2015) enriched with firm-level information for the demand estima-
tion, and I built a different ’long’ providers panel data (for period Q1 2008-Q4 2015) based
on the available operational and financial quarterly information of providers for the supply
estimation. Thus, I estimated a demand and a supply equations to test the effect of exogenous
switching costs on demand and prices. I relied on the instrumental variables method with fixed
effects for the estimation of the demand equation, and with random effects for the estimation
of the supply equation.

After controlling for network effects and market entry, I found a significant negative effect of
exogenous switching costs on demand of voice traffic (minutes), implying that a reduction on
switching costs (unlocked-handsets) led to an improvement of consumers who increase their
demand for the service. In particular, my results indicate that the unlocked handset policy
reform –an external reduction of exogenous switching costs– implemented in Peru in 2015
would have induced an increase of demand of minutes of 39.7% for consumers that switched
providers. Furthermore, given that 61% of the consumers do not change their choice status
(plan type and company), the estimation suggests that, in addition, any change in consumers’
status quo would have increased their demand for mobile services by 31%.

On the other hand, my relevant findings also include a positive and significant positive impact
of network effects on demand. Specifically, network effects coming from the existing off-net
and on-net price discrimination positively impact the demand for minutes; thus, a 1% increase
in the premium of off-net calls over on-net private-network calls would have increased demand
for minutes by 4.9%, which would be mostly comprised by on-net minutes.
From the supply estimation, a highlighting result is given by the negative and significant effect
of change in switching rate (ratio of ported-out lines out of total lines), an increasing switching
rate would induce prices to decline. Likewise, despite its low statistical significance level, I
found that the reduction of (exogenous) switching costs (individual costs of switching efforts)
given by the implementation of the unlocked-handset policy would have led prices down by
9.4%, which supports my theoretical prediction of reduction of prices due to reduction in
exogenous switching costs. This last result give some empirical evidence to my theory, but
   2
    The implicit price is the per-minute average revenue, and it is calculated by dividing the provider’s reported
revenue by the total minutes traffic reported to OSIPTEL for each period (quarter). The implicit price for the
market is the weighted sum of the implicit price of the largest three operators, using the market share over
voice traffic as weights.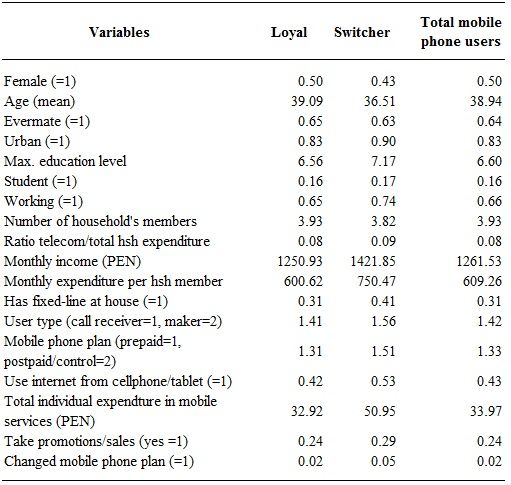
4                                                                                                       Tilsa Ore

I have to acknowledge its statistical significance may be limited due to data size. This also
suggests that a better estimation model that exploit the dynamics of the game using the
largest longitudinal data set is needed. Given that this is an on-going research project, I aim
to provide later with an estimation of a dynamic demand model.

1.1     Motivation: Unlocked handsets policy and number portability
The mobile industry is among many, the most dynamic in terms of innovation. In few decades
the range of services has been vastly broadened, providing from purely voice service to text
messaging, video calls, internet access (WiFi, 3G, 4G) etc, while the prices have been declining
and becoming broadly accessible to everyone.

In mobile telecommunications industry, switching costs can be showed explicitly as form of
exclusive contracts and early termination fees ETF, and also in the form of lack of number
portability. Less explicit are the switching costs associated with the paperwork involved in
porting phone numbers from one provider to another, and increasing difficulty in comparing
among each time many price menus, adding to the search an learning costs.3 Additionally, it
can be argued that network effects added to switching costs may cause stronger consumers’
inertia.

As a response, telecommunication regulatory agencies across the world have been implement-
ing number portability policies to reduce switching costs and increase competition. Previous
empirical studies show evidence that supports the predicted adverse effects of switching costs
in competition. According to Viard (2003) and Lee et al. (2006), number portability policies
in countries such as the USA and Korea, respectively, indeed lowered the existing switching
costs and led firms to reduce their prices improving competition conditions. Lee et al. (2006)
find that ‘having to buy a new phone’ was the second highest switching barrier for consumers.4

In Peru, the number portability reform was implemented in 2010 after being announced in
2007.5 This reform allowed consumers to keep their phone number, restricted the paperwork
duration to five business days and reduced forced contract duration. Similar reforms were
implemented in Brazil and Mexico two years earlier, and big impact was expected. The
number of switched lines were minimal; by 2014, in more than three years of the regulation,
only about 269 thousand mobile lines switched operators out of 29 million active lines in
Peru, whereas in Chile and Colombia, where the policy was implemented later, the figure was
around 2.5 million and 1.3 million in 2.5 and 2 years of implementation of the same regulation,
respectively.6 7

In July 2014, OSIPTEL, the telecommunications regulatory agency in Peru, mandated to re-
duce the paperwork time to port numbers from 5 to 1 business day. In November of the same
year, the regulatory agency announced its new policy, which would be implemented since Jan-
    3
      According to Grzybowski and Liang (2015), European consumers face between 26 and 46 price schedules to
choose one in the fixed-mobile bundles. In Peru, by September of 2014, there were around 368 price schedules
for the postpaid type of service, 186 and 127 offered, respectively, by Movistar and Claro the largest companies.
    4
      Both Viard (2003) and Lee et al. (2006) estimate static models, while the first uses a difference in difference
method, the second uses a random coefficient discrete choice model.
    5
      First Number portability reform was announced by Law 28999 in April 2007.
    6
      El Comercio, "Portabilidad en celulares solo es usada por el 1% de usuarios", September 04, 2014. Available
at https://elcomercio.pe/economia/peru/portabilidad-celulares-usada-1-usuarios-176472.
    7
      By the end of 2014, the number of subscription lines in Colombia was of 55.3 million (Colombian population
is around 48.3 million inhabitants), Chile’s was of 26.7 million, and Peru’s was 30.3 million.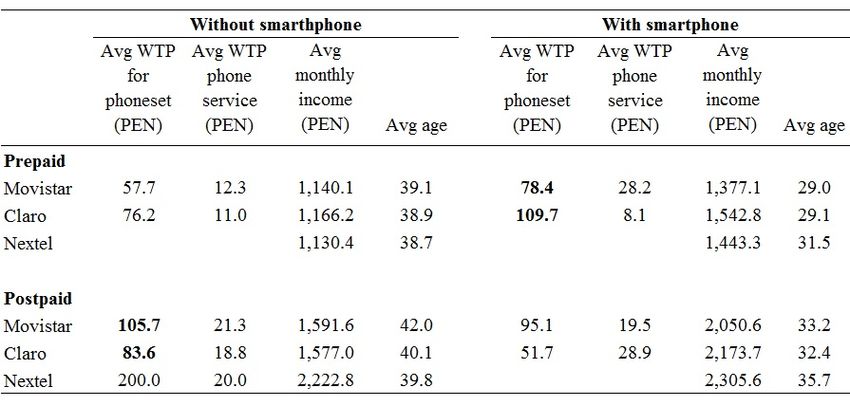
Switching costs in Peruvian mobile industry                                                                5

        Figure 1: Peru: Switched mobile lines and monthly switching rate (2010-2015)

                     Source: OSIPTEL- Telecommunications Regulatory Agency

uary 2015, to reinforce number portability: only unlocked handsets would be commercialized
(firms had to unlock existing handsets), firms were banned to offer contracts of forced duration
as only option. 8 Only in 2015, around 877 thousand lines switched providers, and around 1
million since the unlocked handset policy was announced. Figure 1 shows the drastic change in
the cumulative number of ported subscription lines and the monthly switching rate (monthly
ported lines over total subscription lines). There is an increased switching behavior after the
reduction of portability paperwork duration and a striking change after the implementation
of the unlocked handsets’ policy.

Peru, Colombia and Chile have similar markets, being Chile (with a population of 17.6 million
people) the smallest among these three and the one that has promoted more competition in
the market; and the one that leads the major regulatory changes in the region. Chile started
the implementation of its number portability policy late in 2010, strengthened it by banning
lock-phone sales in 2012, and allowed the entry of MVNOs in 2012.9 Colombia did the same
in the mid of 2011, at the beginning of 2012, and 2013 respectively. It took 5 years to Peru,
to implement the second step of number portability policy, and the entry of MVNOs recently
was allowed in 2016. The delayed of the second step of number portability policy in Peru may
explain the differences in switching behavior.

These recent regulatory changes that exogenously reduced switching costs emphasize the im-
portance of individual (exogenous) switching costs. Number portability was allowed since
2010, but it was not until handsets were unlocked and the paperwork reduced to observe
significant changes in switching providers.10 This observation also rise questions about the
market features in Peru. The market structure was basically duopolistic: by the end of 2014,
   8
     Resolucion 166-2003-CD/OSIPTEL in December 2013 to be implemented in 2014, and Resolucion de
Consejo Directivo 138-2014-CD/OSIPTEL in November 2014 to be implemented in January 2015.
   9
     Law 20471, in force since December 12, 2010. Decree 379 in force since March 25, 2011; and
Resolution 5400 enacted on September 29, 2011 and implemented on January 2012 (all available at
http://www.portabilidadnumerica.cl/normativa/.
  10
     This is a standard practice around the world, so is the concern about its role in the telecommunications
industry, thus the OECD also showed interest to better understand the different mobile handset acquisition
models and to analyze the different prices (OECD, 2013).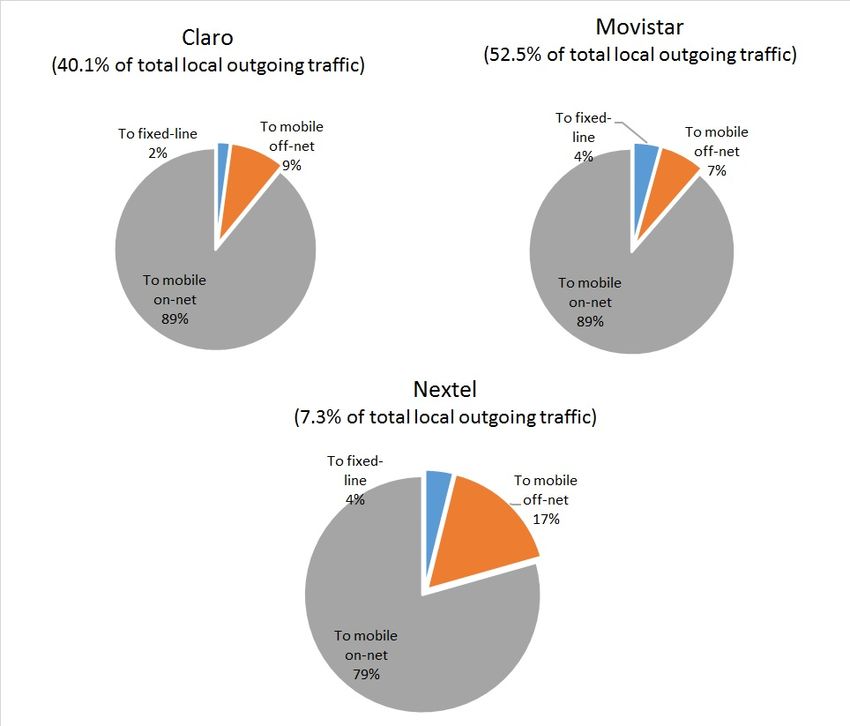
6                                                                                                  Tilsa Ore

two out of four companies concentrated 94% of the market share despite the entrance of the
fourth at the end of 2014. The two largest players kept their position, so a year later, in 2015,
the share of these two was still above 87%.

In addition, the Peruvian market presents stronger network effects than other mobile com-
munications markets, because firms explicitly discriminate between on-net and off-net calls,
moreover, they created a "private-network" within their on network, and price accordingly.
Also calls between mobile networks and fixed-line networks are marginal, therefore the market
is basically restricted to mobile-to-mobile communications.

This mobile telecommunications market seems to have the features to analyze the impact of
switching costs on market equilibrium outcomes and test the theoretical predictions.

2        Theoretical Framework
2.1      Switching costs
Switching costs can be understood as additional (real or perceived) costs that users or con-
sumers incur to change or switch providers. These costs can be derived from learning costs,
transaction costs, informational costs, searching costs, shopping costs, contractual or pecu-
niary switching fees,even psychological costs (Farrel and Klemperer, 2007; NERA, 2003).11
Thus, we can classify switching costs as endogenous when they are set by firms (switching
fees) and directly affect firm’s profits, and exogenous switching costs that can be idiosyncratic
and specific to consumers.

Under the presence of high switching costs, consumer inertia may increase causing demand to
be more inelastic. Thus, markets can be split into those that are already established consumers
and those that are new consumers, and firms can easily discriminate among them. For the
consumer side, switching costs implies that individuals do not take one-time decision any more,
but a life-cycle decision, for the current and future periods. Therefore, these costs shift com-
petition from one period transaction to a long-term relationship (Farrel and Klemperer, 2007).

These special characteristics allow firms to reinforce their market position in future peri-
ods. For that reason firms may have the incentive to lower prices to attract consumer in the
initial periods and once they are "locked-in", they would be tempted to raise prices and take
advantage from those consumers. In fact, that is the reason why firms may be more inter-
ested in market shares than in short-run profits, they would fiercely compete to secure a large
number of consumers, therefore increase their market share, which will allow them to increase
their later profits (Farrel, 1986; Klemperer, 1987a,b, 1988; Beggs and Klemperer, 1992). This
behavior is broadly know as "bargaining-then-ripoff" strategy.

However this last approach assumes consumers are naive, so, if rational consumers with ex-
pectations over future prices are assumed, then firms may not enjoy so much discretionality.
Consumers may realize that price cuts will not last all the periods, and that firms with lower
prices may be more likely to raise prices in the following period, therefore will be more re-
luctant to price cuts and switching costs indeed increase prices (Klemperer, 1987a; Farrel and
Klemperer, 2007).
    11
    Psychological switching costs refers to those "costs" of trust, this happens with those goods where the
quality is perceived after its consumption for several periods (medical services), and quality is taken on trust
(NERA, 2003).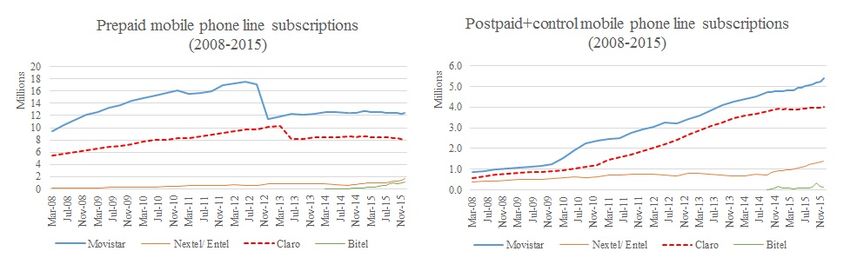
Switching costs in Peruvian mobile industry                                                                 7

2.2      Model on switching costs

In a previous study (Ore, 2017), I modeled a game theoretical model in which I distinguished
the effect of exogenous and endogenous switching costs on market equilibrium in subscription
markets where there are introductory offers. Following a two period game, in which two com-
petitive firms set period flat prices (Ti in the first period , Tii in the second period to loyal
consumers, and Tij to newcomers switchers from firm j) and switching fees (si ).

A continuum of consumers have same constant valuation for the service v (assumed to be
big enough, such that the market is covered at all periods) and not only face si but also a
‘exogenous’ and heterogeneous (idiosyncratic) switching costs xk ∼ U [0, ω] (for consumer k)
revealed in the second period, and an idiosyncratic relative taste shock for provider A over B,
σ ∼ U [0, θ], revealed in the first period and by which they choose providers in the first period.

Both, firms and consumers, have the same discount factor δ and consumers have rational
expectations. Firms do not know the idiosyncratic values of consumers but they know their
distribution.
The timeline of the game is:

                                  t=1                                   t=2
                        Stage 1            Stage 2            Stage 1            Stage 2
                                      Consumers learn                  Consumers learn
                   Providers set flat                   Providers set
                                       σk , then given                  xk , then given
                    prices (TA ,TB )                   new flat prices
                                         prices and                    new prices, they
                    and switching                      (TAA ,TBA ) and
                                        preferences                    decide to stay or
                     fees (sA ,sB )                      (TBB ,TAB )
                                        they choose                        to switch
                                       their provider

Using backward induction, I found that there are symmetric subgame perfect equilibria in
pure strategies that lead to a unique equilibrium outcome: providers split the market equally
in the first period, and the ability of setting switching fees only intensify the inter-temporal
price compensation such that multiperiod payoffs are unaffected; on the other hand exogenous
switching costs affect consumer welfare. 12

Second period prices are increasing in the individual (exogenous) switching cost parameter,
first period prices are decreasing in exogenous switching costs, and the upper bound of switch-
ing fees (endogenous switching costs) decreases with exogenous switching costs.

The equilibrium prices and payoff are summarized below, ∀i, j ∈ {A, B} :

                                                            ω
                                            Ti∗ = 2θ − δ(     + si )
                                                            3
                                                  2
                                            Tii∗ = ω + si
                                                  3
                                                         ω
                                            Tij = Tji∗ =
                                              ∗
                                                         3
 12
      For detailed explanation on the model setting and solution, please review Ore (2017) or click here.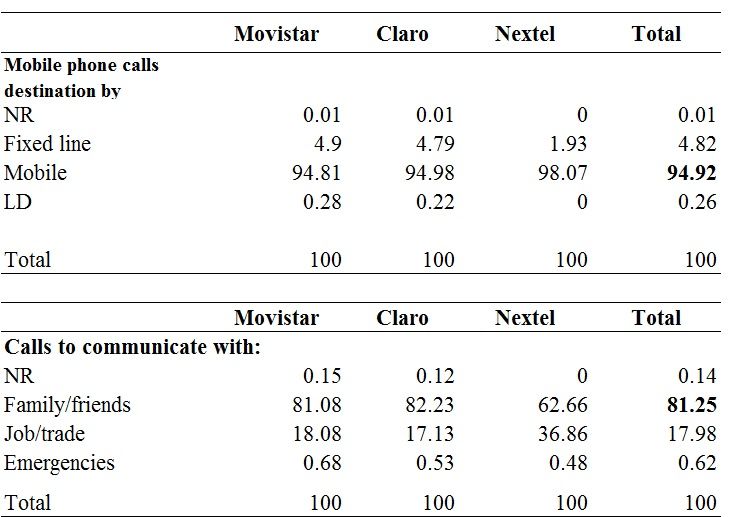
8                                                                                    Tilsa Ore

and switching fees are such that
                        5ω
                    −      ≤ s∗i                            thus, π2i ≥ 0
                         9
                                    11ω
                        s∗i ≤ v −                           thus, E[R2i ] ≥ 0
                                     18
Multiperiod profits are:
                                            δω
                                    πi∗ =      +θ   ∀i ∈ {A, B}
                                             9
and are unaffected by the ability of introducing switching fees, but profits are increasing in ω
and the relative taste parameter θ for provider A over B. Consumers’ multiperiod payoffs are
                                               5ωδ
                            Ri = v(1 + δ) −        − 2θ   ∀i ∈ {A, B}
                                                18
This also suggests that regulatory agencies should target reductions on exogenous switching
costs rather than reduction of switching fees. The recent regulatory changes in the mobile
telecommunications market of Peru, offers a natural experiment to test and quantitatively
measure the welfare gains of a reduction of switching costs.

2.3    Switching costs and network effects: an approach
My theoretical model does not include network effects, but it considers a relative taste param-
eter, which is individual specific to consumers (realized only in the first period when choosing
providers) and contain such effects. In the second period, consumers only choose to switch or
to stay with their first period provider. Therefore, in the second period decision variable is
the exogenous idiosyncratic switching cost.

Given the unnavoidable presence of network effect in mobile telecommunications, I also based
my testable hypothesis on the existing theoretical literature such Klemperer (1987a), Farrel
and Shapiro (1988) and particularly on Doganoglu and Grzybowski (2004). The latter shows
a theoretical model of competition with switching costs and network effects is developed. This
model considers only interaction between existing firms, discarding any potential entry. This
is consistent with the telecommunications industry where there are important entry barriers,
such as radio spectrum allocation and important sunk costs, that hinders rapid entry in the
market. Their model considers a two-stage duopolistic price competition under Hotelling set-
ting. Among the main findings derived from this dynamic model are the following:

    • Although switching costs and network effects have different and opposite impact on
      the demand (the first makes demand more inelastic, while the latter, more elastic),
      the coexistence of these two feature, seem to reinforce the incentive to rise prices in
      the second period to take advantage of lock-in consumers, particularly in large network
      firms.

    • In the equilibrium, both firms will split equally the market in both periods, prices and
      profits in the second period are positive and decreasing in network effects.

    • Given first period equilibrium prices depend negatively on network effects, and are in-
      dependent on switching costs; first period stage will exhibit intensive competition, and
      this will be lessen in the second period (which agrees to what is found in other models).
Switching costs in Peruvian mobile industry                                                                    9

Finally, the testable hypotheses are the following:

    (i) A reduction of individual switching costs reduces second period prices, therefore increases
        demand for the service/good.

 (ii) Network effects affect negatively second period prices, therefore influences positively to
      demand.

3        The mobile phone telecommunications industry
Mobile phone calls services can be characterized as experienced goods, in the sense that con-
sumers will know about the service once they consume it. Additionally, mobile phone service
cannot be stored. These characteristics of the service add dynamics to the decision making of
consumers, who make choices at every period based in their past experiences.

In Latin America, the mobile telecommunications market has expanded rapidly during the last
decade; one favorable factor was the number portability policies and the entry of the Mobile
Virtual Network Operators in many countries (like Mexico, Chile and Colombia). However,
few operators still remain as the largest. In Chile, 3 out of 13 operators accounts for 96% of
the market share; in Colombia, 3 out of 4 operators account for 99% of the market share; while
in Peru, 2 out of 4 keep the 90% of the market share. In terms of profitability, the average
revenue per user ARPU (more specifically, per subscription line) in the region declined to USD
10.7 in 2014 from its level of USD 11.7 in 2012 (which still are above the USD 6.8 observed in
the developing world). Likewise the average effective price per voice minute in the region fell
from USD 0.11 to USD 0.06 between 2008 and 2013 (GSMA, 2014). In Peru, considering the
ARPU of the two largest network providers, the market’s ARPU decreased from USD 9.1 to
USD 8.8 from 2013 to 2014; these levels are below the region’s average and might reflect the
high share of prepaid subscriptions (72% in 2014).

Mobile services are usually provided under two plan types, pre-paid and post-paid. Within
each type each company offer several consumption plans with different characteristics each
(minutes for on-net calls, off-net calls, SMS, data availability, contract length) that may in-
clude a locked telephone set at cheaper price (companies state they sell at subsidized price) to
be paid along a contract duration (usually 12 to 18 months).13 The plans have certain valid
period, but then new plans are created to keep the choices diverse. Although an extensive
range of consumption plans are good since it provides consumers with a variety of options,
benefits would be reduced with too many and changing consumption plans that may be seen
as confusing and would prevent consumers to optimally take a choice.14 Handsets are still
sold locked in many countries, and although unlocked handsets are available, these also sold
    13
      By comparing import prices, and handsets’ prices offered by companies under postpaid plans, prepaid and
unlocked, OSIPTEL found that there is almost no subsidy. Handsets imported at cheap price were sold by the
companies up to 112% higher than their import value, premium that would reach 325% for the selling price
of unlocked phones. In the case of modern smartphones of high import value, they were offered up tp 29% of
the import price when offered under a consumption plan, such premium would reach 36% if offered unlocked.
I also could compare prices of smartphones and catalog prices, and found a similar premium between 30%
to 47%. The study, that also supported OSIPTEL’ mandate, found that in 2014 mobile operators directly
imported 75% of the total ammount of imported handsets, which imported mostly cheap handsets (47% of the
handsets have value below USD 33.00. The smartphones of highest import value accounted only for 2.5% of
all the imported quantity.
   14
      According to Grzybowski and Liang (2015), European consumers face between 26 and 46 price schedules to
choose one in the fixed-mobile bundles. In Peru, by September of 2014, there were around 368 price schedules
for the postpaid type of service, 186 and 127 offered, respectively, by Movistar and Claro the largest companies.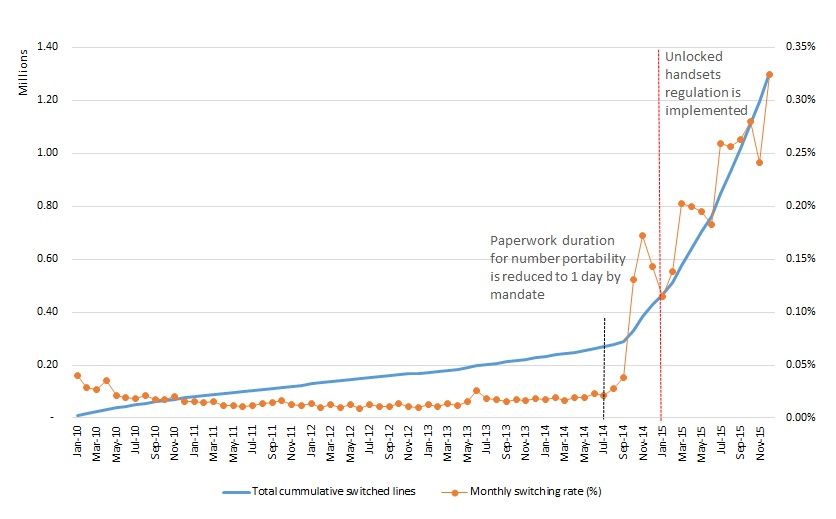
10                                                                                                  Tilsa Ore

at higher price.

Being subject to a service contract and owning a locked handset prevent switching to another
company due to the costs involved. Switchers may need to spend time and also money, per-
haps on ETF, but also to ’unlock’ the handset or to buy another locked phone from the new
provider. Currently, ETF is observed in service contracts given by the largest provider, but it
is absent from the service contracts of other providers. Such coexistence of zero and positive
switching fees in the Peruvian market supports also my theoretical predictions about switching
fees, all network providers not need to apply switching fees, doing it so would only intensify
inter-temporal price compensations.

The recent policy implemented in Peru to reduce exogenous switching costs may have al-
lowed increasing switching behavior. Moreover, the two regulatory changes imposed exogenous
shocks on switching costs which makes the analysis of the market attractive. The government
allowed for number portability in the telecommunications sector in 2010 to enhance compe-
tition by reducing switching costs; however other very relevant switching costs such as the
locked handsets and lengthy number portability procedure remained until early 2015, when a
new regulation was implemented.

Following my theoretical model, an anticipated reduction of a exogenous switching costs would
have led to lower prices and profits, and increased consumer surplus. Based on the assump-
tion of uniformly distributed mass of consumers, my model predicts that switching rates do
not depend on exogenous switching cost parameter. This basically because any anticipated
change would drive firms to act strategically, using different period prices to inter temporally
compensate consumers. Thus, acknowledging a future reduction of exogenous switching costs,
firms would increase current prices and later reduce prices to compensate their loyal consumers
and become attractive to rival’s consumers in the following period.15 Consumers that have
lower idiosyncratic exogenous switching costs and small relative preference between providers
will still switch, but switching will happen at the same rate.

After the number portability reform in 2010, many expected a decreased in prices, but that did
not happen. Price stay almost flat. This may be related to consumer heterogeneity in terms
of exogenous switching costs. A lengthy portability process may have prevented consumers
with low time availability to switch. A speedy process and the availability to carry the same
handset from a provider to another may have allowed those consumers to switch after the
second reform in 2015. Prices would later fall in the race for keeping and attracting rival’s
consumers.

The low switching rate in Peru may be explained by the current structure of handset acqui-
sition. Although companies have more flexible service contracts, they still tie handset sales
to consumption plans. Given that the average income in Peru is around 1600 PEN (USD 550
aprox) consumption plans that allows the acquisition of handsets in installments are attractive
for mobile consumers. Another explanation for low switching rates is related to the increasing
premium between off-net price and private-network price (calls within the network cheaper
than on-net prices). Since late 2014, the large mobile operators set same off-net and on-net
prices, but offered very low-price or unlimited private-network minutes. Moreover, given the
increasing rate of smartphone adoption in Peru (which reached 29% by the end of 2015, 10
percentage points higher than in 2014), mobile operators are competing in data prices: the
  15
     This regardless of the existence of switching fees, which my model predicts to have no effect in multiperiod
payoffs
Switching costs in Peruvian mobile industry 11
national average price for one MB fell from 2.18 PEN and to 0.23 PEN, between 2013 and
2015. 16
3.1 Peru’s mobile phone market
In Peru by the end of 2015, there were four mobile providers (two of them also provide fixed-
line services), from which two accounted for around 90% of the national market since 2010
(only in 2015 the joint share of two big providers was 87%). The industry was privatized in
early nineties, and at that time companies showed to aggressively compete against each other.
However, as time passes concerns about competition impediments has arisen (switching costs
are one of them), as well as consumers’ dissatisfaction increased.17
The market is characterized for having a pays-who-calls price scheme, only call makers pay for
the calls they make. That is why people have incentives to get a phone only to stay connected
and to receive calls. Indeed, still around 68% of mobile line subscriptions were prepaid by the
end of 2015.
Mobile-to-fixed calls are subject to a different regulation, which has derived in higher prices
than mobile-to-mobile calls within a network. There is also an explicit price discrimination
between on-net and off-net calls, being the later charged up to 67% more than the former one
in some consumption plans, particularly in the case of small companies or prepaid consump-
tion plans. Therefore consumers are driven to keep their calls within their network and mostly
use the service to communicate to another mobile phone. This is one of the reasons why still
76% of the outbound traffic calls are associated to mobile on-net calls.
It is worth mentioning that Peru and Colombia are some of the few countries where on-net
and off-net price discrimination exist. In Chile that changed since 2014 where such discrim-
ination practice was banned. However, unlike Colombia, Peru does not only keep the same
network price discrimination practice, but may be the unique case in Latin America where
price discrimination is also practiced within each network (unlimited talk is allowed only for
a subset of subscription lines within the same network, otherwise a discounted price still ap-
plies). Indeed, after averaging the per-minute price offered by the most popular consumption
plans, the premium of off-net calls over this private-on-network calls reached 110% in 2013,
peaked over 290% in 2014 and remained in 70% in 2015. 18
On the other hand, the argument behind the service contract is associated to the provision of
subsidized handsets. These subsidized handsets’ prices are consistent with the idea of firms
to get as much consumers as possible and then ‘lock them in’ to extract rents. Unlike the
theoretical models where lower prices in a period are followed by higher prices in the following
periods once the consumers are ‘locked in’, in the Peruvian mobile industry case, telecommu-
nication service’s keep the price steady and it may be even the case that they do not transfer
any cost savings to consumers (in the form of lower prices) as it would happen in the absence
of switching costs. Taking into account the information contained in ITU (2014), which rank
16
To calculate this average price, I used the prices given in the most popular consumption plans per year
per company per plan type provided by the Peruvian Regulatory Agency.
17
Almost 50% of all the consumers’ complaints on telecommunications services were related to mobile com-
munications. Share that increased from 10% in 2010.
18
I could obtained the name of the plans of the most popular plans (name of plans that have together at
least 50% of subscriptions) per type of plan per company for years 2013 to 2015 from the Peruvian Regulatory
Agency. The characteristics of the plans and prices are available in other database of the Peruvian Regulatory
Agency called SIRT.12 Tilsa Ore
166 countries according to the affordability of a Mobile-cellular sub-basket, Peru is one of the
countries with expensive cellular service. In terms of the ranking, Uruguay gets the highest
position among South American Countries with the 66th position; Chile gets the 75th posi-
tion; Peru, the 87th; and Colombia, the 102nd. For all those cases, such mobile-cellular basket
represents 1.67%, 1.98%, 2.43% and 3.35% of their per capita GNI respectively.19
Moreover, handset prices may not be subsidized as argued. In fact, the Colombian Telecom
Regulatory agency (‘Comision de Regulacion de Comunicaciones’ ) found that only one spe-
cific Samsung handset, offered by the mobile companies’ plans, was actually cheaper than an
external or direct provider (CRC, 2013). In 20114, by comparing import prices, and handset’s
prices offered by companies under postpaid, prepaid plans and unlocked, OSIPTEL found that
there was not almost no subsidy (with an exception of the small operators). Cheap handsets
(up to an import value of USD 33.0) were sold by the companies up to 112% higher than
their import value, premium that would reach 325% for the selling price of unlocked phones.
In the case of modern smartphones of highest import value, they were offered up to 29% of
the import price when offered under a consumption plan, such premium would reach 36% if
offered unlocked. I also compared prices of smartphones and catalog prices and found similar
premiums that range from 28% to 47% for unlocked handsets. It is important to mention
that mobile operators directly imported 75% of the total handsets, which were mostly low-
value handsets (47%), while high-value smarphones only accounted for 2.5% of the imported
quantity. 20
4 Market analysis
The mobile phone market in Peru is supervised by the government, and regulated only at the
level of interconnection fees (termination rates charged by the companies for incoming calls
from different network) under a price cap regulation.
In 2015, the mobile phone market in Peru accounted for 34.2 million active mobile line sub-
scriptions, which implies a mobile density of 114.9 (lines per 100 inhabitants). Nonetheless,
these mobile lines belonged to 19.7 million people older than 11 years old, 25% higher than
in 2013 (ERESTEL, 2013, 2015). However, according to the ERESTEL in 2015, only 4.6%
of the population owned more than one phone number and 4% owned more than one handset.21
The market has rapidly expanded during the last decade; only in five years (2005-2010) the
number of mobile subscriptions increased almost six times its level of 5.5 million lines in 2005.22
Nonetheless, until the third quarter of 2014, three were the mobile network operators; the two
largest companies –Telefonica Moviles (Movistar) and Americal Movil (Claro)– consistently
concentrated 95% of market share (55.3% for Movistar and 39.6% for Claro). Currently,
19
The mobile-cellular sub-basket consists of prepaid service prices of 30 calls and 100 SMS from the largest
mobile operator.
20
In 2014, taking a random handset from many of the smarthphone offered by a Peruvian company, the
‘Motorola X’ was offered at $812 and $565 in the prepaid and postpaid consumption plans, and it was sold by
$883 if the consumer wants it unlocked; while the price of this same unlocked handset at Amazon was $350,
and even if import tariffs and taxes were added, the handset price would have still be around $500. [Note: I
took a smartphone model from the mobile catalog from Claro (www.claro.com.pe), accessed on 24 Apr. 2014.]
21
On the other hand, smartphone adoption expanded since 2012 and significantly increased in 2015 (see
Figure 6 in the appendix)
22
According to the ITU, the number of mobile subscriptions in South America grew by 344% between 2004
and 2014. In Peru itself, this number grew by 679% in the same period. The mobile teledensity in South
America reached in 2014 ranges from 96 to 158, Peru is only above Bolivia and Venezuela (GSMA, 2014).Switching costs in Peruvian mobile industry 13
there are four operators: the acquisition of Nextel by the Chilean firm Entel and the entry of
Viettel at the very end of 2014 have impacted the market; the joint market share of this two
companies increased from 6% to 12%, between 2014 and 2015, driven mainly for an increase
of Entel subscriptions (see figure 5).
4.0.1 The supply: Mobile network operators
The mobile service network infrastructure is displayed over the country, and by the end of
2014, 1825 out of the existing 1833 counties were covered by the service. It is worth men-
tioning that only the two largest mobile operators have almost full coverage, so they both
compete in most of the counties. Likewise, Entel (Nextel) the third operator that was highly
specialized in mobile services to business until before its expansion, competed only in 14 out
of the 24 regions of Peru by the end of 2014.
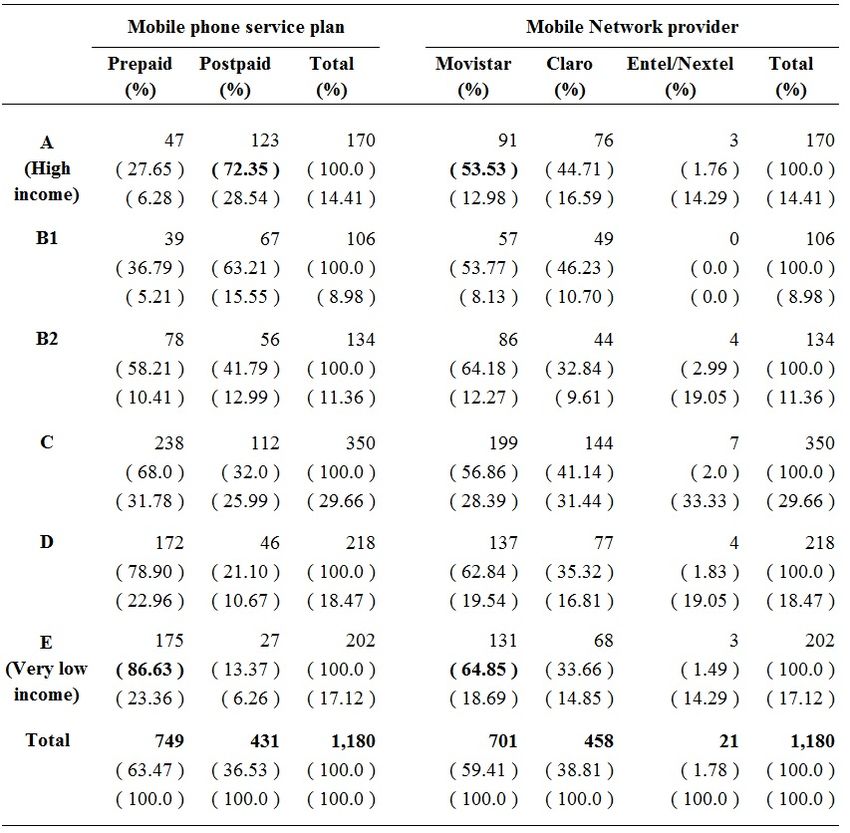
By 2015, 68% of the mobile phone lines were under the prepaid plan, 15.5% under the postpaid
plan, and 16.3%, under control/hybrid plan. 23 In average, a Peruvian mobile user is a prepaid
consumer. Movistar has the largest share within prepaid service (12.4 million subscriptions),
prepaid subscriptions accounted for 69% of its total subscriptions in 2015, figure that was 74%
in 2013. Hybrid subscriptions are next in order, and at last are postpaid subscriptions. In
contrast, Claro, the stronger rival, strictly limits its offer of hybrid plans and depends mostly
on prepaid and postpaid line. Claro is the leader in the market of postpaid service (4 million
subscriptions out of 5.3 million total postpaid subscription), and second in terms of market
share in prepaid subscription. Figure 7 (in the appendix) shows the evolution of number of
line subscriptions by service type by company; although prepaid lines are superior in number,
it is clear an increasing trend of postpaid lines, which can be explained by the popularity of
smartphones that are mainly obtained through contracts within postpaid (and hybrid) con-
tracts.
Providers offer different consumption plans: the prepaid plan, which charges per-minute price;
the postpaid plan, which charges a monthly fixed fee (which includes an allowance of minutes)
and a per-minute price for additional minutes; and the control/hybrid plan, which charges
a fixed fee (with allowance of minutes included) but charges prepaid prices for additional
minutes. Firms tend to explicitly discriminate between on-net, off-net and to-fixed-line calls;
off-net prices can be 50% greater than the on-net prices. Table 11 (shown in the appendix)
shows 6 different price menus out of the 313 offered by the largest two companies by September
2014, where such characteristics can be observed.
Likewise, using the information of around 15 most popular consumption plans for each year, I
constructed average prices for each type of call per plan type (postpaid/hybrid and prepaid)
per company by the end of each year. 24 The total average per minutes prices per type are
23
A control/hybrid plan consist of a mobile phone consumption plan for which consumers signed a contract
and are charged a flat monthly fee for a consumption package of certain amount of services (voice minutes,
SMS, data, etc.), after the consumption of the services reaches its quota, additional service can be consumed
using prepaid phone cards or recharging methods.
24
Each consumption plan, may include 10 variations with different fixed fee level, it also includes allowance of
minutes off-net, on-net, and private network. They may include allowance for data and SMS as well. However,
those varieties of the same consumption plan shared same prices for overage consumption. To find the average
price for each type of call and MB of data consumption I averaged overage prices with the implicit paid price
within included allowances, dividing the fixed fee by the minutes included, thus I found implicit price per
minute (SMS or MB). For cases with unlimited minutes (postpaid and hybrid plans) I considered a maximum
number of 50000 minutes, and I restrict my sample of plan variations to those below the fixed fee value of
130 PEN, given that according the ERESTEL, the average postpaid mobile consumer spends 60 PEN per14 Tilsa Ore
Table 1: Average per unit price (in Peruvian soles - PEN) of popular plans by type of plan
Notes: 1/ Prepaid plans have and average fixed fee because some providers require consumers to purchase prepaid card
of minimum value from time to time. Recharge value/prepaid card ranged from 3 to 10 PEN.
Source: OSIPTEL - SIRT, Consumption mobile plans
shown in the table 1.
From the table, we can observe that prepaid consumers face higher per unit prices than post-
paid consumers. Another observation is that per minute prices decreased between 2013 and
2015, and the fall in prices is sharper between 2014 and 2015 in the case of postpaid/hybrid
consumers. Let’s recall that the main switching cost policy was implemented starting 2015.
Likewise, it is worth noting that the average price per MB (data consumption) significantly
fell since 2013. This may be explained for an increased smartphone adoption and data de-
mand (that includes access to social networks such as Facebook and Whatsapp), and stronger
competition in prices to capture the high-value consumers (postpaid users).
Figure 2 shows the implicit price, a weighted average of the calculated revenue per minute of
mobile call and the market concentration index (HHI). 25 26 It can be observed a pronounced
decrease in this implicit price since the second quarter of 2014 (when the paperwork reduction
regulation of number portability was implemented, but further changes were expected), which
continued during 2015. The unlocked handset policy was announced in November in 2014, but
firms would know about the intended change since the end of 2013. Since the second quarter
of 2014, the implicit price declined from above USD 0.06 to around USD 0.04. On the other
hand, the market concentration index slightly decrease in the last quarter of 2014, stabilizes
and falls in the mid of 2015.
A decreasing HHI reflects the increasing role of Entel as the third player; the company left the
month(the median was 50 PEN) in the service.
25
I use the revenue per minute of call as a proxy of the per-minute price of the companies. I took reported
revenues for the three operators corresponding from mobile phones services (these exclude the income from
handset sales) and divided by the total voice traffic (outbound and inbound voice traffic). Following the same
criteria of OSIPTEL, then I obtained the implicit price as the weighted average of such per-minute prices per
company, and use the market share of total subscription lines as weights.
26
A previous version of this paper, showed the analysis using a per-unit price called ‘effective price’ taken
from GSMA Intelligence, however later, I found that the data for this constructed variable was not reliable. I
took then the approach used by the regulatory agency, OSIPTEL.Switching costs in Peruvian mobile industry 15
Figure 2: Peru: Implicit price per minute in USD and Herfindahl-Hirschman Index
Source: OSIPTEL; Quarterly Financial reports - Telefonica Moviles, America Movil, and Entel/Nextel
Figure 3: Implicit price per minute (USD) per company
Source: OSIPTEL; Quarterly Financial reports - Telefonica Moviles, America Movil, and Entel/Nextel
previous practice of focusing only in a small type of users (businessmen and corporations) and
expanded its service to prepaid consumers; it also expanded its presence across the country.
The impact of Bitel’s entry in the market has been small; after a year of operation, it cap-
tured 3.5% of the market and competed mostly for prepaid consumers. However, it is relevant
to notice that Bitel although it initially attracted consumers, these then switched to bigger
operators, so Bitel did not gained from net ported lines. Until mid 2015 Bitel lost rather than
gain ported lines (see figure 8 in the appendix).16 Tilsa Ore
A closer look into the calculated implicit per-minute prices of the companies (see figure 3)
shows Entel/Nextelwith the highest price until late 2012, then its price plummeted and closed
the price differential with the competitors. As noted before, since mid 2013, the acquisition of
Nextel by Entel led to an aggressive change of business focus from corporate to personal ser-
vices, which explains the onward price decline. Among the biggest players, Claro’s per minute
price tends to be consistly higher than Movistar’s – in particular after the third quarter of
2010 when the first regulation was implemented–, which may be due to its a larger share of
postpaid subscription line. Claro kept its slightly declining trend in prices since mid 2013,
and Movistar seemed to wait until 2015 to start reducing its price. shows that Claro has a
consistent higher price per minute than Movistar – in particular after the third quarter of
2010 when the first regulation was implemented– that can be explained by a larger share of
postpaid subscription line in Claro than in Movistar.
In term of voice traffic, the information show a sustain increase in minutes of call, however,
since the policy implementation, inbound traffic increase at positive and increasing growth
rates, pushing all traffic to grow at positive rates particularly after mid 2015 (see figure 11
in the appendix). Additionally, table 2 shows the increasing average monthly consumption of
mobile services between 2013 and 2015 for the surveyed population, which doubled between
2014 and 2015.27 We also can observe that the minimum consumption level increased by 2015,
which suggest an increase in demand for all consumers in the sample.28 .
Table 2: Monthly minutes of call consumed by user (PEN) (2013-2015)
Year Max Mean Min Median N obs.
2013 389.0 31.7 0.0 13.6 2081
2014 623.6 51.5 0.0 32.3 2859
2015 1195.3 102.2 3.0 55.6 2495
Total 1195.3 63.0 0.0 30.6 7435
Notes: Consumption calculated from the reported individual monthly
expenditure in mobile services and the average price calculated
from price menus of popular plans for each provider.
Source: ERESTEL Panel Sample 2013-2015
Moreover, distinguishing such information by providers, we can observe a clear increase in
the consumption of minutes of the typical consumers of the three biggest players (see table
3). A remarkable increase in minutes consumed is observed for Claro’s consumers, provider
that keeps the largest share of postapid lines and offers more data services to its consumers.29
On the other hand, a typical consumer of Bitel (the newest and smallest provider) shows a
decrease in its consumption of minutes between 2014 and 2015. being the smallest network
27
It is worth mentioning that this variable minutes consumed per individual is absent in the consumer panel
data information, and it is constructed from the monthly expenditure in mobile services and the average price
from popular plans, assuming consumers use mobile service only for voice services.
28
Individual consumption of mobile services are measured as minutes of call per consumer, obtained by
dividing the declared monthly expenditure in mobile services and the calculated average price per plan per
company
29
Let’s recall that the constructed variable "minutes" assumes all mobile expenditure corresponds to voice
minutes. The big jump on minutes of use, may be reflecting the increase of usage of Data (MB). Claro did
not only focus on providing postpaid services, but also on being the first on providing the largest 3G and 4G
network across the country.Switching costs in Peruvian mobile industry 17
Table 3: Average monthly minutes of call consumed by user by provider (PEN) (2013-2015)
Year Movistar Claro Nextel/Entel Bitel
2013 32.75 27.34 114.69
2014 56.90 37.56 158.22 71.43
2015 89.21 118.50 222.45 67.77
Notes: Consumption calculated from the reported individual monthly
expenditure in mobile services and the average price calculated
from price menus of popular plans for each provider.
Source: ERESTEL Panel Sample 2013-2015
Figure 4: Average Revenue Per User by company
Source: Financial reports - Telefonica Moviles, America Movil and Nextel/Entel
implies that most of the minutes traffic is comprised by outbound traffic, which mean higher
costs due to interconnection costs and therefore make prices less competitive.
Switching behavior seemed to strengthen competition in prices. Figure 9 (in the appendix)
shows that the accelerated decline of the weighted implicit prices also coincide with a sharp
increase of switching lines, in particular after the second mid of 2014 where a switching pa-
perwork reduction was mandated and continued after the regulatory policy was implemented
in 2015.
Given the pays-who-call pricing structure and the explicit price differentiation between on-net
and off-net calls, on-net mobile-to-mobile calls made around 88% of the total outbound call
traffic in 2013, whereas the mobile-to-mobile off-net calls only represented 8.5%.30 Likewise,
as expected, Movistar and Claro concentrate more than 90% of all the outbound traffic of
mobile calls. An important observation is that by the end of 2015, small players Entel and
Bitel that compete in the market and have smaller networks presented large share of on-net
mobile-to-mobile calls, 53% and 66% respectively, of their total outbound traffic. (see Figure
12 and 13 in the Appendix).
The two-part tariff theoretical models predict firms to set zero per-unit price and extract the
30
Since 2005, the outgoing on-net call traffic increased by 18 percentage points, while the outgoing off-net
call traffic decreased by 3.5 percentage points18 Tilsa Ore
consumer surplus by setting a fixed fee equal to it. When there are two consumer types, the
high type would have a positive consumer surplus, while the firm extracts all low-type con-
sumer surplus and provides less quantity. In this market the prepaid consumers constitutes
the low-type consumers as opposed to the postpaid consumers. Figure 4 show the monthly
average revenue per user (ARPU) of the largest three operators, according to what is de-
clared in their financial reports. Unlike Nextel/Entel that shows a clear decreasing trend of
its ARPU until mid 2013, the ARPU for the other two operators were slightly increasing until
2014; during 2013 teh ARPU was higher in the case of Claro (America Movil) compared to
Movistar(Telefonica Moviles).
In the case of Movistar, for which the revenue data were dis-aggregated by type of charge
–revenue from calls and from fixed fee– and by type of service plan (prepaid and postpaid
lines) until mid 2014, I could construct the ARPU and the average revenue per minute of call
(ARPM) for the prepaid and postpaid case. Using these variables as proxies of the prices,
as shown in figures 10a and 10b, we can see that the per-minute price for postpaid consumer
(high-type) is almost zero while it is higher for the prepaid consumer. On the other hand, the
ARPU of postpaid consumer is higher than the prepaid ones.
4.0.2 The demand: Mobile phone users
Most of the information shown in this section is based on the National Survey on the Demand of
Telecommunications Services and Characterization of the users - ERESTEL, which consists of
cross-sectional survey data collected by the Peruvian Regulatory Agency OSIPTEL since 2012.
Based on the survey data 2013 and 2015 from OSIPTEL, the share of mobile phone user
population (in age to get a mobile phone) increased from 64% to 75% between those years.
Most of the users (83% of mobile phone users) live in urban areas. Nonetheless, the mobile
phone usage increased in rural areas: in 2013 only 49% of rural population owned a mobile
phone, in 2015, that figure rose to 62%. Peruvian mobile phone users are still call-receiver
type as opposed to call-makers (the percentage of the share of call-receivers remain around
58% between 2013 and 2015. That explains the high share of prepaid phone users, 68% against
to 32% of postpaid/hybrid plans. Movistar remains as the company with largest share of the
users(59% in 2015, three percentage points below the figure reached in 2013 ).
It is worth mentioning that most of the users in 2013 made mobile-to-mobile calls to com-
municate with family and friends (see table 16 in the appendix); this shows an important
network aspect present on mobile communications. Additionally, only 21% of the total mobile
users has a smarthphone, and most of them are subscribed to a postpaid/control plan. In
2013, almost 50% of the postpaid/control users had basic service such as voice and SMS,and
42% also had internet. In 2015, postpaid/hybrid consumers would prefer internet over SMS
availability, 39% of the consumers would have plans that offer voice and internet only, and
10% would get internet only. Claro and Nextel/Entel have large share with users where their
plan package includes data service (see Table 12 in the appendix)
Prepaid plan users have lower average monthly income and are relatively younger than post-
paid/control plan users; likewise, those who own a smartphone have higher income than those
who do not (see Table 14 (in the appendix) that contains information of 2013).31 The will-
ingness to pay of postpaid users without smartphone for a phone set is higher than those
that already own one, showing the effect of newness of smartphones among those who do not
31
This information was not available for following waves, but it is relevant.You can also read