In eu leadership observatory 2021
←
→
Page content transcription
If your browser does not render page correctly, please read the page content below
REPORT

Geographical
r e p r e s e n tat i o n
in eu leadership
o b s e rvat o ry 2 0 2 1
A survey by

European Democracy Consulting

                                                   European
 eu dem o c ra cy.e u                             Democracy
                                                       Consulting
                                European Democracy Consulting i
© 2021 European Democracy Consulting

First edition published in January 2021.

European Democracy Consulting publications are independent of specific national or
political interests. They are based on objective facts and data and reflect our analysis. The
Geographical Representation in EU Leadership Observatory is pro bono work and was not
commissioned by any third-party.

The Geographical Representation in EU Leadership Observatory 2021 and its related dataset
by European Democracy Consulting are licensed under a Creative Commons Attribution-
NonCommercial-ShareAlike 4.0 International License.

You are free to copy, distribute and transmit the publication as well as to remix and adapt
it, provided it is only for non-commercial purposes, that you appropriately attribute the
publication (European Democracy Consulting, https://eudemocracy.eu/geographical-
representation-eu-leadership-observatory), and that you distribute it under an identical
licence.

For more information on this licence visit the Creative Commons website: http://
creativecommons.org/licenses/by-nc-sa/4.0/

We wish to warmly thank all the EU institutions, bodies and agencies that have cooperated
with this survey by providing information on their leadership in a timely manner. Their
support and commitment to transparency is much appreciated. Of course, we welcome
corrections for any identified error in our dataset.

European Democracy Consulting
Telephone: +33(0)7.81.03.32.87
Email: contact@eudemocracy.eu
Website: https://eudemocracy.eu/

Data: European Democracy Consulting
Design template: freepiker.com
Cover: Etienne Ansotte, EC – Audiovisual Service
Design and layout: European Democracy Consulting

       ii European Democracy Consulting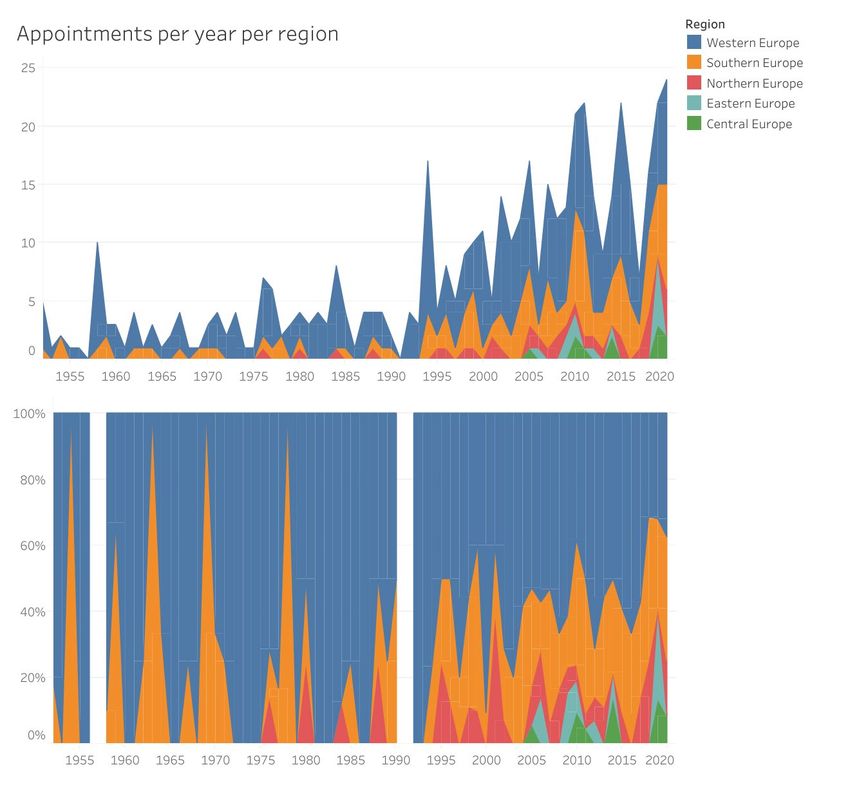
REPORT

GEOGRAPHICAL
r e p r e s e n tat i o n
in eu leadership
OBSERVATORY 2021
A survey by

European Democracy Consulting

                                                     European
 eu dem o c ra cy.e u
                                                    Democracy
                                                         Consulting
                                European Democracy Consulting iii
iv European Democracy Consulting
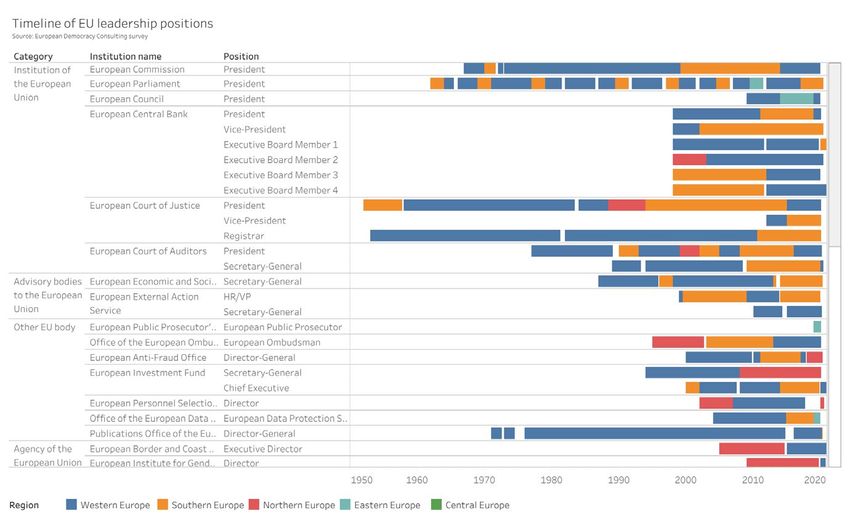
Table Of Content
Abstract.................................................................................................................................................. vi

Key Figures.........................................................................................................................................vii

Recommendations....................................................................................................................... ix

Introduction......................................................................................................................................... 1

Observing Leadership Geographical Diversity in the EU................................ 2

Considerations on Representation and Legitimacy............................................4

Presentation of the Data...........................................................................................................6

Observatory Data and Analysis..........................................................................................14

Ways Forward and Recommendations.....................................................................34

Notes......................................................................................................................................................46

About the Author.........................................................................................................................48

About European Democracy Consulting..................................................................49

                                                                                                           European Democracy Consulting v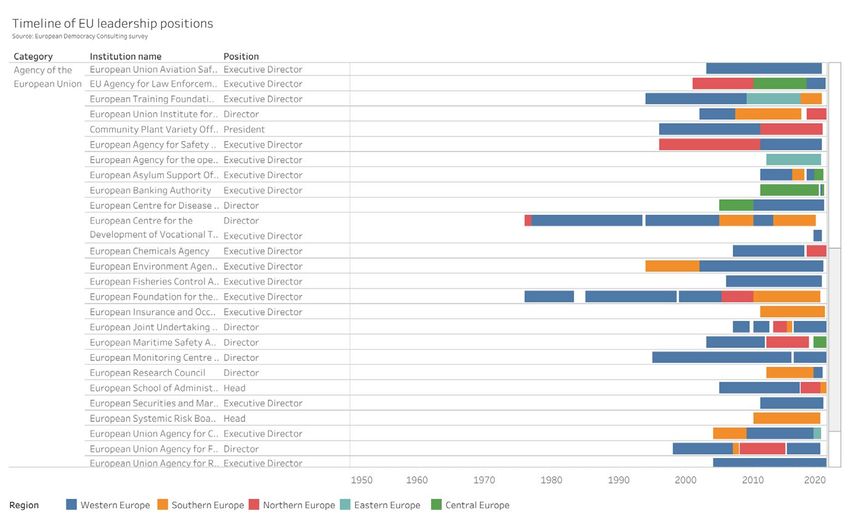
Abstract

ABSTRACT

This report analyses the level of geographical representation among the European
Union’s leadership from two complementary perspectives: the number of leadership
appointments received by each region and the cumulated mandate duration of
office-holders stemming from these regions. The regions are Western, Southern,
Northern, Eastern and Central Europe, and the positions concerned are the executive
leaders of the EU’s institutions, advisory bodies, agencies and other bodies. The survey
covers 72 EU entities, 89 positions, and close to 500 office-holders from 1952 to 2020.

Given the EU’s dual emphasis on Member State equality and population-based
proportionality, this Observatory questions regions’ equality from three different
angles: as equal between one another, based on their number of Member States, and
based on their population. After reviewing total figures and their breakdown by type
of entity, the Observatory further analyses the survey’s results by focusing on recent
years, by accounting for regions’ number of Member States and populations, and by
looking at non-founding Member States’ first years of membership.

Following a discussion of the EU’s position on addressing discrimination and ensuring
fair representation and a review of appointment processes, the Observatory concludes
with a series of actionable recommendations to improve geographical representation
in the EU’s leadership.

KEY WORDS geographical representation; regional representation; leadership; East-
West divide; European Union; European institutions.

vi European Democracy Consulting
Key figures

KEY FIGURES

Note: whether based on regional equality, on regions’ number of Member States,
or on their population, for each of the five regions considered to achieve equal
representation means for each to reach a 20% “equality mark”.

   ● Since the founding of the European Union, Western Europe has assumed a
     clear and continued dominance over the Union’s leadership positions, receiving
     over 60% of all appointments and 65% of cumulated mandate durations
     — a third of which being for EU institutions, the Union’s most prominent and
     influential positions. Even limiting our analysis to the past ten years, Western
     Europe continues to receive over 50% of all appointments, which is more in line
     with its population, but over 60% for EU institutions.

   ● Despite some of its Member States with no representatives to speak of and
     others with a slow start, Southern Europe has positioned itself as a durable
     second player, receiving around 25% of all leadership appointments and
     mandate durations, a third of which for EU institutions. Furthermore, looking at
     more recent years only increases Southern Europe’s representation. The region
     is roughly represented in line with its population, but strongly over-represented
     compared to its number of Member States or when discarding EU agencies.
     The current composition of the EU’s top jobs (three Western Europeans and two
     Southern Europeans) reflects the duopole of Western and Southern Europe over
     EU institutions, for which they have received a combined 90% of appointments
     and 95% of mandate durations since 2004.

   ● In absolute terms, Northern Europe is but a distant third, with around 7% of total
     appointments and mandate durations and barely reaching 10% in recent years.
     However, given its small number of Member States and even smaller relative
     population (around 4% of the EU’s total population), Northern Europe achieves
     fair representation in terms of Member States and far exceeds it in terms of
     population. When adjusting for population, Northern Europe receives twice
     the representation of Western Europe since 2004, and the gap seems poised
     to increase. The imbalance is even more pronounced when looking at Other EU

                                                           European Democracy Consulting vii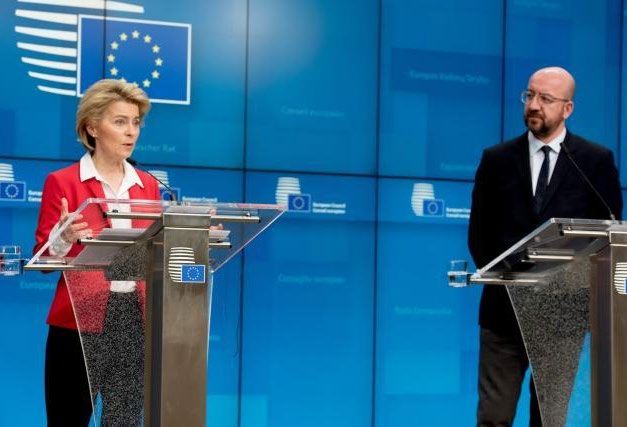
bodies, with Northern Europe reaching 50%.

    ● By contrast, Central and Eastern Europe have remained outliers from their
       accession onwards, and almost always stick to the low single digits — each
       receiving around 2.5% of all appointments and 2% of mandate durations.
       Focusing on recent years barely improves their standing, with figures increasing
       only to around 5-7% of all appointments (and even less in mandate durations)
       for periods starting in 2004 and in 2016. Figures do not improve when factoring
       in Member States and only Central Europe gains when looking at population
       sizes — nevertheless remaining far below the 20% equality mark. Finally
       their representation centres mostly on EU agencies — the least prominent
       appointments — making up over 60% and over 80% for Eastern and Central
       Europe respectively; removing agencies sees their representation crumble back
       well below 10%.

viii European Democracy Consulting
Recommendations

RECOMMENDATIONS

 1. Acknowledge the lack of proper geographical representation in the EU’s
   leadership, its likely negative impact on EU cohesion, and the European Council
   and Commission’s central role in improving geographical representation;

 2. Establish dimensions of analysis in order to assess the situation and provide
   baseline measures to understand the status quo;

 3. Establish goals and targets, including a clear long-term goal and one or more
   time-bound intermediary goals;

 4. Define clear actions, including ensuring data collection, adopting affirmative
   action policies, diversifying communication channels to reach a wider audience,
   improving the selection process and criteria to make them more inclusive, and
   facilitating the integration and retention of new recruits; and

 5. Track progress publicly through a yearly review of geographical representation.

                                                          European Democracy Consulting ix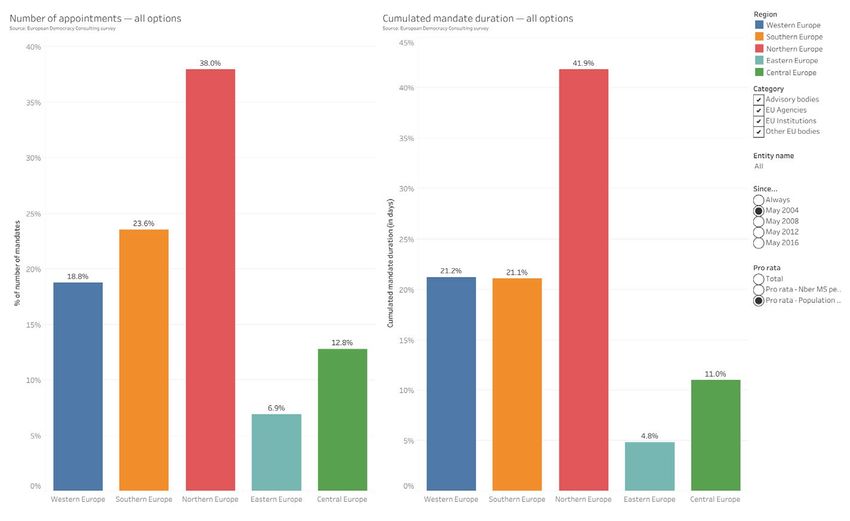
Introduction

INTRODUCTION

In November 2019, European Democracy Consulting carried out a quick review
of geographical representation in the EU’s leadership. Looking at the distribution
of EU agencies and the nationality of key office-holders, this review highlighted a
worrisome pattern of under-representation for Central and Eastern Europe, as well as
the continued predominance of Western and Southern Europe.

Today, following an extensive survey, we are proud to launch our new Geographical
Representation in EU Leadership Observatory 2021.1 This Observatory aims at
providing an in-depth understanding of the geographical composition of the EU’s
leadership through a complete and annually updated dataset of executive office-
holders. While we hope to progressively see trends evolve, the Observatory’s baseline
analysis already confirms the 2019 findings of profound discrepancies in geographical
representation to the detriment of Central and Eastern Europe.

We wish to warmly thank all the EU institutions, bodies and agencies that have
cooperated with this survey by providing information on their leadership in a timely
manner. Their support and commitment to transparency is much appreciated. Of
course, we welcome corrections for any identified error in our dataset.2

                                                                          European Democracy Consulting
                                                                                                    24 January 2021

1         This report is the PDF version of European Democracy Consulting's Geographical Representation in EU
Leadership Observatory 2021 first published online at https://eudemocracy.eu/geographical-representation-eu-
leadership-observatory. View the Observatory online to access its interactive visualisations.
2         For various reasons, the collected data is not always entirely accurate. In rare cases, surveyed entities did not
provide information or sufficiently detailed information. Our own research filled in many of these blanks but still left a
few entries unclear: sometimes no clear records were found, sometimes records were contradictory or mandate dates
overlapping, and sometimes the question of the identity of the person "acting" in a certain position complicated matters
further. When in doubt, data was rounded to the most sensible choice. These points apply notably to the Presidents of
the European Economic and Social Committee (1966 to 1990), the Executive Directors of Eurofound (before 2000), the
Directors-General of the Euratom Supply Agency (1960 to before the incumbent), and the Presidents and Directors-
General of the European University Institute (1976 to before the incumbents). At any rate, not only are these cases very
few compared to the size of the dataset, but their impact is very circumscribed, as most individuals concerned stem from
Western or Southern Europe — meaning the aggregated data per region is seldom affected.

                                                                                      European Democracy Consulting 1
Observing Leadership Geographical Diversity
OBSERVING LEADERSHIP GEOGRAPHICAL
DIVERSITY IN THE EU
European Democracy Consulting’s 2019 review of geographical representation in the
EU’s leadership, and on the related “East-West divide”, focused on two main elements:
the location of EU institutions, bodies and agencies, and the nationality of their senior
leadership.
Given the rather fixed nature of institutions’ physical location, there is little need for
an annual review:
● Institutions and advisory bodies are listed
in EU treaties, and therefore none has been
created since 2009 at the latest;
● The most recently created independent
body, the European Public Prosecutor’s
Office, set up in 2020, is to be located in
Luxembourg;
● The most recently created agency, the Laura Codruta Kövesi is the first European
Public Prosecutor. Her Office is the most
European Labour Authority — formally set recently created independent body of the EU.
Source: AGERPRES/Ionutzmovie (YouTube
up in 2019, although it still does not have a
CC-BY)
Director — was already accounted for in our
review of last year; and,
● Ahead of Brexit, the European Medicines Agency and European Banking
Authority moved their headquarters from London to Amsterdam and Paris,
respectively.1
None of these element contributes to improving the representation of the “East” part
of the EU. The imbalance in representation identified last year therefore remains and
cannot be expected to change in any meaningful way over the coming years.
1 On 10 December, Romania’s Bucharest was selected to host the upcoming European Cybersecurity
Competence Center, but this centre will not be a formal EU agency. Source: https://www.politico.eu/article/bucharest-to-
host-eus-new-cyber-research-hub
2 European Democracy ConsultingObserving Leadership Geographical Diversity
By contrast, the nationality of EU entities’ senior leadership is much more fluid: it is
periodically reviewed and can, in theory and with the proper political will, be led to
provide for better geographical representation. Our Observatory therefore tracks the
evolution of appointments and mandate durations for each of the EU’s regions.
However, while last year’s review focused solely on the EU’s top jobs (the presidents of
the Commission, Parliament, Council, and Central Bank) and a few other lead positions
for major institutions between 2004 and 2019, this Observatory is expanding its
analysis to all EU institutions, bodies and agencies, from their inception to the present
day. As a result, our Geographical Representation in EU Leadership Observatory
surveys 72 entities, 89 positions, and close to 500 office-holders from 1952 to 2020.
The goal of this Observatory is to analyse the state of play and long-term trends of
the representation of the EU’s regions among senior leadership positions. As a result
of the survey conducted, the main conclusion of this Observatory is a continued
lack of representation of citizens from Central and Eastern Europe in the EU’s
leadership.
European Democracy Consulting 3Considerations on representation CONSIDERATIONS ON REPRESENTATION AND LEGITIMACY As noted in 2019, the first and foremost criteria for the appointment of leadership positions must be and remain individual competence (whether it is called merit, expertise, experience, etc.). Of course, ideology is another important element in the case of political positions. In political systems with clearly distinguishable demographic groups, differences in levels of representation may be understandable for numerically insignificant groups, and European Democracy Consulting does not advocate for the exact representation of every sub-group of society. However, a lack of representation becomes indefensible when the group in question represents close to 40% of Member States and 20% of the EU’s total population. Despite the creation of a common European citizenship through the Maastricht Treaty in 1992, national identities remain a strong identification factor in the European Union, and citizens overwhelmingly continue to associate with their co-nationals. As a result, the continued under-representation — let alone the almost complete lack of representation — or even just a feeling of lasting under-representation of one or several Member States is not to be taken lightly, as it is sure to lead to frustration and could severely undermine support for the EU’s institutions, values and policies, and decrease adherence to political decisions.1 This impact on the general population may eventually affect the behaviour and “europeanness” of national leaders, which in turn would impact EU governance and cohesion. Rarely was this lack of geographical representation more visible than in July 2019 when, following the European elections, the European Council announced its four 1 “[Political disaffection has] to do with negative attitudes and behavioural patterns of people towards the universe, their fellow citizens, political life in general, political institutions (above all parties and party elites), and the practice of citizenship (such, as a minimum, voting). [Dis-affection] in politics also refers to the primarily emotional and passionate(rather than cognitive) condition of absence of a ‘sense of belonging’, not ‘feeling-at-home’ in the political community, marginalization, perceived lack of representation, institutionally mediated lack of capability to make one’s voice heard, deprivation of political resources, lack of horizontal and vertical trust, profound aversion to the political order, etc.” Claus Offe, Political disaffection as an outcome of institutional practices?, in Torcal, Mariano and J. R. Montero (eds.), Political Disaffection in Contemporary Democracies. Social Capital, institutions, and politics, 2006 4 European Democracy Consulting
Considerations on representation
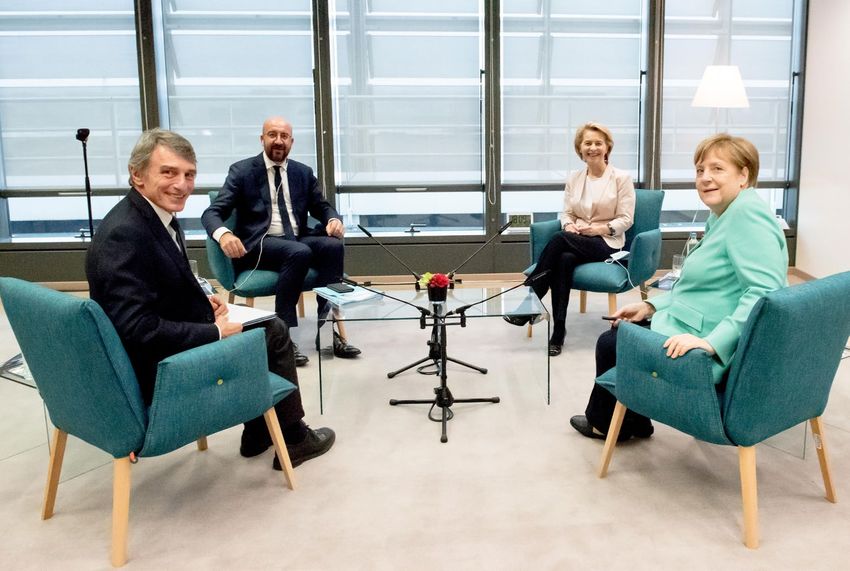
candidates for the EU’s top jobs. The
Council nominated Ursula von der
Leyen of Germany as President of the
Commission, Josep Borrell of Spain
as High Representative, and Christine
Lagarde of France as President of the
European Central Bank, and elected
Charles Michel of Belgium as President of
the European Council; three candidates Ursula von der Leyen and Charles Michel, both from
Western Europe, were appointed in 2019 to the EU’s most
from Western Europe and one from prominent positions.
Source: Etienne Ansotte, EC – Audiovisual Service
Southern Europe. The only non-Western
2
or Southern nomination was the suggestion of former Bulgarian Prime Minister
Sergei Stanishev as President of the European Parliament — the one position that
the European Council does not have the power to influence. David Sassoli of Italy
was soon elected President by the European Parliament, closing the door to all other
regions for the EU’s most prestigious and public positions.
Noting the rise of Eurosceptic feelings and illiberal policies in Central and Eastern
Europe, it is most useful and timely to have a look at the sociology of European leaders,
with a particular focus on their national citizenship, so as to address imbalances that
may further alienate certain Member States’ citizens.
2 European Council, Special meeting of the European Council (30 June, 1 and 2 July 2019) – Conclusions, https://
data.consilium.europa.eu/doc/document/ST-18-2019-INIT/en/pdf
European Democracy Consulting 5Presentation of the data PRESENTATION OF THE DATA Regions For the purpose of this geographical representation observatory, the European Union is divided into five regions. This choice is based on geographical, but also historical, cultural and economic criteria. Following the publication of the 2019 review, this division led to disagreements, mostly over the distinction between Central and Eastern Europe. As the data shows, our conclusions are largely similar for these two regions, making their precise contours less relevant. A simpler East-West division could have gathered our Western, Southern and Northern countries as “the West” and the Central and Eastern European ones as “the East”, but the adopted division is more precise. Another source of disagreement was the inclusion of the three Baltic States in Eastern Europe, instead of Northern Europe. Discussions regarding the definition of Eastern Europe are plentiful, and the Baltic States move in and out depending on the focus of the conversation. In this case, the Observatory does not focus exclusively on cultural or linguistic aspects (the majority of people in Latvia and Lithuania are Baltic, the majority in Estonia are Finnic), but also on levels of development, including GDP and HDI, where the Baltic States are much closer to the rest of Eastern Europe than to Sweden or Finland. The three countries also share a common communist past with much of Eastern and Central Europe and, from an accession perspective, joined the EU via the 2004 enlargement, alongside most of Central and Eastern Europe, and much later than the Nordic countries. For similar reasons, Austria is included in Western Europe. Institutions, bodies and agencies In order to be inclusive and thorough, the scope of our study was broadened to virtually all institutions, bodies and agencies of the EU. Our resulting classification comprises 72 entities. 6 European Democracy Consulting
Presentation of the data

Link: https://public.tableau.com/profile/eudemocracy#!/vizhome/GeographicalRepresentationinEULeadershipObservatory2021/MapofRegions
                 Given the time period considered, the United Kingdom is included as a Member of the European Union.
                                           By and large, Brexit does not impact our analysis.

 Key figures
     ● Western Europe has the largest number of Member States (8, just under 30%), Northern
       Europe the smallest (3, just over 10%).

     ● Likewise, with 260 million citizens and over 50% of the EU’s pre-Brexit population, Western
       Europe is the most populous region, while Northern Europe is the least populated, with 22
       million inhabitants and 4.2% of the EU’s total.

     ● As defined in this report, Eastern and Central Europe comprise 6 and 5 Member States
       (around 20% each), encompassing 70 and 32 million citizens (13.7 and 6.2% of the EU).

                                                                                                European Democracy Consulting 7
Presentation of the data
Institution of the European Union
European Commission European Parliament European Council
Council of the European Union European Central Bank European Court of Justice
High Authority of the European Coal and
European Court of Auditors European Atomic Energy Community
Steel Community
Advisory bodies to the European Union
European Economic and Social
Committee of the Regions European External Action Service
Committee
Other EU bodies
European Investment Bank European Investment Fund European Ombudsman’s Office
European Data Protection Supervisor’s
European Public Prosecutor’s Office European University Institute
Office
Publications Office of the European
European Personnel Selection Office European School of Administration
Union
Authority for European Political Parties European Institute of Innovation and
European Anti-Fraud Office
and European Political Foundations Technology
European Research Council
Agencies of the European Union
European Union Agency for the Body of European Regulators of Translation Centre for the Bodies of the
Cooperation of Energy Regulators Electronic Communications European Union
European Centre for the Development of European Union Agency for Law Consumers, Health, Agriculture and
Vocational Training Enforcement Training Food Executive Agency
Education, Audiovisual and Culture
Community Plant Variety Office European Union Aviation Safety Agency
Executive Agency
Executive Agency for Small and
European Asylum Support Office European Banking Authority
Medium-sized Enterprises
European Centre for Disease Prevention
European Chemicals Agency European Defence Agency
and Control
European Environment Agency European Fisheries Control Agency European Food Safety Authority
European Insurance and Occupational
European Institute for Gender Equality European Institute for Security Studies
Pensions Authority
European Monitoring Centre for Drugs
European Labour Authority European Medicines Agency
and Drug Addiction
European Union Agency for
European Maritime Safety Agency European Union Agency for Railways
Cybersecurity
European Securities and Markets
European Research Council Euratom Supply Agency
Authority
European Systemic Risk Board European Training Foundation European Union Satellite Centre
8 European Democracy ConsultingPresentation of the data
European Agency for the operational European Agency for Safety and Health European Union Intellectual Property
management of large-scale IT Systems at Work Office
European Foundation for the
European Body for the Enhancement of European Union Agency for Law
Improvement of Living and Working
Judicial Co-operation Enforcement Cooperation
Conditions
European Joint Undertaking for ITER European Union Agency for European Border and Coast Guard
and the Development of Fusion Energy Fundamental Rights Agency
Innovation and Networks Executive
European GNSS Agency Research Executive Agency
Agency
Single Resolution Board European Agency for Reconstruction
Cells greyed out indicated former entities. For clarity purposes, entities changing their name or status were grouped
together with their successor entities; see the end note for more information.
Depending on the source of information (commission website, EU Who is Who, etc.),
these entities are grouped in varying categories. For the purpose of this Observatory,
the precise differences, especially among agencies, matter little. For ease of
understanding, the Observatory relies on the following four categories:
● Institutions of the European Union: the seven entities listed in Article 13.1 of the
Treaty on European Union. This category also includes two legacy institutions,
the Commission of the European Atomic Energy Community and the High
Authority of the European Coal and Steel Community, although their impact on
the data is marginal.
● Advisory bodies to the European Union: three entities created by the European
treaties but lying outside of the main institutional framework (Articles 13.4 TEU
and 38 TEU). They have no legislative or decision-making power, and their
main role is to advise EU institutions. One of them, the Political and Security
Committee, is headed by the High Representative of the European External
Action Service; given its composite structure, the EEAS and the HR/VP are
placed in this category.
● Agencies of the European Union: the 47 EU agencies form a diverse group of
decentralised bodies established for specific tasks and endowed with their own
legal personality. Their fields of work are extremely diverse, ranging from law
enforcement, to health, transportation, etc. EURATOM agencies are included,
European Democracy Consulting 9Presentation of the data
but not Joint Undertakings (public-private partnerships set up under the Horizon
2020 programme). One of them, the European Agency for Reconstruction, was
terminated in 2008.
● Other EU bodies: finally, the EU has set up thirteen other independent bodies
for specific purposes, which are best placed together in a common category
despite their unique characteristics.
Link: https://public.tableau.com/profile/eudemocracy#!/vizhome/GeographicalRepresentationinEULeadershipObservatory2021/Entities
Positions
For most entities, the survey focuses on the executive leader; where relevant, however,
it also includes secondary positions. Overall, the survey covers 89 distinct positions.
● Institutions of the European Union: For these entities, the survey focuses on the
President, who is often a public figure, in particular for those part of the so-called “top
jobs”.1Since the Council of the European Union carries a rotating presidency, its top
1 The European Central Bank is a particular case, in that its composition is the Eurozone and not the full European
Union — leaving aside Bulgaria, Croatia, the Czech Republic, Denmark, Hungary, Poland, Romania, and Sweden. Using
10 European Democracy ConsultingPresentation of the data
leadership is not included in this study — likewise, the presidency of the European
Council is only recorded from the moment it became a fixed appointment.
The survey also covers the positions of Secretary-General for the European
Commission, European Parliament and for the Council of the European Union,
which all enjoy a wide influence on these institutions. In the case of the Central
Bank, the record includes the Vice President and the four other members of the
Executive Board. For the Court of Justice and Court of Auditors, the survey adds,
respectively, the Vice President and Registrar, and the Secretary-General.
● Advisory bodies to the European Union: For these entities, the survey covers
the positions of President (and HR/VP, as relevant) and Secretary-General.
● Agencies of the European Union: For agencies, the survey focuses on the top
executive position, almost always called Director or Executive Director. A few
agencies also have a President, but their roles vary and, for the sake of uniformity,
they are not included.
our classification, Central and Eastern European countries belonging to the Eurozone are: Estonia, Latvia, Lithuania,
Slovakia, and Slovenia.
Link: https://public.tableau.com/profile/eudemocracy#!/vizhome/GeographicalRepresentationinEULeadershipObservatory2021/Positions
European Democracy Consulting 11Presentation of the data
● Other EU bodies: For these entities, the survey mostly centres on the top
executive position, with the exceptions of the European Investment Bank,
European Investment Fund, and European University Institute. Names vary
widely depending on the entity, ranging from the classic Director, to names
reflecting the Office in question, such as European Ombudsman, European
Data Protection Supervisor, or European Public Prosecutor.
Mandates
As a result of the entities and positions reviewed, our survey has collected information
on 481 mandate-holders, ranging from 1952 to the present day: 84 are incumbents, and
396 have completed their mandates. Here are a few comments on the methodology:
● Given the importance of experience and, therefore, the high comparative
advantage of an incumbent facing re-nomination vis-a-vis other candidates,
a re-nomination is not counted as a separate appointment. This was made in
Link: https://public.tableau.com/profile/eudemocracy#!/vizhome/GeographicalRepresentationinEULeadershipObservatory2021/Mandates
12 European Democracy ConsultingPresentation of the data
order to focus on instances when a new candidate was actively chosen for a
position.
● Given that their tenure is often rather long, acting executives are counted
alongside regular ones. This was made as it informs on the nationality of
deputies and often covers long durations. In line with the previous point, where
applicable, the appointment of an Acting Director and its confirmation to full
Director status are counted together.
For each of the institutions and positions concerned, the analysis focuses on the
number of appointments and on the mandate durations (counted in number
of days), broken down by region. This allows us to account both for the number of
appointments that each country or region receives for its citizens, as well as the
amount of time each region’s citizens has occupied each office.
European Democracy Consulting 13Presentation of the data
OBSERVATORY DATA AND ANALYSIS
Timeline of office-holders
Before diving into the comparative analysis of the Observatory’s data, here is an
overview of the information collected. This timeline displays all office-holders, for
each category and entity. The name, nationality, and mandate start and end dates are
further indicated upon hovering over the timeline.
Colour-coded per region, the timeline gives a first sense of the preponderance of
office-holders from Western and Southern Europe (blue and orange), and, to a lesser
degree, from Northern Europe (red).
Link: https://public.tableau.com/profile/eudemocracy#!/vizhome/GeographicalRepresentationinEULeadershipObservatory2021/
TimelineofEUleadership
14 European Democracy ConsultingPresentation of the data
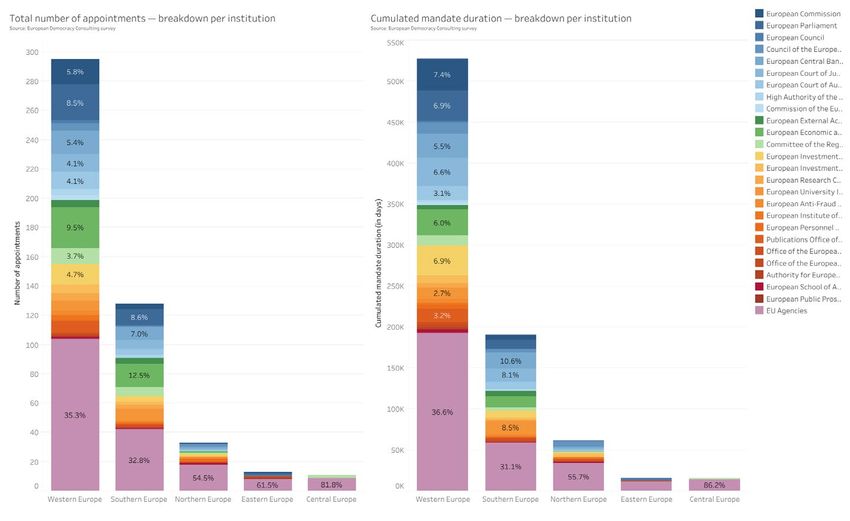
Overall figures and first trends
A first, rough analysis of the data considers all positions since the beginning of the
European project. While the exact number of days is not relevant, the graph confirms
the strong domination of Western European countries, with almost two-thirds
of cumulated mandate durations (65.0%) and number of appointments (61.5%).
Southern European countries receive around a quarter on both counts (23.5% and
26.7%, respectively), while Northern European Countries get under a tenth (7.6%
and 6.9%). Eastern and Central European countries are seldom represented,
with respectively 2.7 and 2.3% of the number of appointments and 1.9 and 2.0% of
cumulated mandate durations.
As a reminder, for this as for all following visualisations using percentages, since the
Observatory considers five regions, equal representation means that each region
would receive around 20%.
Link: https://public.tableau.com/profile/eudemocracy#!/vizhome/GeographicalRepresentationinEULeadershipObservatory2021/
TimelineofEUleadership
European Democracy Consulting 15Presentation of the data
Link: https://public.tableau.com/profile/eudemocracy#!/vizhome/GeographicalRepresentationinEULeadershipObservatory2021/Totalappointments
Key figures
● Western Europe captures the lion’s share of appointments and mandate durations, with
295 appointments (61.5%) and 65.0% of the total duration. Southern Europe is a distant
second with 128 appointments (26.7%) and 23.5% of the total duration.
● Central and Eastern Europe remain in the low single digits, with 13 and 11 appointments
(2.7 and 2.3%) and only 1.9% and 2.0% of all mandate durations.
● Without EU agencies, Central Europe has only ever received two leadership positions
— both as Secretary-General of the Committee of the Regions, including one for a Czech-
German binational.
16 European Democracy ConsultingObservatory data and analysis
Breakdown by type of entity
The breakdown of these mandates and appointments by type of entity is even more
illuminating. For instance, it shows that leadership positions of EU institutions —
gathering only 9 of the 72 entities surveyed, but the most prestigious ones — account
for around 30% of total appointments and over a third of cumulated mandate
durations for Western and Southern Europe. Other prominent positions (in the
Advisory bodies and Other bodies categories) also account for around a third of
appointments.
By contrast, slightly less prominent or publicly visible appointments, such as EU
agencies leadership positions, account for around 35% of appointments in Western
and Southern Europe, but for close to 55% in Northern Europe, 62% in Eastern Europe
and 82% in Central Europe. In terms of mandate durations, they represent 56% for
Northern Europe, but close to 75% for Eastern Europe and over 86% for Central
Europe.
Apart from EU agencies, Central Europe has only ever received two leadership
appointments, twice for the Committee of the Regions. This means that Central
European countries have not received a single leadership appointment for EU
institutions, or Other bodies — almost only for EU agencies. Of course, agencies are
essential components of the EU machinery, but their lower profile means less public
awareness and recognition, and therefore a more limited feeling of representation
than seeing a co-national holding a top job.
Of course, given the historical evolution of the EU’s membership and its successive
rounds of enlargement, it comes as no surprise that long-term members of the EU
— first and foremost, the founders and, to a lesser degree, other Southern European
countries — be more represented than newcomers.
In reality, the exponential growth of the number of EU entities, and therefore of open
positions and appointments, starting in the mid-90s, means that membership during
prior decades did not lead to a plethora of appointments for Western and Southern
Member States and does not dramatically affect the results.
European Democracy Consulting 17Observatory data and analysis
Link: https://public.tableau.com/profile/eudemocracy#!/vizhome/GeographicalRepresentationinEULeadershipObservatory2021/
Totalmandatesbyinstitution
Key figures
● Close to 33% of Western Europe’s appointments were to leadership positions of EU
institutions; this was down to 18% for Northern Europe and 0% for Central Europe.
● Advisory and other bodies made up over 38 and 32% of Southern and Western Europe’s
appointments, but only 18 and 15% for Central and Eastern Europe.
● Despite their number, EU agencies — the least prominent EU entities — represented only
35 and 33% of Western and Southern European appointments, but 62 and 82% for Eastern
and Central Europe.
18 European Democracy ConsultingObservatory data and analysis
Link: https://public.tableau.com/profile/eudemocracy#!/vizhome/GeographicalRepresentationinEULeadershipObservatory2021/EUentitiesovertime
Top: number of EU entities active, starting from their first leadership appointment. This number decreased twice: in 1968, following the 1967 merger
of the High Authority of the European Coal and Steel Community and of the Commission of the European Atomic Energy Community with the
Commission of the European Economic Community (future European Commission), and in 2009 following the 2008 termination of the European
Agency for Reconstruction (this decrease was compensated by the creation of two other agencies). It shows the strong increase in EU entities
starting in 1994.
Middle: number of appointments made to leadership positions since 1952.
Bottom: cumulated number of appointments since 1952.
Key figures
● In the first four decades of the EU, the number of active (recruiting) entities remained rather
stable, with 13 in 1958 and 19 in 1993.
● This number increased dramatically from 19 in 1993 to 82 in 2012, beforestabilising in the
past decade.
● The number of appointments per year average 2-3 until the early 90s and is now approaching
20.
● There were a cumulated 125 appointments made in the 42 years between 1952 and 1993, but
356 appointments in the 27 years between 1994 and 2020.
European Democracy Consulting 19Observatory data and analysis
Nevertheless, these appointments do impact our results and the analysis must
therefore take this into account.
Perspectives since a fixed date
Since its inception in 1958, the EU has gone through seven successive rounds of
enlargement. Two observations stick out. The first one is that not all rounds were of
the same importance. In 1981 and 2013, only a single new Member State was added to
the EU (Greece and Croatia, respectively). In 1986 and 2007, two Member States joined:
Portugal and Spain, and Romania and Bulgaria. In 1973 and 1995, three Member States
were added: Denmark, Ireland and the United Kingdom for the former, and Austria,
Finland and Sweden for the latter. By contrast, the May 2004 enlargement, often
referred to as the “big bang of EU enlargement”, added ten new Member States
to the EU — almost as many as all other rounds combined.
The second observation is that
rounds of enlargement have a
clear geographical component.
Prior to 2004, there were no
Member States from Central
and Eastern Europe, as they
are defined here. In 2004, they
made up half of the newcomers
(alongside the Baltic States,
and Malta and Cyprus). Further
enlargements in 2007 and 2013
Ten new Member States were added in the 2004 enlargement.
only concerned Central and Source: Júlio Reis/Kolja21 (CC-BY-SA-2.5)
European countries.
Given these observations, and since a major conclusion of this Geographical
Representation in EU Leadership Observatory concerns Central and Eastern Europe,
it is sensible to focus on appointments and mandate durations following May 2004.
The visualisation below narrows the dataset to appointments and mandate durations
following May 2004. In order to observe the evolution of the situation, an option is
20 European Democracy ConsultingObservatory data and analysis
provided to further narrow the dataset to periods post May 2008, 2012 and 2016. These
last options therefore display the state of play in the EU respectively four, eight and
twelve years following the big bang of 2004, when the situation of newcomers could
be thought to have evened out compared to older members.
Despite minor variations, the main conclusion is undoubtedly that the trends noted
above remain in place no matter when one starts counting. As such, Western Europe
continues to dominate, with over 56% of mandate durations since 2004 and still over
51% since 2016. New appointments remain around 50% all the way through 2012 and
only experience a relative decrease since 2016, with over 40% of new appointments for
Western Europe.
Southern Europe easily places second with stable appointments and mandate
durations, almost always hovering respectively above and just below 30%. Northern
Europe is also rather stable and experiences a slow increase, with appointments rising
from 8.5% since 2004 to 11.7% since 2016 and mandate durations almost reaching 10%
since 2016.
Eastern and Central Europe experience encouraging increases for both mandate
durations and appointments. In terms of number of appointments, Central and
Eastern Europe both move steadily up from 4-5% since 2004 to 7-8% since 2016.
Increases in mandate durations are slightly more limited, with Eastern Europe moving
from 3.5% to 4.6% and Central Europe from 3.6% to 5.1%.
Nevertheless, both regions remaining very noticeably behind and well under the
20% equality mark. Furthermore, as noted above, EU agencies are the major source of
leadership positions for Central and Eastern Europe and their figures crumble when
considering other entities. As such, Central Europe’s 4.6% share of appointments falls
down to 1.6%. And while the percentage rises slightly will focusing on recent years, it
is only due to a more limited number of overall appointments, as Central Europe has
only ever received two non-agency appointments.
Note that, while it may provide interesting and more pointed data, restricting the
dataset too much (for instance, choosing both “since 2016” and a single group of
entities) may make the percentages less statistically relevant.
European Democracy Consulting 21Observatory data and analysis
Link: https://public.tableau.com/profile/eudemocracy#!/vizhome/GeographicalRepresentationinEULeadershipObservatory2021/Since___
Key figures
● Since May 2004, Western and Southern Europe have received over 50% and over 30% of
all new appointments. Figures remain largely unchanged for appointments made since
2012.
● Northern, Eastern and Central Europe see a progressive improvement of their situation in
recent years but remain far below the 20% equality mark.
● Even for the recent appointments, Western and Southern predominance remains even
more pronounced for non-EU agency leadership positions — together receiving over 80%
of new appointments since May 2016.
22 European Democracy ConsultingObservatory data and analysis
Evolution of cumulated and yearly appointments
and durations
Another way to display this information is to look at the cumulated appointments
and mandate durations over time. This way, it is possible to see whether the gap
between the regions grows, is stable, or tends to close. Of course, when considering
percentages of total appointments or durations, figures only become meaningful
after sufficient appointments have been made, which explains the drastic variations
seen in the 50s.
The visualisation below shows a relative decrease of Western Europe’s dominant
position starting in the early 90s, with an inflexion point following 1993 matching
the increase in active EU entities. However, not only does this decrease show signs
of slowing down in recent years, but it is mostly to the benefit of Southern and
Northern Europe (which are, respectively, noticeably above and far below the 20%
equality mark). Meanwhile, the gains of Central and Eastern Europe, while existent,
remain marginal.
For the sake of completeness, the data on appointments can also be presented on
a yearly basis, instead of cumulated over time as above. However, the statistically
limited number of appointments in any given year (the maximum recorded was 24 in
2020) means that figures can jump up and down very quickly, limiting their analytical
purpose.
For instance, Eastern Europe received six appointments in 2019 or over 27% of that
year’s total. However, this impressive figure alone, clearly above the equality mark,
hides the fact that the region received no position in 2020, nor a single one in the four
years prior. Actually, Eastern Europe received in that single year almost as many as in
all other years combined.
While these cumulated and yearly perspectives confirm that Central and Eastern
Europe have been trailing since their joining the EU, it leaves a part of the puzzle
aside. As such, it still considers the EU’s various regions as “equal”, without accounting
for their respectively number of Member States or their population.
European Democracy Consulting 23Observatory data and analysis
Link: https://public.tableau.com/profile/eudemocracy#!/vizhome/GeographicalRepresentationinEULeadershipObservatory2021/
Appointmentsovertime
Key figures
● Western Europe’s long-standing domination has progressively decreased since the early
90s from close to 80% down to 60+%.
● Western Europe’s losses have so far mostly benefited Southern and Northern Europe.
● Year after year, Eastern and Central Europe remain in the low single digits.
24 European Democracy ConsultingObservatory data and analysis
Link: https://public.tableau.com/profile/eudemocracy#!/vizhome/GeographicalRepresentationinEULeadershipObservatory2021/
Appointmentsperyear
Key figures
● Yearly figures, in particular for the least-represented regions, can be very unstable.
● For instance, Eastern Europe received in 2019 alone almost as many appointments as it
received in all other years combined. However, it received no positions the following year,
nor the four years prior.
European Democracy Consulting 25Observatory data and analysis Accounting for regions’ number of states and population As indicated in the map above, the regions considered are not equal: Western Europe (pre-Brexit) comprises eight Member States, while Northern Europe only has three. Likewise, Western Europe accounts for over 50% of the EU’s total population, while Central and Northern Europe barely go beyond 6% and 4% respectively. As indicated in introduction, European Democracy Consulting does not promote the exact or strictly equal representation of every sub-groups of the European population among leadership positions — as individual qualities should prime — but instead highlights unacceptable levels of lack of representation and diversity. As a consequence, the proper size of each region must be considered and accounted for. Since the EU’s institutional architecture oscillates between equal State representation and population-based proportional representation, these two dimensions should be observed. The visualisation below provides an option to display the share of appointments and mandate durations with regions considered “equal”, or to display them in proportion to each region’s number of Member State or population. When calculating numbers of appointments and mandate durations in proportion to each region’s number of Member States, Western Europe experiences a notable drop in its representation (down by 11 points), owing the region’s relatively large number of States. It still remains far ahead of other regions in terms of representation, including around twice the representation of the second most-represented region, Southern Europe. Northern Europe, by contrast, more than doubles its representation, given its low number of States (from 6.8 to 14.8% of appointments and from 7.5 to 16.5% of mandate durations). On the other hand, Southern Europe does experience a mild increase of 2-3 points but, between 25 and 30%, stays largely the same and in a solid second place. Likewise, Central and Eastern Europe experience negligible corrections (+0.7 and +0.2 points) and by and large remain at their original levels — largely under-represented. Calculating appointments and mandate durations in proportion to regions’ 26 European Democracy Consulting
Observatory data and analysis

Link: https://public.tableau.com/profile/eudemocracy#!/vizhome/GeographicalRepresentationinEULeadershipObservatory2021/Prorata
               Note: for the above figures, populations are considered constant. While this is obviously not the case,
                                         it does not impact results in any meaningful way.

Key figures
  ● Accounting for each region’s number of Member States paints a slightly milder picture,
    with Western Europe remaining far ahead (over 50%) and Northern Europe fairing much
    better (around 15%). Eastern and Central Europe hardly change (2-3%).

  ● Accounting for each region’s population provides a strong correction: Western and
    Southern Europe remain above the equality mark (between 20 and 30%), Northern Europe
    quintuples its representation (35-40%), and Eastern and Central Europe makes gain but
    remain far below the equality mark (between 3 and 8%).

  ● Removing EU agencies erases all of Eastern and Central Europe’s gains (back to 1.5 to 3%),
    while the other three regions are all equally represented (all around 30%).

                                                                                             European Democracy Consulting 27
Observatory data and analysis population paints a very different picture. Western Europe’s lead crumbles to around 27-29% and Southern Europe loses around 3 points. Both, especially Western Europe, remain clearly above the 20% equality mark. However, both regions maintain a strong level of representation (mostly above 30%) when focusing on EU institutions and Advisory bodies. By contrast, Northern Europe skyrockets from 6.9 to 36.6% of appointments and from 7.6 to 40.3% of mandate durations, far ahead of Western and Southern Europe and at twice the equality level. Northern European fares particularly well with EU agencies and other EU bodies. Despite notable increases, especially for Central Europe (which boasts only 6% of the EU’s population and reaches over 8% of the appointments), Central and Eastern Europe remain in the single digits, very far from equal representation with other regions. Removing EU agencies, both regions return to values between 1.6 and 3.2% while the three others average around 30% each. A more precise picture Merging the previous two sections, the following visualisation provides the ability to narrow the dataset down to a limited time frame (since 2004, since 2008, etc.), and the calculation of appointments and mandate durations in proportion to regions’ number of Member States and population. The previous patterns are still on display: a limited rebalancing over time that nevertheless leaves regions far from equal representation, and a slight improvement when representation is compensated by regions’ number of Member States and, particularly, their population. However, even limiting to dataset to the past 4-5 years and factoring in populations, Central Europe remains clearly below the equality mark (with 15.3% of appointments and 13.5% of mandate durations) and Eastern Europe is far behind (with 8.4% and 5.6%, respectively). Only by restricting the data to EU agencies or by removing Other bodies does Central Europe finally skip just above the equality mark (with only ten appointments, the data for Advisory bodies alone cannot be considered statistically significant). 28 European Democracy Consulting
Observatory data and analysis

Link: https://public.tableau.com/profile/eudemocracy#!/vizhome/GeographicalRepresentationinEULeadershipObservatory2021/Alloptions
                     Note: for the above figures, the impact of Brexit is factored in Western Europe’s number of
                                   Member States and population for options starting with 2008.

Key figures
   ● Focusing on recent years and accounting for regions’ number of Member States or
     population provides a more precise picture but does not alter the previous conclusions.

   ● Accounting for regions’ number of Member States, Western Europe and, to a lesser degree,
     Southern Europe maintain their dominance over appointments. Save for the most recent
     years, Western Europe remain twice as represented as it should be for State equality.
     Eastern and Central Europe remain far behind and never reach 8%.

   ● Accounting for regions’ population, Western and Southern Europe are more in line with
     their level of representation, while Northern Europe is consistently twice as represented
     as it should be for population-based equality. Central Europe fairs slightly better but never
     reaches the 20% equality mark; Eastern Europe struggles and hardly reaches 8% at its
     best. Without EU agencies, both regions remain stuck under 10%, half as represented as
     they ought to be for population-based equality.

                                                                                             European Democracy Consulting 29
Observatory data and analysis Accounting for each regions membership duration, number of Member States and population gives a full picture of each region’s actual representation in EU leadership positions (or lack thereof) and of the trends at play. There nevertheless remains one last dimension to consider: the inequality of mandates obtained by regions’ Member States following their joining the Union. Focusing on the first years of membership It is one thing to consider the mandates obtained by a region at a given point in time, and another to put this data in the perspective of a recent accession to the EU. In order to better grasp the situation of appointments following accession, and given the differentiated dates of accession of Member States within regions, the data for this section is analysed at the Member State level. Although appointments to leadership positions should mostly be based on individual qualities, it may be understandable, to a degree, that citizens from Member States having recently joined the EU face more difficulties — either because appointments are made from within the EU’s civil service, and they therefore lack internal experience, or, in the case of external recruitments, because they may not have had the chance to make their profiles and experience known and recognised. So, it may be that every Members States goes through an initial dry spell, and that Central and European countries’ accession en masse simply prevented a compensation dynamic that the progressive accession of other regions allowed for. In other words, a few years following their accession to the EU, do Central and European Member States really fare worse than Member States of other regions following their own accession? The answer to this question seems a clear “yes”. First of all, one caveat: three Member States, all from Southern Europe, have indeed gone through a very long initial dry spell. As such, Cyprus, Portugal and Greece have not had a single appointment to a leadership position in their first sixteen years of membership. Given their now-ancient accession (in 1986 and 1981 respectively), Portugal and Greece have since made up for this with twelve appointments each, but only after 2002. Cyprus, which joined in 2004, has yet to receive its first appointment. 30 European Democracy Consulting
You can also read