In the European Union - STUDY EPRS | European Parliamentary Research Service
←
→
Page content transcription
If your browser does not render page correctly, please read the page content below
An overview of
                            shell companies
                            in the European
                                  Union

                      STUDY
EPRS | European Parliamentary Research Service
      Authors: Ivana Kiendl Krišto and Elodie Thirion
  Ex-Post Evaluation Unit and European Added Value Unit
                PE 627.129 – October 2018
An overview of shell
companies in the
European Union
Study
In April 2018, the European Parliament's Special Committee on Financial
Crimes, Tax Evasion and Tax Avoidance (TAX3) asked the European
Parliamentary Research Service (EPRS) to produce a study on shell
companies in the European Union, the main common feature of which is
the absence of real economic activity in the Member State of registration.
Prepared by the Ex-Post Evaluation Unit (EVAL) and the European Added
Value Unit (EAVA) of EPRS, this study aims to contribute to a better
understanding of the phenomenon of shell companies by seeking to
estimate the incidence of such companies, by means of a set of 'proxy'
indicators at Member State level. It also explains the main risks associated
with shell companies and current policies aimed at mitigating the risks
identified.
EPRS | European Parliamentary Research ServiceAUTHORS Ivana Kiendl Krišto, Policy Analyst, Ex-Post Evaluation Unit Elodie Thirion, Policy Analyst, European Added Value Unit This paper has been drawn up by the Ex-Post Evaluation and the European Added Value Units of the Directorate-General for Parliamentary Research Services (EPRS) of the Secretariat of the European Parliament. To contact the authors, please email: EPRS-ExPostEvaluation@ep.europa.eu or EPRS-EuropeanAddedValue@ep.europa.eu LINGUISTIC VERSIONS Original: EN Manuscript completed in October 2018. DISCLAIMER AND COPYRIGHT This document is prepared for, and addressed to, the Members and staff of the European Parliament as background material to assist them in their parliamentary work. The content of the document is the sole responsibility of its author(s) and any opinions expressed herein should not be taken to represent an official position of the Parliament. Reproduction and translation for non-commercial purposes are authorised, provided the source is acknowledged and the European Parliament is given prior notice and sent a copy. Brussels © European Union, 2018. PE: 627.129 ISBN: 978-92-846-3377-7 DOI: 10.2861/502539 CAT: QA-01-18-971-EN-N eprs@ep.europa.eu http://www.eprs.ep.parl.union.eu (intranet) http://www.europarl.europa.eu/thinktank (internet) http://epthinktank.eu (blog)
An overview of shell companies in the European Union

 Executive summary
This paper aims to contribute to a better understanding of the phenomenon of shell companies in
the European Union. It has been written in response to a request from the European Parliament's
Special Committee on Financial Crimes, Tax Evasion and Tax Avoidance (TAX3) from April 2018.
The term 'shell company' has been used widely in recent years, often interchangeably with terms
such as 'letterbox company', 'mailbox company', 'special purpose entity', 'special purpose vehicle'
and similar. However, these terms do not necessarily always refer to the same thing. A literature
review reveals that shell companies are defined differently in different contexts.
For the purpose of this paper, 'shell' companies fall broadly into one of the following three
categories: 'anonymous shell companies', 'letterbox companies', and 'special purpose entities'.
Anonymous shell companies: this type of 'shell' company provides anonymity as a key element, while
simultaneously guaranteeing control over the shell company and its resources. The ultimate
beneficial owner (UBO) remains hidden behind this company, or behind a chain of interconnecting
shell companies, often in several jurisdictions. This type of company has featured prominently in
many International Consortium of Investigative Journalists (ICIJ) reports over the past years, not
least those based on the Panama Papers leaks. Such companies are often mentioned in relation to
tax evasion, corruption, money laundering and terrorist financing.
Letterbox companies: this second type of 'shell' company, also referred to as a 'mailbox' company, is
generally a company registered in one Member State while its substantive economic activity takes
place in another Member State. These companies are sometimes used to circumvent labour laws
and social contributions in the Member State in which the substantive economic activity is taking
place. These 'letterbox' or 'mailbox' companies are generally mentioned in the context of
circumvention of the Posting of Workers Directive.
Special purpose entities (SPEs): this third type of 'shell' company refers to entities whose core business
consists of group financing or holding activities. These are entities with no or few employees, little
or no physical presence in the host economy, and whose assets and liabilities represent investments
in or from other countries. In this context, SPEs are usually mentioned with regard to their possible
use in aggressive tax planning.
The main common feature of the above three types of shell company is the absence of real
economic activity in the Member State of registration. This generally means that such companies
have no (or few) employees and/or no (or little) production and/or no (or little) physical presence in
the Member State of registration.
Reliable data on shell companies is not however available, especially in the case of the first two
categories. That is why this study approaches the problem by looking for proxies as possible
indicators of the presence and magnitude of shell companies in the EU, on the basis mainly on
macroeconomic indicators. These indicators are: the number of foreign-owned companies in a
Member State; the ratio of foreign direct investment (FDI) to a Member State's gross domestic
product (GDP); and the profitability gap between foreign and domestic companies in a Member
State.
It is worth noting that the use of shell companies can be legal. Shell companies do not necessarily
bear risks because of what they are. However, when associated with anonymity, circumvention of
the Posting of Workers Directive or treaty abuse, they can be misused and thus entail serious risks
of tax avoidance, tax evasion, money laundering and abuse of social rights. Such misuses of shell
companies impact on the economy and society as a whole, with economic, security and social
consequences.

                                                    5
EPRS | European Parliamentary Research Service
In the past few years, the European Union has adopted a whole series of policies and legislation with
the aim of addressing the above problems of tax avoidance, tax evasion, money laundering and
abuse of social rights. These are presented in Section 3 of this paper.
However, these are recent moves, and many of the regulatory provisions contained in EU legislation
have yet to produce their full effects, or even to come into force. In addition, several relevant
legislative proposals are being negotiated at the time of writing this paper (for instance on the
common consolidated corporate tax base, and on public country-by-country reporting).
It is therefore too early to assess how these recent pieces of legislation will perform on their own,
and in combination with other related pieces of legislation. In the light of the interlinkage between
the relevant legislative acts, the European Parliament could consider requesting a fitness check after
several years of implementation of these acts. A fitness check (i.e. an evaluation of a group of
interventions that have some relationship with each other) could lead to a more comprehensive
picture of whether these legislative and policy interventions have performed in comparison with
expectations.
6An overview of shell companies in the European Union
Table of contents
Executive summary ____________________________________________________________ 5
1. Introduction ________________________________________________________________ 11
1.1. Scope and methodology ____________________________________________________ 11
1.2. What is a shell company? ___________________________________________________ 11
2. Indicators of the use of shell companies in the EU __________________________________ 13
2.1. Availability of data on shell companies ________________________________________ 13
2.2. Research approach ________________________________________________________ 13
2.3. Share of foreign-owned companies in Member States ____________________________ 14
2.4. Foreign direct investment (FDI) as a share of GDP ________________________________ 15
2.5. Profitability gap between foreign and domestic companies in Member States ________ 25
2.6. Interpretation of the three indicators __________________________________________ 26
3. Risk assessment of the use of shell companies in the EU _____________________________ 27
3.1. Identified risks ____________________________________________________________ 27
3.1.1. Risks associated with anonymity ___________________________________________ 27
3.1.2. Risks associated with treaty abuse __________________________________________ 29
3.1.3. Risks associated with the circumvention of the Posting of Workers Directive________ 30
3.2. Impacts of the identified risks ________________________________________________ 31
3.3. Mitigating factors _________________________________________________________ 32
3.3.1. Main policies mitigating the use of shell companies to take undue advantage of legal
provisions _______________________________________________________________ 33
3.3.2. Policies mitigating the secrecy surrounding shell companies ____________________ 37
4. Conclusions_________________________________________________________________ 38
REFERENCES _________________________________________________________________ 39
7EPRS | European Parliamentary Research Service
Table of figures
Figure 1 – Estimated number of foreign companies __________________________________ 15
Figure 2 – Inward FDI stock in US$ million (2015) _____________________________________ 17
Figure 3 – Inward FDI stock as a percentage of GDP (2015) _____________________________ 17
Figure 4 – Inward FDI stock as a percentage of GDP (2015) for Member States with inward FDI
exceeding GDP ________________________________________________________________ 18
Figure 5 – Outward FDI stock in US$ million (2015) ___________________________________ 19
Figure 6 – Outward FDI stock as a percentage of GDP (2015) ___________________________ 19
Figure 7 – Outward FDI stock as a percentage of GDP (2015) for Member States with outward FDI
exceeding GDP ________________________________________________________________ 20
Figure 8 – Foreign direct investment positions as a percentage of GDP (2015) _____________ 21
Figure 9 – Foreign direct investment positions as a percentage of GDP (2015) for Member States with
FDI exceeding GDP_____________________________________________________________ 22
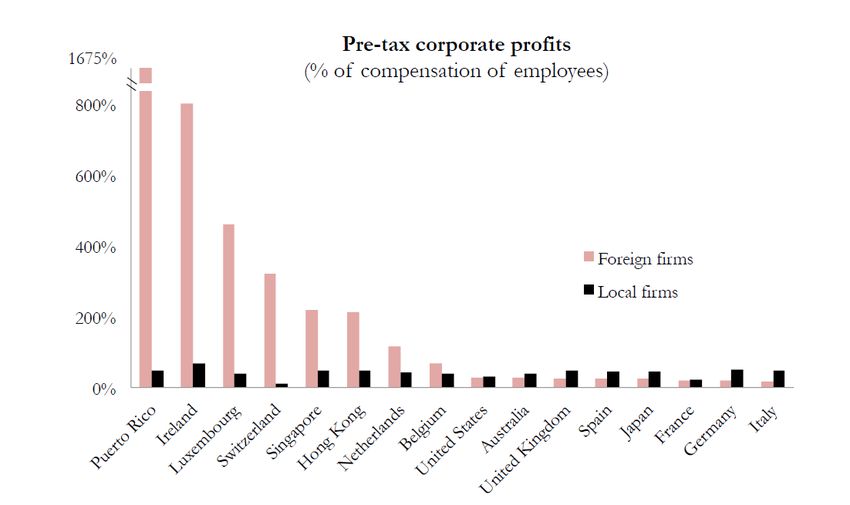
Figure 10 – Pre-tax corporate profits (% of compensation of employees) _________________ 25
Figure 11 – Pre-tax corporate profits (% of compensation of employees) _________________ 26
Table of tables
Table 1 – Impacts of the identified risks ____________________________________________ 31
Table 2 – Directives mitigating the use of shell companies to take undue advantage of legal
provisions and their transposition deadlines ________________________________________ 34
8An overview of shell companies in the European Union
List of acronyms
AMLD Anti-Money-Laundering Directive
ATAD Anti-Tax-Avoidance Directive
ATP Aggressive tax planning
BEPS Base erosion and profit shifting
CBCR Country-by-country reporting
CCCTB Common consolidated corporate tax base
CDD Customer due diligence
CFC Controlled foreign company
DAC Directive Directive on the Automatic Exchange of Information
EAVA EPRS European Added Value Unit
EPRS European Parliamentary Research Service
EVAL EPRS Ex-Post Evaluation Unit
FDI Foreign direct investment
FIU Financial intelligence unit
GDP Gross domestic product
IMF International Monetary Fund
OCTs Overseas countries and territories
OECD Organisation for Economic Cooperation and Development
PANA European Parliament's Committee of Inquiry to investigate
alleged contraventions and maladministration in the application
of Union law in relation to money laundering, tax avoidance and
tax evasion
PWD Posting of Workers Directive
SPE Special purpose entity
TAXE European Parliament's Special Committee on tax rulings and other
measures similar in nature or effect
TAX2 European Parliament's Special Committee on tax rulings and other
measures similar in nature or effect
TAX3 European Parliament's Special Committee on financial crimes, tax
evasion and tax avoidance
UBO Ultimate beneficial owner
9An overview of shell companies in the European Union
1. Introduction
1.1. Scope and methodology
This paper aims to contribute to a better understanding of the phenomenon of shell companies
in the European Union.
In the absence of reliable data, it approaches the issue through a set of 'proxy' indicators at
Member State level. These indicators are: the number of foreign-owned companies; the ratio of
foreign direct investment to gross domestic product (GDP); and profitability between foreign and
local companies.
The paper further presents the main risks associated with the shell companies and the policies
aimed at mitigating these risks. 1
Finally, the paper does not include within its scope trusts, foundations and similar legal
arrangements. As to its territorial scope, this paper does not include those shell companies
registered in EU overseas countries and territories (OCTs). 2
The paper was written by means of desk research, relying on a wide range of publicly available
institutional sources (mainly EU, OECD and IMF), as well as on academic literature, think tank
publications, published books and articles in mainstream and specialised media.
1.2. What is a shell company?
The term 'shell' has been used widely in the past years, often interchangeably with terms such as
'letterbox', 'mailbox', 'special purpose entity', 'special purpose vehicle' and similar. 3 However, these
terms do not necessarily always cover the same thing.
A review of literature reveals that shell companies are defined differently in different contexts. For
the purpose of this paper, shell companies refer to three types of shell companies in three general
contexts as described below, unless specified otherwise.
Anonymous shell companies
The first category of 'shell' company has anonymity as a key element – such a company provides
anonymity for the actual owner while simultaneously guaranteeing control over the shell company
and its resources. The ultimate beneficial owner (UBO) remains hidden behind such a company,
or behind a chain of interconnecting shell companies, often in several jurisdictions. This type of
company has featured prominently in many International Consortium of Investigative Journalists
1
This paper does not attempt to present a case study of a shell company or a legal assessment of what constitutes a
shell company.
2
These have been widely covered by the PANA committee. For details on OCTs, see for instance the EPRS study on Tax
evasion, money laundering and tax transparency in the EU overseas countries and territories, April 2017.
3
See for instance the following publications for use of different terms: OECD, Glossary of Foreign Direct Investment
Terms and Definitions, 2008; OECD, Addressing Base Erosion and Profit Shifting, 2013; European Commission, Smart
regulation - Responding to the needs of small and medium-sized enterprises, COM(2013)122; SOMO, The impact of
letterbox-type practices on labour rights and public revenue, 2016; Michael G. Findley, Daniel L. Nielson, J. C. Sharman,
Global Shell Games: Testing Money Launderers' and Terrorist Financiers' Access to Shell Companies, 2012; etc. In addition
to the terms mentioned in the main text, other terms used include: brass-plate companies, conduit entities, passive
offshore vehicles, etc.
11EPRS | European Parliamentary Research Service
(ICIJ) reports over the past few years, not least those based on the Panama Papers leaks. Such
companies appear in the context of tax evasion, corruption, money laundering and terrorist
financing.
Letterbox companies
This second type of 'shell' company is usually referred to as a 'letterbox' or 'mailbox' company. These
are generally companies registered in one Member State while the substantive economic activity
takes place in another Member State. Such companies are sometimes used to circumvent labour
laws and social contributions in the Member State in which the substantive economic activity
takes place. Such 'letterbox' or 'mailbox' companies are generally mentioned in the context of
circumvention of the Posting of Workers Directive. 4
Special purpose entities
The third type of 'shell' company, the special purpose entity (SPE), refers to entities whose core
business consists of group financing or holding activities. These are entities with no or few
employees, with little or no physical presence in the host economy, and whose assets and liabilities
represent investments in or from other countries. In this context, SPEs are usually mentioned with
regard to their possible use in aggressive tax planning. Section 2.4. provides more detail on SPEs.
The main common feature of the above three types of shell company is the absence of real
economic activity in the Member State of registration. This generally means that these companies
have no (or few) employees, and/or no (or little) production, and/or no (or little) physical presence
in the Member State of registration.
4
Directive 96/71/EC concerning the posting of workers in the framework of the provision of services as amended by
Directive 2018/957.
12An overview of shell companies in the European Union
2. Indicators of the use of shell companies in the EU
2.1. Availability of data on shell companies
The number of shell companies in the European Union and the corresponding impact of shell
companies on the EU economy cannot be determined from the data available.
With regard to the first two 'types' of shell company – anonymous shell companies and letterbox
companies – a close look at a company should be sufficient to determine whether it is indeed a shell
company or not. Is it a 'real' company or a company that exists merely on paper? Does it carry on
any substantive economic activity in the Member State of registration / incorporation / or anywhere?
Does it have employees? Is there a high financial flow through the company? Is this financial flow
commensurate with the company's economic activity and/or number of employees? This level of
detail in data is generally not present in the various publicly available databases that provide
information on EU companies. Earlier researchers 5 have noted difficulties in finding reliable
aggregate company-level data. We report on their findings in Section 2.3. below.
With regard to the third type of shell company – the SPE – detailed information on foreign direct
investment (FDI) is publicly available, while the information on FDI carried out through SPEs has
recently become available. However, it is not always available for all Member States. This is reported
in some detail in Section 2.4.
2.2. Research approach
A review of the literature, 6 including the outcomes of the work of the TAXE, TAX2 and PANA
committees 7 seem to indicate that a high number of shell companies in a country correlates with
several other characteristics, such as the high number of foreign-owned companies per inhabitant;
foreign-owned companies being much more profitable than their local counterparts; an unusually
high ratio of foreign direct investment against a country's GDP; a zero or low nominal or effective
company tax rate, and zero or low withholding tax rates (dividends, interests, royalties).
Given the general lack of data, especially in the case of the first two types of shell company, this
study takes an indirect approach that looks for proxies as possible indicators of the presence and
magnitude of shell companies in the EU, based mostly on macroeconomic indicators. These
indicators are:
the number of foreign-owned companies in Member States (Section 2.3.);
each Member State's ratio of FDI to GDP, with a particular focus on FDI held through
SPEs (Section 2.4.);
the profitability gap between foreign and domestic companies in Member States
(Section 2.5).
5
See for instance: London School of Economics (LSE), Study on the Law Applicable to Companies, prepared for the
European Commission, 2016, especially pp. 33-44.
6
Academic literature, think tank publications, published books and articles in mainstream and specialised media.
7
See for instance point 75 of the TAXE resolution (2015/2066(INI), which states inter alia that some countries present
'disproportionate economic fundamentals as compared with their size and real economic activity, especially when
looking at, for instance, the number of resident companies per inhabitant, the amount of foreign profits booked, FDI
or outgoing financial flows as compared to GDP, etc.'.
13EPRS | European Parliamentary Research Service
None of these proxy indicators can be understood as definitive evidence of the existence or
numbers or impact of shell companies in the EU. Nevertheless, taken together, and combined with
other sources (information resulting from public scrutiny, academia, think tanks, investigative
journalism, company audits, etc.), these indicators can contribute to a better understanding of the
phenomenon of shell companies in the European Union.
2.3. Share of foreign-owned companies in Member States
The first proxy indicator for the existence of shell companies in the EU is the number of foreign-
owned companies in the Member States. It is important to note that, although shell companies
are generally foreign-owned companies, needless to say that not all foreign-owned companies are
shell companies.
Nonetheless, the share of foreign-controlled companies in a country has been used as one indicator
of aggressive tax planning in general, 8 not least when an unusually high number of foreign-
controlled companies cannot be explained by other factors.
Determining the number of foreign-controlled companies is in itself not an easy task however. As
mentioned in a London School of Economics (LSE) study: 'Collecting this data proved extremely
challenging, as the information that the national registries keep is partial, and the commercial
databases were inconsistent and scarce'. 9 Along these lines, the review of relevant literature does
not appear to lead to conclusive findings.
The estimates presented below rely primarily on the 2016 study for the European Commission on
the Law Applicable to Companies (LSE, 2016). 10
The study provides an overview of difficulties encountered in the task of collecting data on the
number of companies that operate in a Member State other than the one in which they have been
incorporated or have their real seat. It also provides an overview of earlier research on the topic and
the different 'proxies' used in previous research in an effort to identify the 'nationality of a
company.' 11 The LSE study estimates the numbers of foreign companies defined as 'companies with
all managers being from one of the other member states and the majority of those managers being
shareholders'.
Using this interpretation, the study estimates that there are approximately 420 000 incorporations
of foreign businesses in the commercial registers of the EU Member States, with the UK accounting
for more than half (227 000). The remaining foreign companies are divided between Estonia
(33 500), Romania (30 000), France (27 000), Slovakia (26 600) and the remaining 23 Member States
(75 000), 12 as presented in Figure 1 below. The study does not provide estimates for all the Member
8
See for instance: Institute for Advanced Studies (IHS), Aggressive tax planning indicators, prepared for the European
Commission, DG TAXUD Taxation papers, Working paper No 71, October 2017, see the summary of country-level
indicators of aggressive tax planning, Table 31, p. 114. This is the last of the three studies on aggressive tax planning
launched by the European Commission DG TAXUD. The other two are: Study on Structures of Aggressive Tax Planning
and Indicators, Working paper No 61, and The Impact of Tax Planning on Forward-Looking Effective Tax Rates,
Working paper No 64, both available on the DG TAXUD Taxation papers webpage.
9
London School of Economics (LSE), Study on the Law Applicable to Companies, prepared for the European
Commission, 2016, p. 33.
10
LSE, Study on the Law Applicable to Companies, prepared for the European Commission, 2016. The data quoted in
this paper is 2015 data, while the other parts of the study look into wider period (e.g. time series of incorporations
from two Member States, which has a time frame of 1990 to 2015).
11
LSE, Study on the Law Applicable to Companies, prepared for the European Commission, 2016, pp. 33-38.
12
LSE, Study on the Law Applicable to Companies, prepared for the European Commission, 2016, p. 43.
14An overview of shell companies in the European Union
States, but only for the five Member States mentioned above and for the EU as a whole. The
remaining number of some 75 000 companies thus presumably represents an aggregate for the
remaining 23 Member States.
Figure 1 – Estimated number of foreign companies
76 089
United Kingdom
Estonia
26 600
Romania
227 064 France
27 029
Slovakia
23 other Member States
30 123
33 524
Source: 2016 LSE Study on the Law Applicable to Companies, Table 3, p. 43: Top target countries of businesses
incorporated in other Member States, estimates of LSE authors, based on data from Bureau van Dijk Orbis.
The findings indicate that the UK is by far the most popular target country, followed by three central
and eastern European Member States and France. The research provides possible explanations for
the popularity of some central and eastern European Member States: these include matters relating
to company law and also to favourable tax and labour laws.
The above findings have been widely quoted, especially the estimate of some 500 000 foreign
companies. 13 Again it should be emphasised in this context that the estimate of 420 000 indicates
'business incorporated in other Member States' and not the number of shell companies as such.
Finally, in this context, it is worth noting that, at the time of writing, a pilot project on letterbox
companies is ongoing in the European Commission, with the study expected in the second quarter
of 2019. 14 This study is expected to provide further details on the phenomenon of shell companies
in the EU.
2.4. Foreign direct investment (FDI) as a share of GDP
The second proxy measurement is the ratio of foreign direct investment (FDI) in an EU Member
State to the GDP of that Member State.
Foreign direct investment is a 'cross-border investment made by a resident in one economy (the
direct investor) with the objective of establishing a lasting interest in an enterprise (the direct
investment enterprise) that is resident in an economy other than that of the direct investor. The
13
Note that LSE researchers came to the final estimate of 420 000 incorporations of foreign businesses after deducting
from the original estimate of around 500 000 companies those companies of foreigners who are resident in the
Member State of the incorporation.
14
Pilot project – Letterbox companies, a study aimed at gathering comprehensive information about the purposes of
letterbox companies relevant for company law, heading 33 03 77 05.
15EPRS | European Parliamentary Research Service
motivation of the direct investor is a strategic long-term relationship with the direct investment
enterprise to ensure a significant degree of influence by the direct investor in the management of
the direct investment enterprise. The "lasting interest" is evidenced when the direct investor owns
at least 10 % of the voting power of the direct investment enterprise. Direct investment may also
allow the direct investor to gain access to the economy of the direct investment enterprise which it
might otherwise be unable to do.' 15
FDI is regarded as economically useful as it can lead to real economy activity. FDI – 'whether mergers
and acquisitions or "greenfield" 16 ventures built from the ground up – is generally thought of as
reflecting brick and mortar decisions, i.e., decisions based on long-run factors. Conventional wisdom
on capital flows holds that FDI inflows are "good" flows […].' 17
FDI 'provides a means for creating direct, stable and long-lasting links between economies. Under
the right policy environment, it can serve as an important vehicle for local enterprise development,
and it may also help improve the competitive position of both the recipient ("host") and the
investing ("home") economy.' 18
Data on foreign direct investment in Member States
The figures below present the total inward and outward FDI stocks for each EU Member State,
both in terms of the value of investments (expressed in millions of dollars) 19 and as percentage of
Member States' GDP. The figures given are based primarily on the European Commission data, in
particular on the 2017 IHS Report on Aggressive Tax Planning Indicators 20 and on the 2018 European
Semester Country Reports. 21
Inward foreign direct investment (inward FDI) refers to investment by foreigners in business
resident in a given Member State.
Outward foreign direct investment (outward FDI) refers to investment by resident entities in
affiliated business abroad.
As the below figures show, several Member States have particularly high inward FDI in absolute
values (Figure 2) and/or when FDI is presented as a percentage of Member State GDP, to account
for country-size effects (Figures 3 and 4).
15
OECD, Benchmark Definition of Foreign Direct Investment, Fourth edition, 2008, p. 17, emphasis added.
16
A company may enter a foreign market through what is referred to as greenfield direct investment, in which the direct
investor provides funds to build a new factory, distribution facility, or store, for example, to establish its presence in
the host country, from IMF, Finance and Development, What is Direct Investment?, September 2015.
17
O. Blanchard and J. Acalin, What Does Measured FDI Actually Measure?, Policy Brief 16-17, Peterson Institute for
International Economics, October 2016, p.1.
18
OECD, Benchmark Definition of Foreign Direct Investment, Fourth edition, 2008, p. 14.
19
FDI stocks are measured in US dollars and as a share of GDP. 2017 IHS study uses USD in the tables that serve as the
basis for our figures. US dollar values are thus retained here, rather than euro values.
20
IHS, Aggressive tax planning indicators, prepared for the European Commission, DG TAXUD Taxation papers, Working
paper No 71, October 2017.
21
European Commission, 2018 European Semester assessment, general document COM(2018)120 and Country Reports
SWD(2018)200-226, 7 March 2018.
160
1 000
2 000
3 000
4 000
5 000
6 000
7 000
0
500 000
1000 000
1500 000
2000 000
2500 000
3000 000
3500 000
4000 000
Luxembourg
Malta
Netherlands
Cyprus
Luxembourg
Netherlands United Kingdom
Ireland Ireland
Hungary Germany
Belgium France
Estonia Spain
Bulgaria Belgium
Austria Italy
Sweden Sweden
Czech Republic Austria
Portugal Hungary
Poland
17
Latvia
Figure 2 – Inward FDI stock in US$ million (2015)
Cyprus
Croatia
Malta
Source: 2017 IHS Report on Aggressive tax planning indicators
Source: 2017 IHS Report on Aggressive tax planning indicators.
Slovakia
Portugal
United Kingdom
Denmark
Figure 3 – Inward FDI stock as a percentage of GDP (2015)
Spain
Czech Republic
Romania
Finland
Poland
Romania
Denmark Slovakia
Lithuania Bulgaria
Finland Croatia
Slovenia Greece
France Estonia
Germany Latvia
Italy Lithuania
Greece Slovenia
An overview of shell companies in the European UnionEPRS | European Parliamentary Research Service
Figure 4 – Inward FDI stock as a percentage of GDP (2015) for Member States with inward
FDI exceeding GDP
7 000
6 000 5 767
5 000
4 000
3 000
2 000 1 732
905
1 000
535
311
161 102
0
Luxembourg Malta Cyprus Netherlands Ireland Hungary Belgium
Source: 2017 IHS Report on Aggressive tax planning indicators.
In Luxembourg, inward FDI amounts to more than 57 times GDP (FDI stocks represent 5 766 % of
Luxembourg's GDP). The percentages for countries that follow in the figure above might appear
smaller in comparison, but are still multiples of those Member States' GDP: in Malta, inward FDI
amounts to more than 17 times its GDP; in Cyprus to 9 times its GDP; in the Netherlands, to more
than 5 times its GDP, in Ireland, more than 3 times of its GDP, etc.
Looking at outward FDI stocks, i.e. what resident entities in EU Member States invest in business
abroad, similarities can be seen. Again, several Member States stand out with particularly high
outward FDI stocks in absolute values (Figure 5) and as percentage of GDP (Figures 6 and 7).
180
1 000
2 000
3 000
4 000
5 000
6 000
7 000
8 000
0
500 000
1000 000
1500 000
2000 000
2500 000
3000 000
3500 000
4000 000
4500 000
Luxembourg
Cyprus Netherlands
Malta Luxembourg
Netherlands United Kingdom
Ireland Germany
Hungary France
Belgium Ireland
Austria Spain
Sweden Italy
Belgium
Denmark
Sweden
United Kingdom
Austria
France
Denmark
Spain
Cyprus
19
Germany
Hungary
Figure 5 – Outward FDI stock in US$ million (2015)
Finland
Finland
Source: 2017 IHS Report on Aggressive tax planning indicators.
Source: 2017 IHS Report on Aggressive tax planning indicators.
Portugal
Malta
Estonia
Portugal
Italy
Figure 6 – Outward FDI stock as a percentage of GDP (2015) Greece
Greece
Poland
Slovenia Czech Republic
Croatia Estonia
Czech Republic Slovenia
Lithuania Croatia
Poland Lithuania
Latvia Slovakia
Bulgaria Bulgaria
Slovakia Latvia
Romania Romania
An overview of shell companies in the European UnionEPRS | European Parliamentary Research Service
Figure 7 – Outward FDI stock as a percentage of GDP (2015) for Member States with outward
FDI exceeding GDP
8 000
7 000 6 749
6 000
5 000
4 000
3 000
2 000
907
1 000 700 633
319
124 100
0
Luxembourg Cyprus Malta Netherlands Ireland Hungary Belgium
Source: 2017 IHS Report on Aggressive tax planning indicators.
Several Member States have particularly high outward FDI in absolute values (Figure 5) and/or when
FDI is presented as a percentage of a Member State's FDP, to account for country-size effects
(Figures 6 and 7).
Finally, Figure 8 below presents combined inward and outward FDI positions as a share of GDP,
while Figure 9 presents the same for those Member States standing out significantly from the
EU 28's inward FDI of 63.1 % and outward FDI of 72.9 %.
20An overview of shell companies in the European Union
Figure 8 – Foreign direct investment positions as a percentage of GDP (2015)
7 000
6 000
5 000
4 000
3 000
2 000
1 000
0
Latvia
Romania
Netherlands
Austria
France
Finland
Denmark
Czech Republic
Greece
Poland
Cyprus
Hungary
Croatia
Bulgaria
Ireland
Spain
Germany
Slovenia
Luxembourg
Belgium
Sweden
Portugal
Estonia
Italy
Lithuania
Slovakia
Malta
United Kingdom
Outward FDI stock in % of GDP Inward FDI stock in % of GDP
Source: 2017 IHS Report on Aggressive tax planning indicators.
21EPRS | European Parliamentary Research Service
Figure 9 – Foreign direct investment positions as a percentage of GDP (2015) for Member
States with FDI exceeding GDP
8 000
6 749
7 000
5 767
6 000
5 000
4 000
3 000
2 000 1 732
907
905
700
633
535
319
311
161
124
102
100
1 000
0
Luxembourg Cyprus Malta Netherlands Ireland Hungary Belgium
Outward FDI stock in % of GDP Inward FDI stock in % of GDP
Source: 2017 IHS Report on Aggressive tax planning indicators.
‘Several Member States stand out with particularly high values of both inward and outward FDI
stocks. In Luxembourg both inward (5 766 %) and outward (6 749 %) FDI stocks are a multiple of the
GDP. Similarly, in Malta, inward FDI amount to more than 17 times of the GDP and the FDI outward
stocks are also 7 times larger than the GDP. For Cyprus (around 900 percent of GDP), the Netherlands
(more than 500 percent of GDP) and Ireland (more than 3 times GDP), we can also observe
extraordinarily large inward and outward FDI stocks. Very large parts of this FDI stocks appear to be
held in SPEs [...]. The very high level of both inward and outward FDI stocks are [taken as] a clear
indication of the attractiveness of Cyprus, Luxembourg, Malta and the Netherlands for holding
companies, which themselves are foreign owned.' 22
Importance of special purpose entities (SPEs) in foreign direct investment
The question to ask at this point relates to discrepancies in the figures presented above: 'since FDI
is often considered to be a proxy for "brick and mortar" [genuine long-term] investments, how can
... small economies play such a significant role?' 23 Do these extraordinarily high inward FDI stocks
really represent genuine long-term investment in these Member States or are there other factors at
play that could explain them?
Statistical data on FDI and research done based on these data provide an answer: it appears that big
portions of FDI are held by special purpose entities (SPEs) and that this SPE-held portion of FDI
does not seem to represent a genuine investment in a particular country but rather financial flows
through that country. 24
22
IHS, Aggressive tax planning indicators, prepared for the European Commission, DG TAXUD Taxation papers, Working
paper No 71, October 2017, pp. 68-69.
23
J. Damgaard and T. Elkjaer, The Global FDI Network: Searching for Ultimate Investors, IMF Working Paper 17/258,
November 2017, p.4.
24
On this, see e.g. J. Damgaard and T. Elkjaer, The Global FDI Network: Searching for Ultimate Investors, IMF Working
Paper 17/258, November 2017; P. Lane and G.-M. Milesi-Ferretti, International Financial Integration in the aftermath
22An overview of shell companies in the European Union
Special purpose entities (SPEs)
In general terms, special purpose entities are entities with no or few employees, little or no physical
presence in the host economy, whose assets and liabilities represent investments in or from other
countries, and whose core business consists of group financing or holding activities. 25
Although there is no universal definition of SPEs, they do share a number of features. An
enterprise is usually considered to be a special purpose entity (SPE) if it meets the following
criteria:
1) The enterprise is a legal entity, formally registered with a national authority, and subject to
fiscal and other legal obligations of the economy in which it is resident.
2) The enterprise is ultimately controlled by a non-resident parent, directly or indirectly.
3) The enterprise has no or few employees, little or no production in the host economy and little
or no physical presence.
4) Almost all the assets and liabilities of the enterprise represent investments in or from other
countries.
5) The core business of the enterprise consists of group financing or holding activities, that is …
the channelling of funds from non-residents to other non-residents. However, in its daily
activities, managing and directing plays only a minor role. 26
The SPE-held share of FDI will not generally bring about job creation, production, and construction
of factories and transfer of technology. As explained by the OECD, 'when a country hosts SPEs and
includes them in its FDI statistics, an increasing part of transactions and positions merely
reflects the channelling of funds via this country. This can lead to a more and more significant
overstatement of FDI activity.
FDI transactions passing through an SPE generally do not have the expected immediate impact
of direct investment concerning matters such as technology transfers, access to
competitive markets, and poverty reduction in the SPE host countries.' 27
Simply put, 'Measured FDI is not entirely true FDI'. 28 Rather, measured FDI can be broadly divided
in two distinct groups: the 'genuine' investment in the host economy, and the SPE-held part of the
investment, which is not a 'genuine' investment in the host economy but rather channelling of funds
via this economy.
of the global financial crisis, IMF Working Paper 17/115, May 2017; and O. Blanchard and J. Acalin, What Does
Measured FDI Actually Measure?, Policy Brief 16-17, Peterson Institute for International Economics, October 2016.
25
OECD, Addressing Base Erosion and Profit Shifting, 2013, p.18.
26
OECD, Benchmark Definition of Foreign Direct Investment, Fourth edition, 2008, p. 102, Box 6.2, emphasis added.
27
OECD, Benchmark Definition of Foreign Direct Investment, Fourth edition, 2008, p. 102, emphasis added.
28
O. Blanchard and J. Acalin, What Does Measured FDI Actually Measure?, Policy Brief 16-17, Peterson Institute for
International Economics, October 2016, p.4.
23EPRS | European Parliamentary Research Service
A closer look at Member States' foreign direct investment through special
purpose entities
A closer look at the EU Member States is provided by the European Commission's European
Semester March 2018 country reports, which point to:
- high inward and outward FDI stocks noted in seven Member States that 'can only be partially
explained by real economic activities taking place', 29 and
- a high share of FDI stock held by SPEs in several Member States: Malta (96 % inward and 98 %
outward FDI in SPEs), Luxembourg (around 95 % of FDI in SPEs) and the Netherlands (80 % inward
and 73 % outward of FDI in SPEs). 30
What are the reasons for this channelling of funds via SPEs? There are many reasons for multinational
enterprises (MNEs) using SPEs. These include the management of large and complex operations,
enabling the internal financing of MNEs, and tax considerations appear to play the most important
role. On this, an IMF paper notes that 'Aggregate international investment positions and behaviour
are strongly marked by tax considerations. [...] jurisdictions known for attractive tax regimes
and extensive treaty networks commonly feature prominently as 'conduits' through which
investments pass.' 31 The OECD notes that, as legal devices SPEs may be relatively cheap to create
and to maintain, they may offer 'taxation, regulatory, and confidentiality benefits'. 32
Unusually high foreign direct investment as well as a high proportion of FDI held by SPEs are
included among the economic indicators that may be used to detect evidence of aggressive tax
planning (ATP) practices. 33
As stated by Commissioner for Economic and Financial Affairs Pierre Moscovici when presenting the
European Semester reports in March 2018, 'these practices [...] have the potential to undermine
fairness and the level playing field in our internal market, and they increase the burden on EU
taxpayers.' 34 In the same speech, the Commissioner stressed the issue of aggressive tax planning in
seven EU countries: Belgium, Cyprus, Hungary, Ireland, Luxembourg, Malta and the Netherlands.
Finally, when it comes to the sustainability of the foreign direct investment in the EU, foreign
direct investment through SPEs is less stable in comparison with other types of FDI 'because even
small legislative changes – domestically or abroad – can significantly shift investment patterns and
lead to capital outflows.' 35 For example, a recent IMF report on Luxembourg, while generally
positive, notes that 'The large increase in FDI by special purpose vehicles in Luxembourg in recent
years suggests that incentives to locate multinational assets in the country have been very strong.
Greater corporate tax transparency, the US tax reform and further anti-tax-avoidance measures
29
These are the same Member States as in Figure 9 above.
30
See also J. Damgaard and T. Elkjaer, The Global FDI Network: Searching for Ultimate Investors, IMF Working Paper
17/258, November 2017, Annex I on p. 23, which gives inward FDI positions broken down into SPEs and non-SPEs for
21 EU Member States and several other countries.
31
IMF, Spillovers in International Corporate Taxation, IMF Policy Paper, 9 May 2014, p. 15, emphasis in bold added.
32
OECD, Benchmark Definition of Foreign Direct Investment, Fourth edition, 2008, p. 101, emphasis in bold added.
33
European Commission, European Semester Thematic Factsheet - Curbing Aggressive Tax Planning, November 2017.
34
Opening remarks by Commissioner Moscovici on the European Semester Winter Package, 7 March 2018.
35
J. Damgaard and T. Elkjaer, The Global FDI Network: Searching for Ultimate Investors, IMF Working Paper 17/258,
November 2017, p. 9.
24An overview of shell companies in the European Union
could, however, diminish incentives to conduct business through Luxembourg and affect corporate
taxes and economic activity.' 36
2.5. Profitability gap between foreign and domestic companies in
Member States
The third proxy indicator is the profitability gap between foreign and domestic companies in
a Member State. As shown in Figures 10 and 11 below, Tørsløv, Wier and Zucman's research in 201837
shows that some countries have systematically higher profitability in the foreign-controlled sector
than in the local sector.
Figure 10 below presents pre-tax corporate profits as a percentage of compensation of employees,
with Figure 11 including the same data for EU Member States only. 38
Figure 10 – Pre-tax corporate profits (% of compensation of employees)
Source: Tørsløv, Wier and Zucman, 2018.
36
IMF Staff Country Reports – Luxembourg, April 2018, p. 17.
37
T. Tørsløv, L. Wier and G. Zucman, The Missing Profits of Nations, Working paper, July 2018.
38
Note that not all EU Member States were included in this research.
25EPRS | European Parliamentary Research Service
Figure 11 – Pre-tax corporate profits (% of compensation of employees)
Source: Tørsløv, Wier and Zucman, 2018.
Tørsløv, Wier and Zucman explain this profitability gap through a combination of multinationals
booking intangible assets (patents, logos, algorithms, etc.) in low-tax affiliates and intra-group
transfer prices. They find 'a clear trace in global macro data of movements of profits within
divisions of multinational groups, away from high-tax affiliates and towards low-tax affiliates.'39
2.6. Interpretation of the three indicators
Having examined three proxy indicators, it should be noted that none of the indicators taken alone
can be understood as definitive evidence of the existence or numbers or impact of shell companies
in the EU.
However, taken together, and interpreted in conjunction with other sources of information
(information resulting from public scrutiny, academia, think tanks, investigative journalism,
company audits, etc.), the three indicators do point to the existence of shell companies within the
EU, on a magnitude that seems to differ in each EU Member State.
These shell companies could pose risks to the EU, as presented in the following section of this paper.
39
T. Tørsløv, L. Wier and G. Zucman, The Missing Profits of Nations, Working paper, July 2018, p. 19.
26An overview of shell companies in the European Union
3. Risk assessment of the use of shell companies in the EU
The use of shell companies can be legal and have legitimate purposes. For example, they can
be used to hold personal or family assets to facilitate inheritance. 40 When buying property or land,
well-known brands often hide their identity behind shell companies so that they can be protected
from high price increases by the owner. 41 Shell companies can serve legitimate business purposes
and are sometimes needed to facilitate corporate mergers, joint ventures and estate planning. 42
While they can have a number of legitimate usages, shell companies can also be used as a vehicle
for tax avoidance, tax evasion, and money laundering. 43 Shell companies do not necessarily carry
risks because of what they are, but used in combination with other instruments such as international
tax agreements or poor transparency requirements, they can increase and facilitate the
concealment of the origin of assets, the hiding of beneficial owners or fraud workers ‘rights. All of
these elements, together or apart, bear serious risks of money laundering, tax evasion, tax avoidance
and abuse of labour and social laws (see Section 3.1). These illegal uses bear risks to the economy
and the society as a whole, having economic, political and social impacts (see Section 3.2). In recent
years however, the EU, often based on OECD recommendations, has taken some measures to
mitigate these risks (see Section 3.3).
3.1. Identified risks
Shell companies do not represent threats because of what they are, but used in combination with
other instruments, such as international tax treaties or low transparency requirements, they may
involve risks. According to the relevant literature, the main risk is the secrecy surrounding shell
companies, which allows them to be a vehicle for tax avoidance, tax evasion and money laundering.
The possibility to set up and use shell companies to access the preferential treatment offered by
international tax treaties or international investment treaties is also a risk. Finally, shell companies
in the EU are sometimes set up to circumvent the obligations of the posting of workers directive.
3.1.1. Risks associated with anonymity
Anonymity is a key element that makes the use of shell companies attractive. An important
function that a shell company can offer to its owner is to provide anonymity while simultaneously
guaranteeing control over the shell company and its resources. 44 These anonymous shell companies
are corporate entities that have disguised their ownership in order to operate without scrutiny from
law enforcement or the public. They are used to conceal the identity of their true owner – the person
who ultimately controls or profits from the company. These people are also known as the 'beneficial
owners'.
40
E. van der Does de Willebois, Emily M. Halter, Robert A. Harrison, J. Won Park and J.C. Sharman, 'The Puppet Masters –
How the corrupt use legal structures to hide stolen assets and what to do about it', International Bank for
Reconstruction and Development / World Bank, 2011.
41
Michael G. Findley, Daniel L. Nielson and J. C. Sharman, Global Shell Games: Experiments in Transnational Relations,
Crime, and Terrorism, 2014, p.33.
42
M. Aydogdu, C. Shekhar and V. Torbey, 'Shell companies as IPO alternatives: an analysis of trading activity around
reverse mergers', Applied Financial Economics, 17:16, pp. 1335-1347.
43
The misuse of corporate vehicles, including trust and company service providers, FAFT GAFI, 2006.
44
FATF - Edgmont group, Concealment of Beneficial Ownership, FATF, 2018.
27EPRS | European Parliamentary Research Service
The 4th Anti-Money-Laundering Directive (AMLD) 45 defines the 'beneficial owner' as 'any natural
person(s) who ultimately owns or controls the customer and/or the natural person(s) on whose
behalf a transaction or activity is being conducted and includes at least:
(a) in the case of corporate entities:
(i) the natural person(s) who ultimately owns or controls a legal entity through direct or
indirect ownership of a sufficient percentage of the shares or voting rights or ownership
interest in that entity, including through bearer shareholdings, or through control via other
means, other than a company listed on a regulated market that is subject to disclosure
requirements consistent with Union law or subject to equivalent international standards
which ensure adequate transparency of ownership information.
A shareholding of 25 % plus one share or an ownership interest of more than 25 % in the
customer held by a natural person shall be an indication of direct ownership. A shareholding
of 25 % plus one share or an ownership interest of more than 25 % in the customer held by
a corporate entity, which is under the control of a natural person(s), or by multiple corporate
entities, which are under the control of the same natural person(s), shall be an indication of
indirect ownership. This applies without prejudice to the right of member states to decide
that a lower percentage may be an indication of ownership or control. Control through other
means may be determined, inter alia, in accordance with the criteria in Article 22(1) to (5) of
Directive 2013/34/EU of the European Parliament and of the Council (29);
(ii) if, after having exhausted all possible means and provided there are no grounds for
suspicion, no person under point (i) is identified, or if there is any doubt that the person(s)
identified are the beneficial owner(s), the natural person(s) who hold the position of senior
managing official(s), the obliged entities shall keep records of the actions taken in order to
identify the beneficial ownership under point (i) and this point; [...].'
Shell companies are a threat when they cannot be traced back to the beneficial owner. These
anonymous shell companies can then become a tool for money launderers to hide their business
and assets from the authorities. They are used by criminals because they screen or veil illicit
conduct. 46
The potential for anonymity is a critical factor in facilitating the misuse of shell companies. 47 It
increases the possibility of them being used for various types of crime, including money
laundering, 48 bribery and corruption, hiding assets from creditors, different types of illegal fiscal
45
Directive (EU) 2015/849 of the European Parliament and of the Council of 20 May 2015 on the prevention of the use
of the financial system for the purposes of money laundering or terrorist financing, amending Regulation (EU) No
648/2012 of the European Parliament and of the Council, and repealing Directive 2005/60/EC of the European
Parliament and of the Council and Commission Directive 2006/70/EC (Text with EEA relevance), in its Article 3(6).
46
There are many instances of shell companies being used in criminal schemes, see: Michael G. Findley, Daniel L. Nielson
and J. C. Sharman, Global Shell Games: Testing Money Launderers' and Terrorist Financiers' Access to Shell Companies,
2012.
'The Iranian government used shell companies from Germany, Malta, and Cyprus to evade international sanctions by
concealing the ownership of its oil tankers. [...] The British arms firm BAE Systems pleaded guilty in 2010 in connection
with case which saw it pass secret funds through a series of middle-men and shell companies incorporated in Britain
and the British Virgin Islands to key Saudi officials responsible for approving a massive arms purchase from BAE. [...]
Corrupt Russian tax officials used shell companies from Cyprus and the British Virgin Islands to steal hundreds of
millions of dollars in a case that led to the imprisonment and death of Russian whistle-blower Sergei Magnitsky.'
47
The Misuse of Corporate Vehicles, Including Trust and Company Service Providers, FATF, 2006.
48
Financial Crimes Enforcement Network, Potential Money Laundering Risks Related to Shell Companies, 2006.
28An overview of shell companies in the European Union
practices, and self-dealing. 49 They can be used to hide illegal businesses or to facilitate illegal activity,
such as tax evasion or concealing the true ownership of real estate.
In order to test how easy it was to establish anonymous shell companies, a 2010 study by Sharman
audited the possibility of setting up anonymous shell companies without proof of identity, and then
establishing corporate bank accounts for these companies. 50 For that Sharman solicited offers of
anonymous shell companies from 54 different corporate service providers in 22 different countries.
The transactions that could have processed through such shell companies would have become
effectively untraceable, thus very useful for those looking to hide criminal profits, pay or receive
bribes, finance terrorists, or escape tax obligations. The results indicated that small island offshore
centres may have standards for corporate transparency and disclosure that are higher than major
OECD economies. However, this study was conducted before the setting up of most of the EU
measures mitigating the risks linked to anonymity of shell companies (see Section 3.1.1.). A similar
study conducted after the full implementation of the new standards could serve as a case study for
the ex-post evaluation of the measures mentioned in Section 3.3.
In summary, the risks associated with anonymity pertain primarily to the first category of shell
company identified in this study – anonymous shell companies.
The next section presents the risks associated with treaty abuse. These risks are primarily
associated with the third category of shell company identified in this paper – special purpose
entities.
3.1.2. Risks associated with treaty abuse
In addition, shell companies are used to abuse international tax treaties and international
investment treaties.
The lack of harmonisation of corporate and personal income taxes worldwide allows for treaty
abuse. In the EU, Member States are free to decide on their tax systems provided they comply with
EU rules. 51 Each Member State sets its tax base and rate. They regulate independently which type of
companies are tax resident in that state, and to which extent non-tax resident companies are subject
to tax on income that they derive from that state. As a result the same income may be taxed in two
or more states, giving rise to the problem of international double (or multiple) taxation. To limit
multiple taxation of the same items of income, states enter into bilateral tax treaties to allocate
between themselves their powers of taxation. International tax treaties should minimise the risk of
double taxation by allocating taxing jurisdiction between the treaty partners. However, while they
are used by some enterprises to eliminate double taxation, others also take advantage of them to
avoid taxation, by establishing shell companies in countries with attractive treaties (treaty
shopping), 52 resulting sometimes in double (or multiple) non taxation. 53
49
The Misuse of Corporate Vehicles, Including Trust and Company Service Providers, FATF, 2006, and OECD: Behind the
Corporate Veil: Using Corporate Entities for Illicit Purposes, 2001.
50
J.C. Sharman, 'Shopping for Anonymous Shell Companies: An Audit Study of Anonymity and Crime in the International
Financial System', Journal of Economic Perspectives, 24 (4), 2010, pp. 127-40.
51
C. Remeur, Tax policy in the EU - Issues and challenges, EPRS, European Parliament, 2015.
52
The OECD glossary defines treaty shopping as 'An analysis of tax treaty provisions to structure an international
transaction or operation so as to take advantage of a particular tax treaty'. The term is normally applied to a situation
where a person not resident of either of the treaty countries establishes an entity in one of the treaty countries in
order to obtain treaty benefits'.
53
See J. Rogers-Glabush, International Tax Glossary, 7th Edition, 2015; and A. Lejour, The Foreign Investment Effects of
Tax Treaties, Oxford University Centre for Business Taxation, 2014.
29You can also read